
The Daily Shot: 20-Oct-22
• The United States
• Canada
• The United Kingdom
• The Eurozone
• Europe
• Asia – Pacific
• China
• Emerging Markets
• Cryptocurrency
• Energy
• Equities
• Rates
• Global Developments
• Food for Thought
The United States
1. The Fed’s Beige Book continues to signal tight labor markets despite some signs of easing.
Wage growth remained widespread, though an easing was reported in several Districts. Some businesses said elevated inflation and higher costs of living were pushing wages up, coupled with upward pressure from labor market tightness. Contacts expect wage growth to continue as higher pay remains essential for retaining talent in the current environment.
The massive gap between wage growth for job stayers and job switchers illustrates the persistent bid for labor. It may take a recession to ease labor market imbalances.
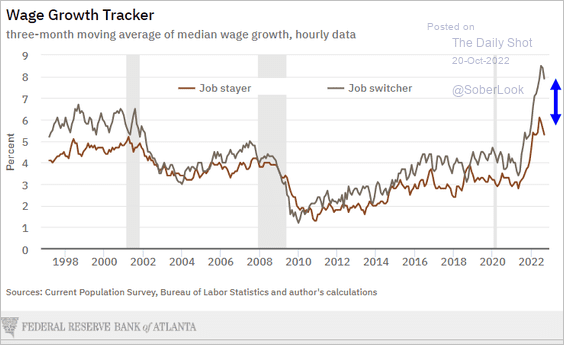 Source: @AtlantaFed
The Beige Book’s “weak” or “slow” word count points to a sharp slowdown ahead.
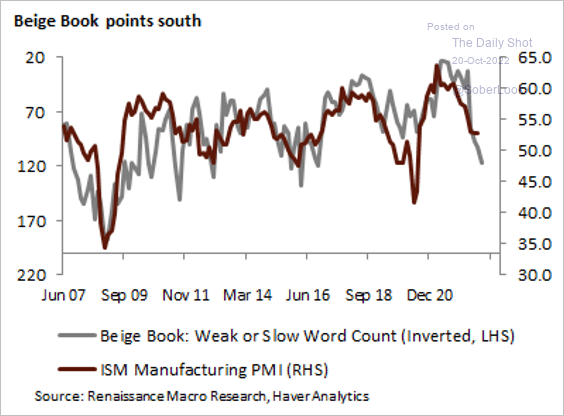 Source: @RenMacLLC
——————–
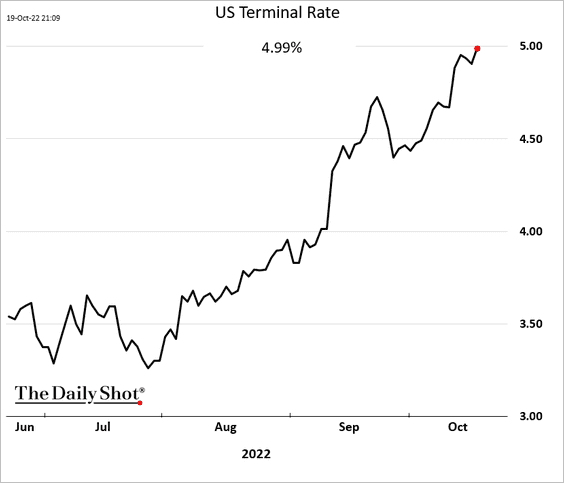
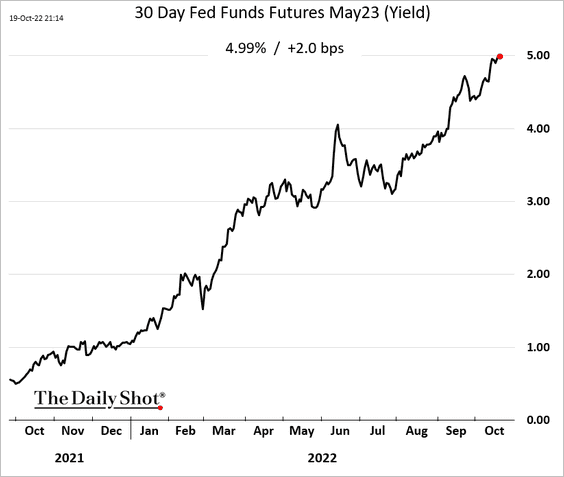
2. The market now sees the terminal rate at 5%.
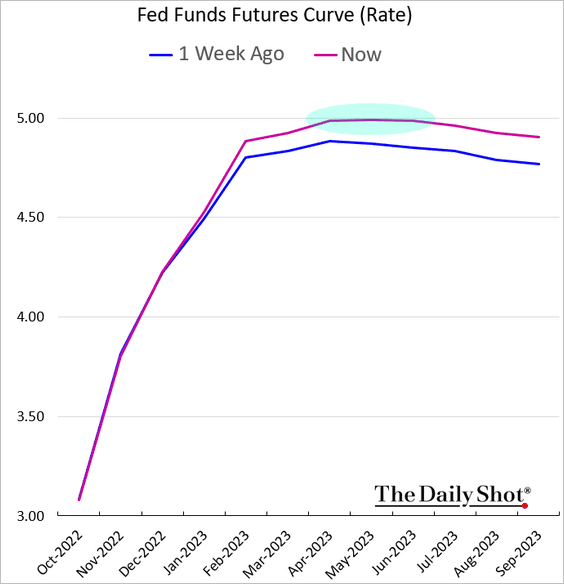
• Here is the May fed funds futures contract.
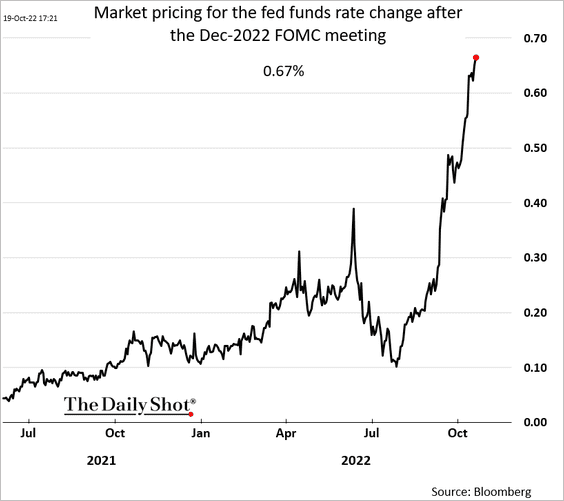
• The market increasingly sees a 75 bps rate hike in December.
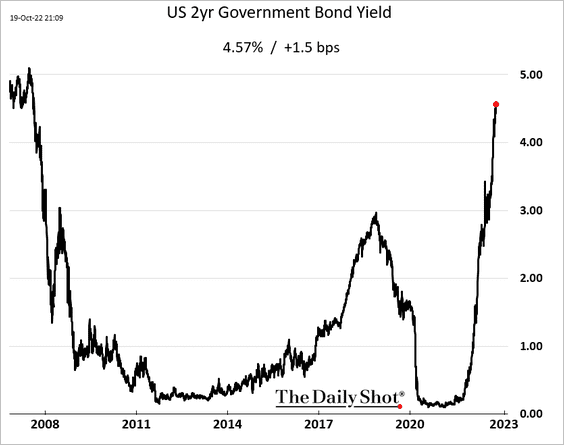
• The 2-year Treasury yield keeps climbing.
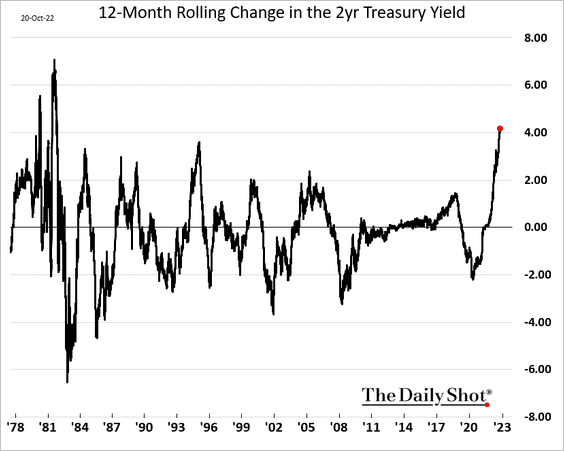
We haven’t seen such a massive 12-month move in the 2yr yield since the early 1980s.
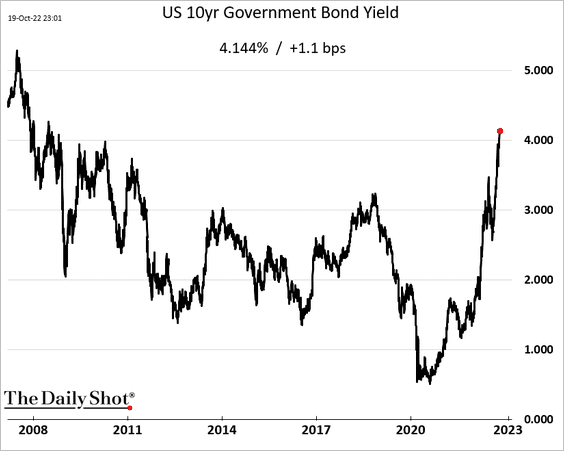
• The 10yr yield keeps rising as well.
——————–
2. Strong capacity utilization suggests that real rates should be higher.
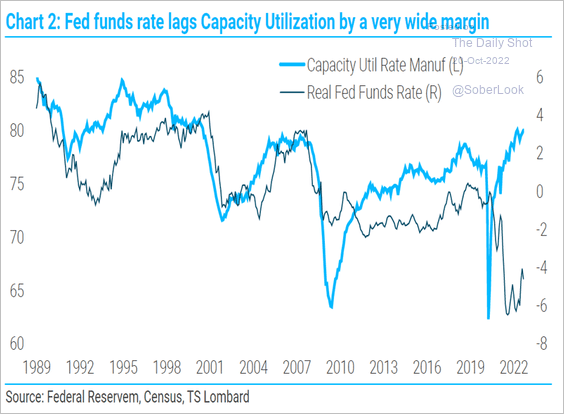 Source: TS Lombard
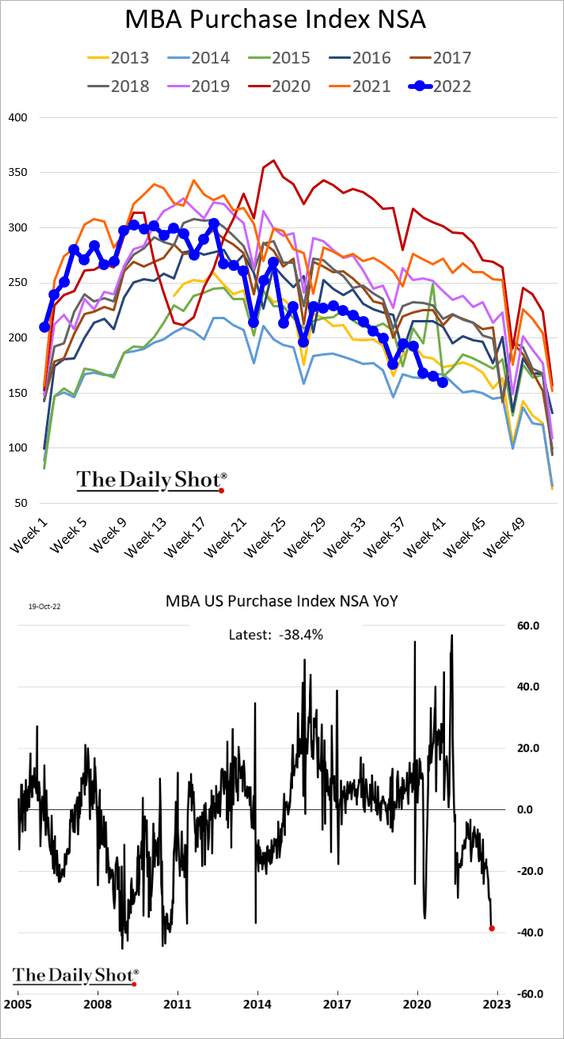
3. Mortgage applications are at multi-year lows.
Here is the rate lock count.
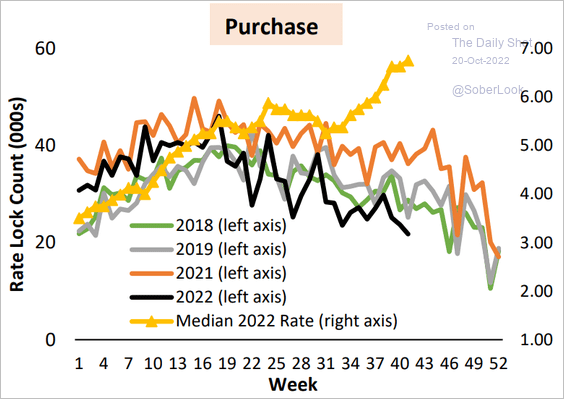 Source: AEI Center on Housing Markets and Finance
——————–
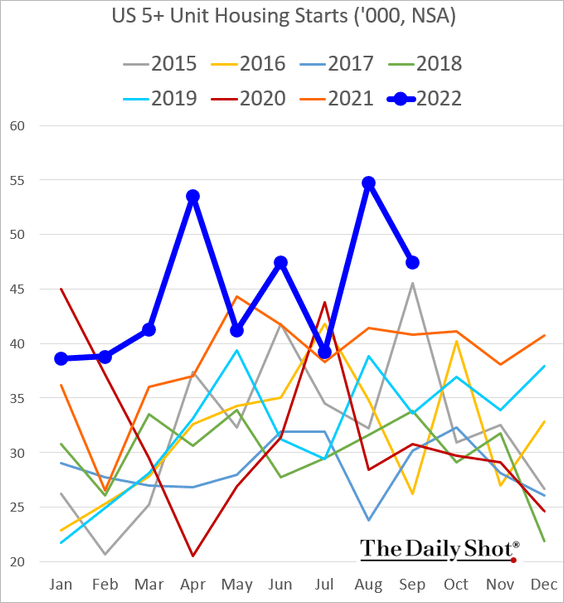
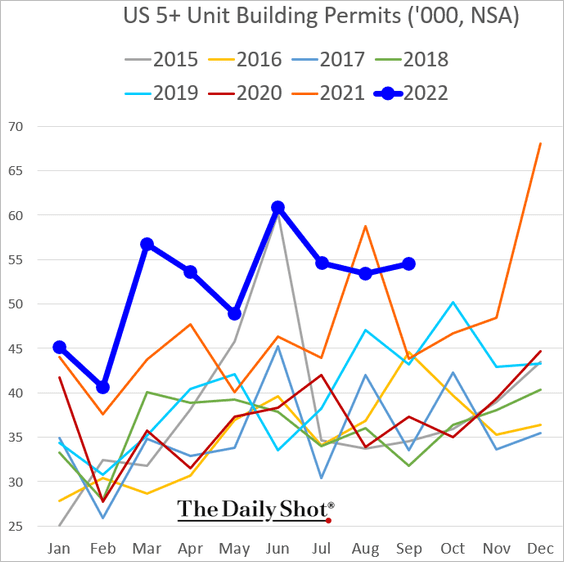
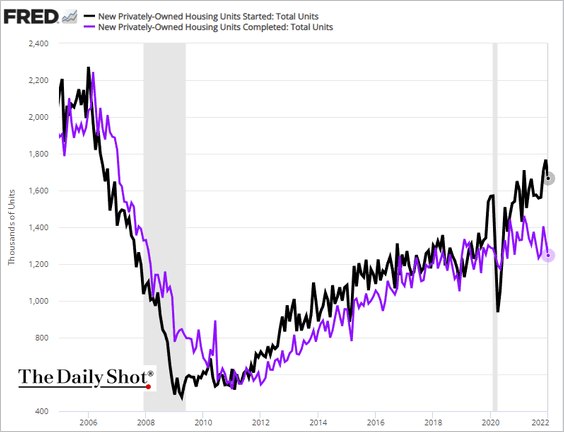
4. Housing starts and permits were softer in September, but they are not collapsing.
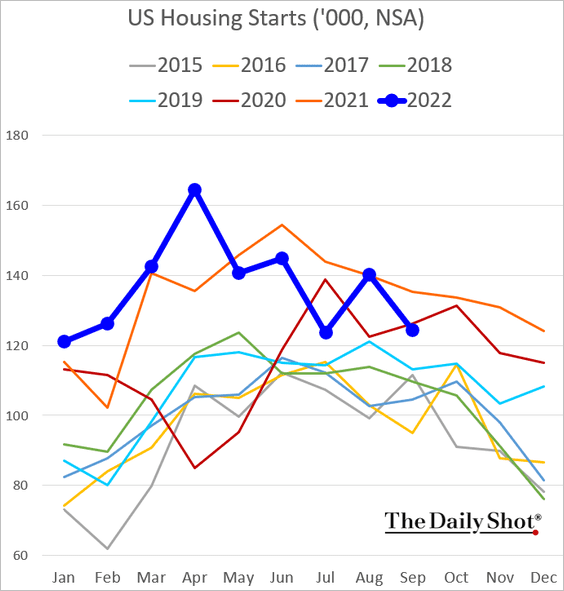
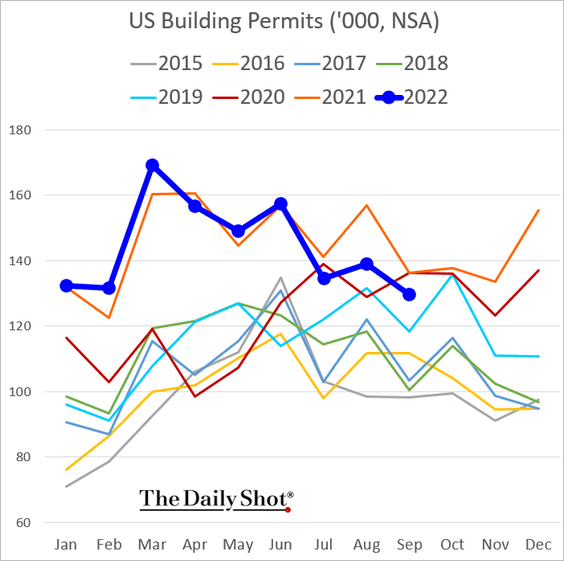
• The weakness has been in single-family housing.
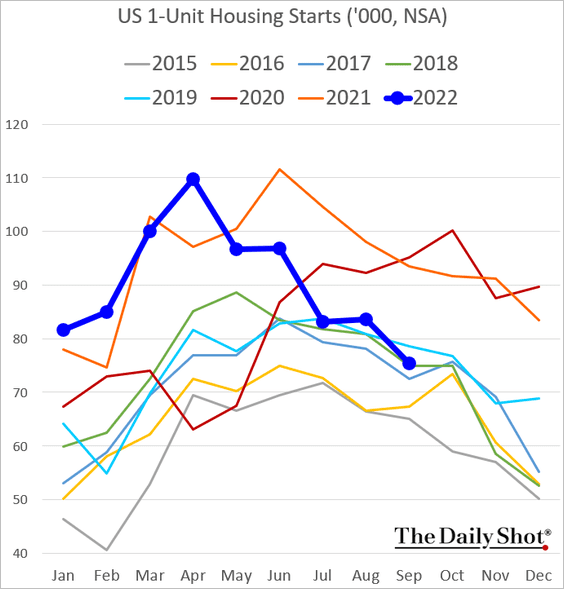
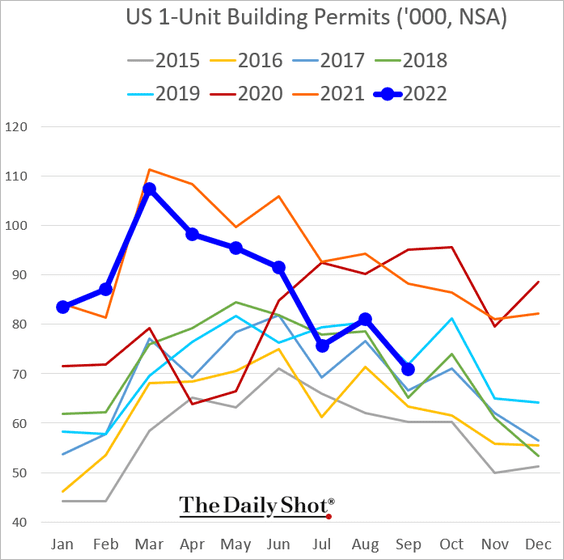
• Multi-family construction activity remains at a multi-year highs.
• But leading indicators point to severe weakness in residential construction going forward.
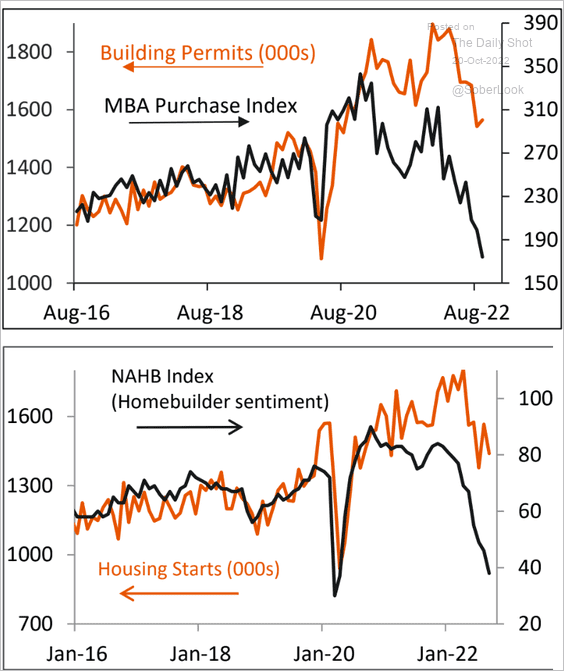 Source: Piper Sandler
• There are a lot of homes under construction, especially multi-family projects.
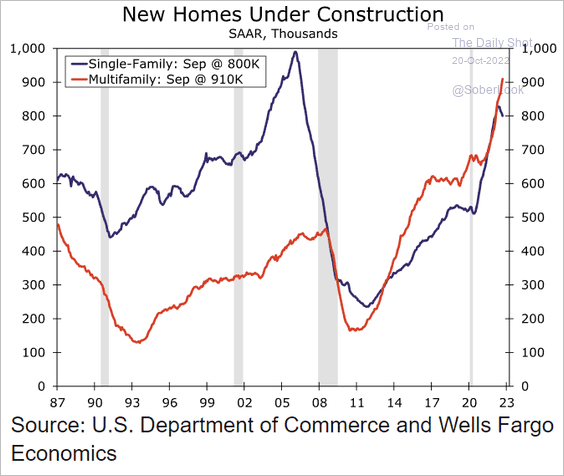 Source: Wells Fargo Securities
• Housing starts and completions continue to diverge.
——————–
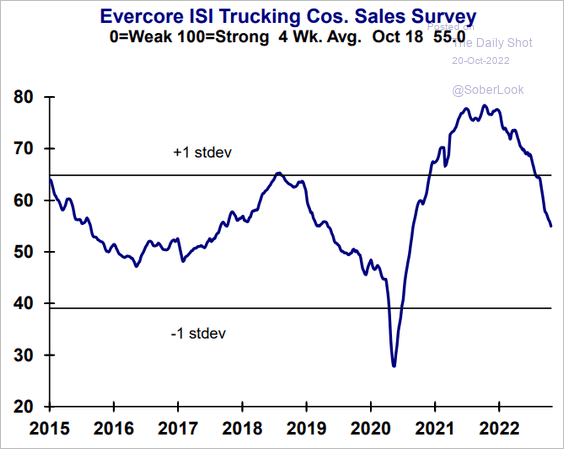
5. The Evercore ISI trucking company sales index continues to ease.
 Source: Evercore ISI Research
Back to Index
Canada
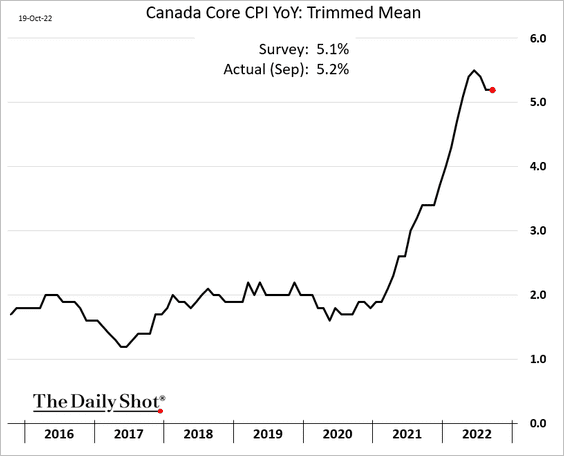
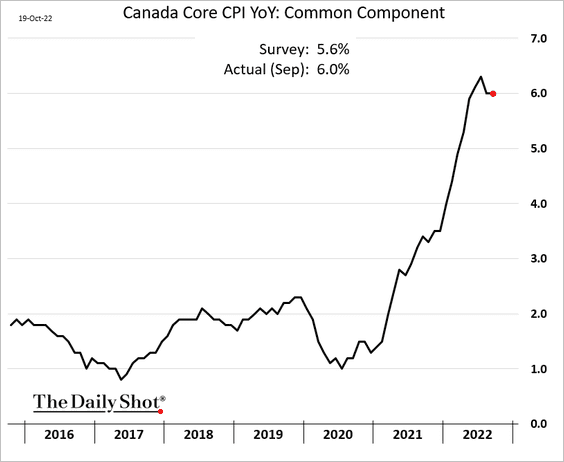
1. The CPI edged lower but was above forecasts. Inflation is still running hot in Canada.
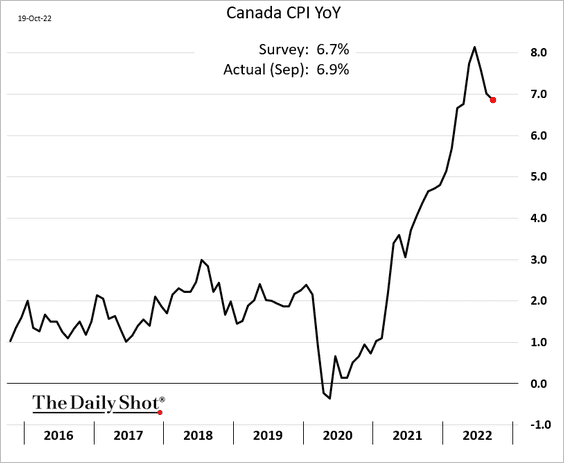
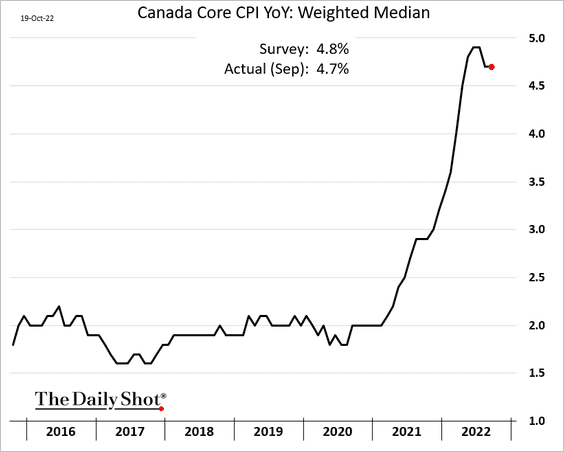
Below are the core CPI measures.
– Median:
– Trimmed mean:
– Common Component:
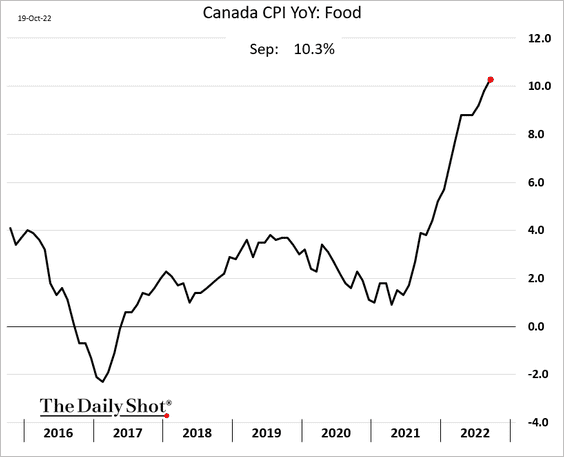
• Food inflation continues to surge.
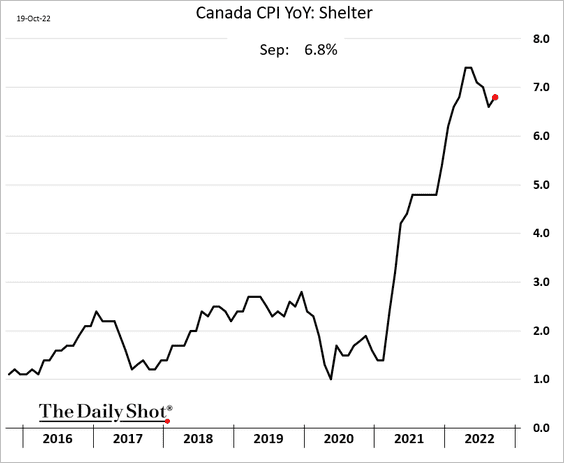
• Shelter inflation accelerated last month.
——————–
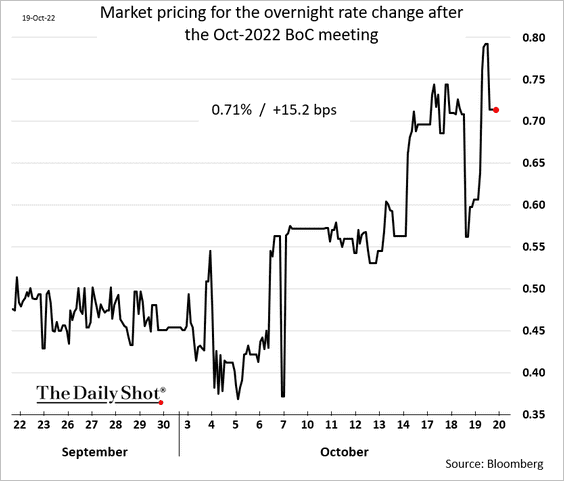
2. A 75 bps rate hike looks like a certainty this month.
 Source: Reuters Read full article
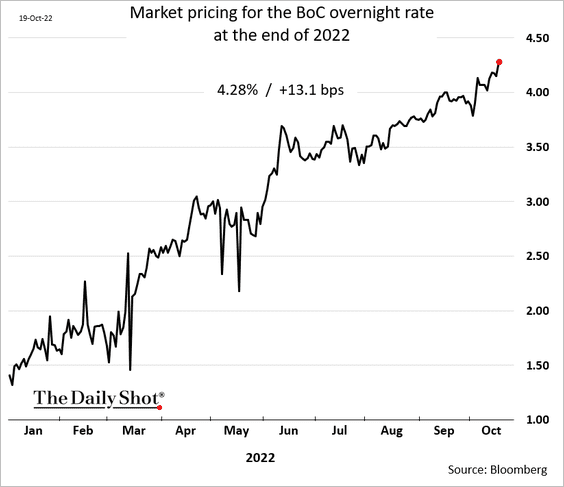
The market now sees the overnight rate ending the year at 4.3%.
——————–
3. Small business price expectations are moderating.
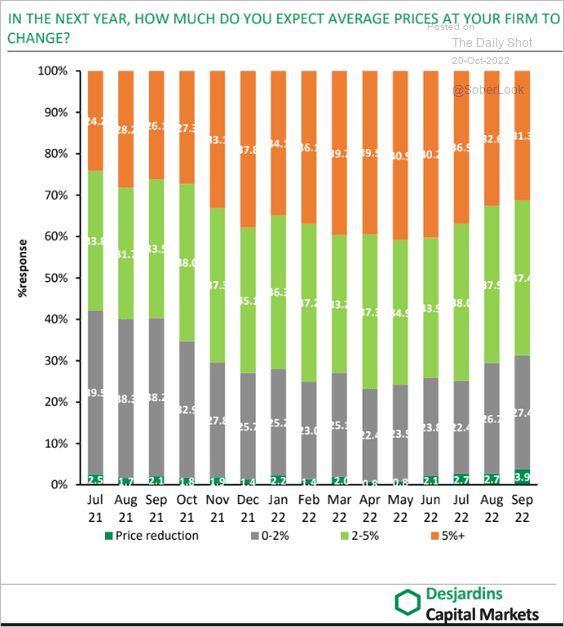 Source: Desjardins
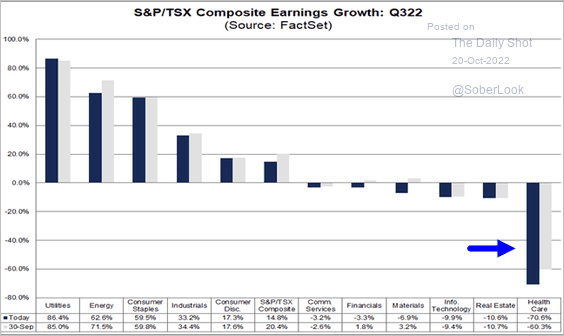
4. Analysts have been rapidly downgrading Q3 earnings estimates.
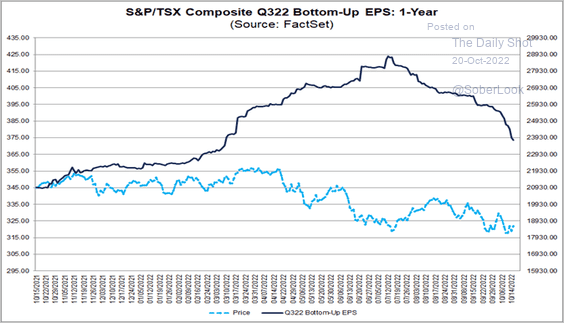 Source: @FactSet Read full article
Cannabis companies’ earnings are under pressure.
 Source: @FactSet Read full article
Back to Index
The United Kingdom
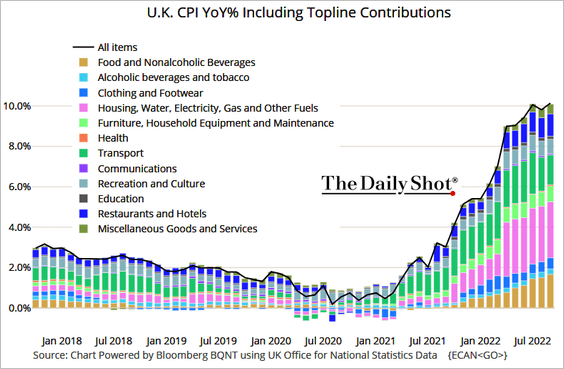
1. The CPI is back above 10%.
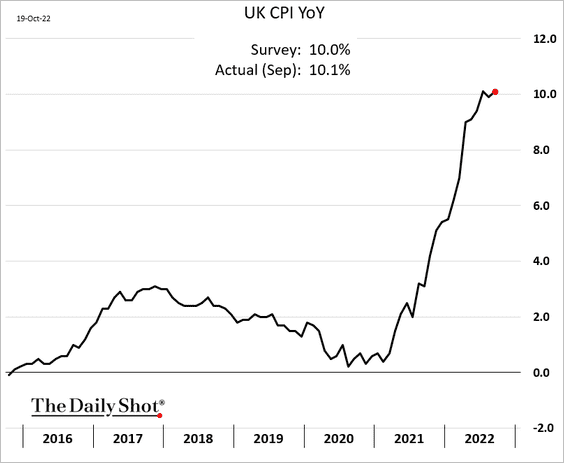
 Source: @TheTerminal, Bloomberg Finance L.P.
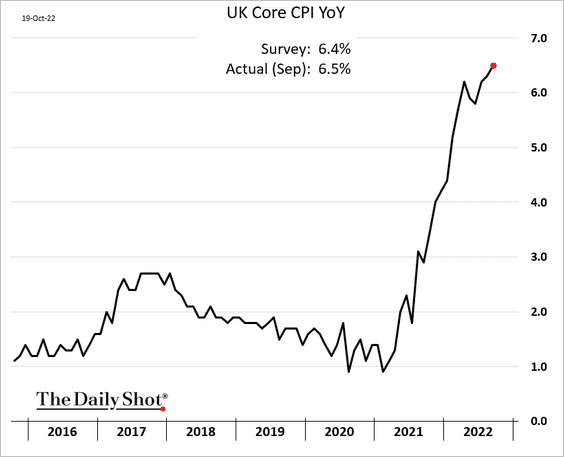
• Core inflation continues to surge.
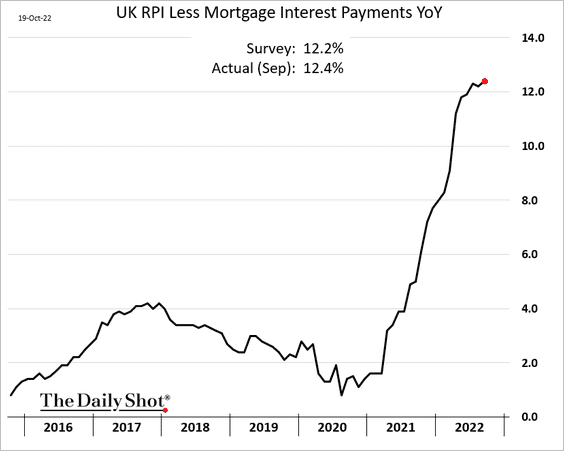
• The retail price index surprised to the upside.
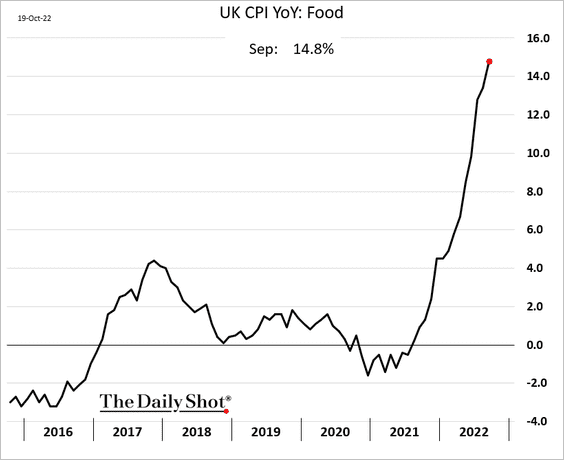
• Food inflation is nearing 15%.
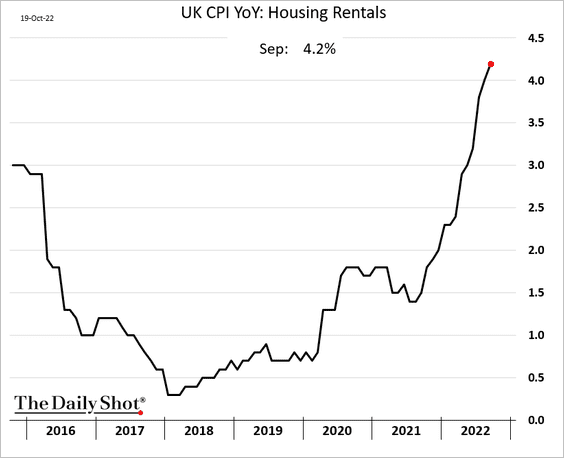
• Rent inflation keeps climbing.
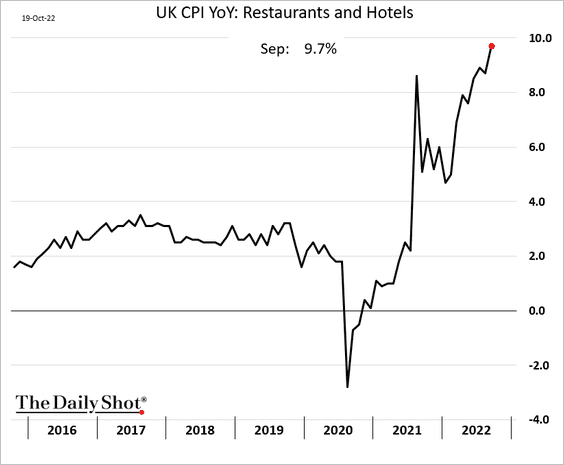
• Here is the CPI for restaurants and hotels.
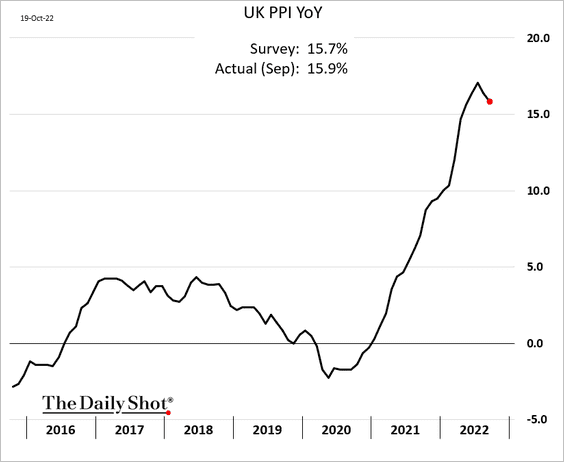
• The PPI edged lower but was above consensus estimates.
• The evolution of the UK’s CPI hinges on energy price guarantees.
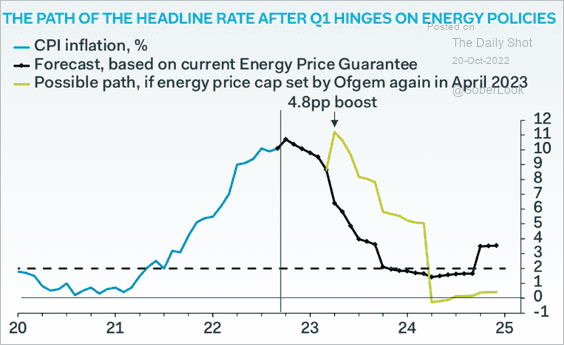 Source: Pantheon Macroeconomics
——————–
2. The betting markets expect Liz Truss to be out by the end of the year.
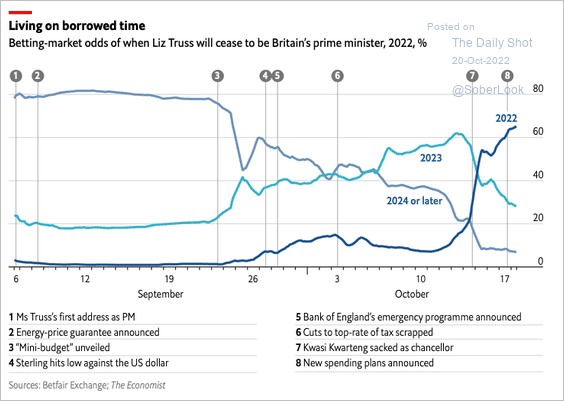 Source: The Economist Read full article
Back to Index
The Eurozone
1. Inflation ran hot in September.
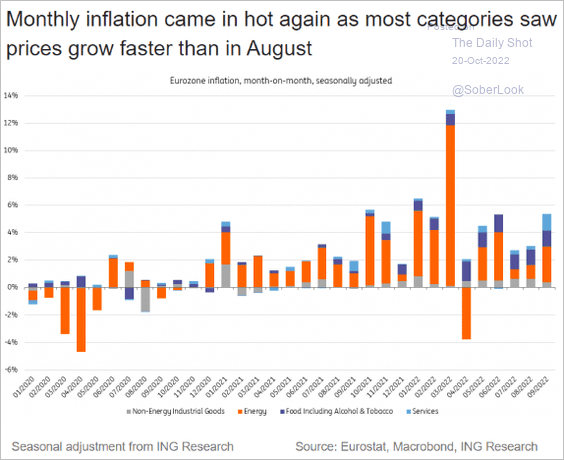 Source: ING
• Here are the drivers of services CPI.
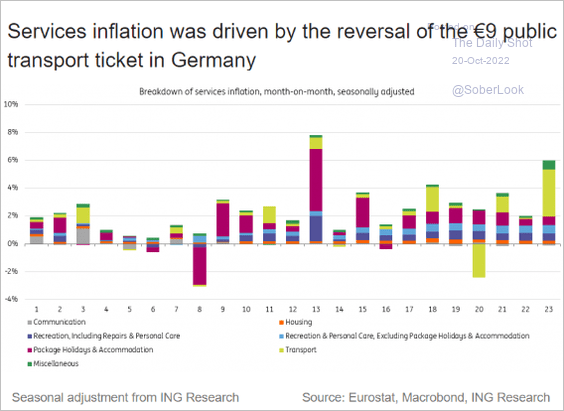 Source: ING
• Energy inflation has been massive but falling natural gas prices should help.
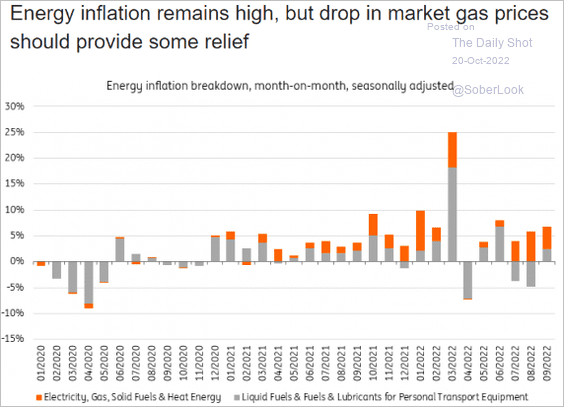 Source: ING
• Here are the year-over-year contributions (2 charts).
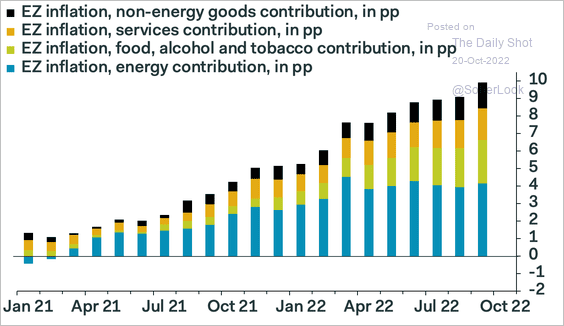 Source: Pantheon Macroeconomics
 Source: Capital Economics
——————–
2. The misery index is the highest in decades.
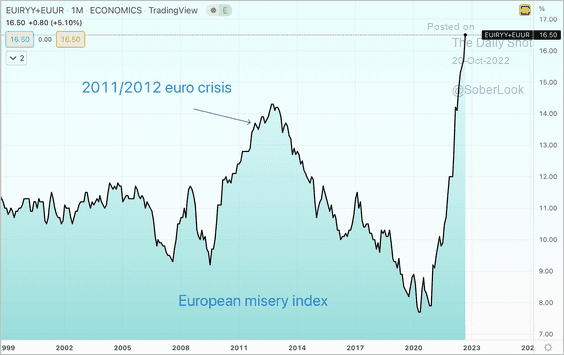 Source: @AlessioUrban
3. Can the Eurozone avoid a recession if natural gas prices keep falling?
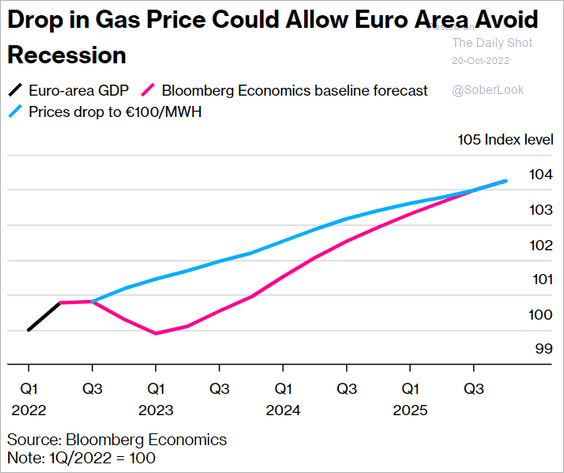 Source: @business, @MaevaDebarge, @JMurray804 Read full article
Back to Index
Europe
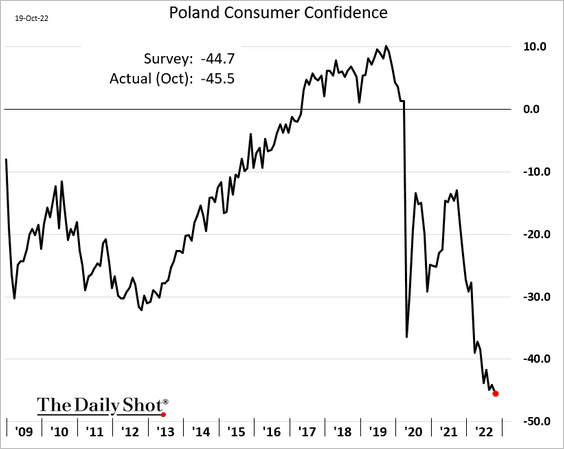
1. Poland’s consumer confidence reached a new low.
2. Macro indicators continue to deteriorate in the EU.
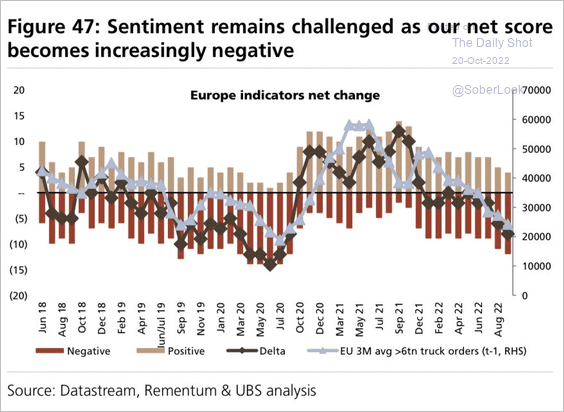 Source: UBS Research
3. This chart shows inflation rates across the EU.
 Source: Eurostat
4. Here is the unemployment rate map, including youth joblessness.
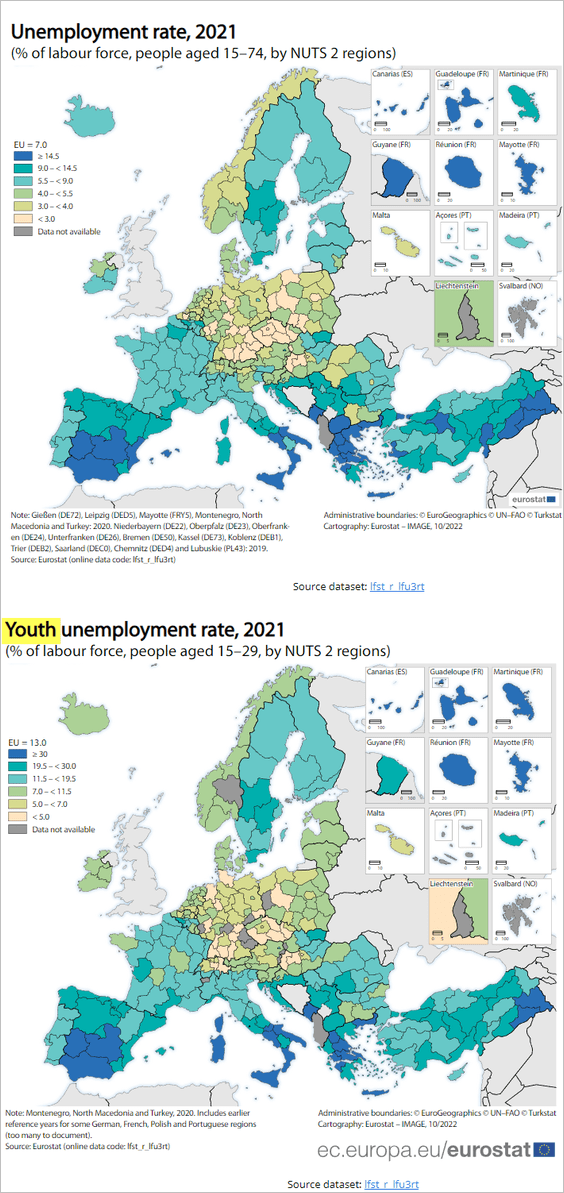 Source: Eurostat
5. Finally, we have data on building permits in the EU.
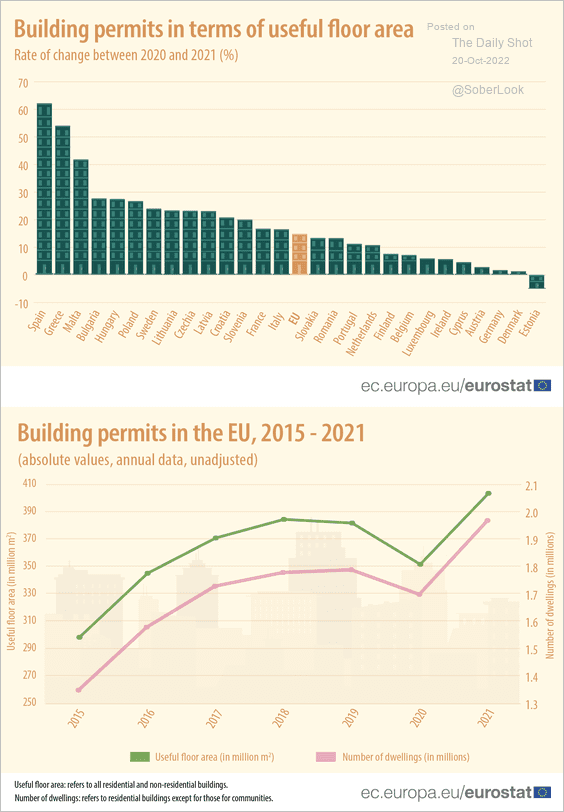 Source: Eurostat Read full article
Back to Index
Asia – Pacific
1. Dollar-yen is testing resistance at 150.
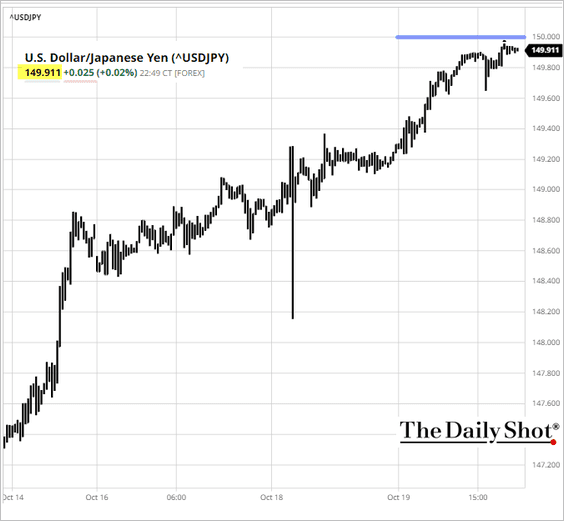 Source: barchart.com
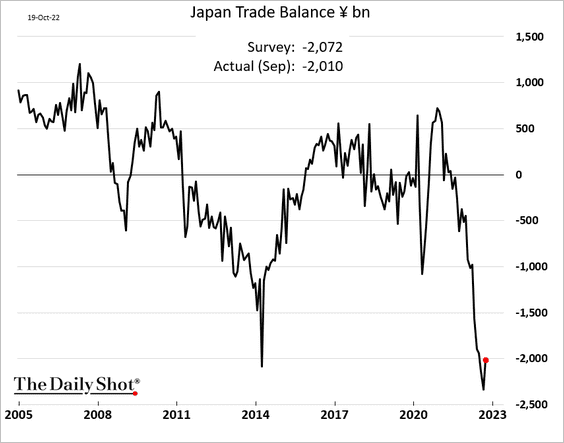
2. Japan’s trade deficit eased a bit last month.
3. Australia’s employment report was much softer than expected …
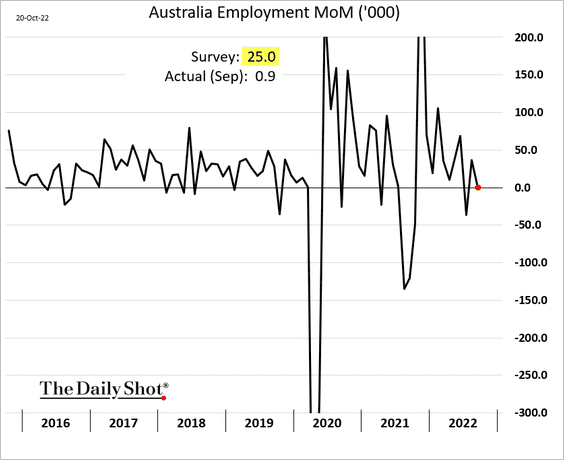
… as job growth stalls.
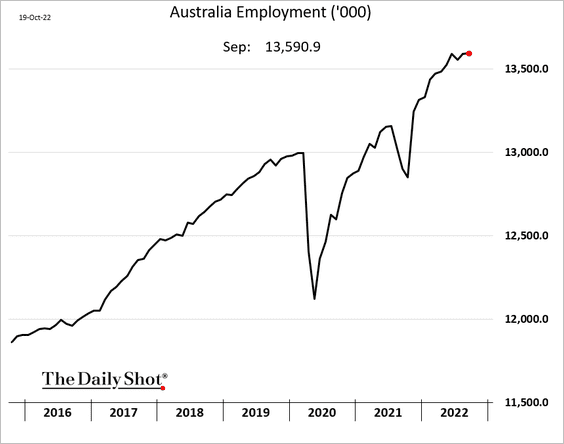
 Source: Reuters Read full article
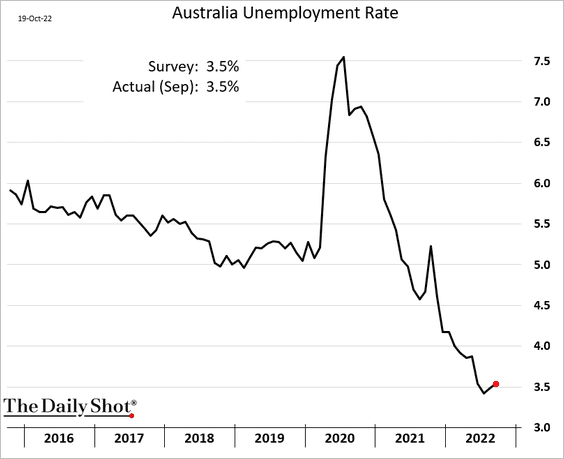
The unemployment rate edged up but is still extremely low.
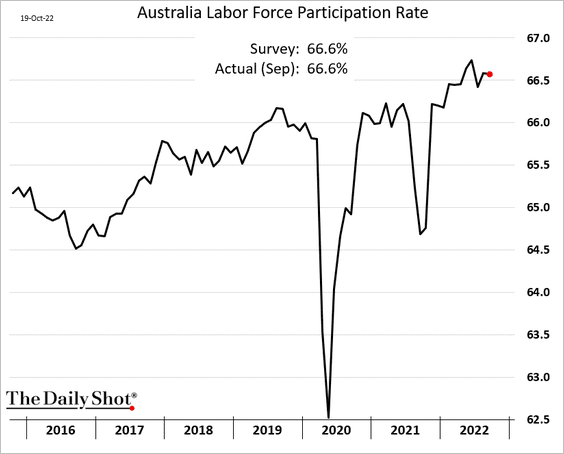
Labor force participation remains elevated.
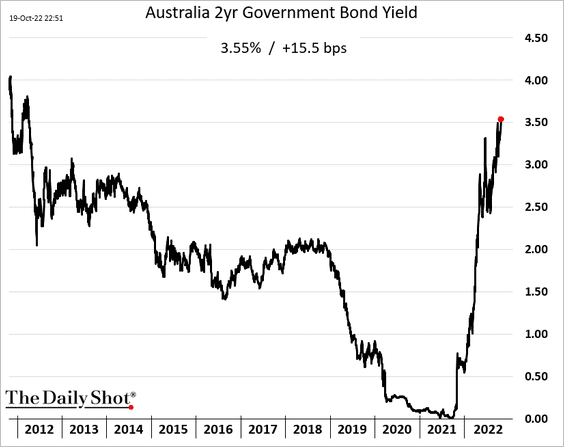
• Australia’s 2yr yield breached 3.5%.
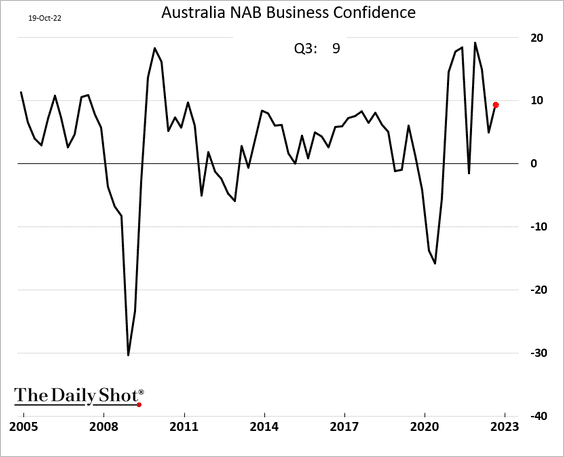
• Business confidence improved last quarter.
——————–
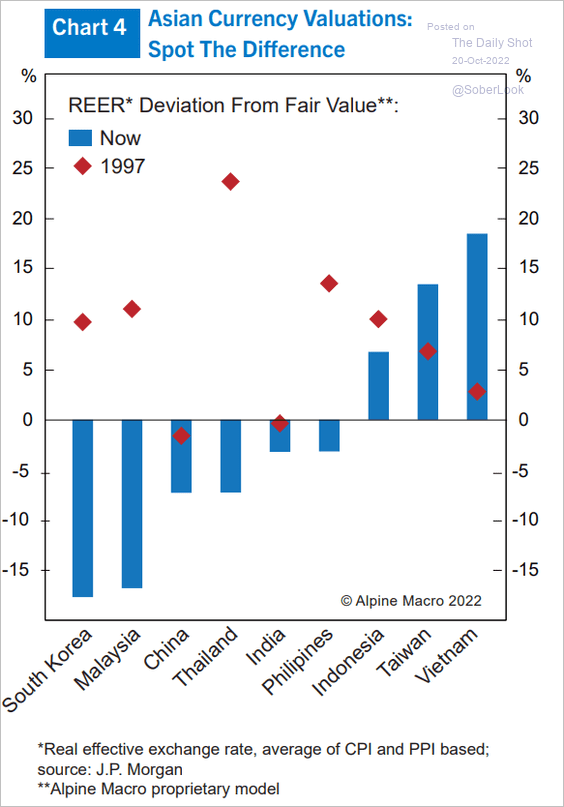
3. How far are Asian currencies from their fair value?
 Source: Alpine Macro
Back to Index
China
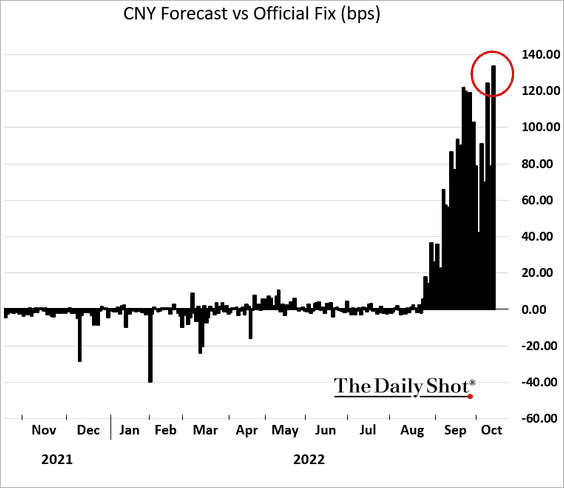
1. The PBoC is struggling to stabilize the renminbi.
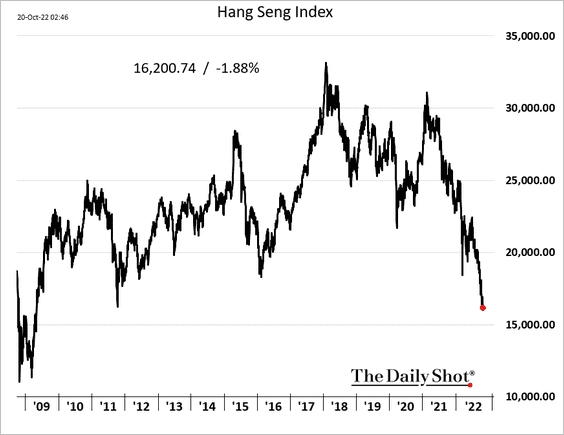
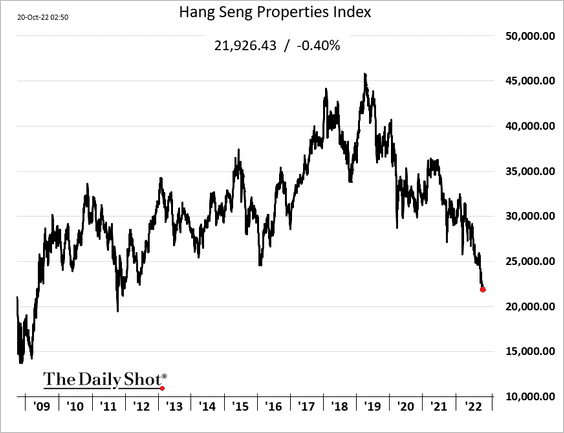
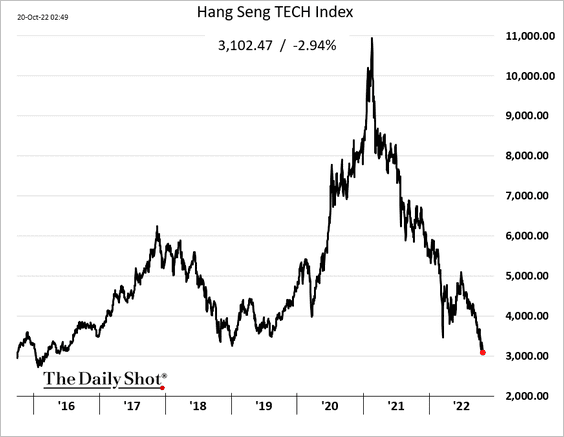
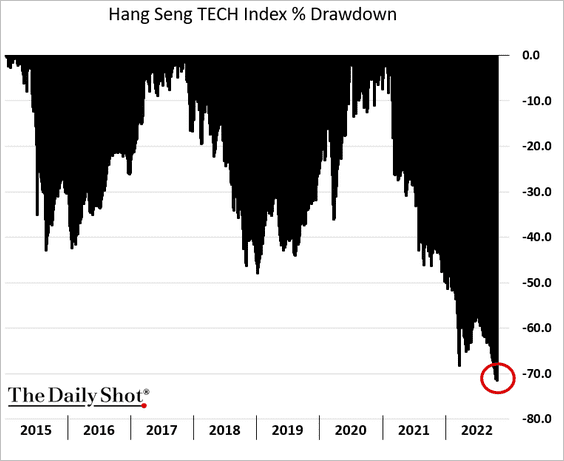
2. Stocks remain under pressure.
• Hang Seng Index
• Property stocks:
• Tech:
• Tech drawdown (> 70%):
• US-listed Chinese firms:
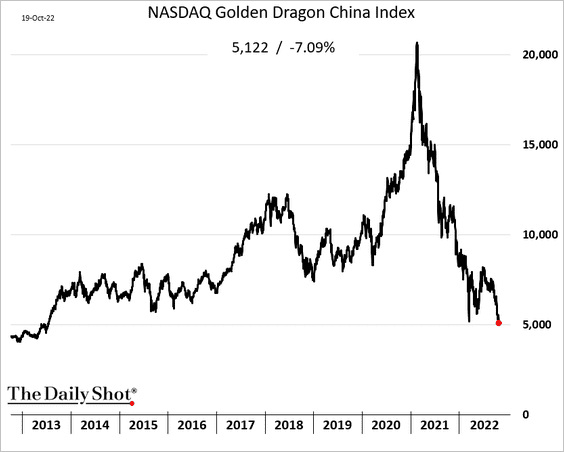
• Premium on US-listed Chinese firms:
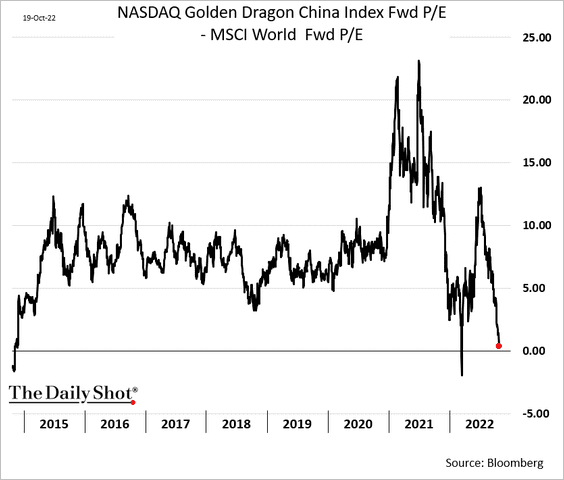 h/t Cormac Mullen, Bloomberg
——————–
3. Cement production has been depressed.
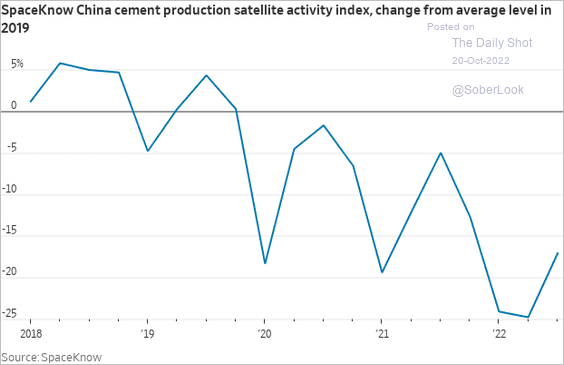 Source: @WSJ Read full article
4. Steelmakers are losing money.
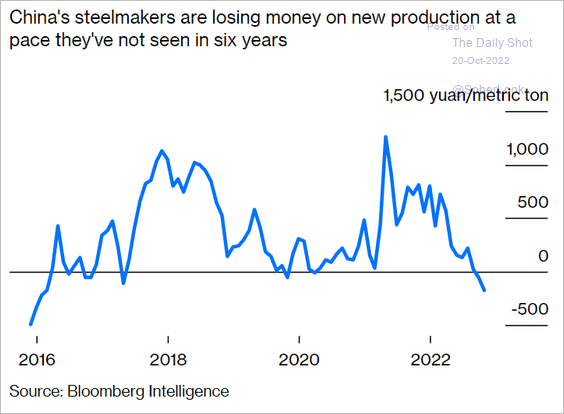 Source: @opinion, @davidfickling Read full article
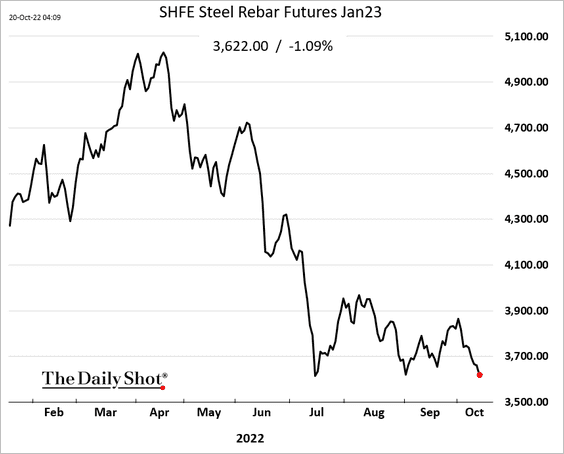
Steel prices are down sharply this year.
——————–
5. Outbound investments have exceeded inward investments in recent years.
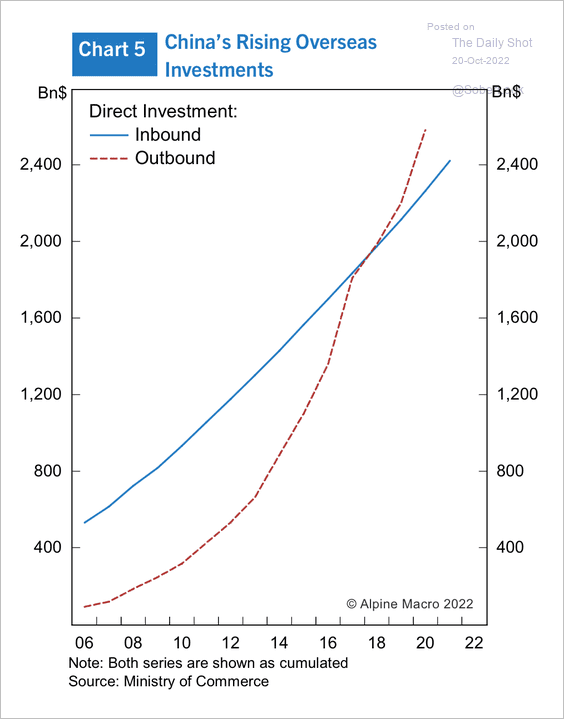 Source: Alpine Macro
6. China’s taxes on households are lower than other major economies.
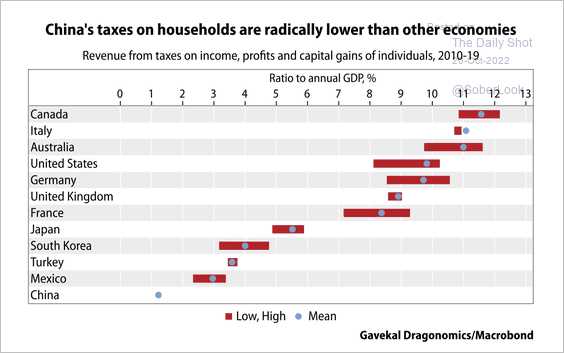 Source: Gavekal Research
7. Demographic pressures will reduce China’s surpluses.
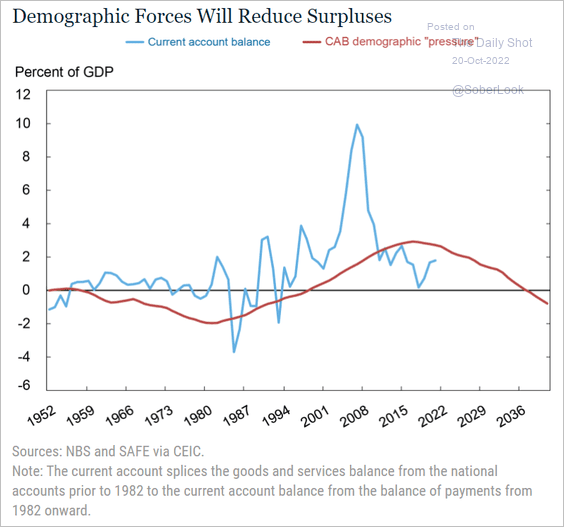 Source: Liberty Street Economics Read full article
Back to Index
Emerging Markets
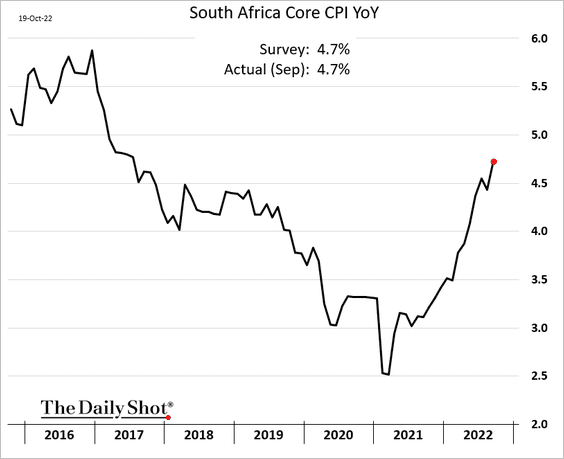
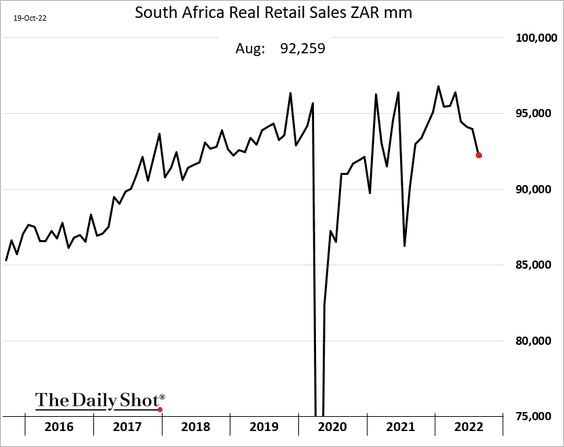
1. South Africa’s core CPI continues to climb.
Retail sales rolled over in August.
——————–
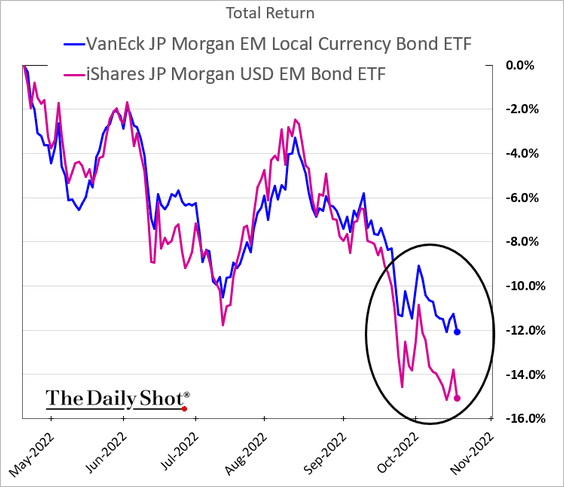
2. Dollar-denominated bonds have sold off much more than local-currency debt (2 charts).
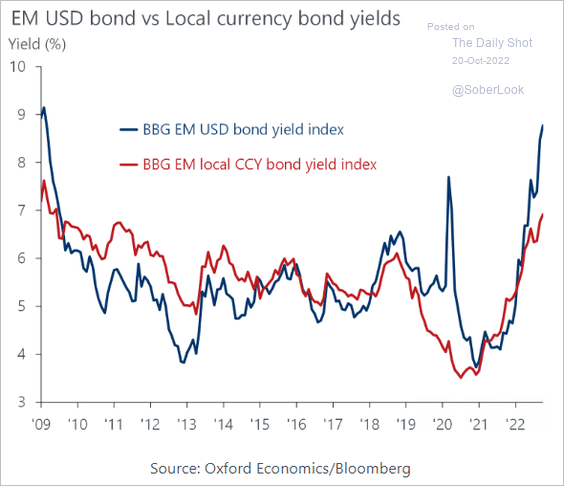 Source: Oxford Economics
——————–
3. A strong dollar is a headwind for EM stocks.
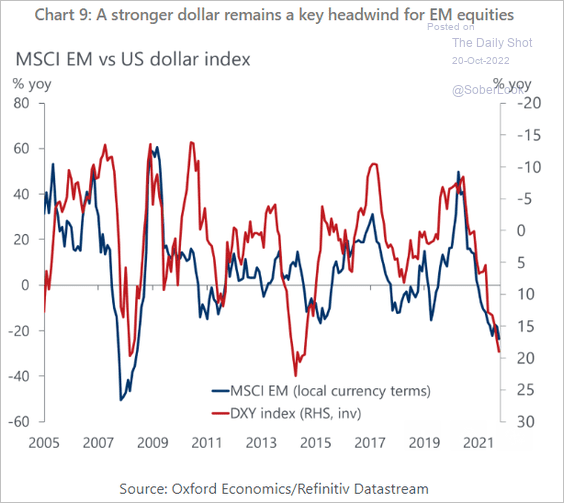 Source: Oxford Economics
4. Most EM countries have tightened preemptively, and only some EM Asian central banks are playing catch up with the Fed.
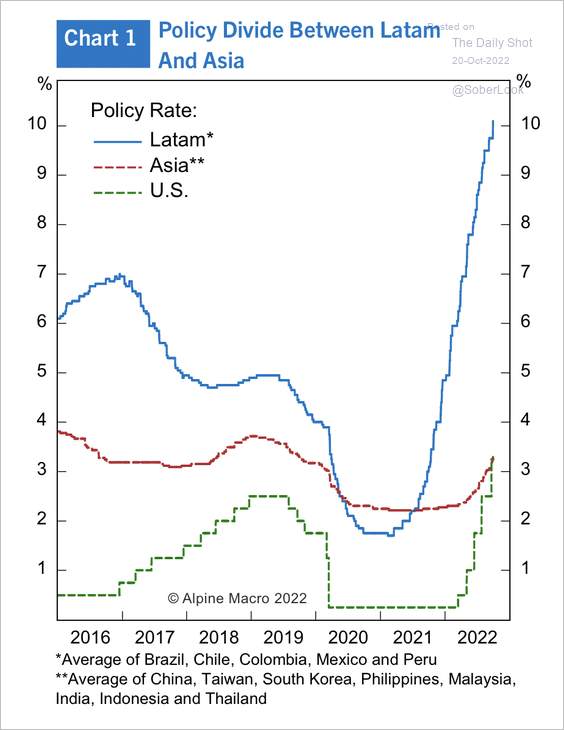 Source: Alpine Macro
There isn’t much more tightening left, according to Capital Economics, with most countries nearing or having reached the terminal rate. This chart also shows how restrictive central bank policies are based on the neutral rate.
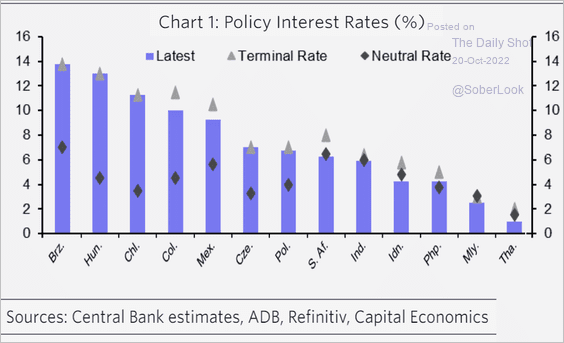 Source: Capital Economics
——————–
5. External debt levels across EM countries are slightly higher than pre-1980s debt crisis levels.
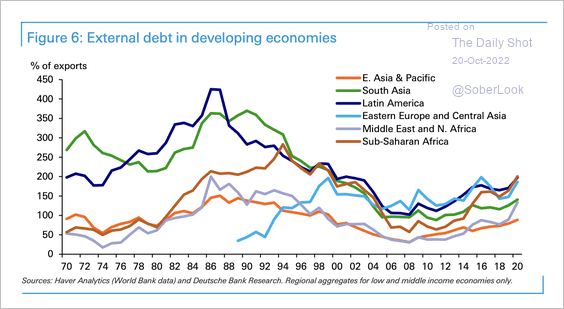 Source: Deutsche Bank Research
Back to Index
Cryptocurrency
1. It’s been a flat week for BTC so far, while Litecoin (LTC) has outperformed and XRP underperformed
 Source: FinViz
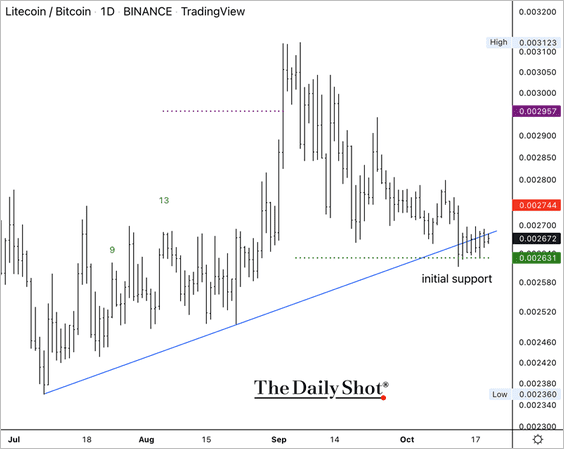
2. Will LTC hold short-term support?
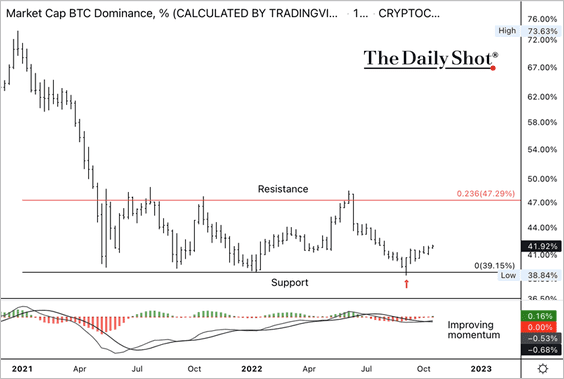
3. Bitcoin’s market cap relative to the total crypto market cap (dominance ratio) continues to hold support. A rising dominance ratio is typically associated with risk-off conditions.
Back to Index
Energy
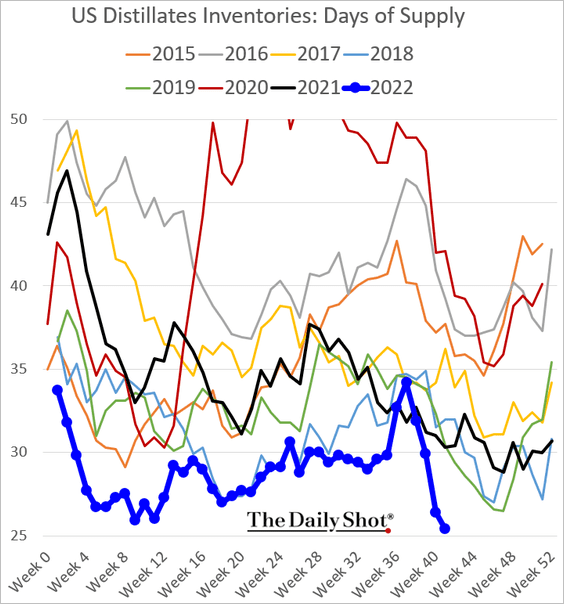
1. US diesel inventories remain extremely tight.
• Barrels:
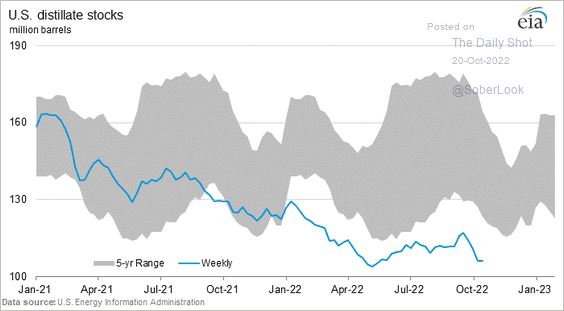 Source: @EIAgov
• Days of supply:
Crack spreads have blown out.
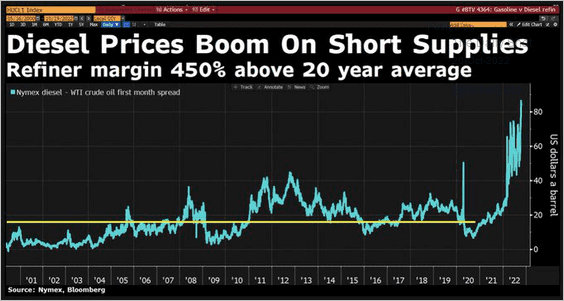 Source: @ValerieTytel, @JavierBlas Read full article
——————–
2. Substantial investment will be needed to keep US oil production growing.
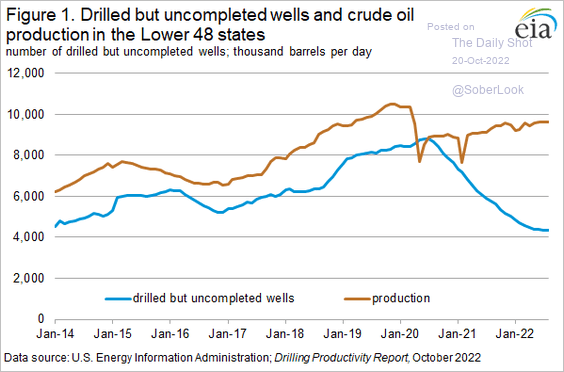 Source: @EIAgov
3. The Permian region is once again challenged by natural gas pipeline takeaway capacity constraints.
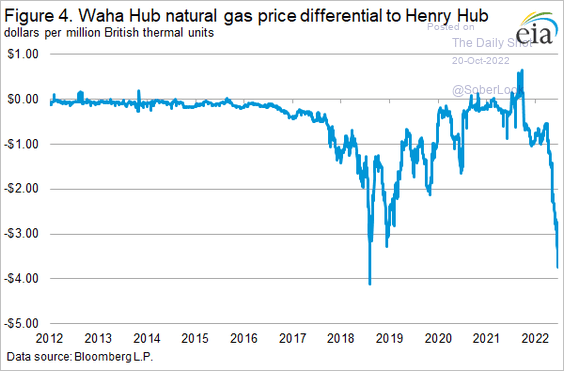 Source: @EIAgov
4. LNG demand has boosted natural gas prices in some parts of the US Southeast well above the benchmark Henry Hub levels.
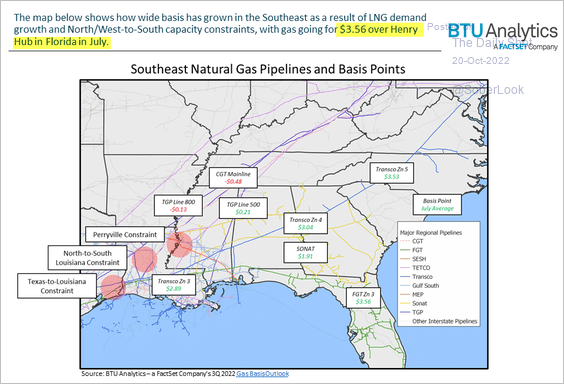 Source: @FactSet Read full article
5. Coal shipments to US power plants have been trending lower.
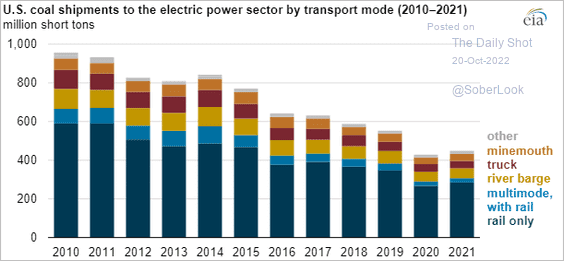 Source: @EIAgov Read full article
6. The SPDR Energy Sector ETF (XLE) is well above its decade-long downtrend versus the S&P 500.
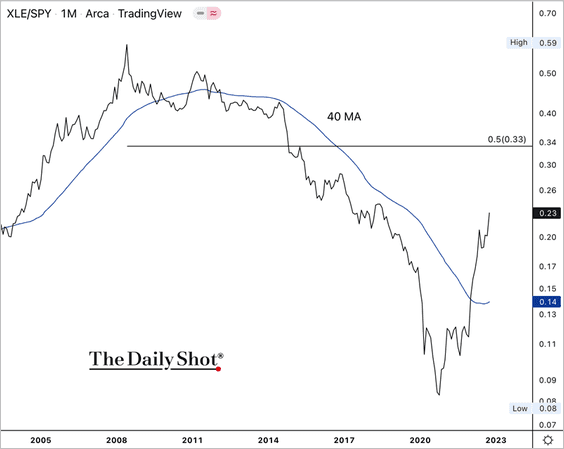
Nonetheless, energy companies are extremely cheap relative to the overall market.
Back to Index
Equities
1. Let’s begin with some sector updates.
• Fund managers’ allocations:
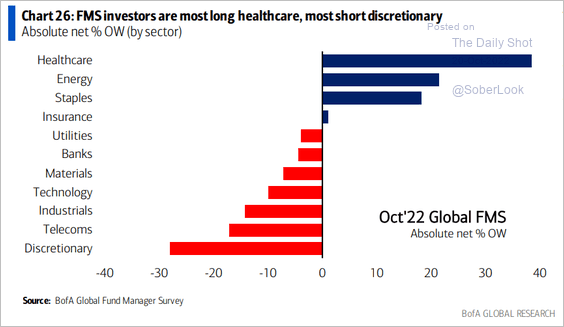 Source: BofA Global Research
• Fund flows by sector:
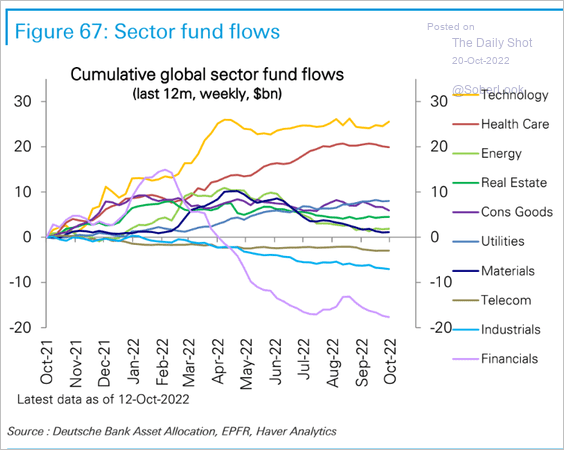 Source: Deutsche Bank Research
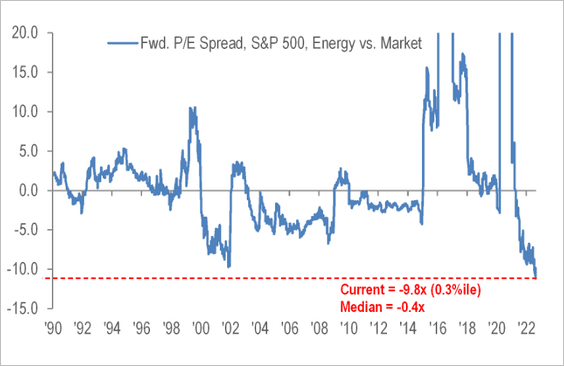
• The gap between sectors’ forward P/E ratios and the overall index (relative valuations):
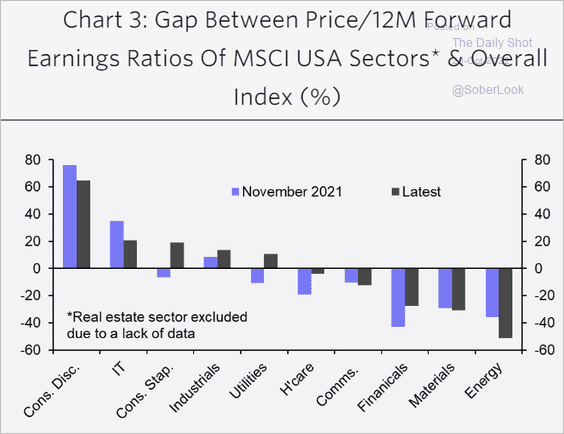 Source: Capital Economics
• Sector capitalization distribution and sector income contributions over time:
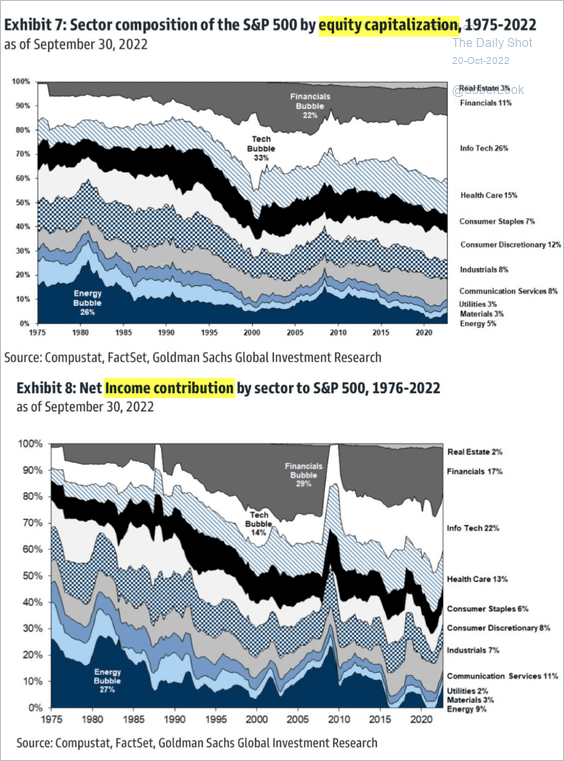 Source: Goldman Sachs
• Which sectors are most vulnerable to US dollar strength?
 Source: Oxford Economics
• Short Interest by sector:
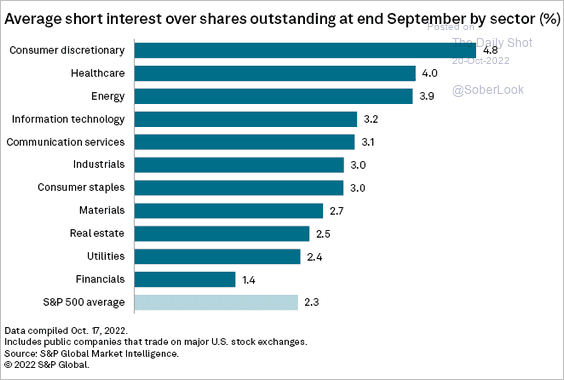 Source: S&P Global Market Intelligence
——————–
2. Net retail buying continues to slow.
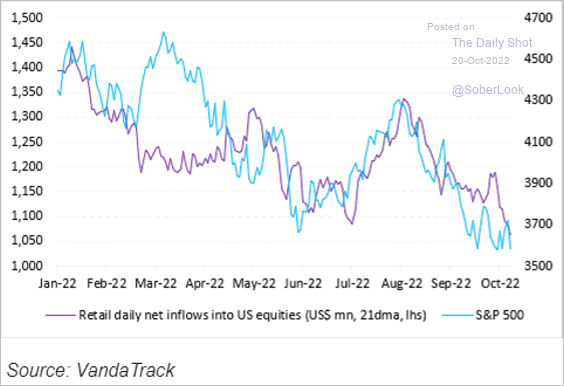 Source: Vanda Research
3. A higher terminal rate (see the US section) means lower PE multiples.
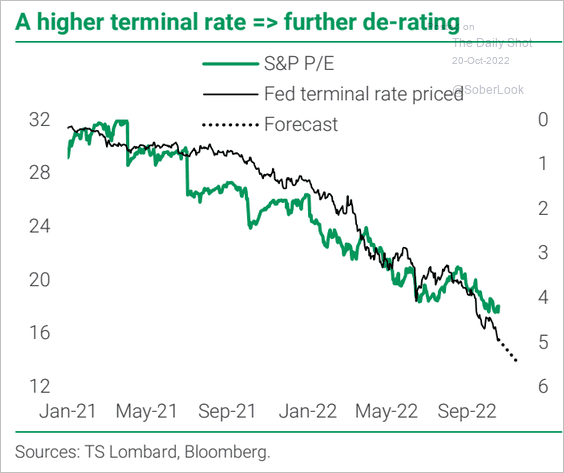 Source: TS Lombard
4. The Russell 2,000 small-cap index is more exposed to unprofitable companies versus the S&P 500.
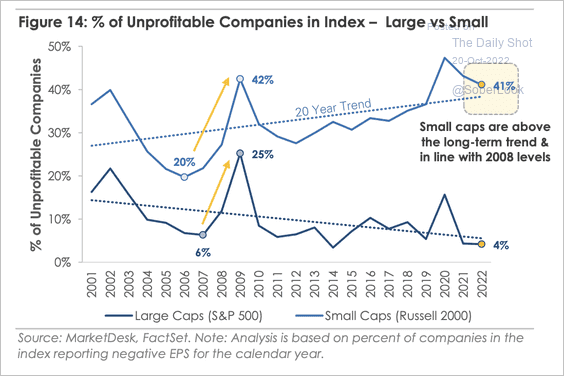 Source: MarketDesk Research
5. Corporate margins remain above average across advanced economies.
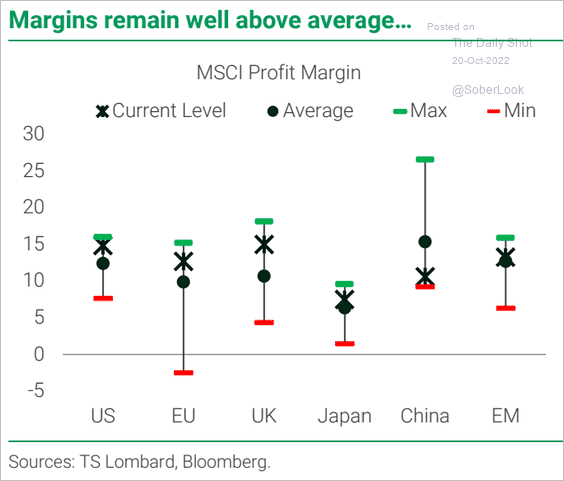 Source: TS Lombard
Back to Index
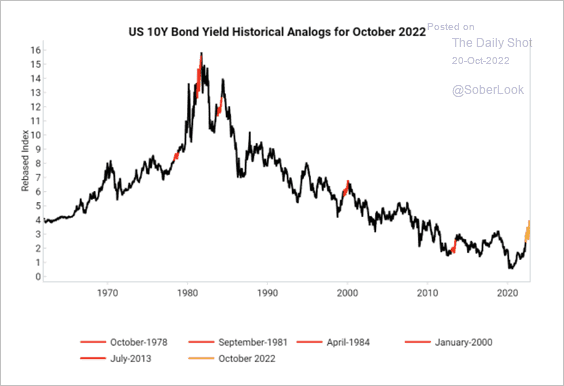
Rates
Some analogs point to a peak in yields very soon, according to Variant Perception (2 charts).
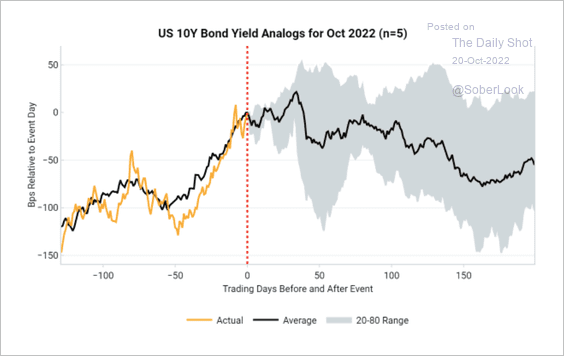 Source: Variant Perception
 Source: Variant Perception
Back to Index
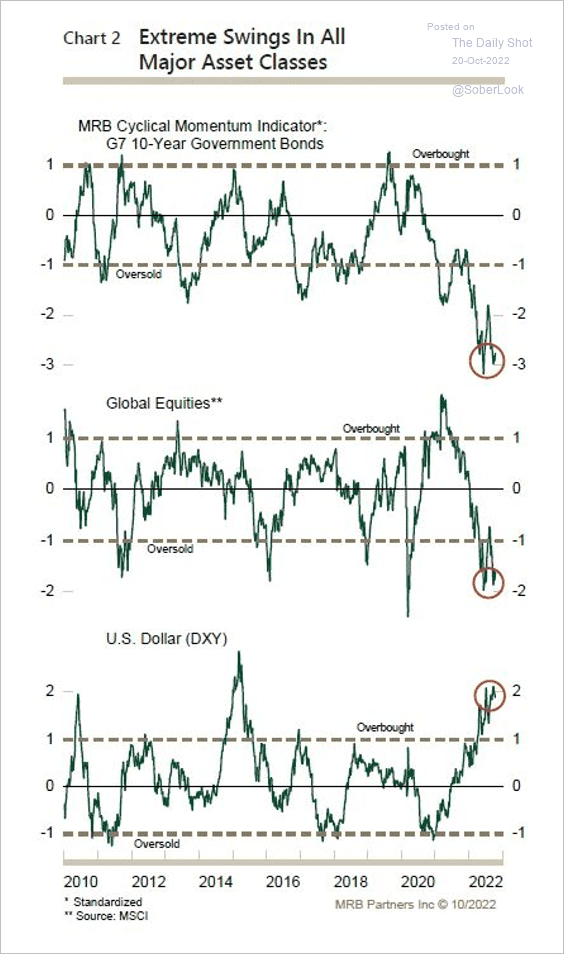
Global Developments
1. A sustained risk-on phase requires a pause/downward move in bond yields and the dollar.
 Source: MRB Partners
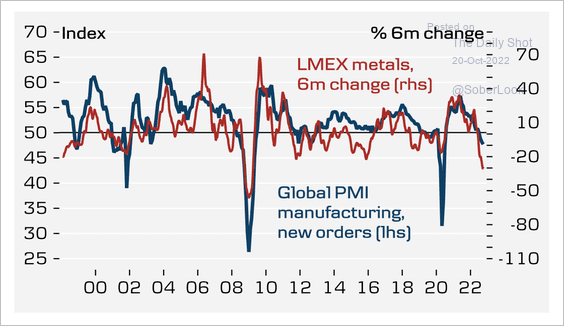
2. The decline in metal prices points to weaker manufacturing conditions.
 Source: Danske Bank
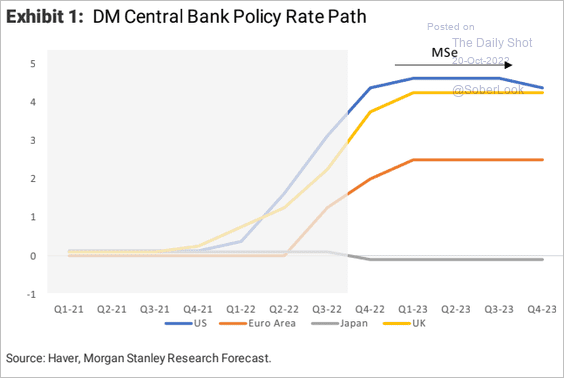
3. Next we have Morgan Stanley’s forecast for policy rate trajectories in advanced economies.
 Source: Morgan Stanley Research
4. Advanced economies, particularly Australia and New Zealand, have high amounts of real estate debt per capita.
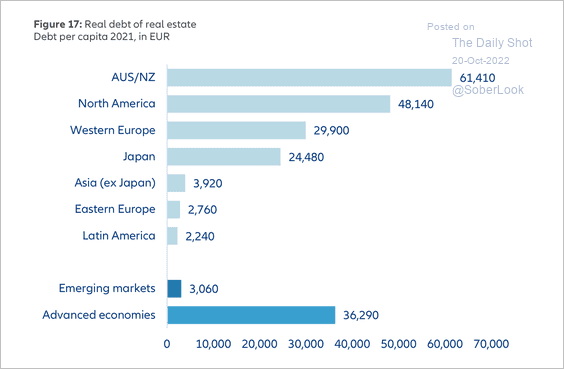 Source: Allianz Research
5. This chart shows maximum drawdowns across carry strategies.
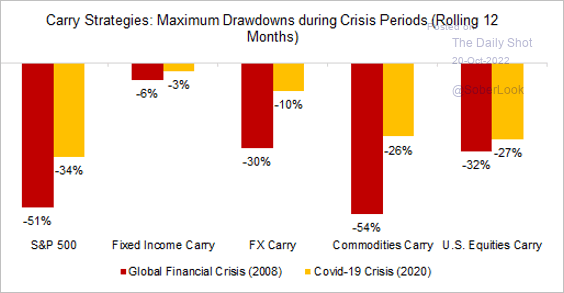 Source: Finominal
——————–
Food for Thought
1. Investment banking revenues:
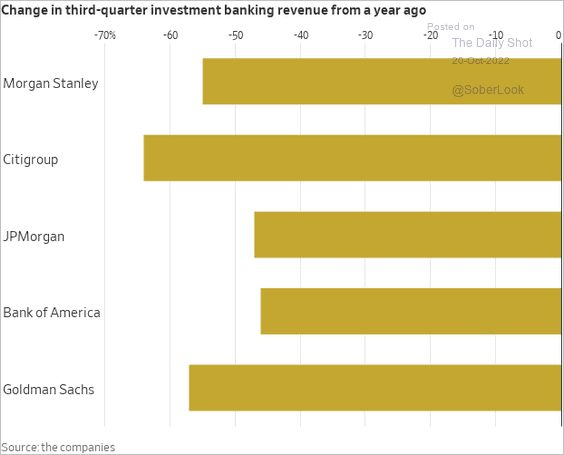 Source: @WSJ Read full article
2. Office construction spending:
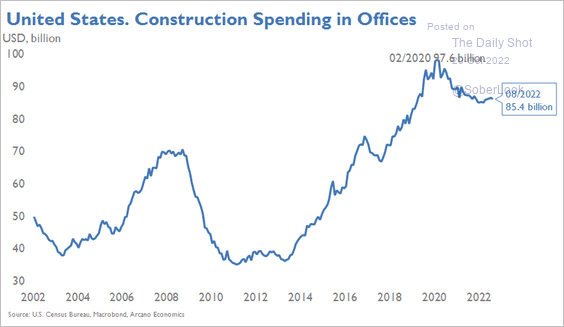 Source: Arcano Economics
3. Remittances:
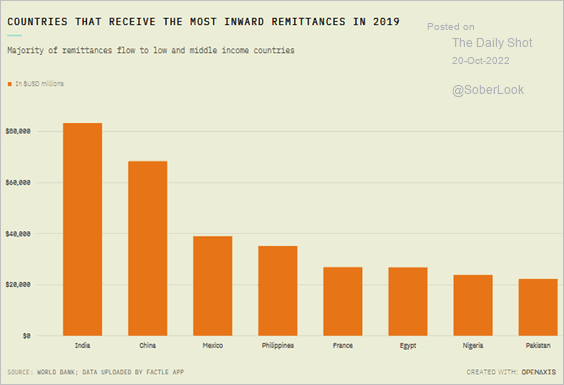 Source: @OpenAxisHQ
4. Wealth of single US adults with and without children:
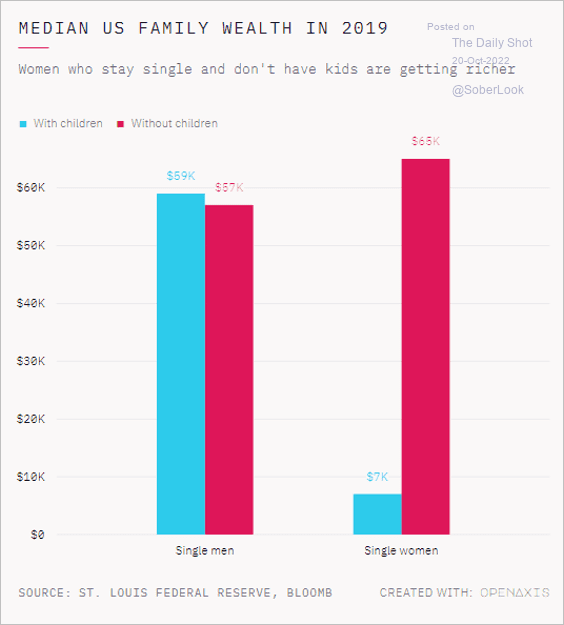 Source: @OpenAxisHQ
5. The number of 25-35 year-olds in the US:
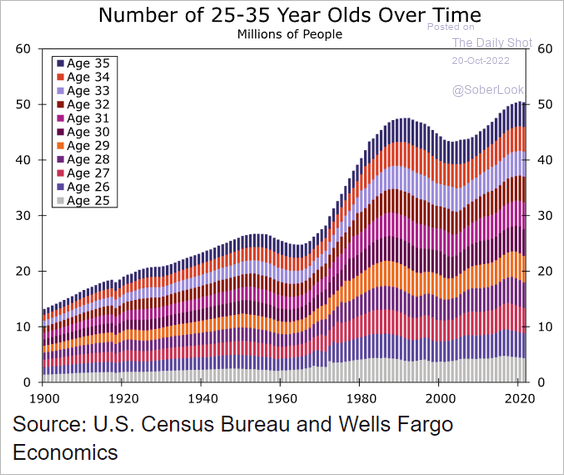 Source: Wells Fargo Securities
6. Limiting kids’ screen time:
 Source: @CivicScience Read full article
7. The Berlin Marathon finishers’ time distribution:
 Source: @chartrdaily
——————–
Back to Index