
The Daily Shot: 24-Oct-22
• China
• Japan
• The Eurozone
• The United Kingdom
• Canada
• The United States
• Emerging Markets
• Commodities
• Energy
• Equities
• Credit
• Rates
• Global Developments
• Food for Thought
China
1. President Xi Jinping has secured a third term with an inner circle of allies.
 Source: @WSJ Read full article
The markets are nervous about his new grip on power.
 Source: Bloomberg Read full article
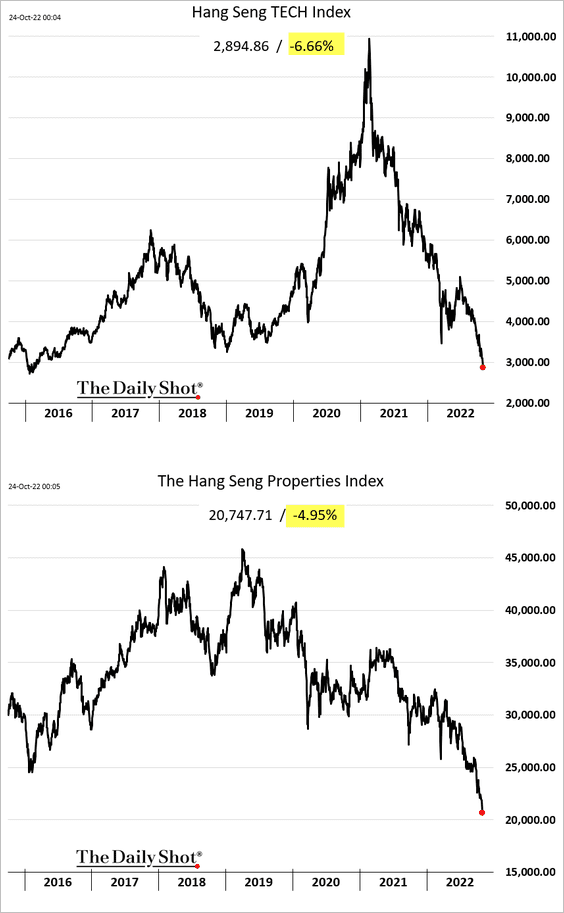
• Stocks are down sharply.
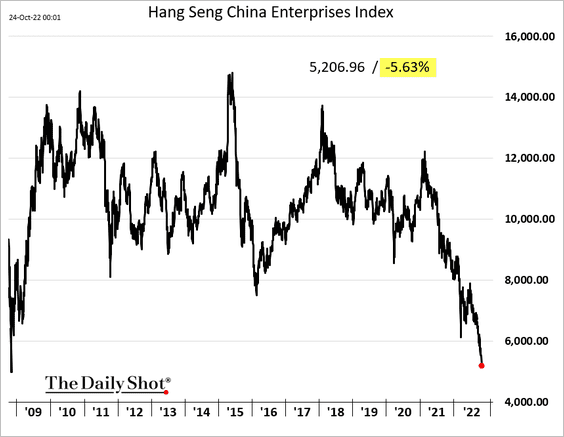
Here are the tech and property indices in Hong Kong.
By the way, many of China’s stocks are below book value.
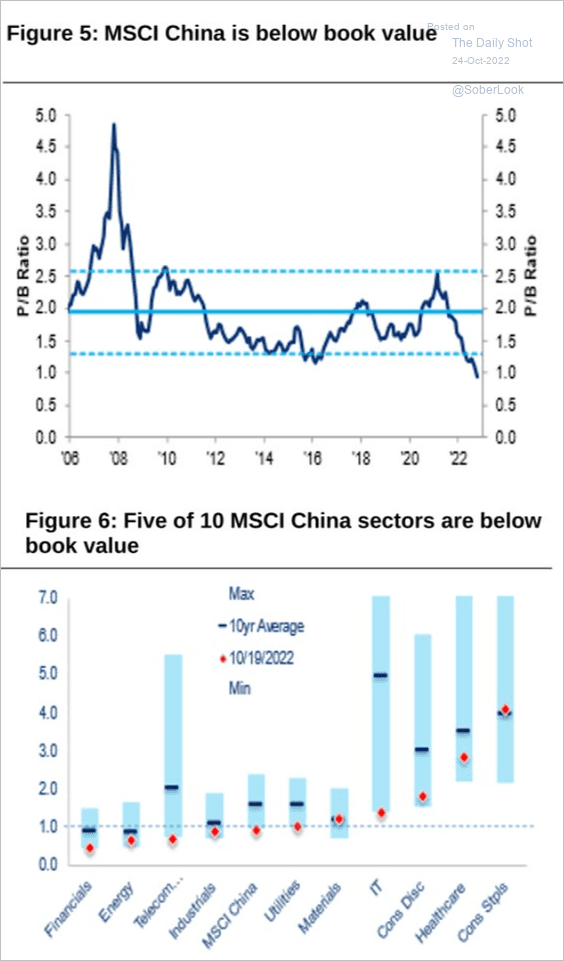 Source: Citi Private Bank
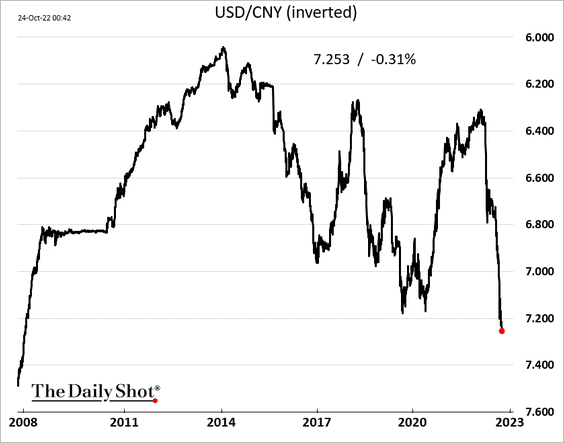
• The renminbi continues to hit multi-year lows.
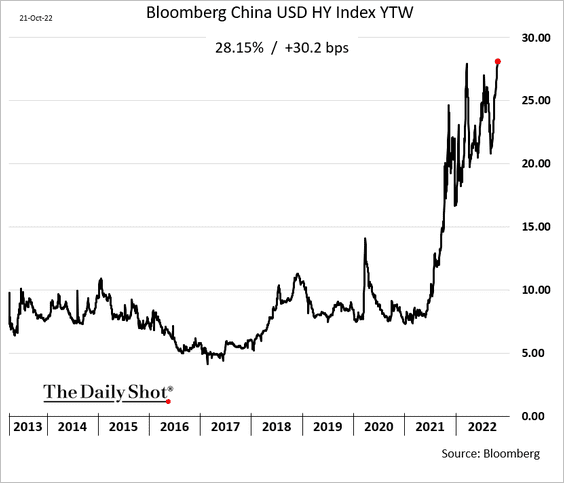
• The average yield on China’s dollar-denominated high-yield debt is nearing 30% as leveraged property developers struggle.
——————–
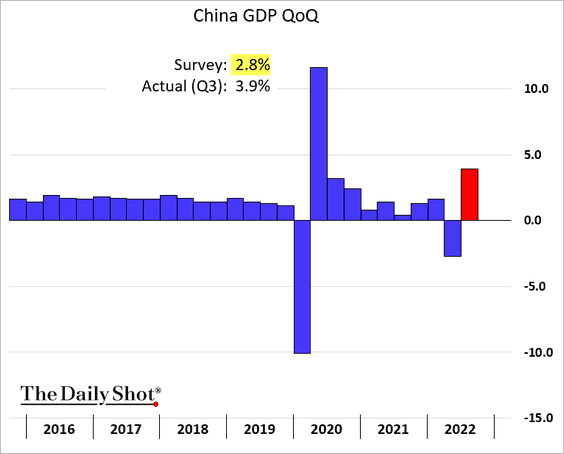
2. There was plenty of time to massage the data as Beijing delayed the GDP release … and voilà – the Q3 growth surprised to the upside as the Party Congress comes to a close.
By the way, Beijing has been persistently degrading the transparency of its economic data releases (2 charts).
![]() Source: @financialtimes Read full article
Source: @financialtimes Read full article
![]() Source: @financialtimes Read full article
Source: @financialtimes Read full article
——————–
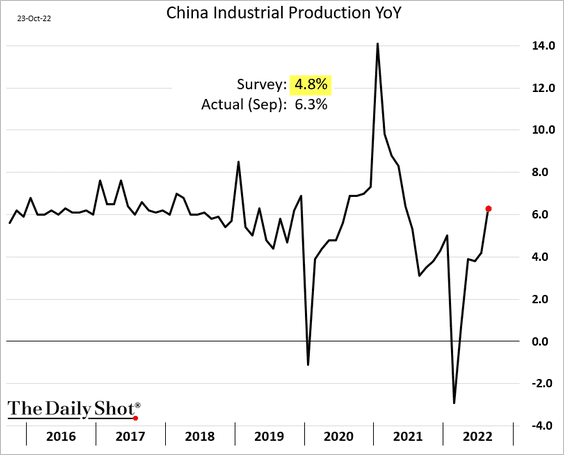
3. The gains in industrial production were strong last month.
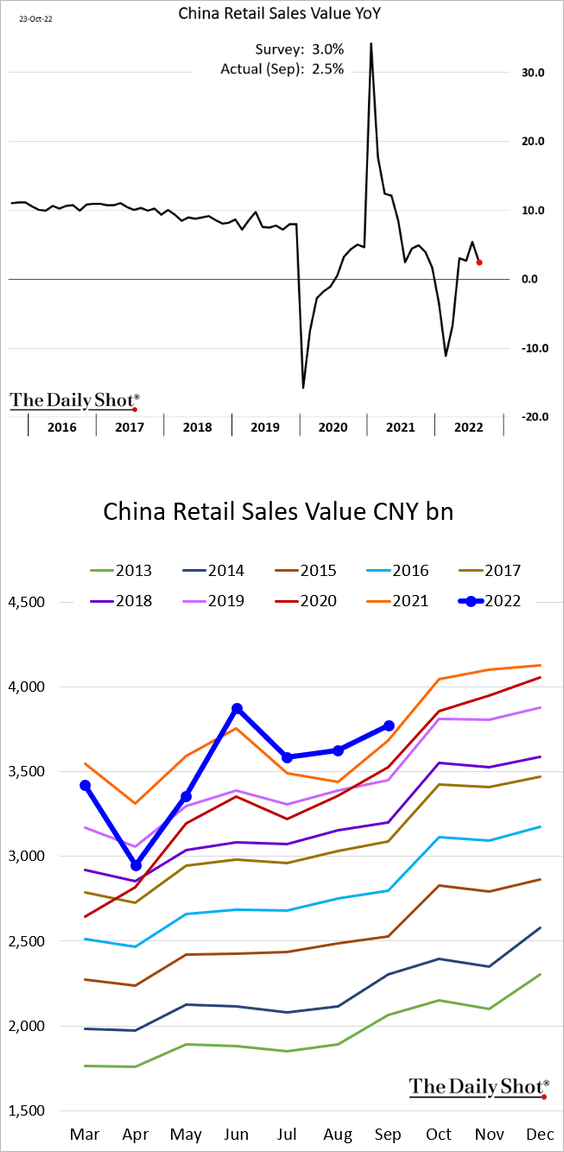
• Retail sales were a bit softer than expected.
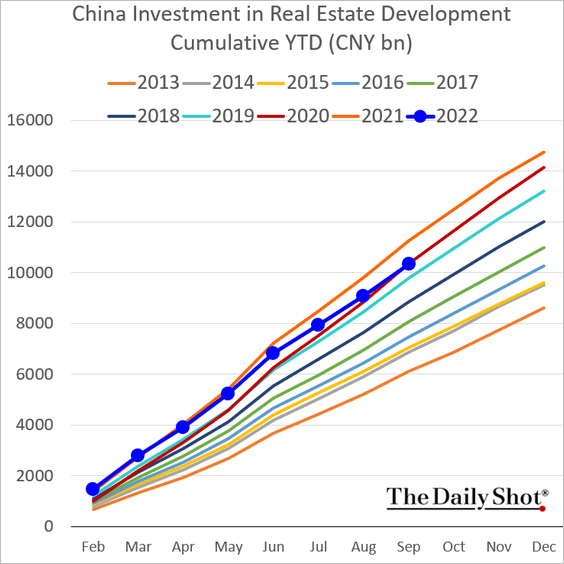
• Real estate investment is now running in line with 2020 levels (year-to-date).
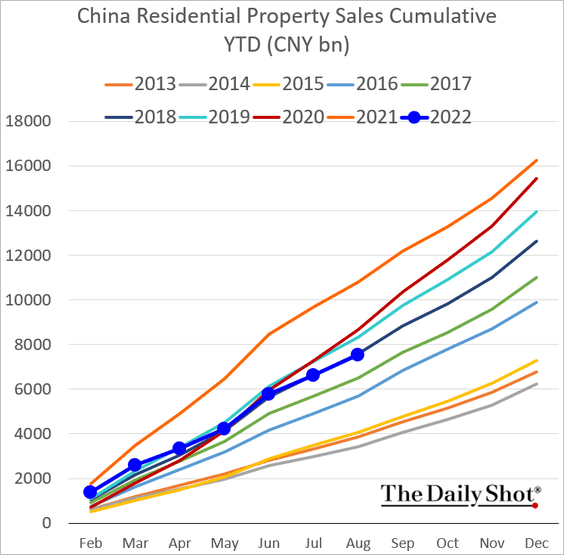
• Property sales dipped to 2018 levels.
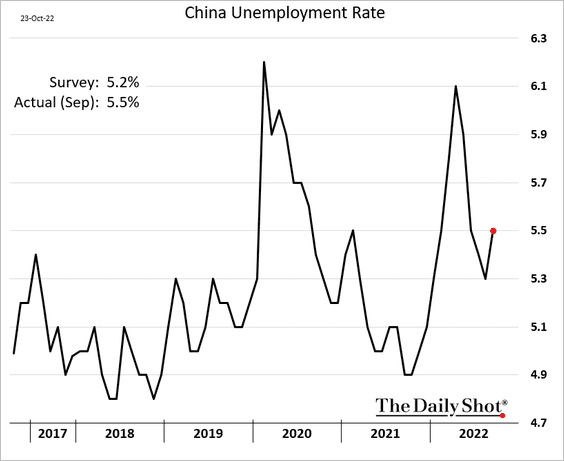
• The Unemployment rate edged higher.
——————–
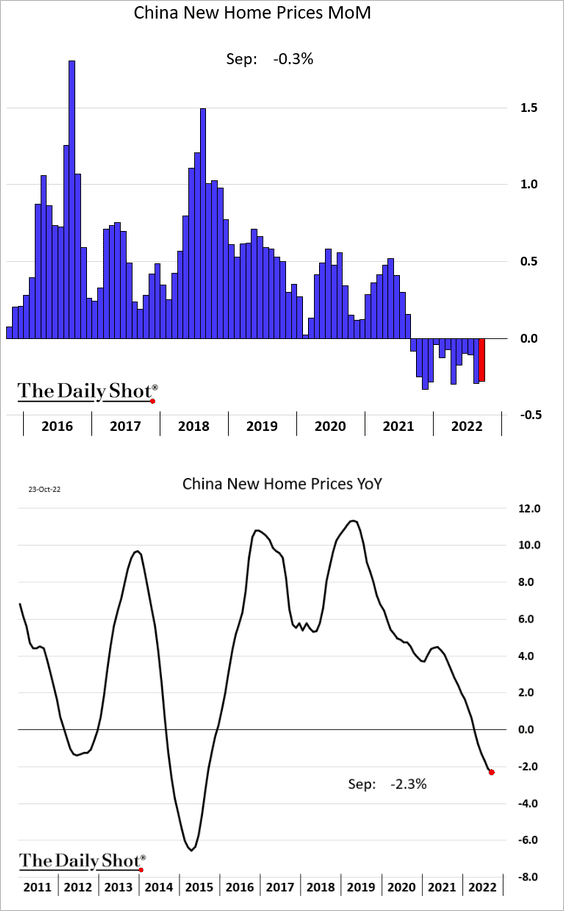
4. New home prices keep falling.
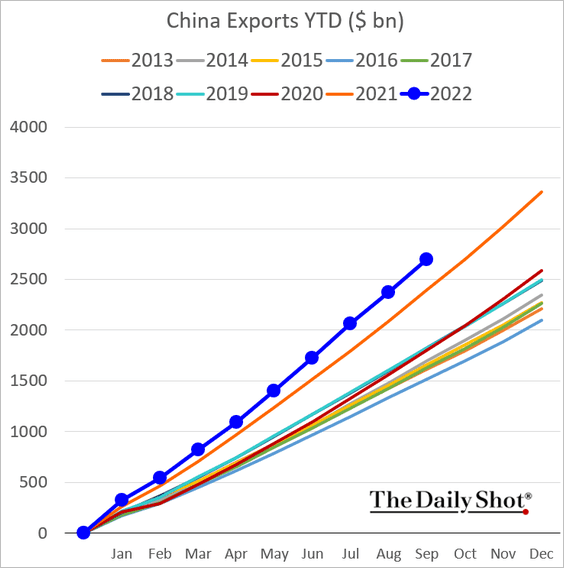
5. The trade surplus continues to expand.
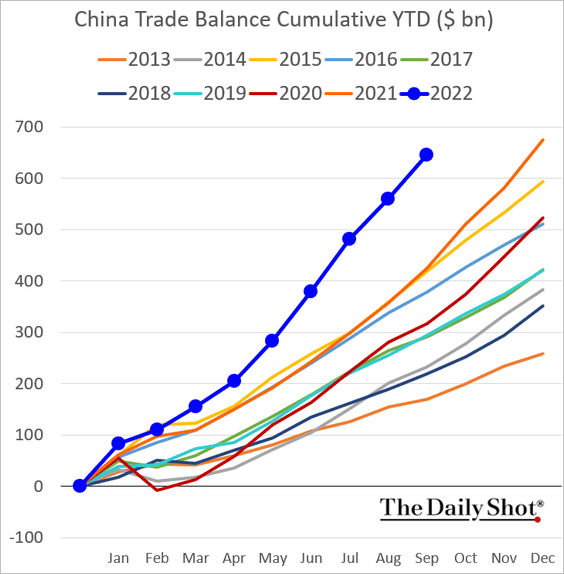
Exports are running above last year’s levels.
——————–
Back to Index
Japan
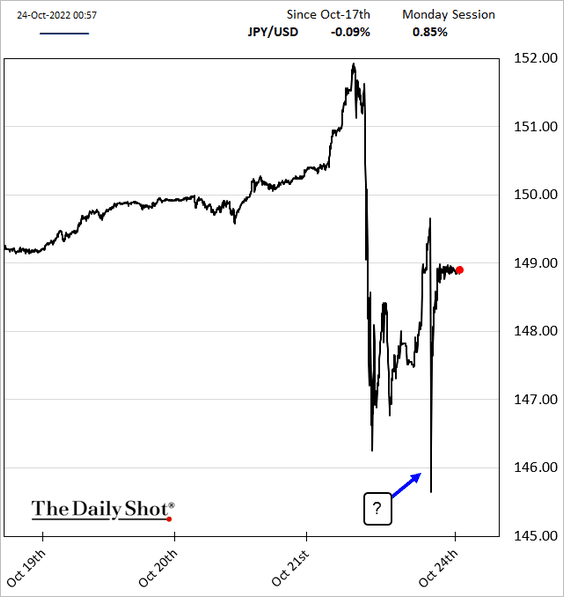
1. Japan intervened in the currency markets again after dollar-yen crossed 150.
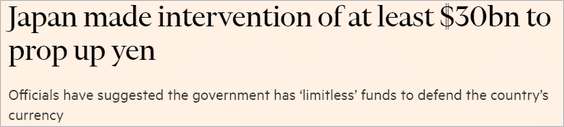 Source: @financialtimes Read full article
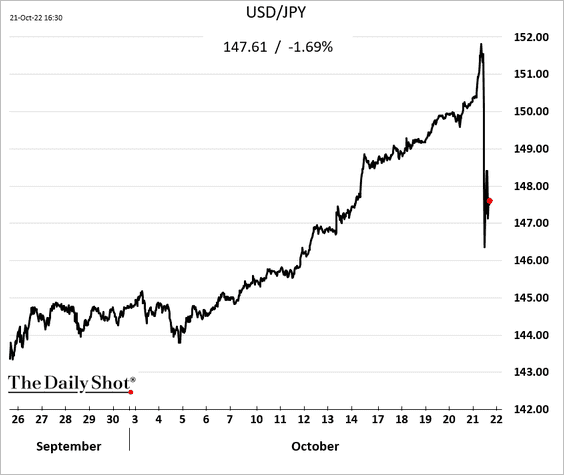
Was there another intervention this morning?
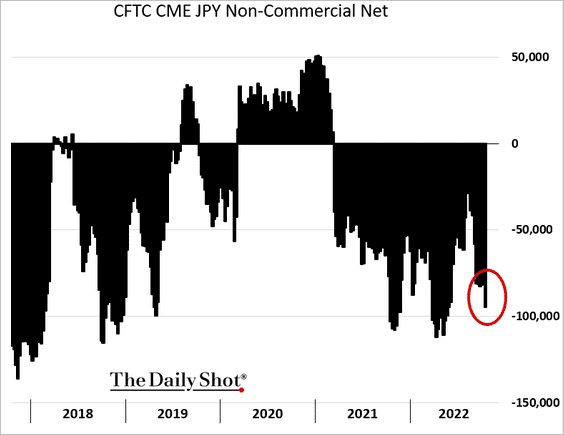
Traders are short the yen, which, in theory, should help interventions.
——————–
2. The BoJ continues to buy the 10yr JGB.
 Source: Reuters Read full article
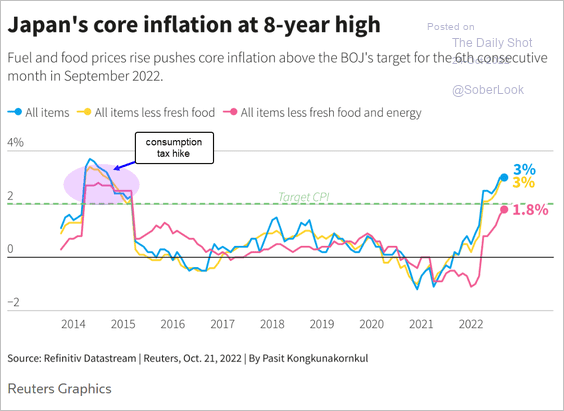
But rising inflation could test the central bank’s resolve.
 Source: Reuters Read full article
——————–
3. The PMI report suggests that Japan’s business activity is growing.
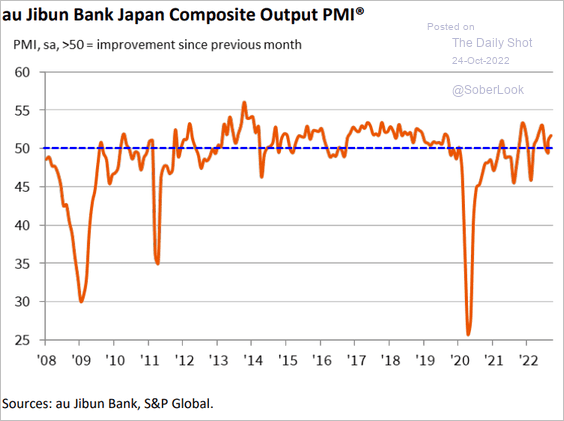 Source: S&P Global PMI
Back to Index
The Eurozone
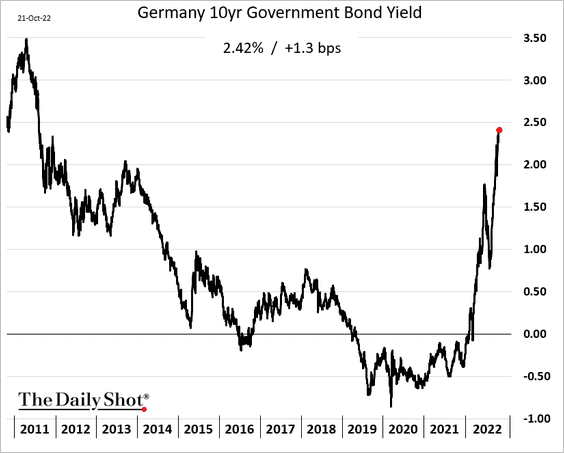
1. The 10yr Bund yield is approaching 2.5%.
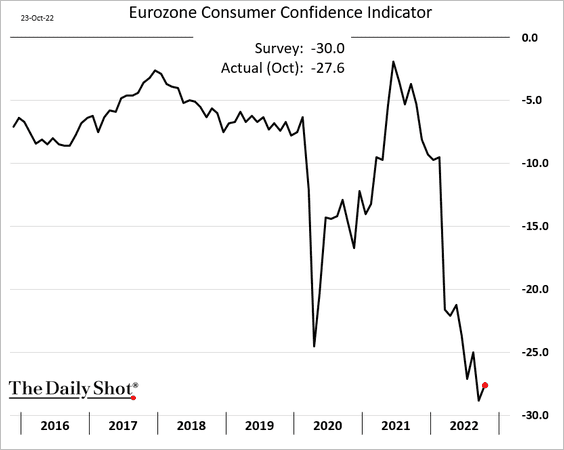
2. Euro-area consumer confidence edged higher this month (from record lows).
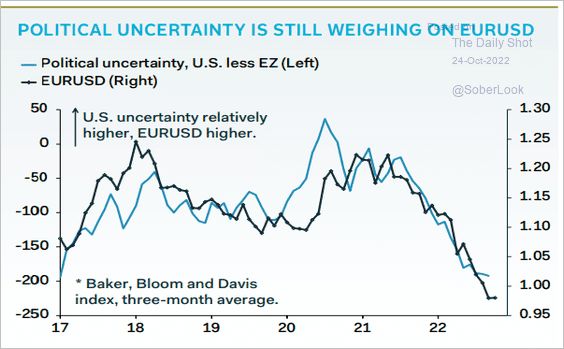
3. Political uncertainty is still weighing on the euro.
 Source: Pantheon Macroeconomics
4. This chart shows the debt-to-GDP ratios in select economies.
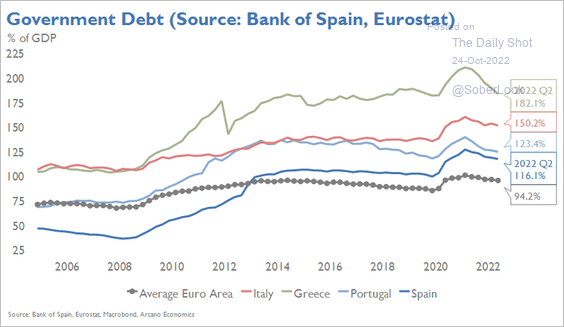 Source: Arcano Economics
Back to Index
The United Kingdom
1. Rishi Sunak is likely the next PM.
 Source: Reuters Read full article
Here is the betting market.
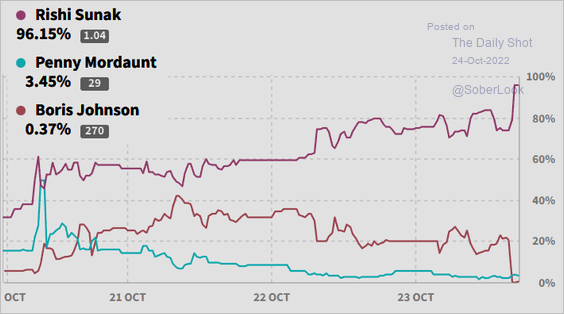 Source: @smarkets, @sbk
Online search activity for Sunak jumped.
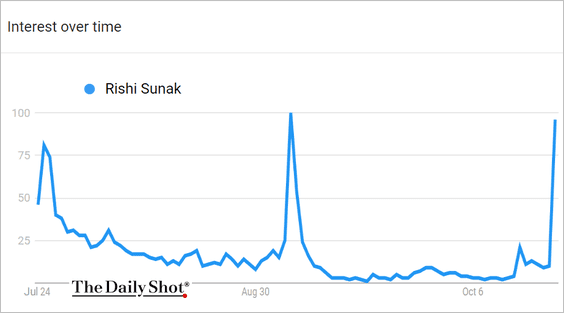 Source: Google Trends
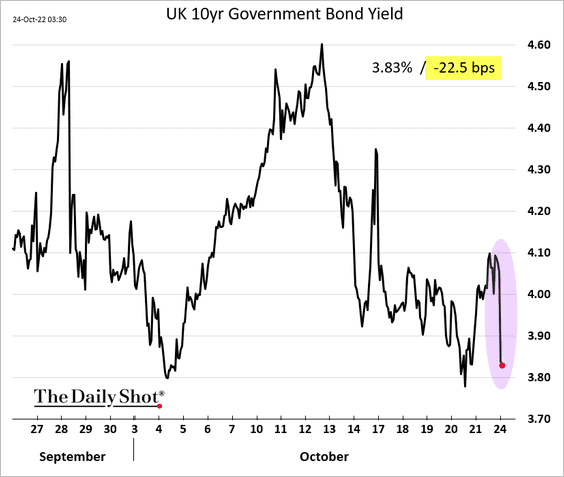
Gilts surged on the news.
——————–
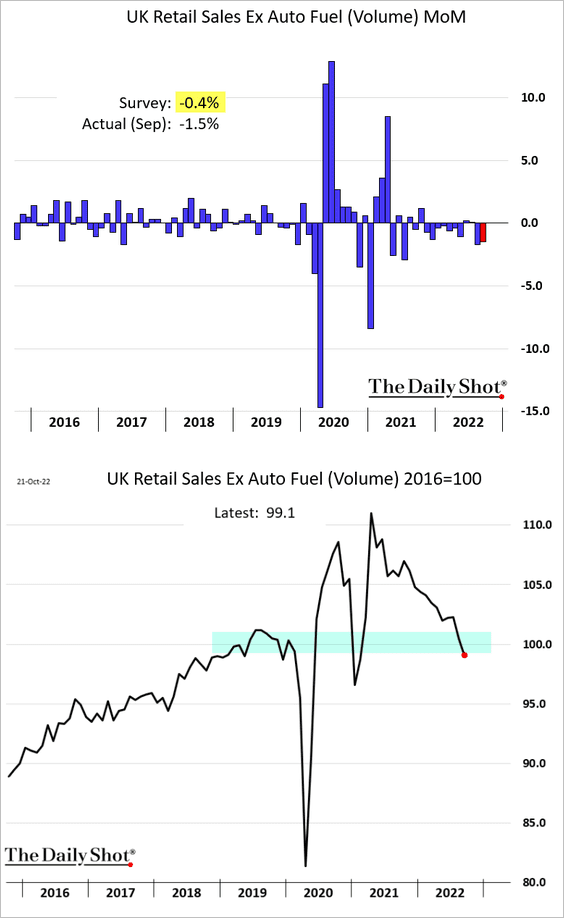
2. UK real retail sales deteriorated further last month, dipping below pre-COVID levels.
3. Government borrowing jumped in September.
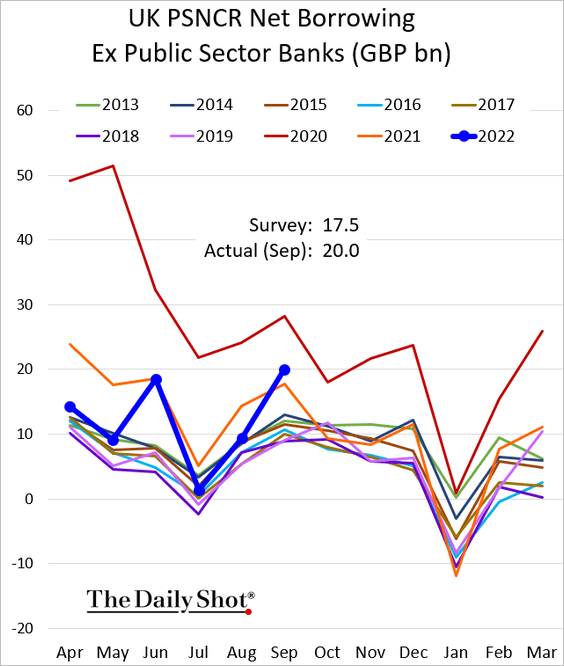
Even after the tax cut reversals, the budget deficit is expected to remain elevated.
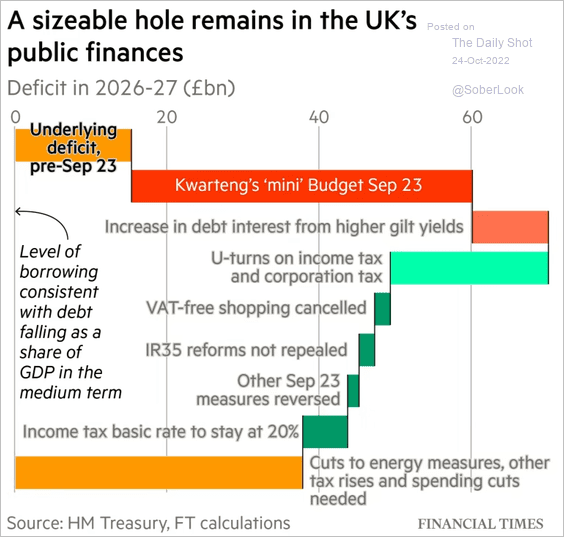 Source: @financialtimes Read full article
Back to Index
Canada
1. The Canadian dollar is still undervalued based on purchasing power parity.
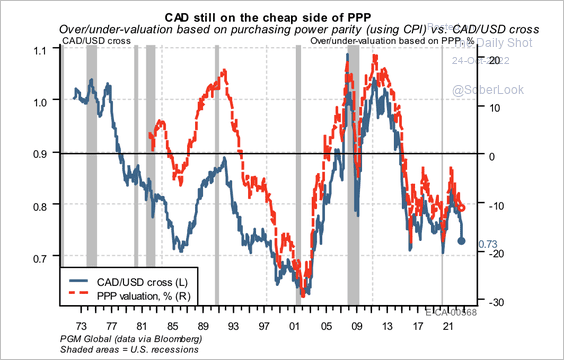 Source: PGM Global
However, relative yield differentials support a higher dollar versus the loonie.
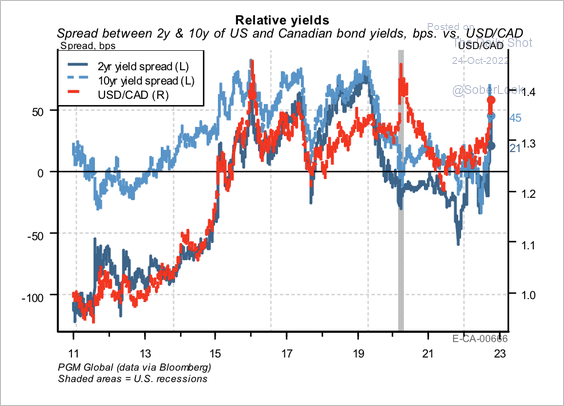 Source: PGM Global
——————–
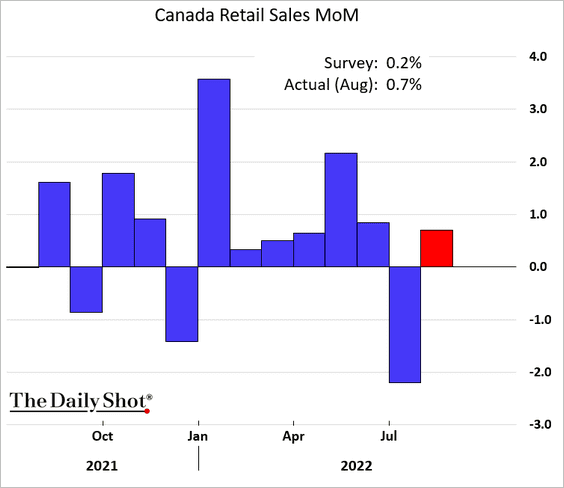
2. Retail sales were stronger than expected in August.
4. Markets expect Canada to have a lower terminal rate than the US.
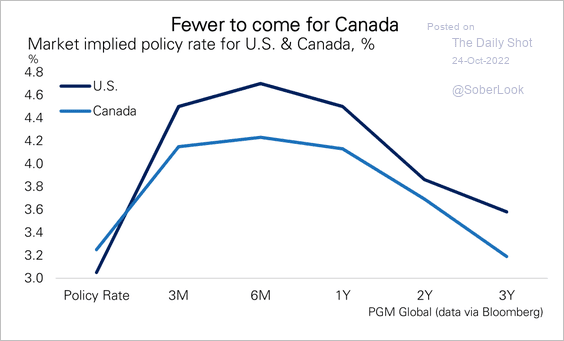 Source: PGM Global
Back to Index
The United States
1. Fed officials are starting to discuss slowing their rate hikes.
 Source: Reuters Read full article
 Source: Reuters Read full article
• Yields declined, and the Treasury curve steepened in response.
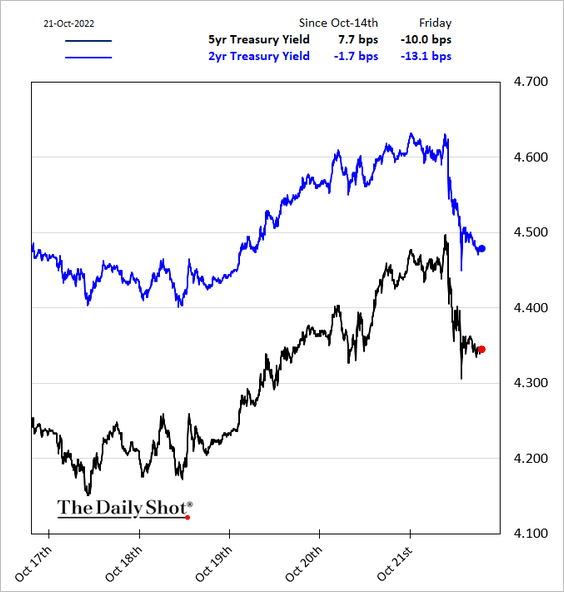
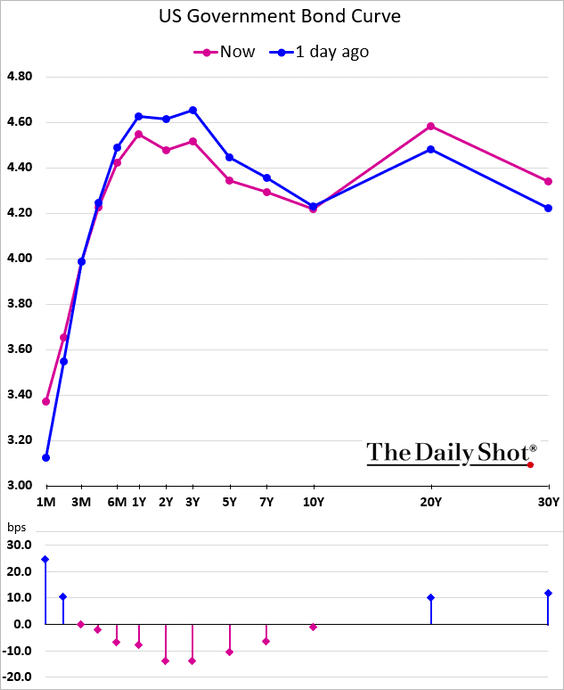
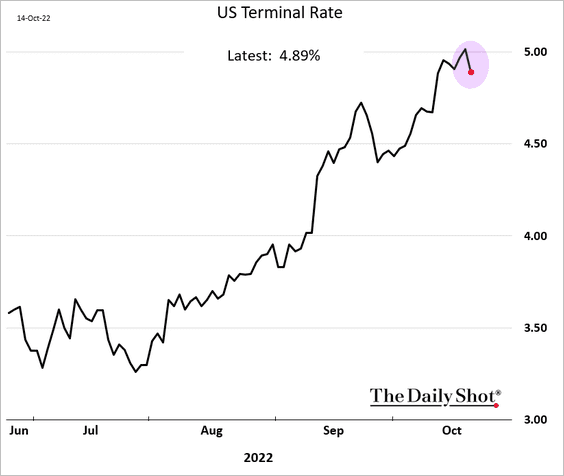
• The terminal rate came off the 5% level.
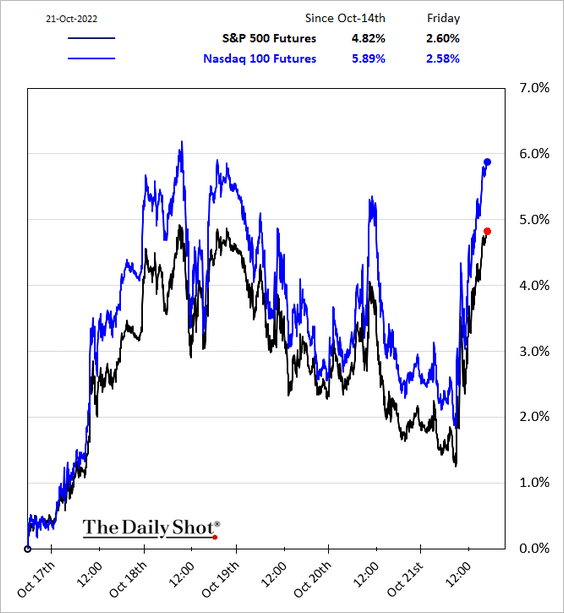
• Equities surged.
——————–
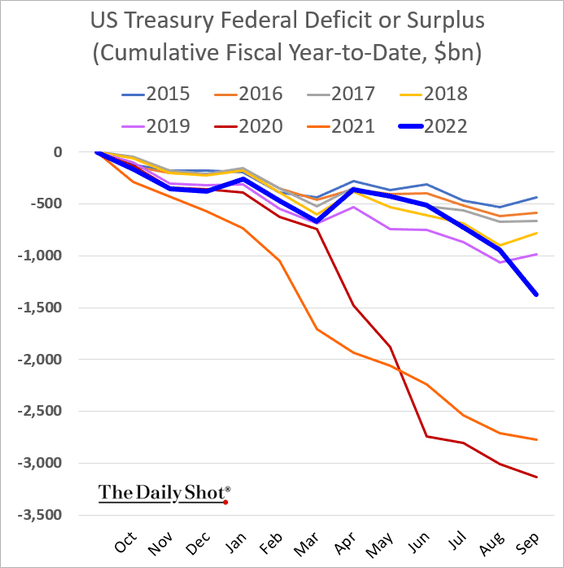
2. The federal budget deteriorated last month, mostly due to additional outlays for the student loan forgiveness program.
——————–
3. Next, we have some updates on inflation.
• The Fed’s index of inflation expectations (see “further reading” below):
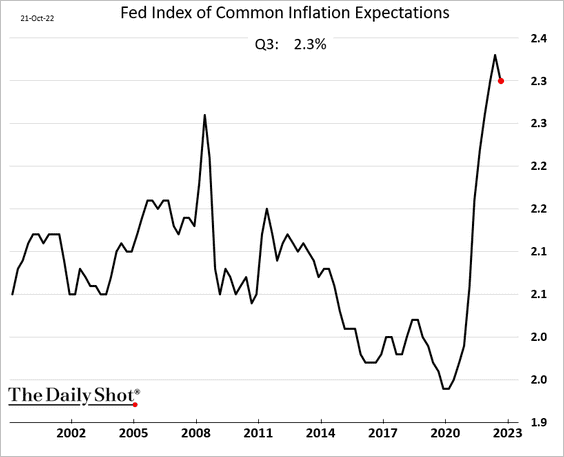 Further reading
• BofA’s CPI forecast:
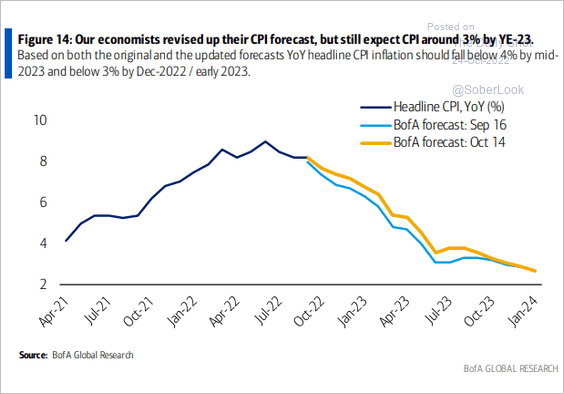 Source: BofA Global Research
• The CPI vs. small business price plans:
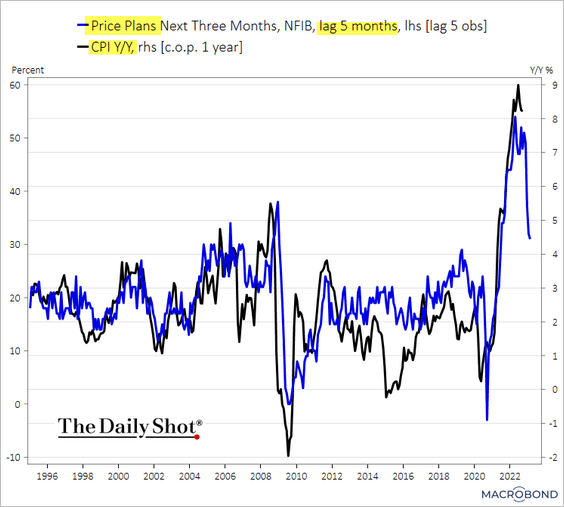 Source: Chart and data provided by Macrobond
• Commodity markets and food & energy inflation:
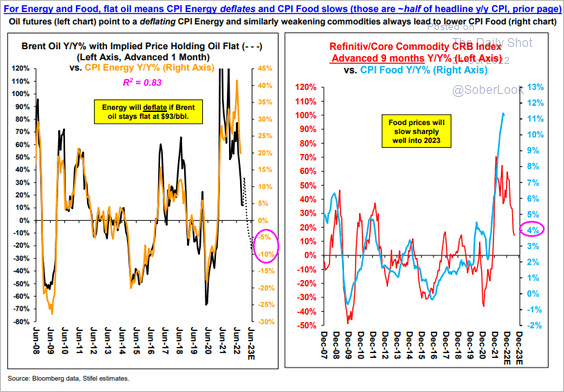 Source: Stifel
• Container imports:
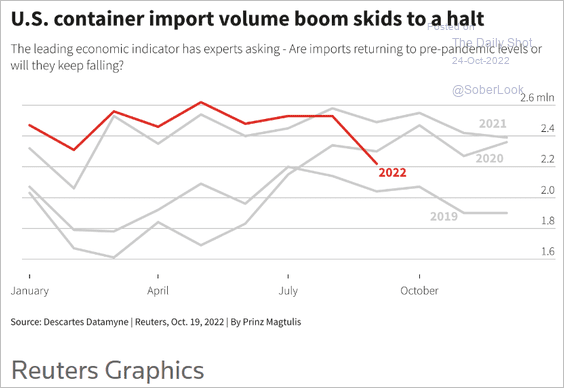 Source: Reuters Read full article
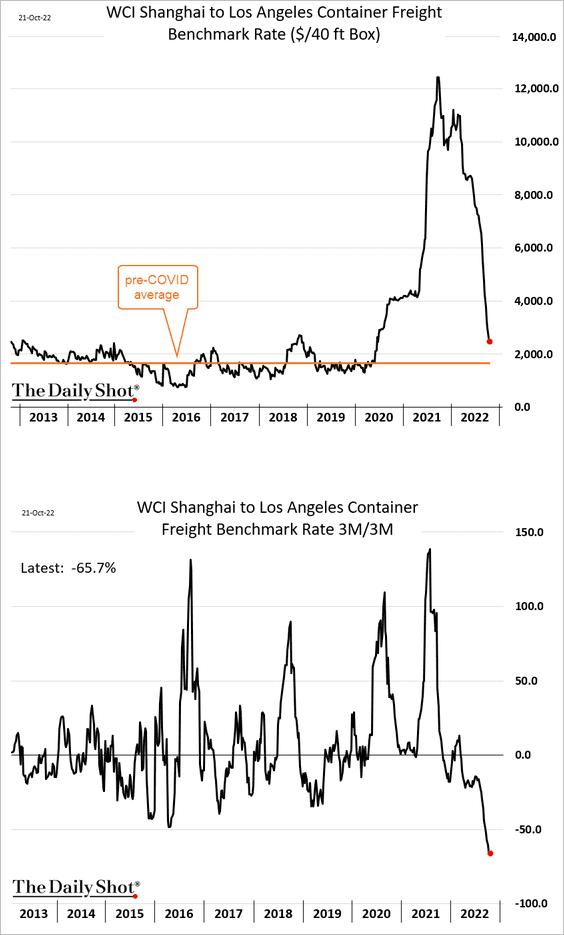
– Container freight costs:
——————–
4. Services wage growth has been outpacing other sectors.
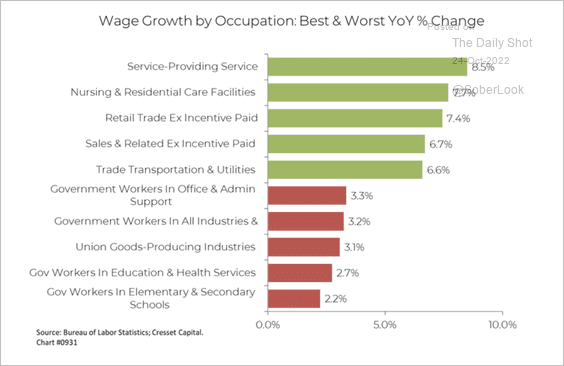 Source: Cresset Capital
5. The Evercore ISI company survey has been trending lower but remains above pre-COVID levels (2nd panel is a longer time series of the same index).
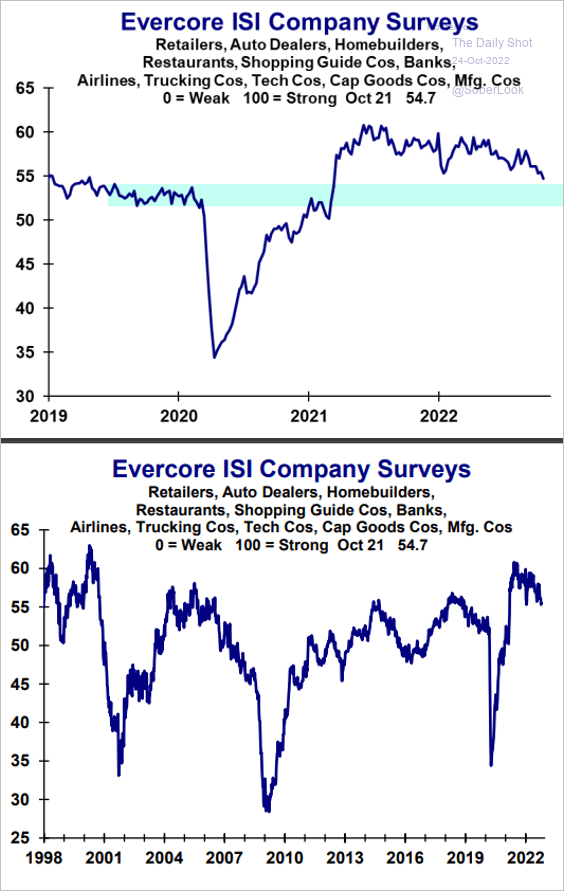 Source: Evercore ISI Research
Back to Index
Emerging Markets
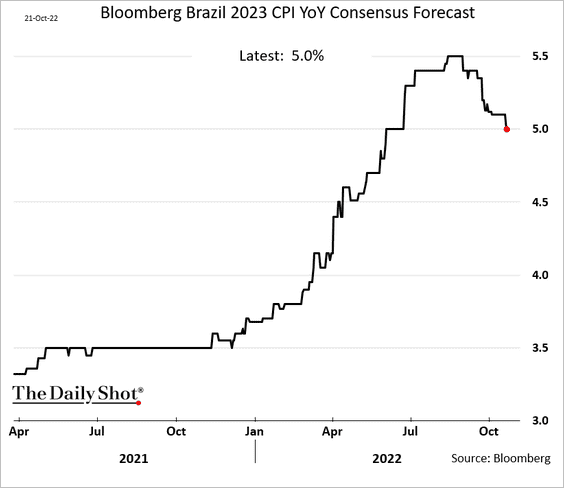
1. Economists have been downgrading their 2023 CPI forecasts for Brazil.
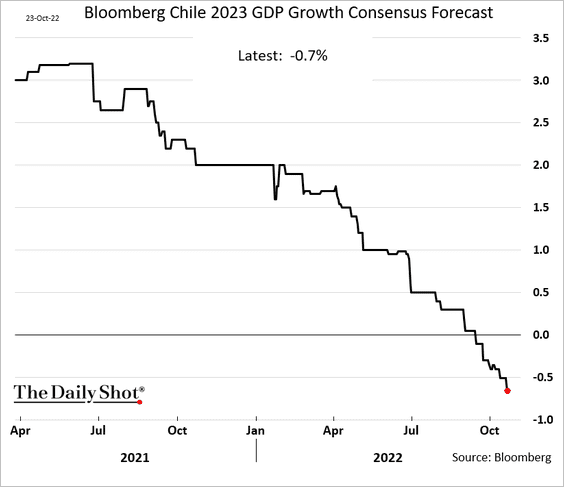
2. On the other hand, Chile’s CPI forecasts continue to surge, …
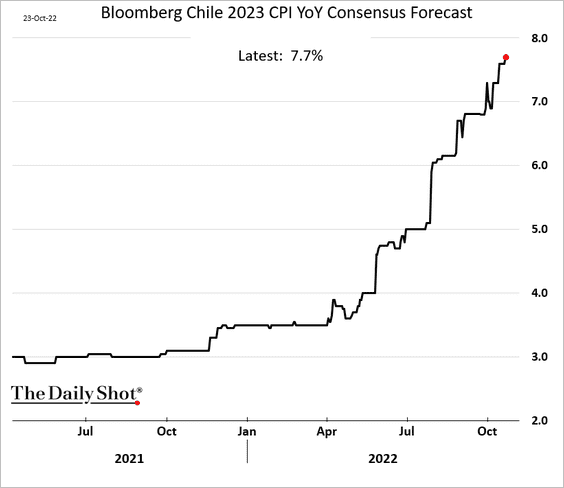
… while GDP estimates for the full year are tumbling. Stagflation is coming.
——————–
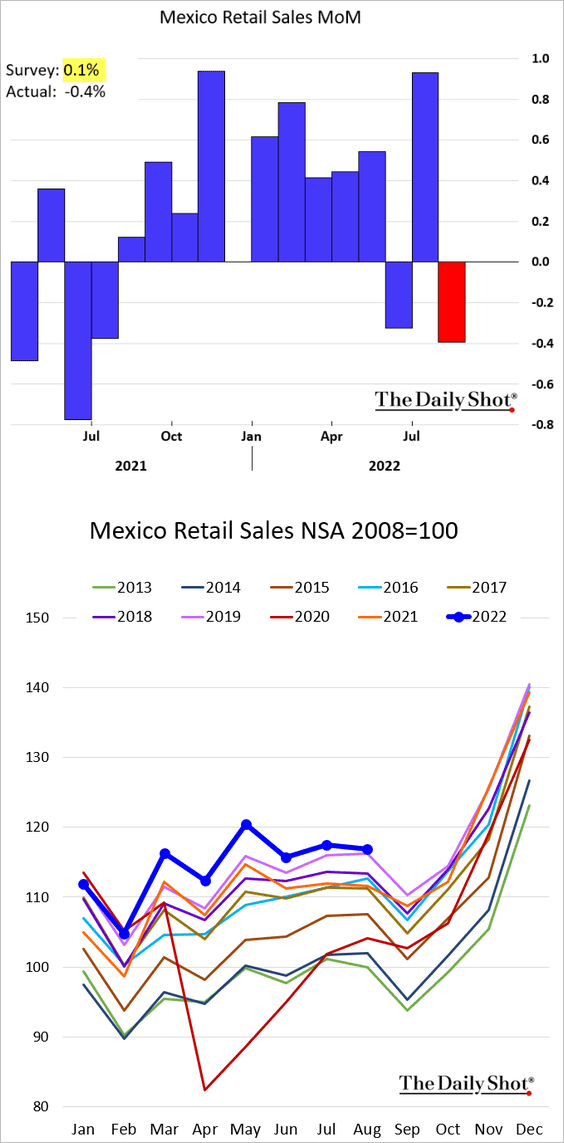
3. Mexico’s August retail sales surprised to the downside.
4. Accessibility to financial services has improved over the past decade.
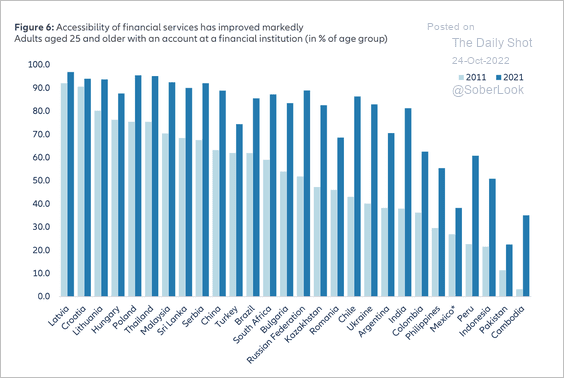 Source: Allianz Research
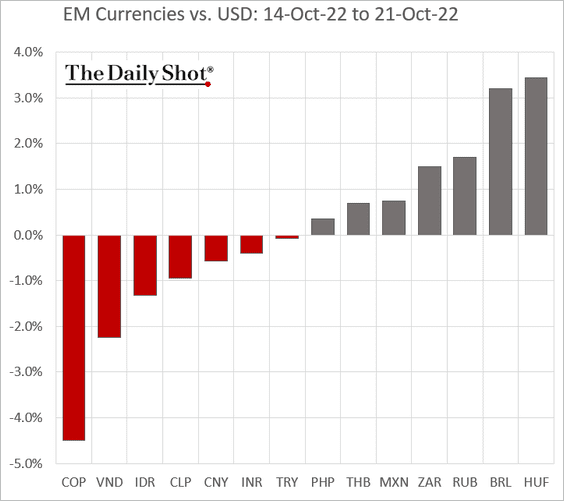
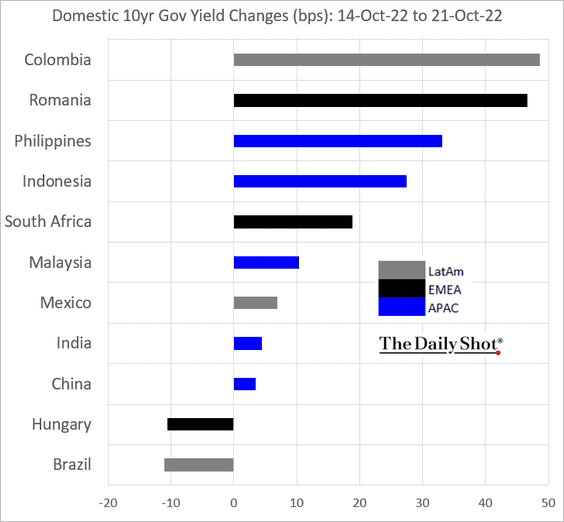
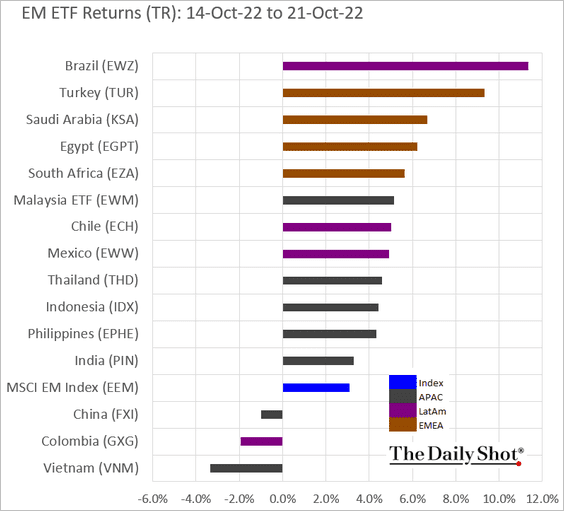
5. Next, we have some performance data from last week.
• Currencies:
• Bond yields:
• Equity ETFs:
Back to Index
Commodities
1. Bloomberg’s commodity index is at support.
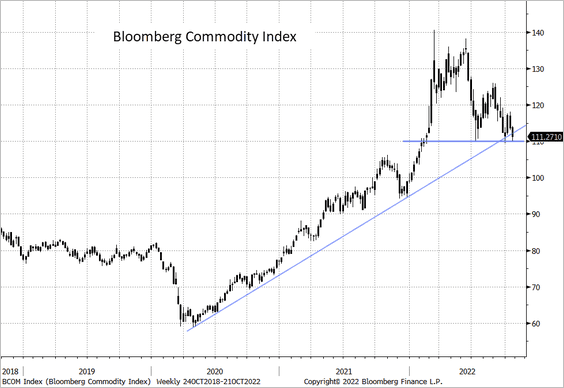 Source: @TheTerminal, Bloomberg Finance L.P.
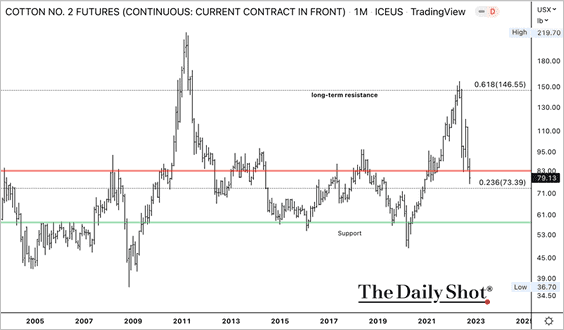
2. Cotton futures failed to break above long-term resistance. The front-month contract is back around average price levels.
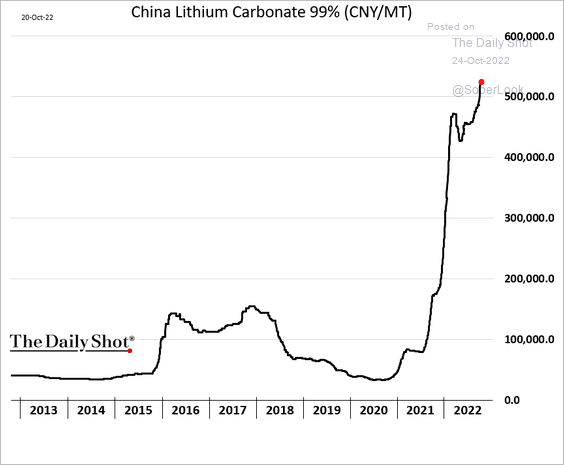
3. Litimum prices have resumed their climb.
 Source: @PredictIt
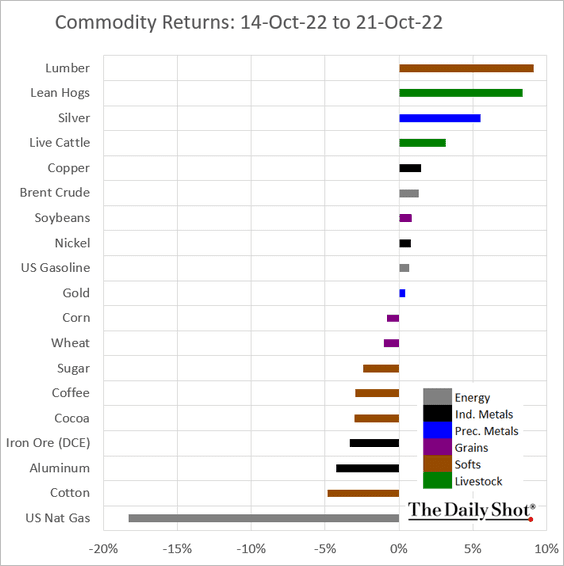
4. Here is last week’s performance across key commodity markets.
Back to Index
Energy
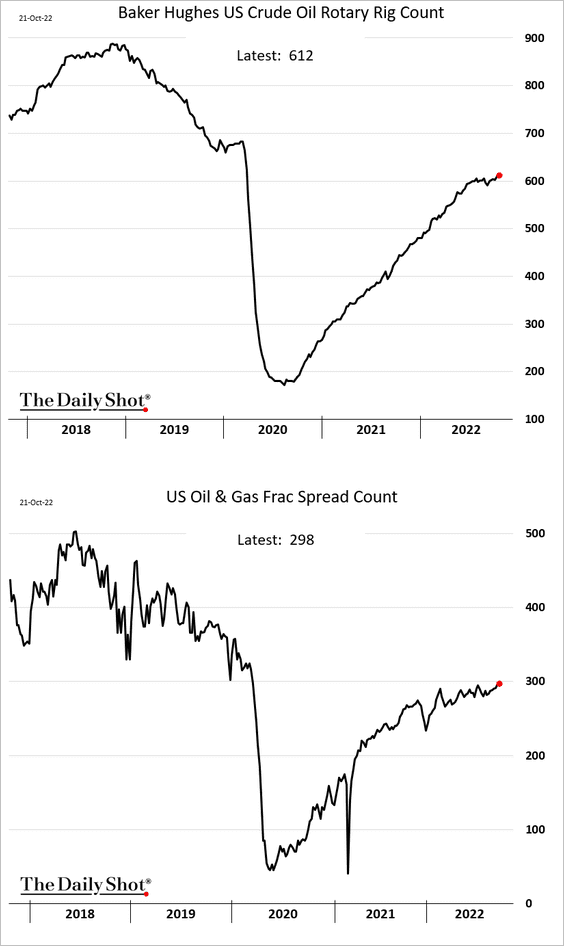
1. US fracking activity started increasing again in recent weeks.
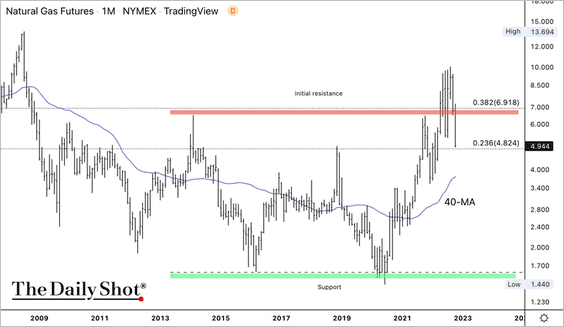
2. The NYMEX Natural Gas front-month futures contract failed to break above long-term resistance. Stronger support is seen around the 40-month moving average.
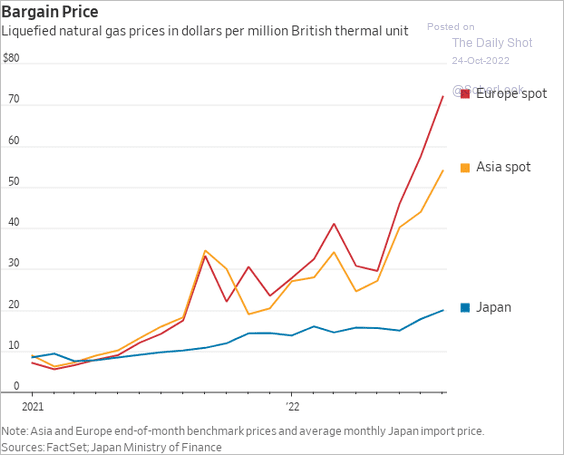
3. Global LNG prices have been climbing.
 Source: @WSJ Read full article
Back to Index
Equities
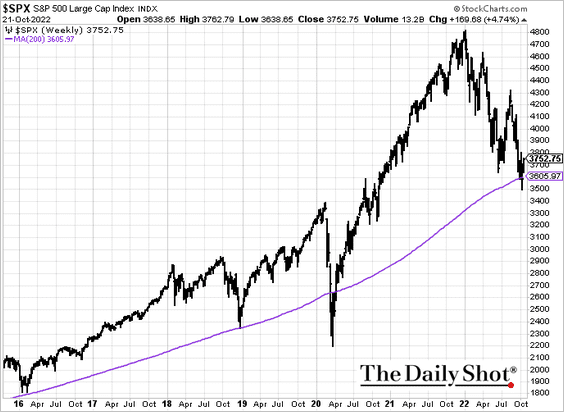
1. The S&P 500 is holding support at the 200-day moving average.
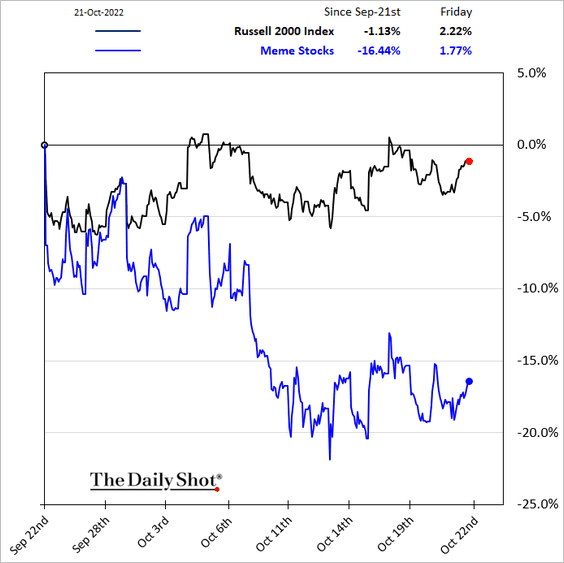
2. The Reddit crowd isn’t jumping into this market bounce.
3. Bullish options activity has been low, …
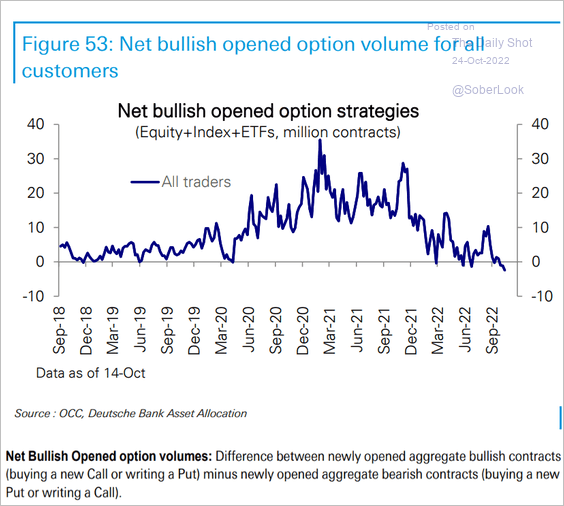 Source: Deutsche Bank Research
… but there has been a great deal of demand for index call options as underinvested institutions feel some FOMO (concerns about missing the rebound).
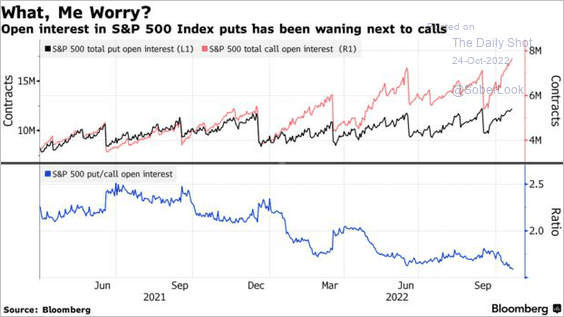 Source: @jessefelder Read full article
We can see a bit of FOMO among investment managers.
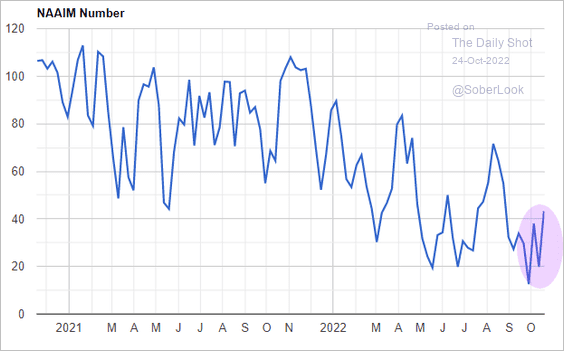 Source: NAAIM
——————–
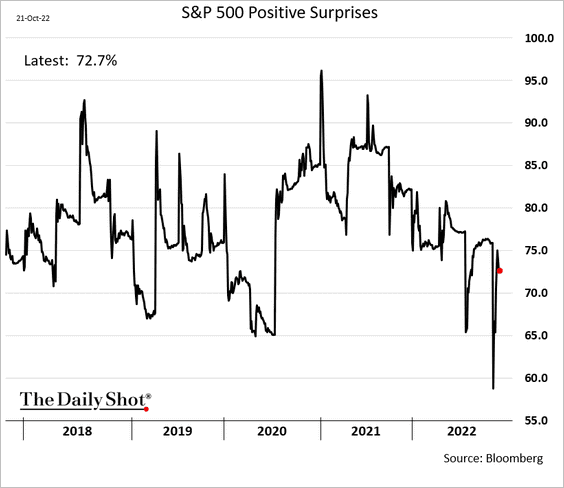
4. Positive earnings surprises are running above 70% amid depressed expectations.
• 2023 earnings projections are still too high. Market fundamentals remain weak.
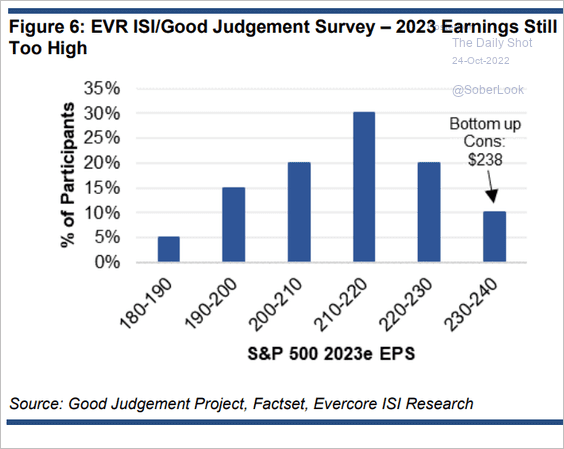 Source: Evercore ISI Research
——————–
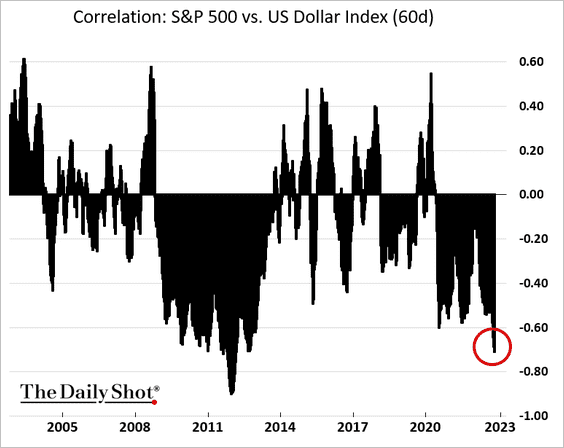
5. Stocks have been highly anti-correlated to the US dollar recently.
6. Financial-sector flows appear to have bottomed.
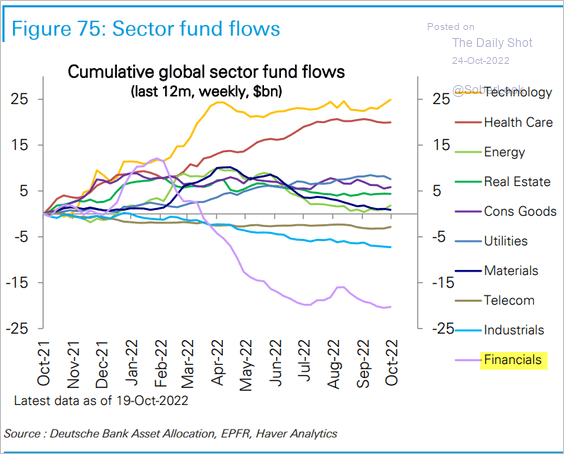 Source: Deutsche Bank Research
7. Stocks tend to do well in the third year following the US midterm elections. (2 charts)
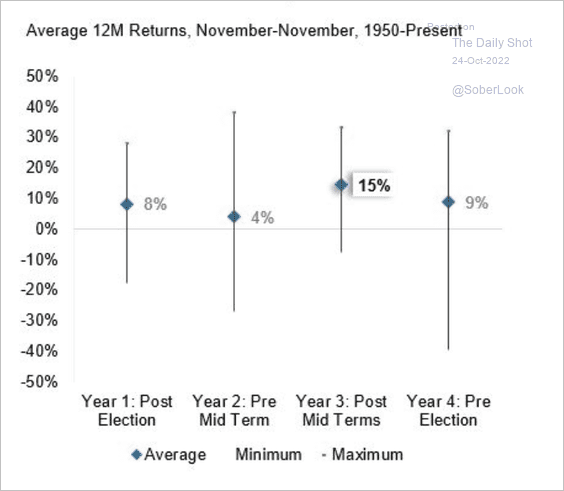 Source: Denise Chisholm; Fidelity Investments
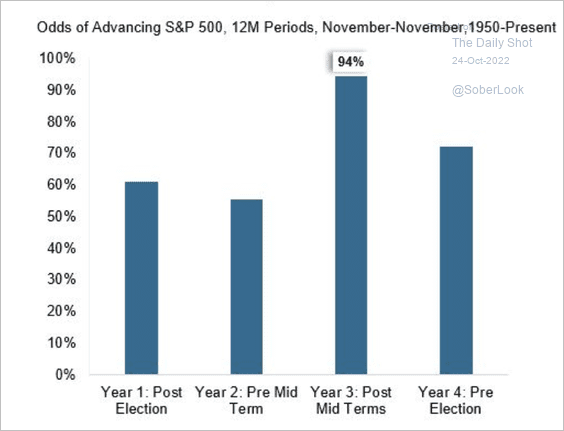 Source: Denise Chisholm; Fidelity Investments
——————–
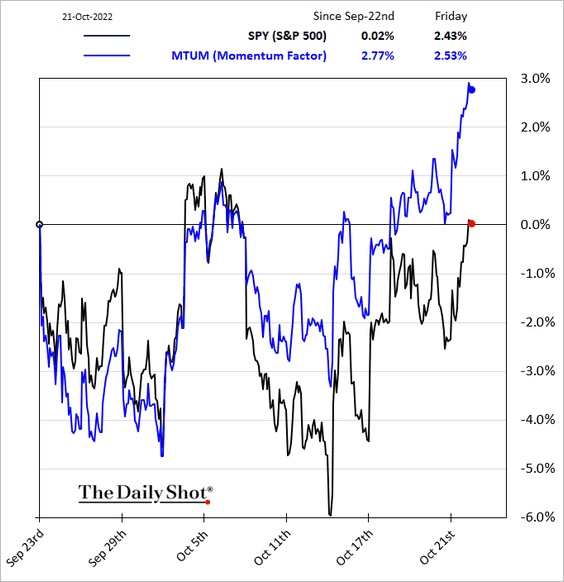
8. Value has been outperforming growth.
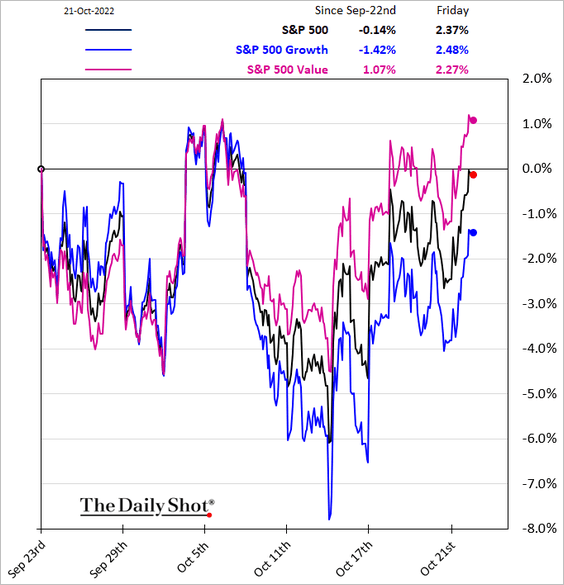
The momentum factor has been outperforming the broader market.
——————–
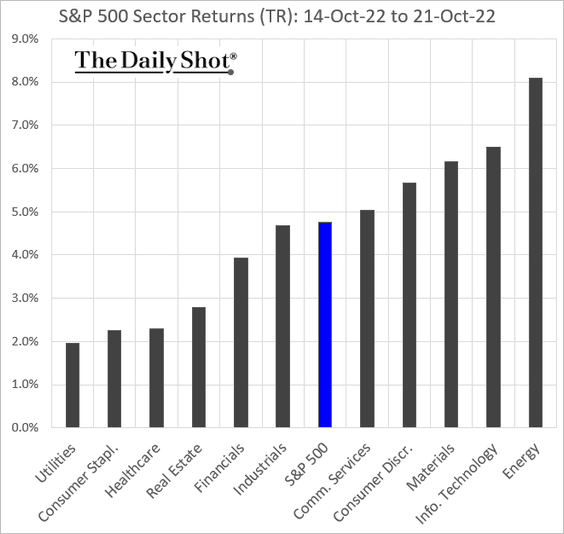
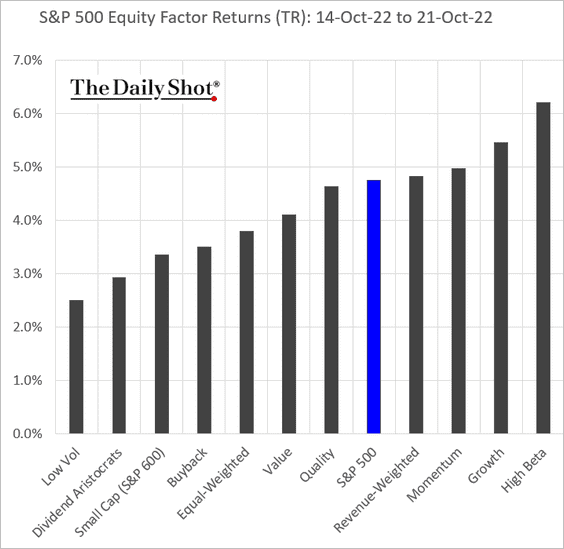
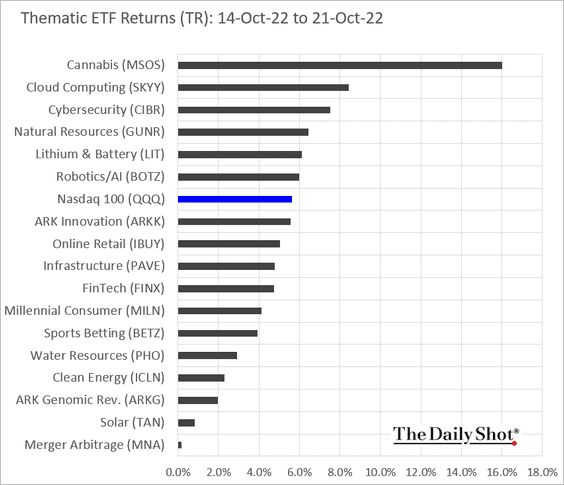
9. Finally, we have some performance data from last week.
• Sectors:
• Equity factors:
• Thematic ETFs:
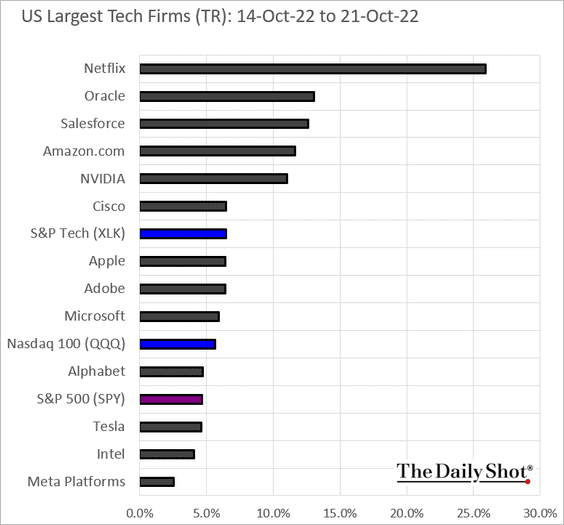
• Largest US tech firms:
Back to Index
Credit
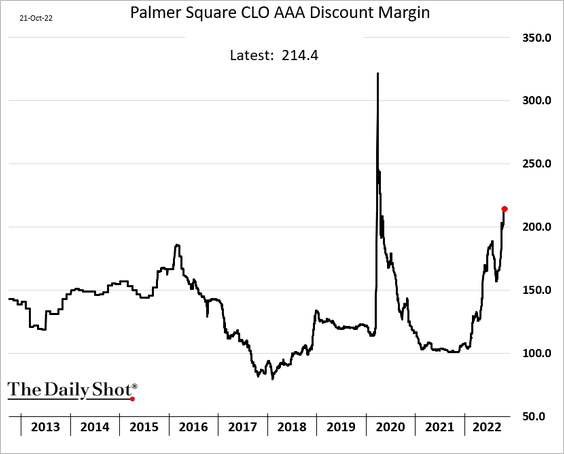
1. The CLO market has been struggling after the biggest AAA tranche buyer exited, and UK pension funds became forced sellers.
 Source: Bloomberg Law Read full article
Spreads continue to widen.
——————–
2. Companies are raising capital for distressed purchases.
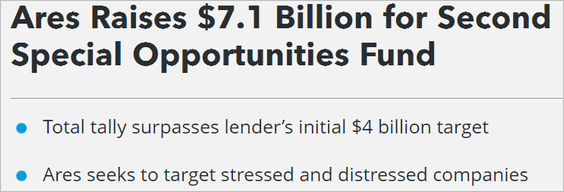 Source: Bloomberg Law Read full article
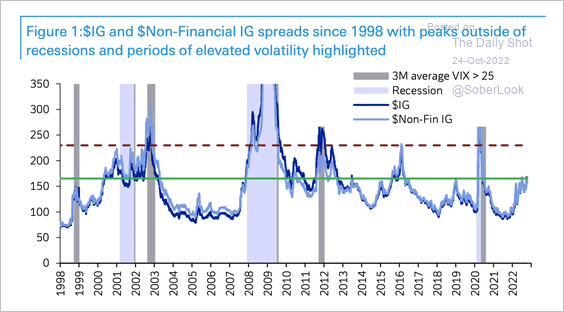
3. US investment-grade spreads have seen peaks of about 165 basis points multiple times over the past decade.
 Source: Deutsche Bank Research
4. Merrill Lynch’s private clients have been dumping IG debt.
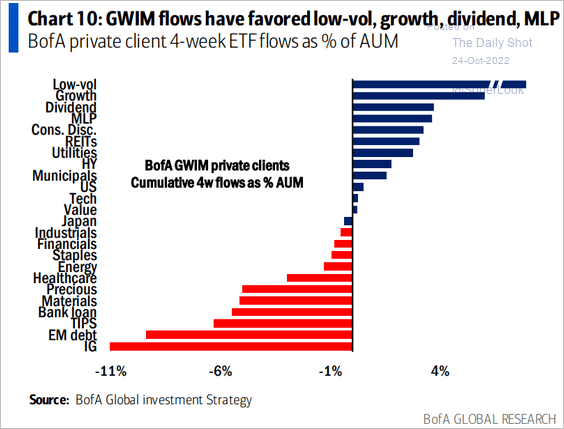 Source: BofA Global Research
5. Financials’ spreads are wide relative to the overall IG market.
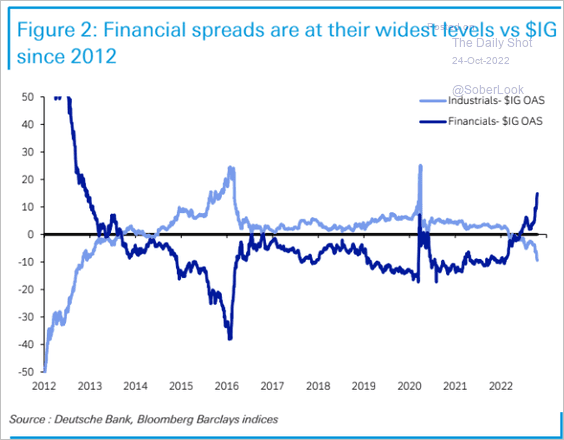 Source: Deutsche Bank Research
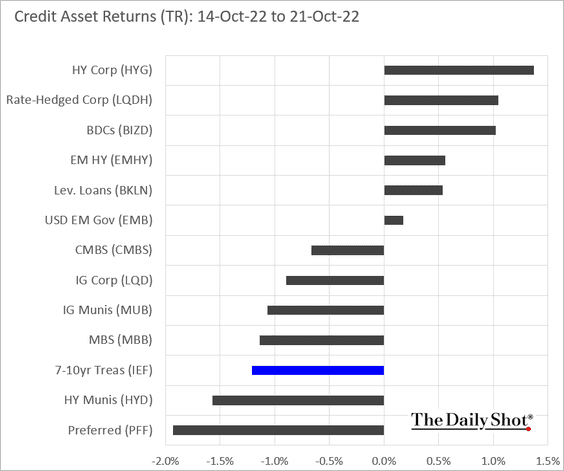
6. Finally, we have last week’s performance across credit asset classes.
Back to Index
Rates
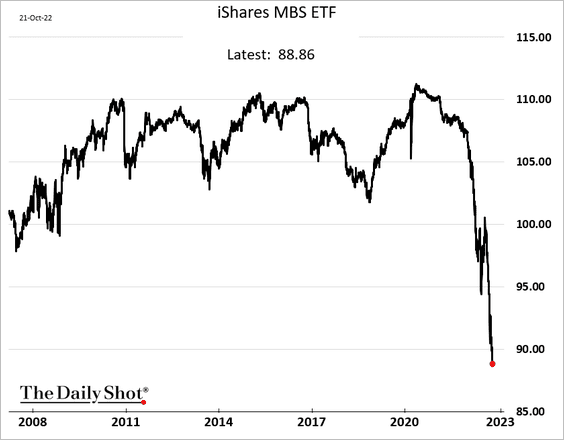
1. The drawdown in long-term Treasuries continues to deepen.
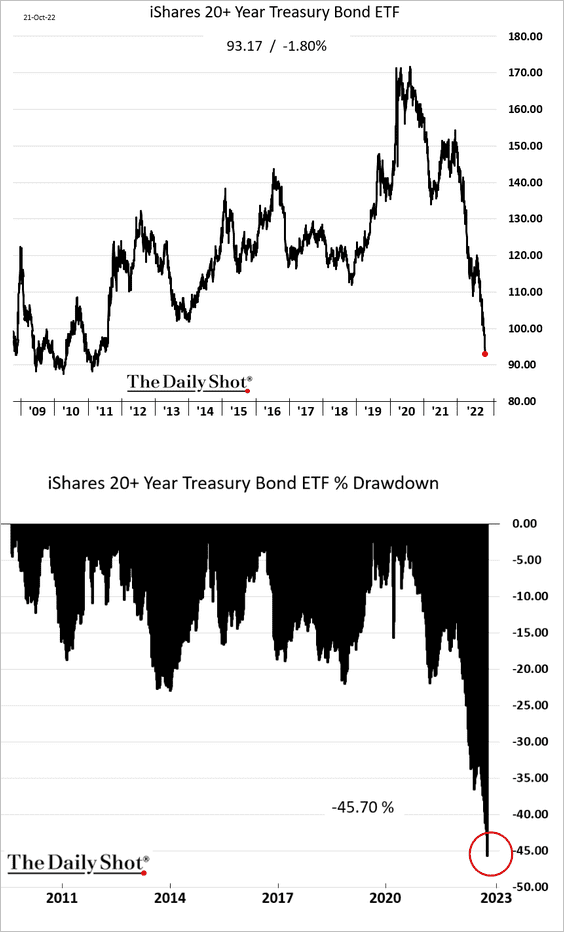
MBS debt has also been under pressure, pushing up mortgage rates.
——————–
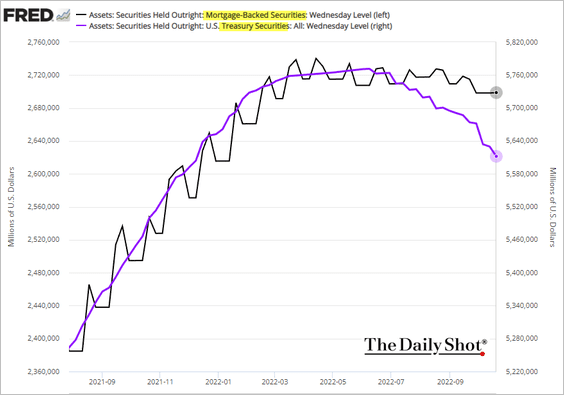
2. The Fed’s balance sheet decline remains driven mostly by Treasury debt.
Back to Index
Global Developments
1. This chart shows the asset structure of households by region.
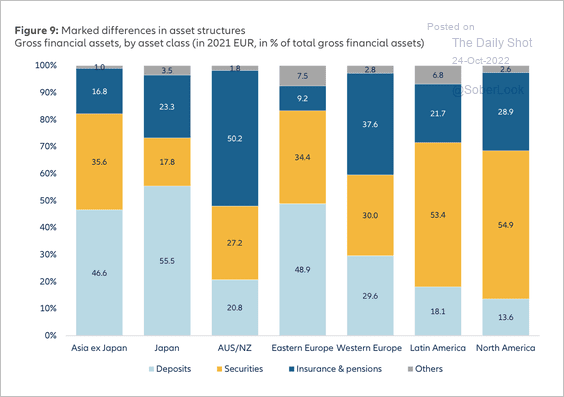 Source: Allianz Research
2. Next, we have the US, UK, and EMU CPI projections from Barclays Research.
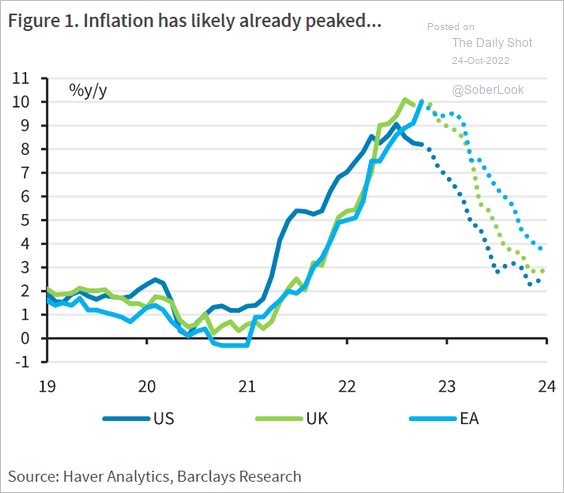 Source: Barclays Research
3. The secondhand luxury watch bubble continues to deflate.
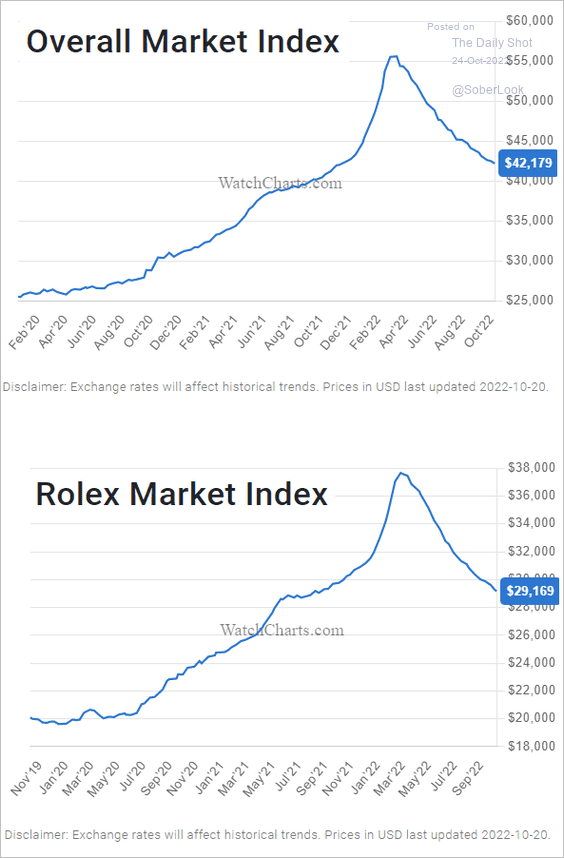 Source: WatchEnthusiasts
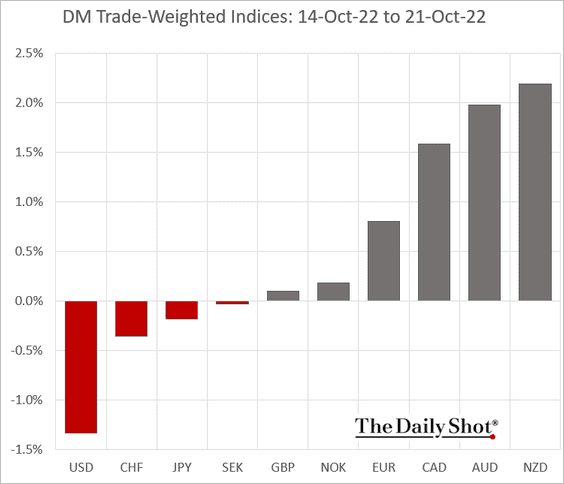
4. Finally, we have some performance data from last week.
• DM currency indices:
• DM yields:
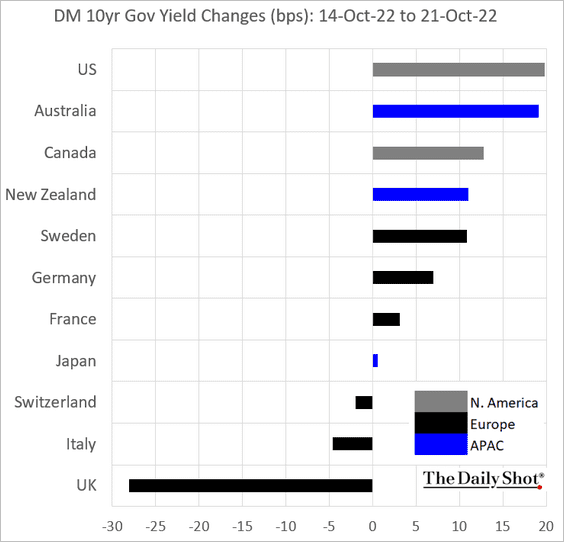
——————–
Food for Thought
1. Office foot traffic:
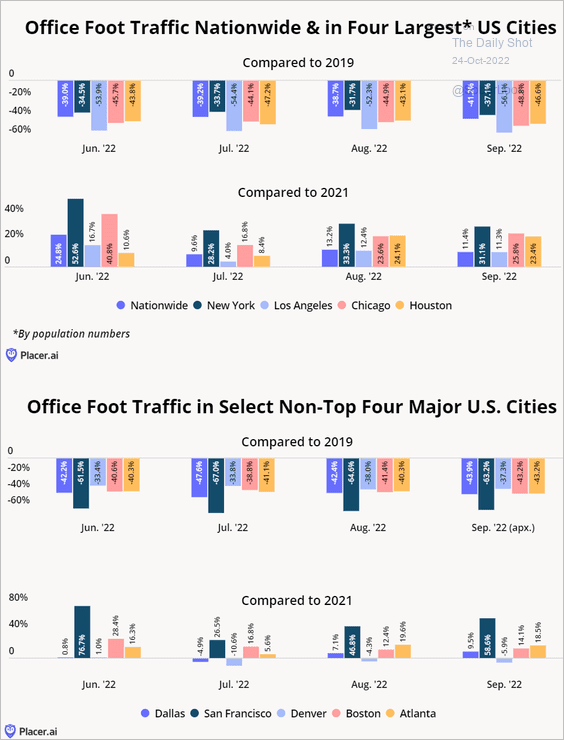 Source: Placer.ai
2. Office vacancies in major cities:
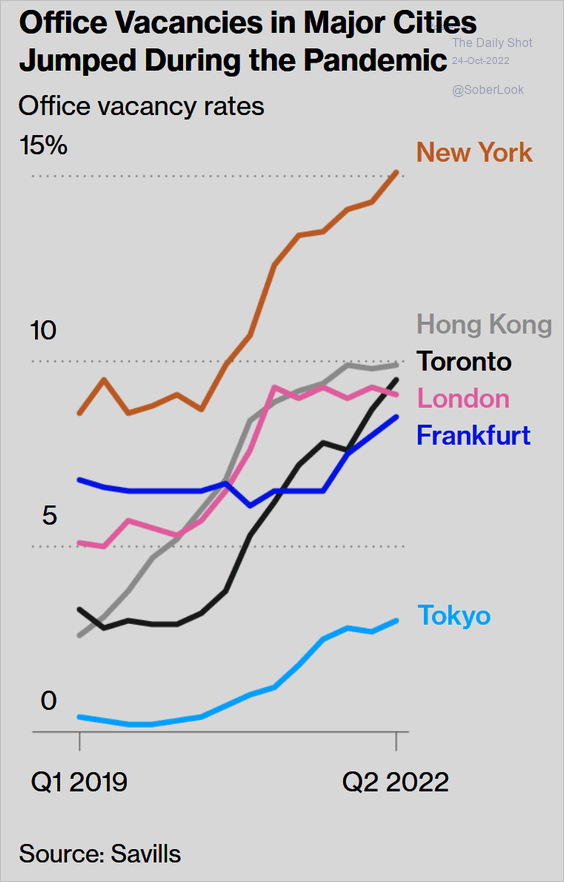 Source: @bbgvisualdata Read full article
3. Food inflation relative to the overall inflation:
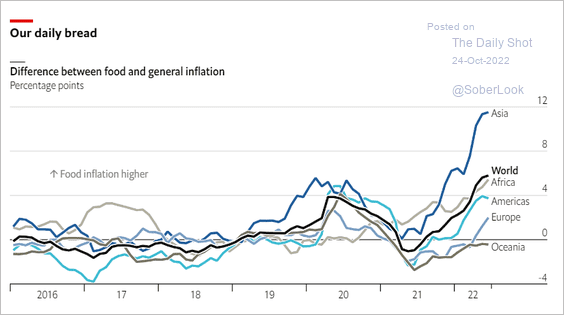 Source: The Economist Read full article
4. The shrinking middle class:
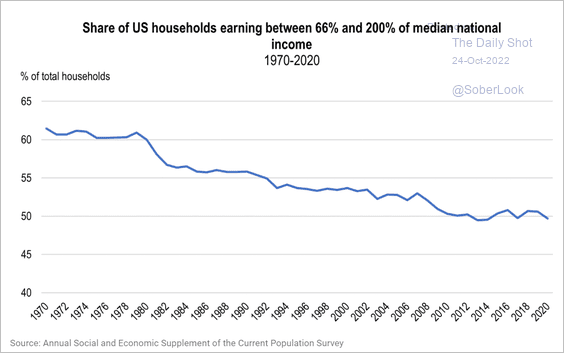 Source: OECD Read full article
5. Xi Jinping’s rise to power:
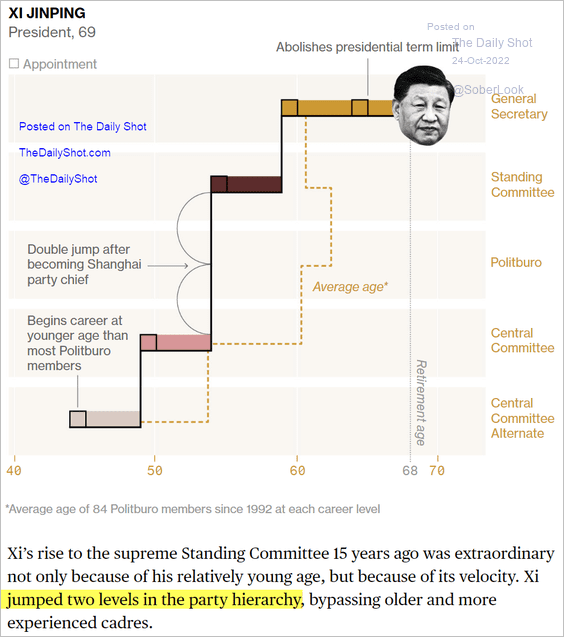 Source: Bloomberg Read full article
6. Putin’s approval ratings:
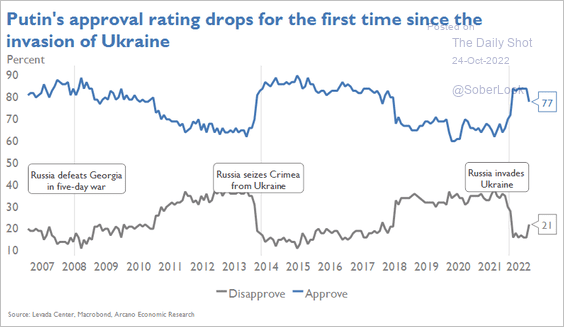 Source: Arcano Economics
7. Distribution of mammals on Earth:
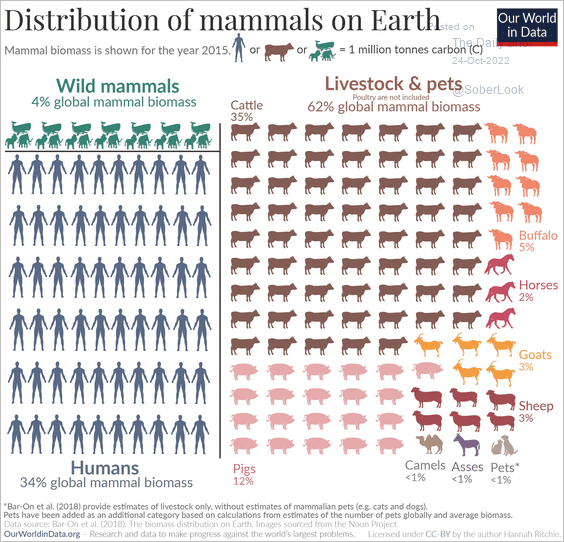 Source: Our World In Data
——————–
Back to Index