
The Daily Shot: 28-Oct-22
• The United States
• Canada
• The United Kingdom
• The Eurozone
• Europe
• Japan
• Asia – Pacific
• China
• Emerging Markets
• Energy
• Equities
• Credit
• Global Developments
• Food for Thought
The United States
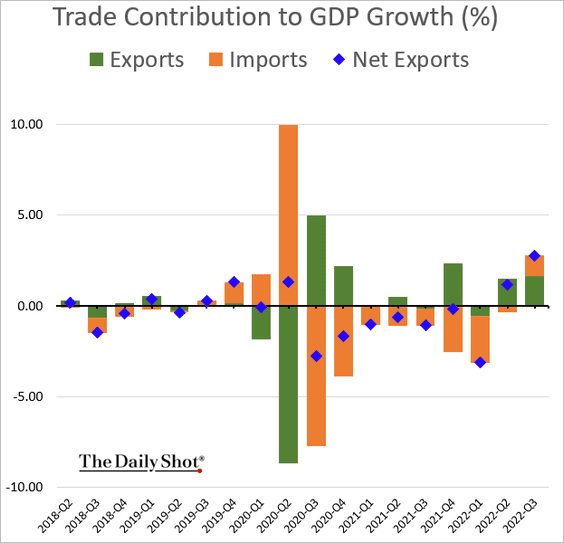
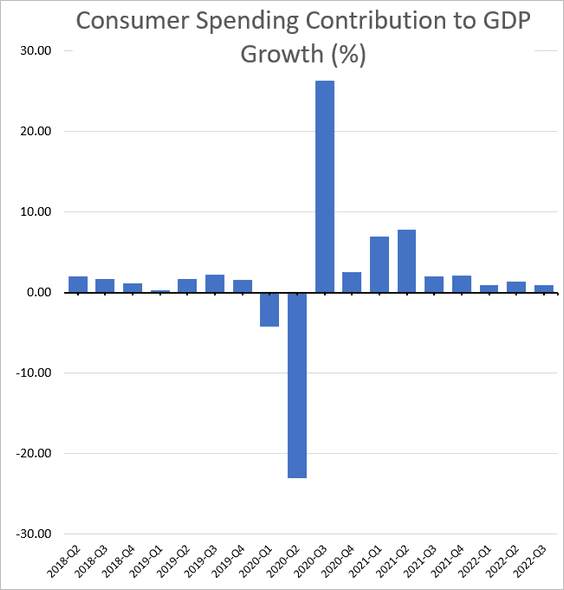
1. The third-quarter GDP growth was a bit better than expected, …
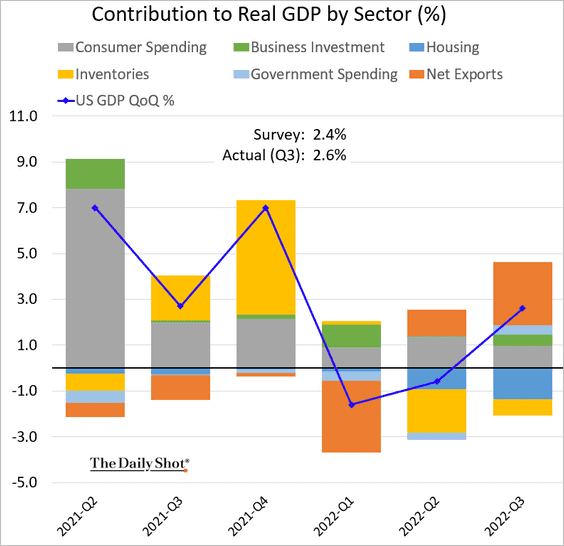
… with net exports driving a significant portion of the increase. Imports declined last quarter for the first time since Q2 of 2020, boosting net exports.
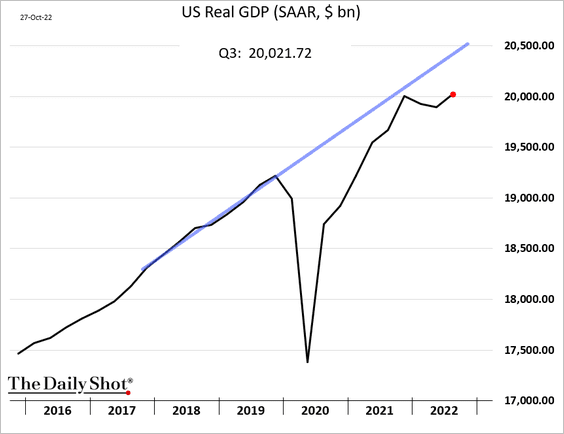
Here is the GDP level.
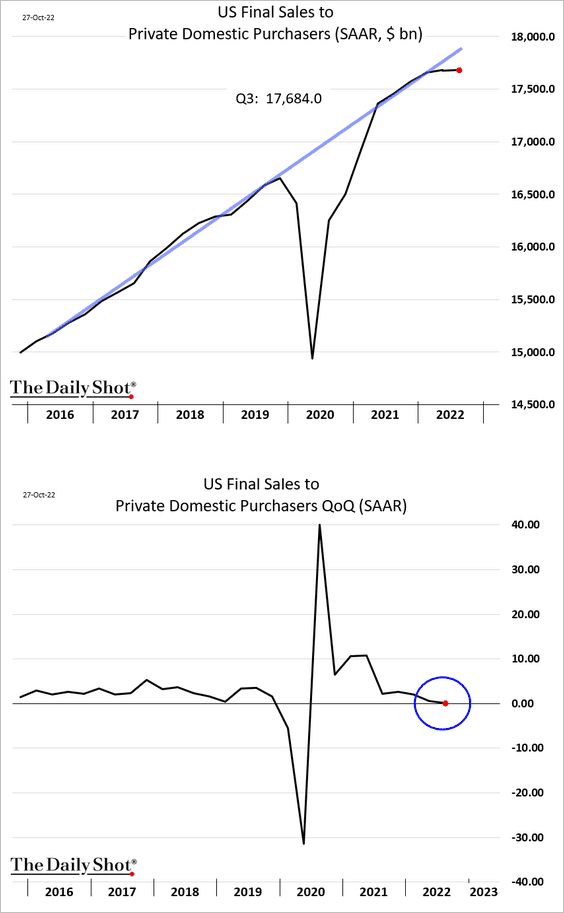
• However, final sales to private domestic purchasers (the “core” GDP) shows that the underlying economic growth has stalled.
• Consumer spending growth is slowing.
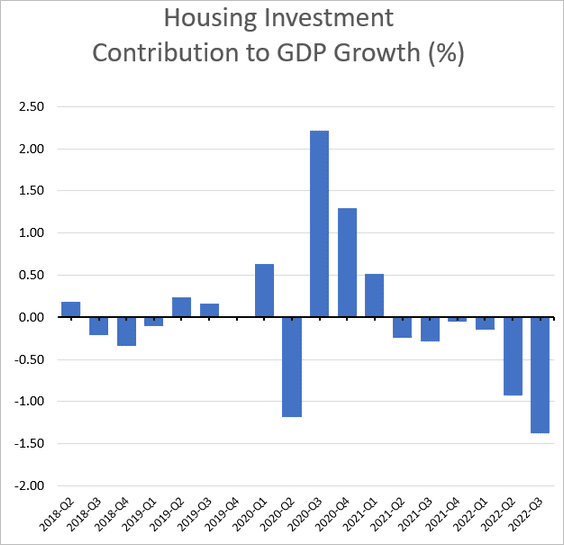
• Housing investment has been crashing.
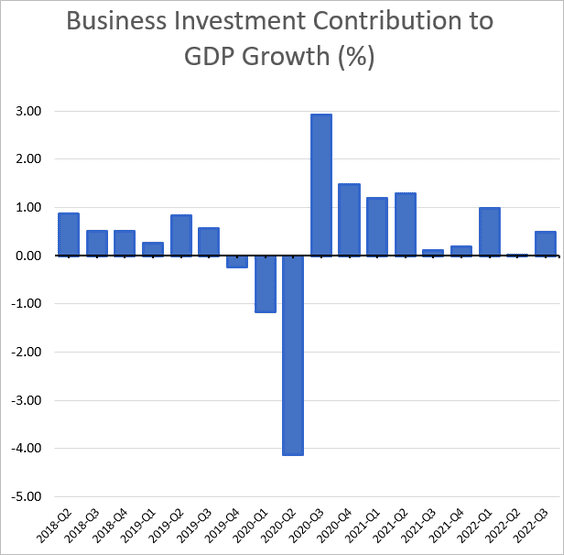
• Business investment has been growing, but that could change going forward.
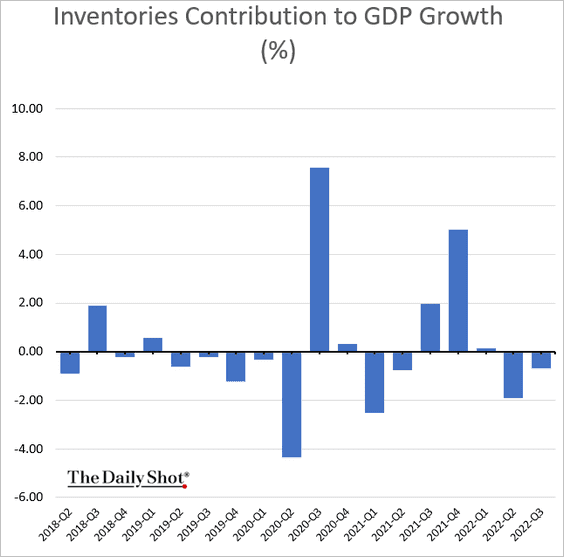
• Inventories were once again a drag on growth.
——————–
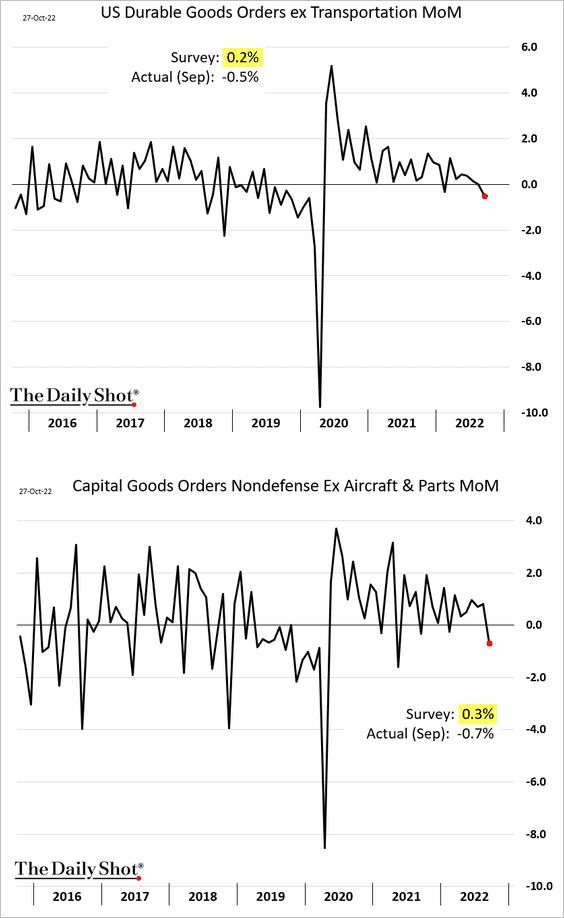
2. Durable goods orders unexpectedly declined last month.
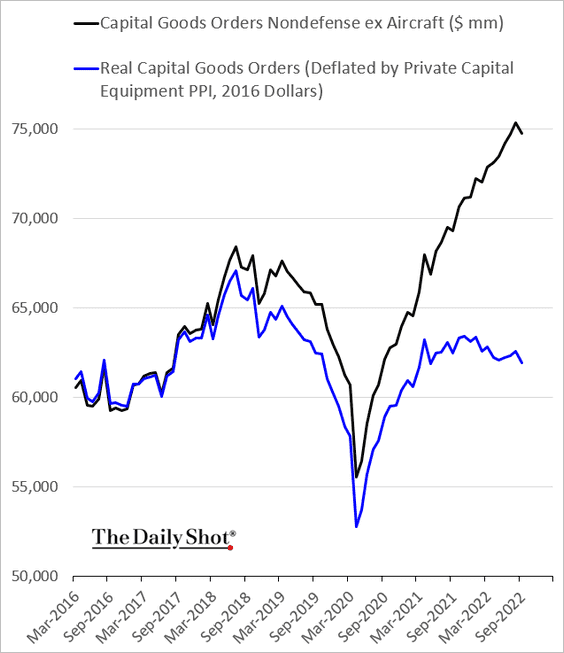
Here are the nominal and the real capital goods orders indices.
——————–
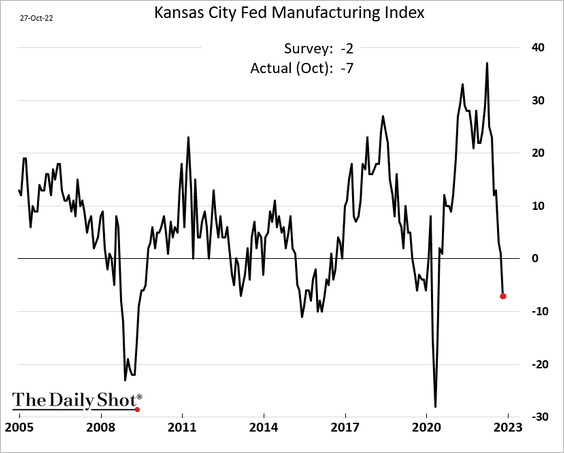
3. The Kansas City Fed’s manufacturing index showed deterioration in factory activity in the region this month.
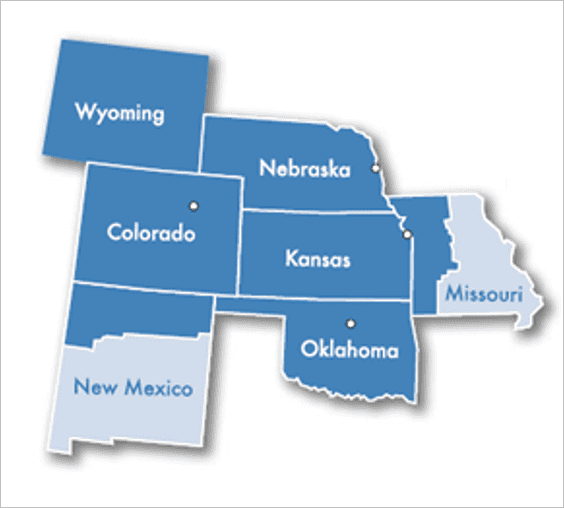
By the way, here is the Kansas City Fed’s district.
• Demand is crashing, with expectations for new orders near the GFC lows.
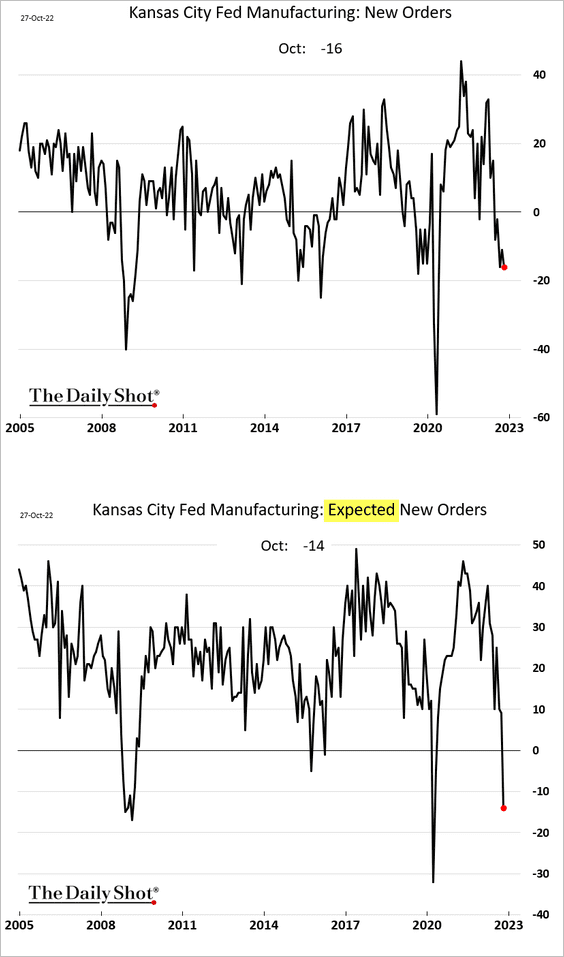
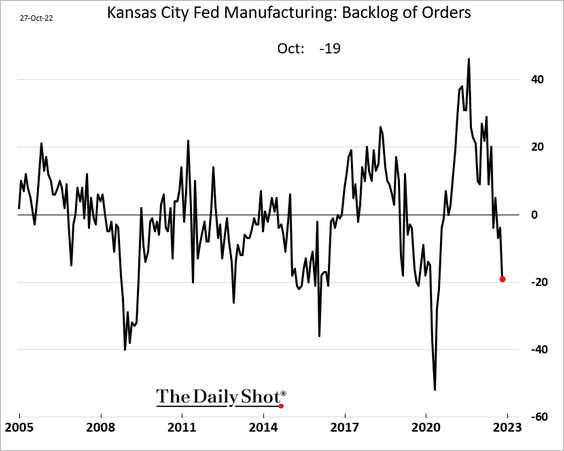
• Here is the backlog of orders index.
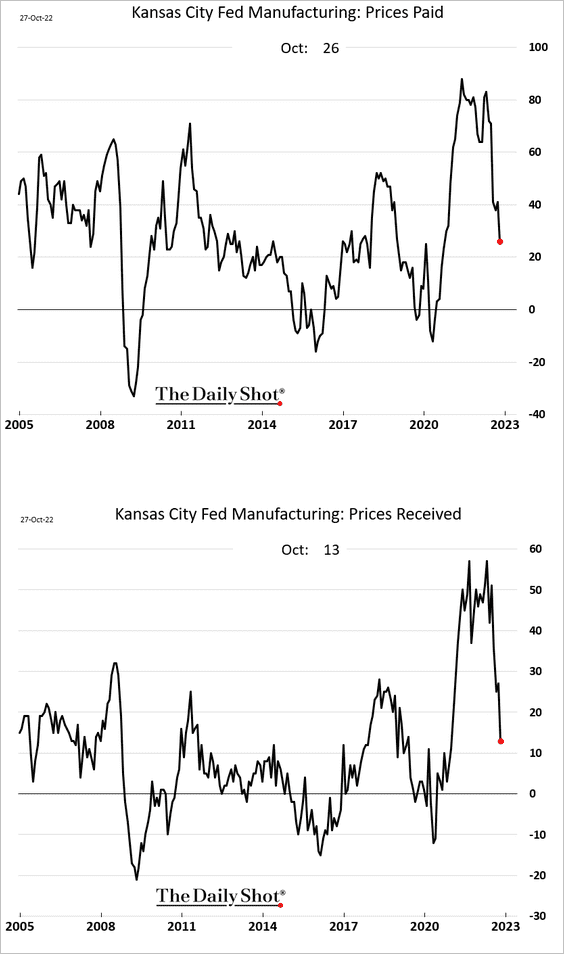
• Price pressures are moderating.
——————–
4. Soft-data (survey-based) economic surprises are turning lower, which will be showing up in hard-data surprises in the months ahead.
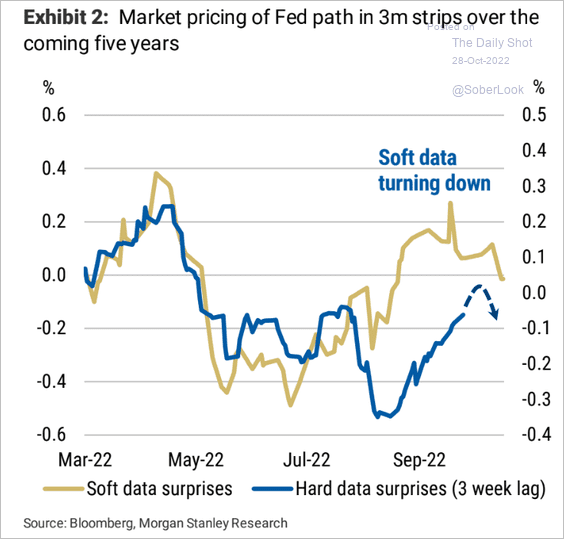 Source: Morgan Stanley Research
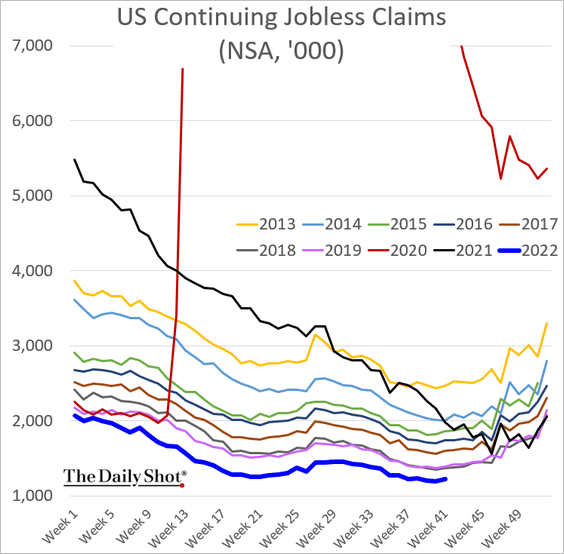
5. Jobless claims remain below pre-COVID levels, pointing to persistent strength in the labor market.
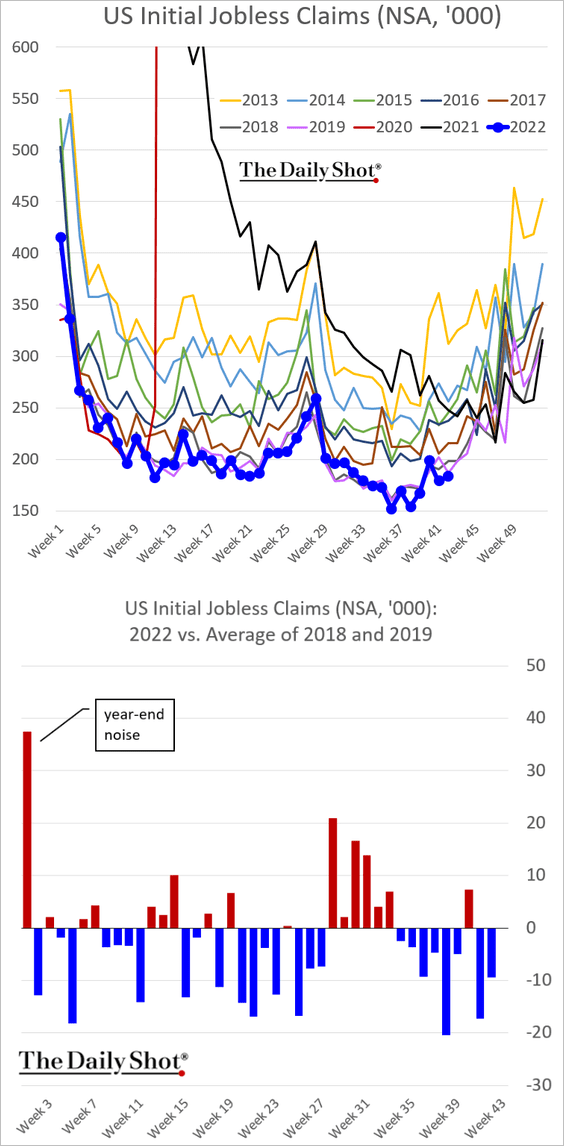
But leading indicators point to labor market weakness ahead.
 Source: Capital Economics
——————–
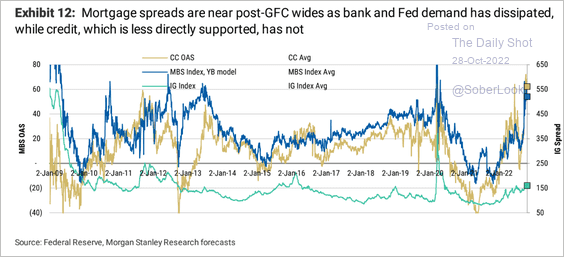
6. Next, we have some updates on the housing market.
• Mortgage rates are above 7%, …
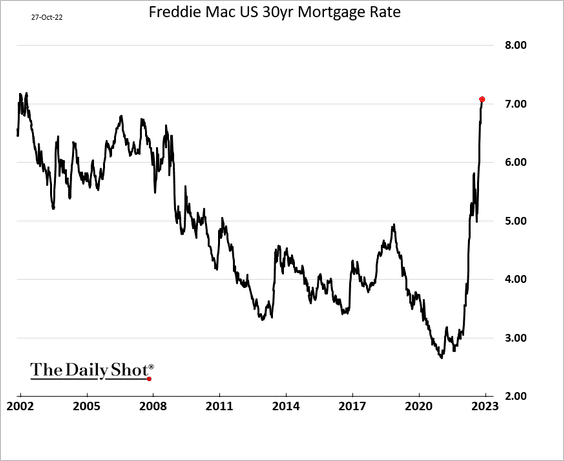
… in part due to wide spreads on mortgage-backed securities (MBS).
 Source: Morgan Stanley Research
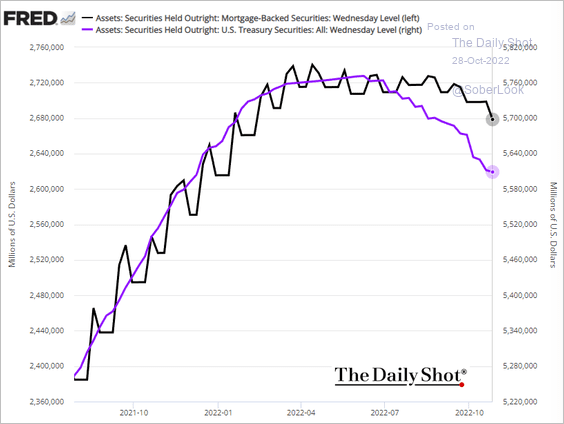
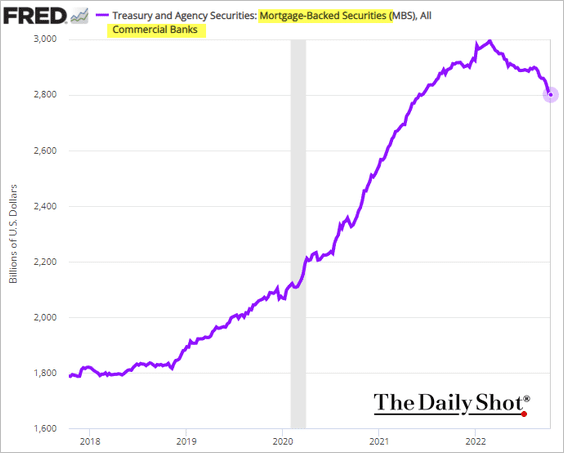
The Fed and commercial banks are no longer buyers of MBS, contributing to wider spreads.
– The Fed:
 Source: @AndreasSteno
– Commercial banks:
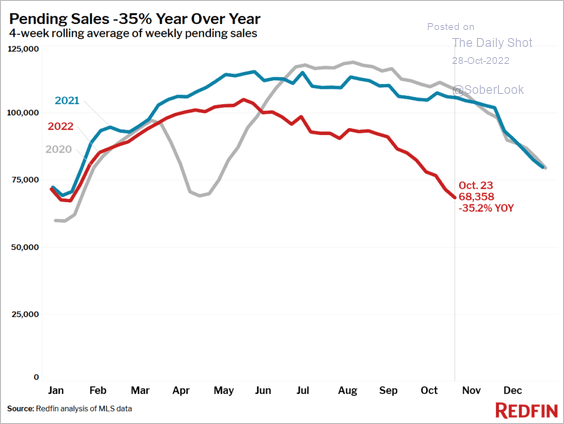
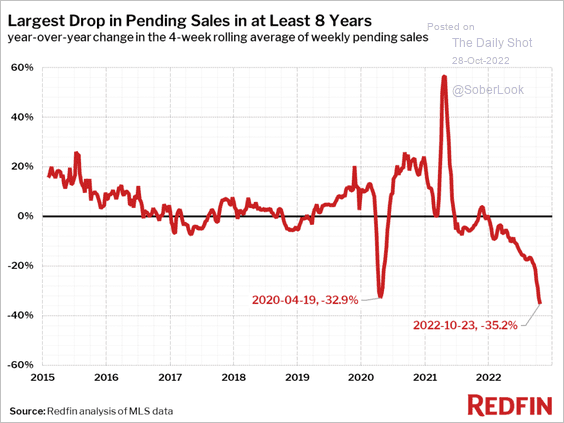
• Pending home sales are crashing (2 charts), …
 Source: Redfin
 Source: Redfin
… as housing demand deteriorates.
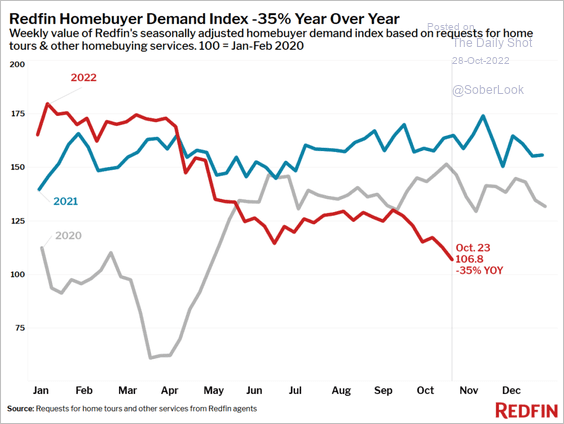 Source: Redfin
The supply has been moving higher.
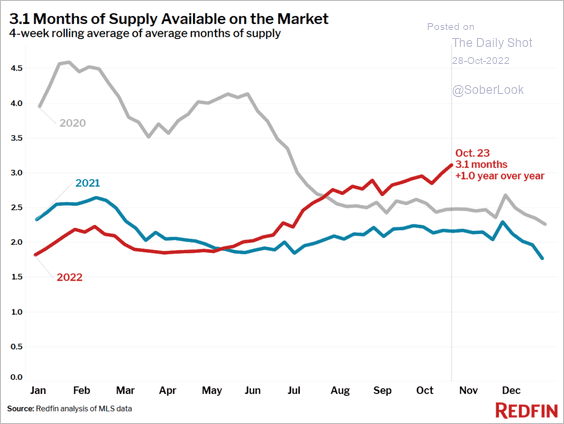 Source: Redfin
• Land prices have declined in recent months.
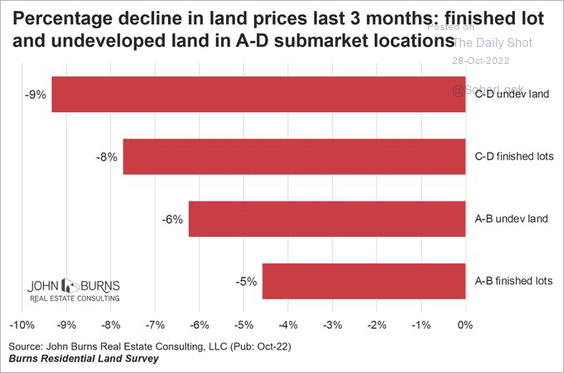 Source: @RickPalaciosJr
——————–
7. Households’ drawdown of excess savings is expected to slow next year.
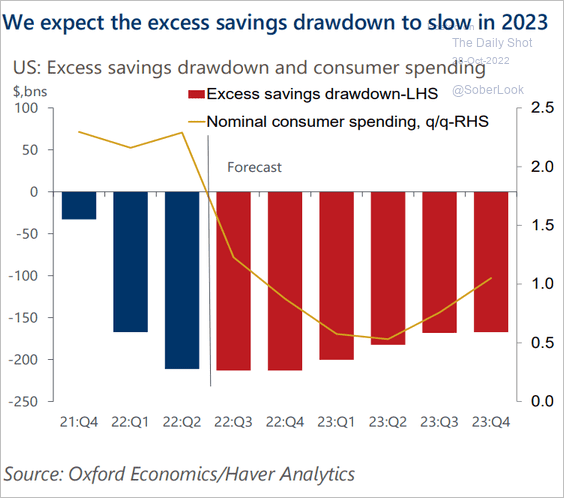 Source: Oxford Economics
Back to Index
Canada
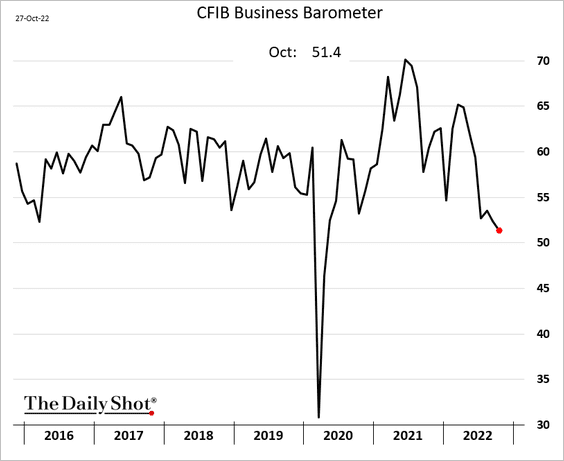
1. The CFIB small business indicator declined further this month.
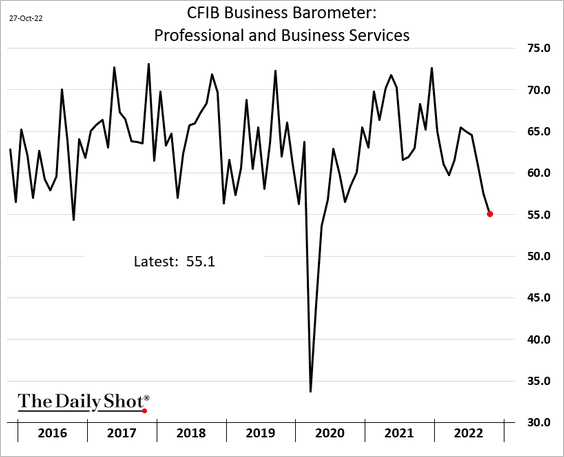
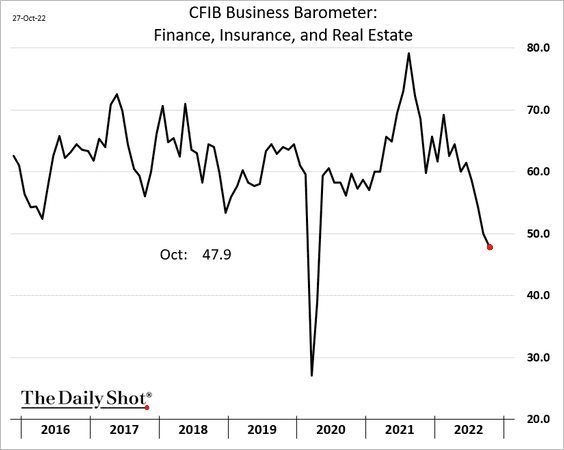
Service sectors are reporting slower activity (2 charts).
——————–
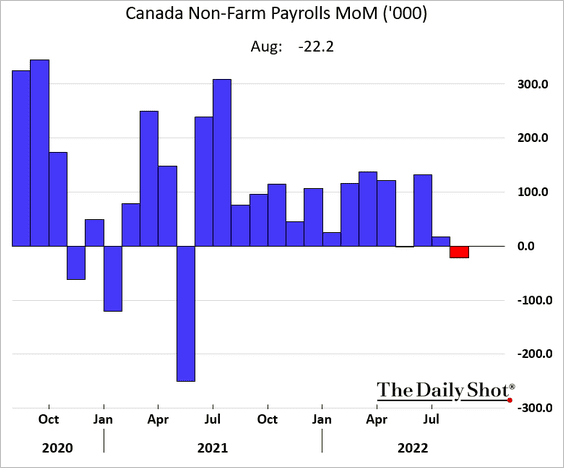
2. Nonfarm payrolls fell in August.
Back to Index
The United Kingdom
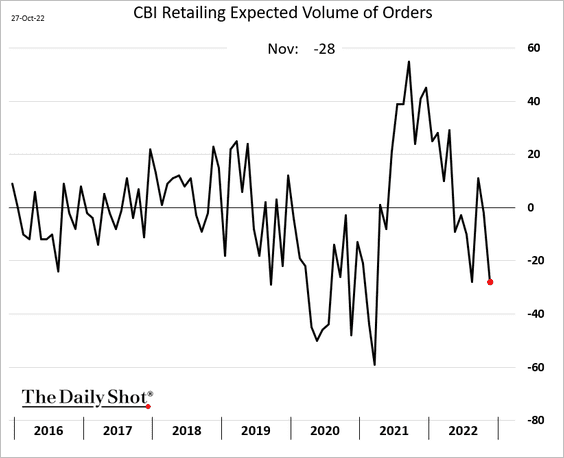
1. The CBI retail sales index bounced in October.
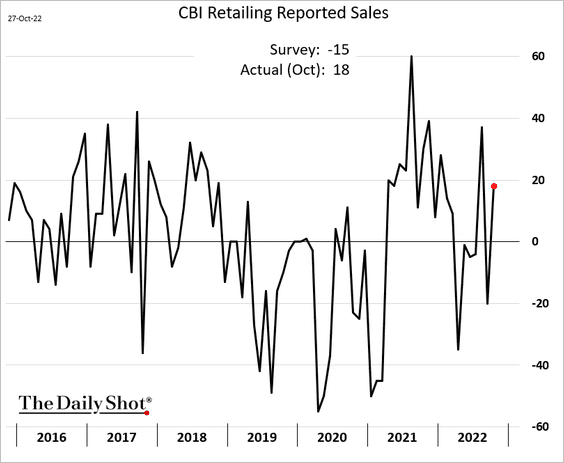
But retailers’ outlook has been weakening.
 Source: Reuters Read full article
——————–
2. Inactivity due to long-term illness is surging.
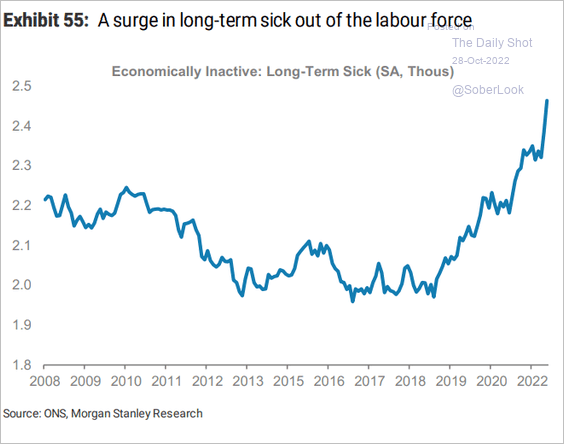 Source: Morgan Stanley Research
3. Self-employment has stabilized after a massive COVID-driven decline.
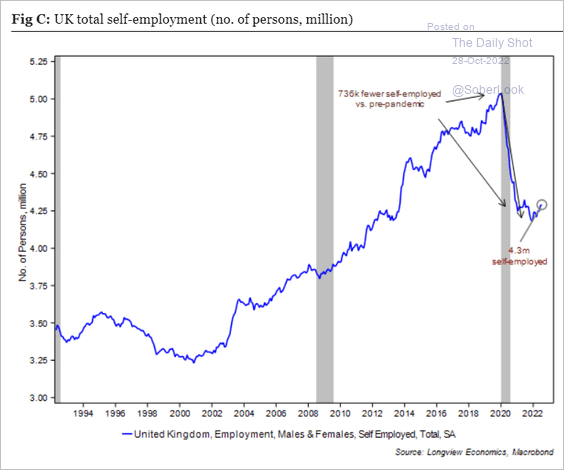 Source: Longview Economics
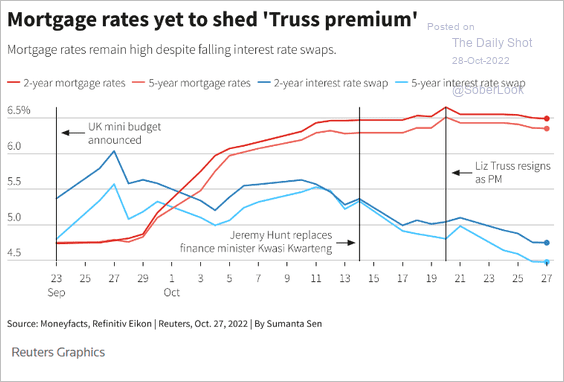
4. The “Truss premium” on mortgage rates remains elevated.
 Source: Reuters Read full article
Back to Index
The Eurozone
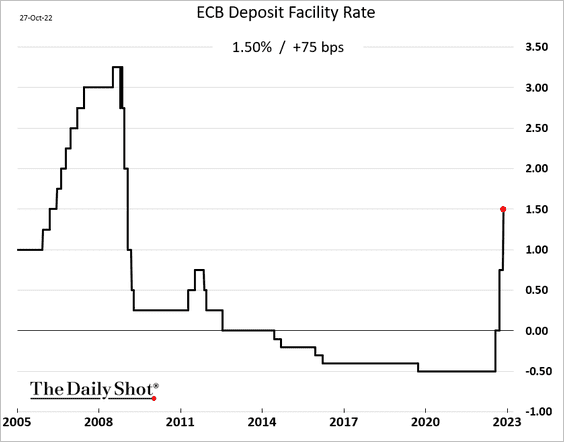
1. The ECB hiked rates by 75 bps and scaled back support for the banking system.
 Source: Reuters Read full article
 Source: ECB Read full article
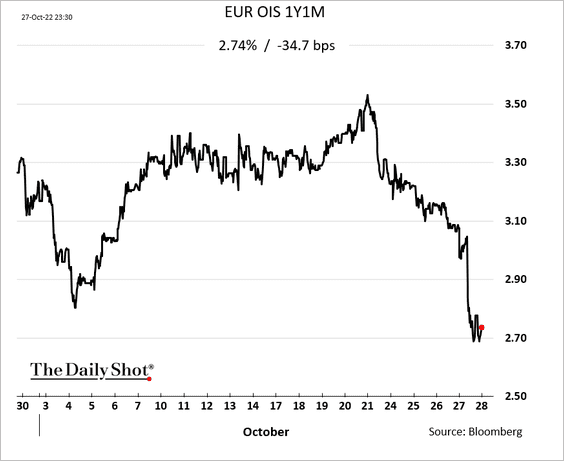
Despite the jumbo hike, the market saw the announcement as a bit dovish.
 Source: FXS Read full article
• Expectations for the overnight rate in one year declined sharply.
• EUR/USD dipped back below parity.
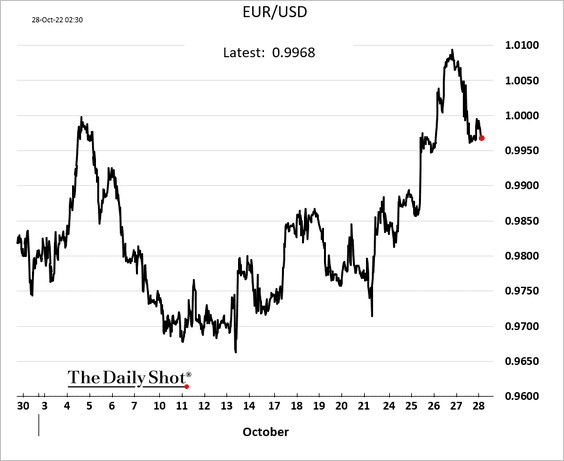
• 50 basis points in December?
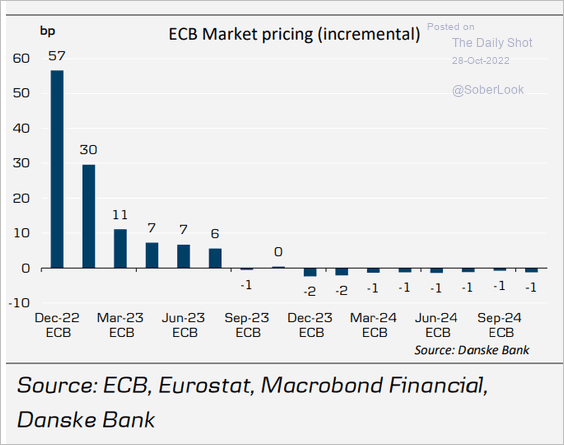 Source: Danske Bank
——————–
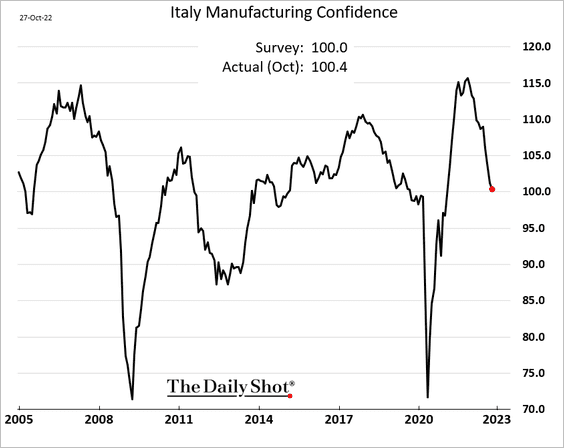
2. Germany’s consumer confidence ticked up this month (from record lows).
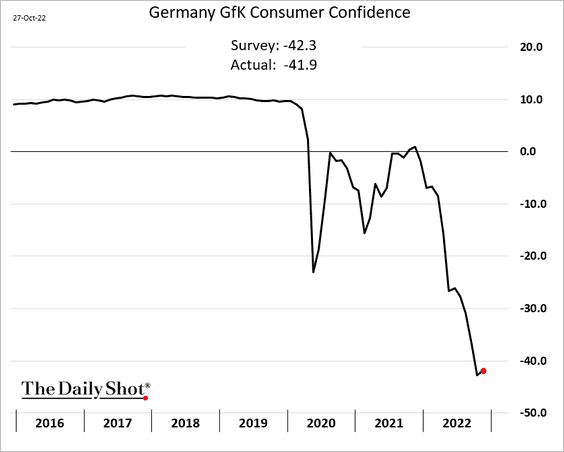
But Italian consumer confidence continues to deteriorate.
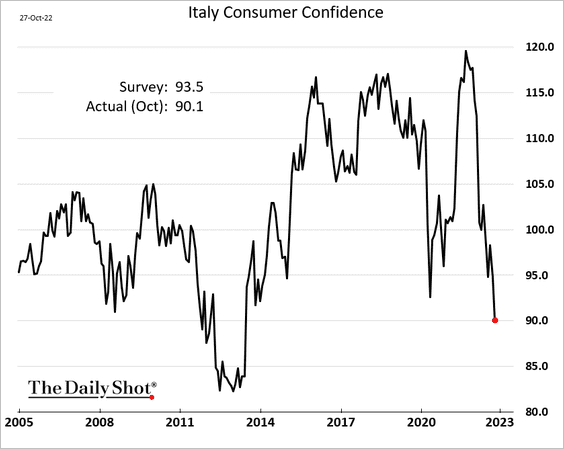
Here is Italy’s manufacturing confidence.
——————–
3. Have Bund yields finally peaked?
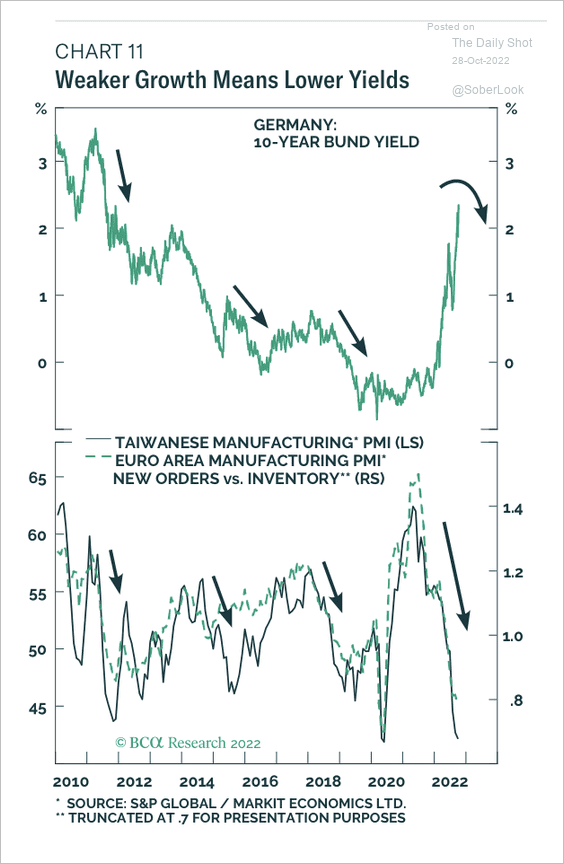 Source: BCA Research
Back to Index
Europe
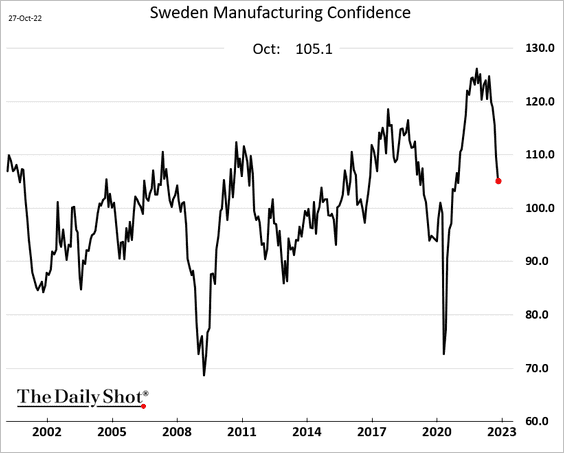
1. Let’s begin with some updates on Sweden.
• Manufacturing confidence:
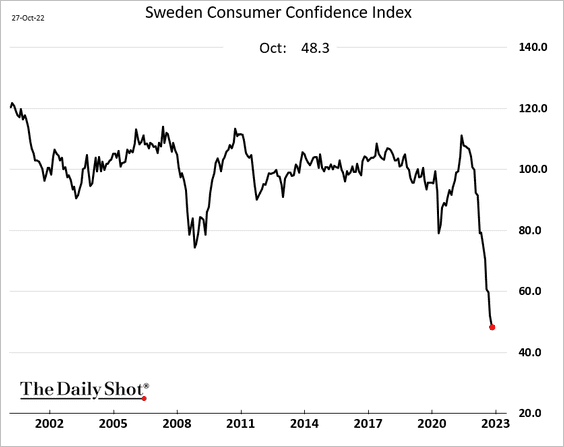
• Consumer confidence (new low):
• Nordea’s GDP model:
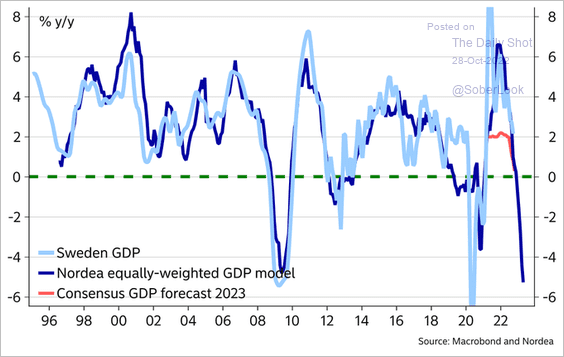 Source: @MikaelSarwe
• Housing transactions and home prices:
![]() Source: Nordea Markets
Source: Nordea Markets
——————–
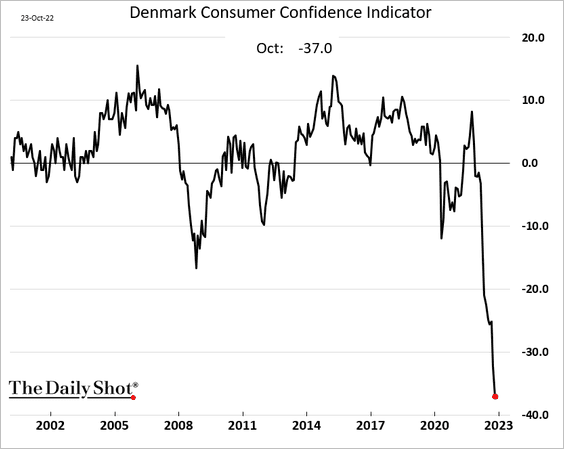
2. Denmark’s consumer confidence has collapsed.
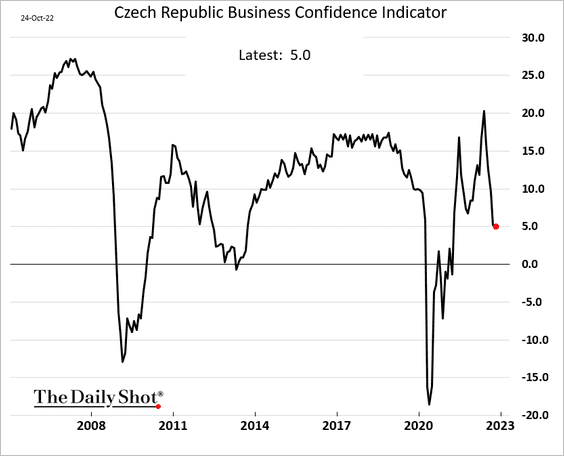
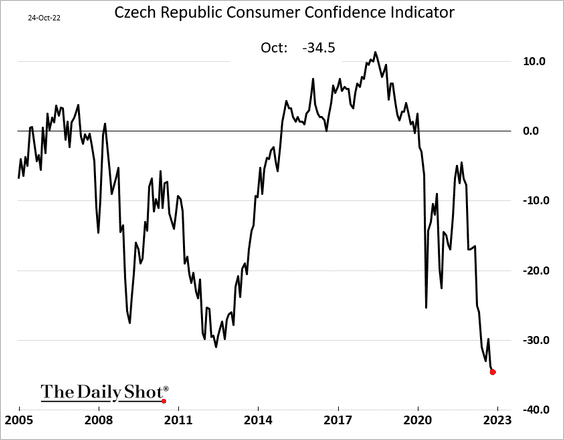
3. Here is Czech Republic’s business and consumer confidence.
——————–
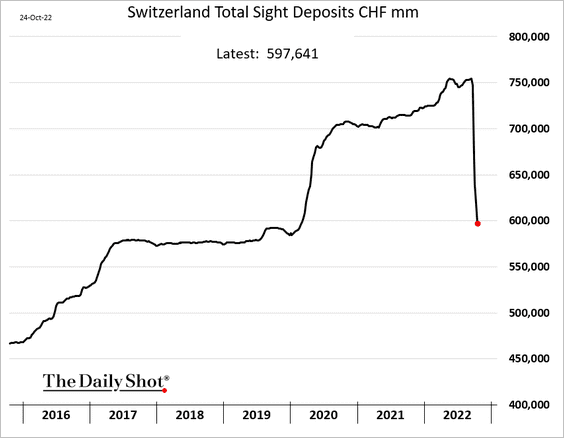
4. The Swiss central bank continues to tighten liquidity.
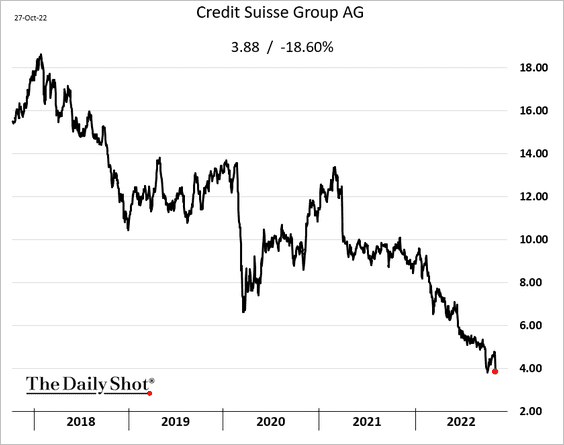
5. Credit Suisse shares dropped 18% – back near the lows.
6. The gap between European credit spreads and equity implied volatility remains unusually wide.
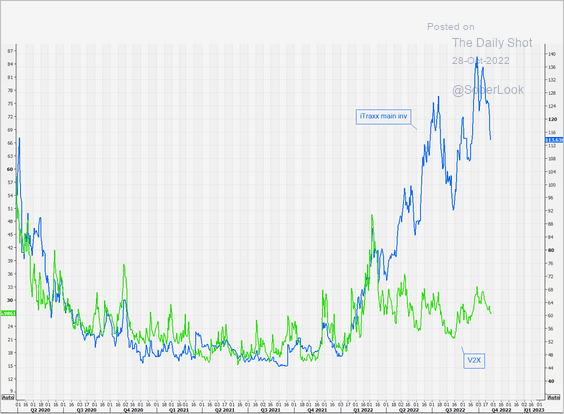 Source: @themarketear
Back to Index
Japan
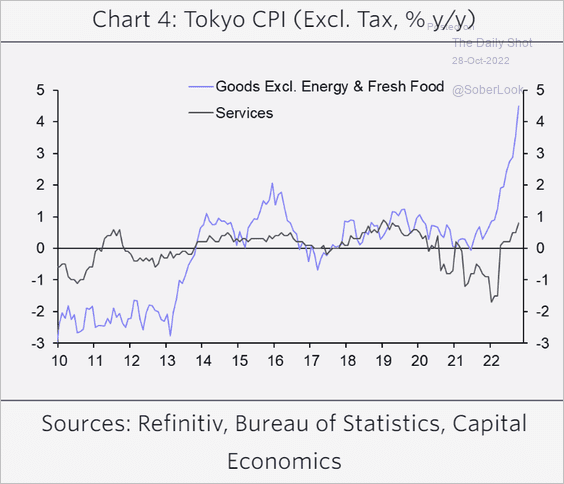
1. The Tokyo core CPI climbed above 2% this month, topping expectations.
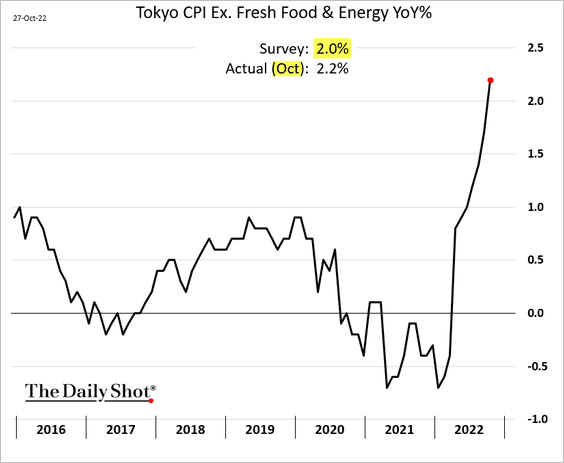
Here are the goods and services CPI indices.
 Source: Capital Economics
——————–
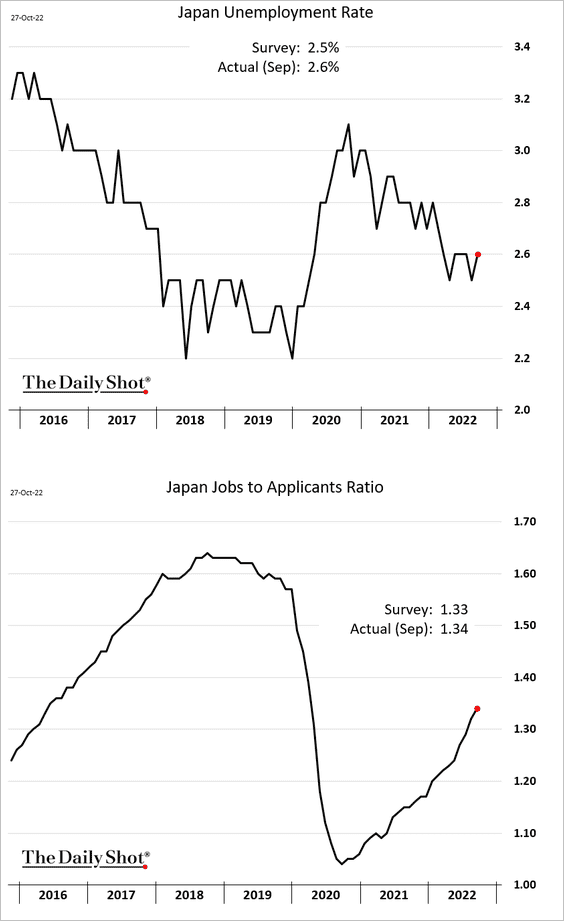
2. The jobs-to-applicants ratio keeps climbing.
Back to Index
Asia – Pacific
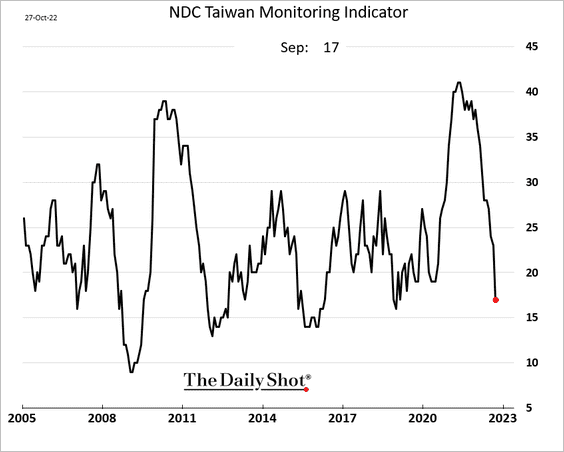
1. Taiwan’s leading indicator has been falling quickly.
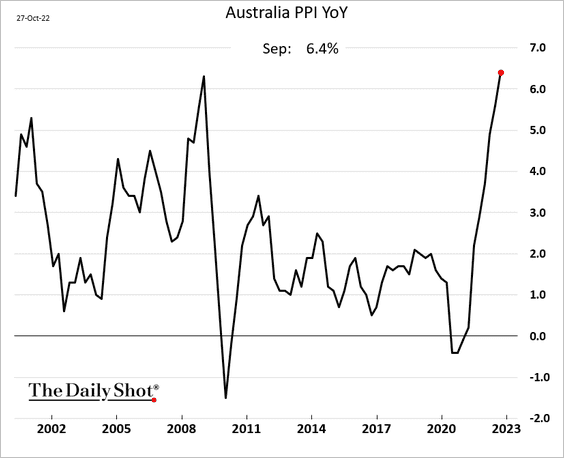
2. Australian PPI hit a multi-decade high.
Separately, here is an updated budget forecast from Fitch Ratings.
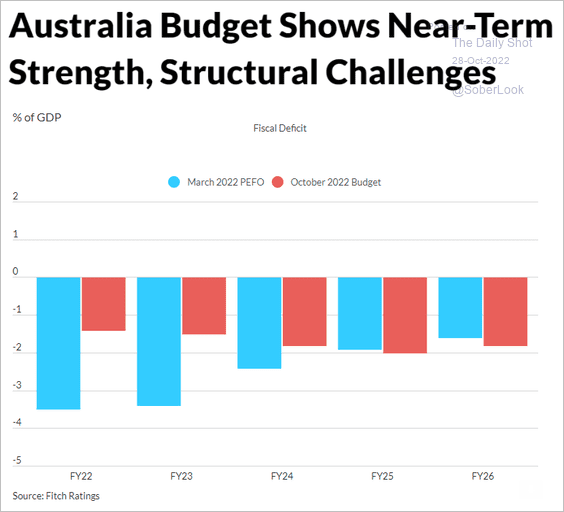 Source: Fitch Ratings
Back to Index
China
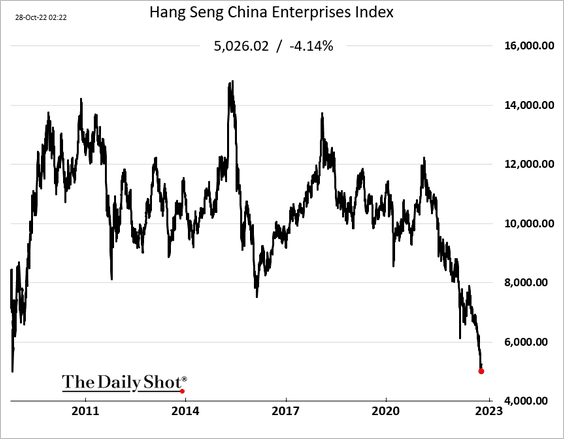
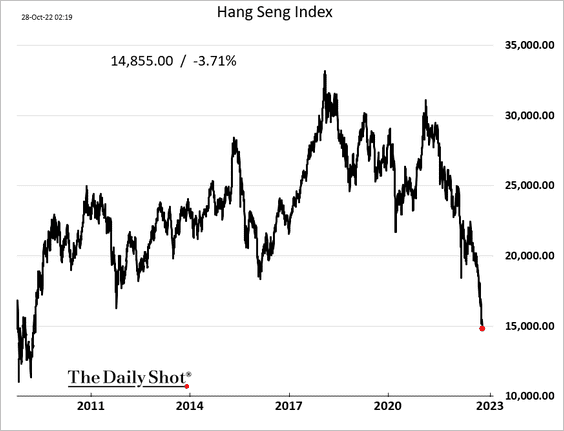
1. The equity market rout resumed today.
• The Shanghai Shenzhen CSI 300 Index (mainland stocks):
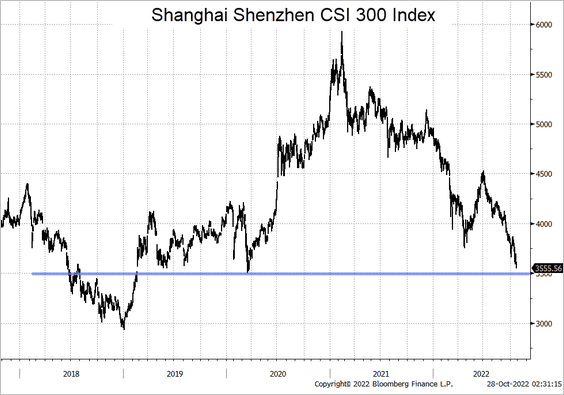 Source: @TheTerminal, Bloomberg Finance L.P.
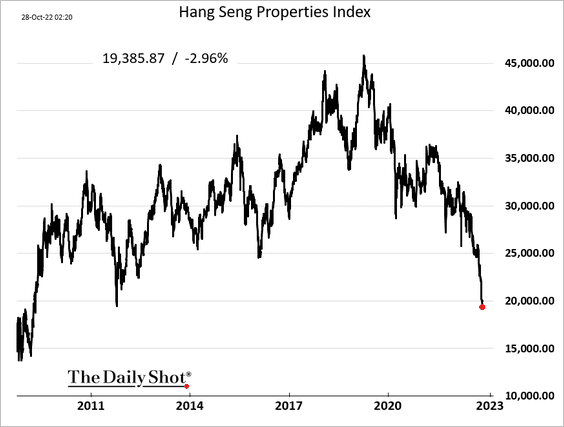
• Stocks in Hong Kong (3 charts):
——————–
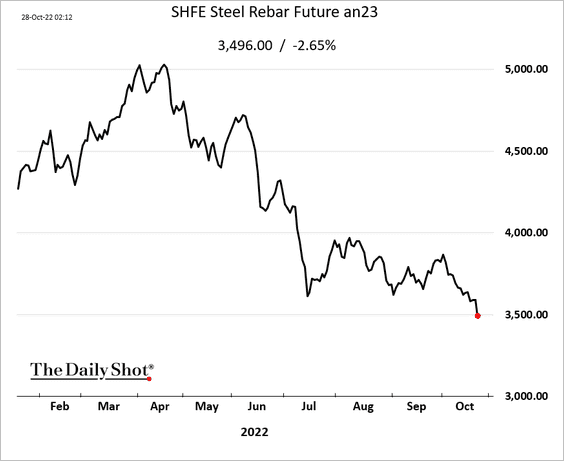
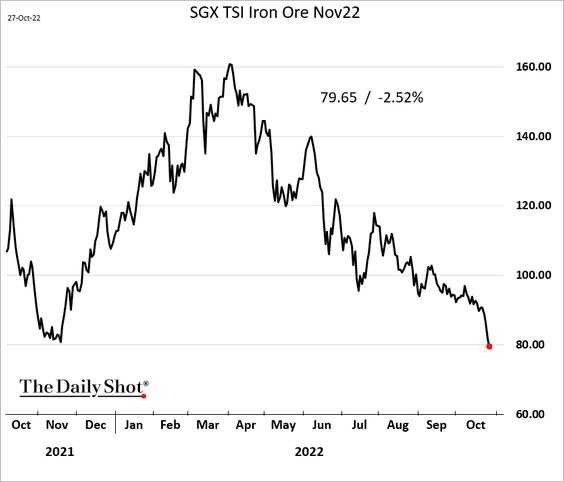
2. China’s steel prices keep falling, putting pressure on iron ore.
——————–
3. Official measures of property prices peaked around mid-2021.
 Source: Gavekal Research
4. Beijing’s focus has been shifting in recent decades.
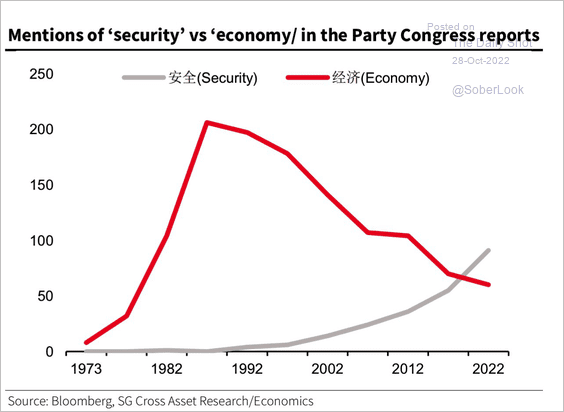 Source: Societe Generale Cross Asset Research; @WallStJesus
Back to Index
Emerging Markets
1. Egypt devalued its currency again, …
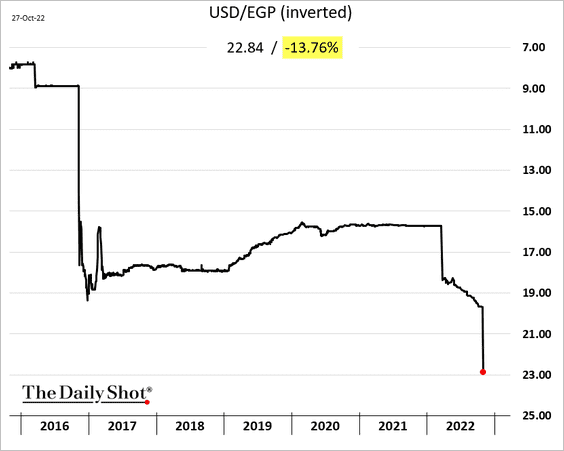
… and hiked rates, …
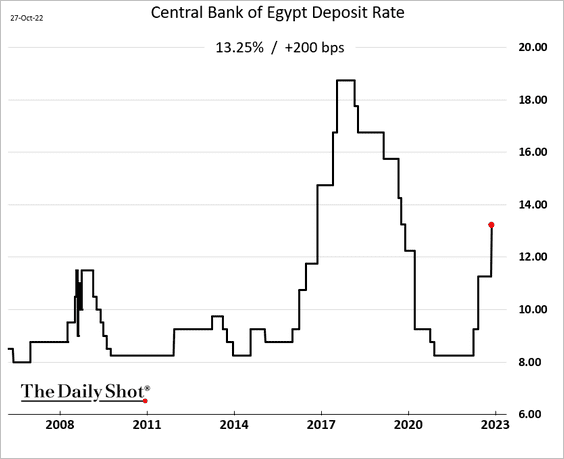
… as it secured a loan from the IMF.
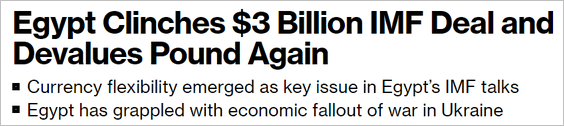 Source: Bloomberg Read full article
——————–
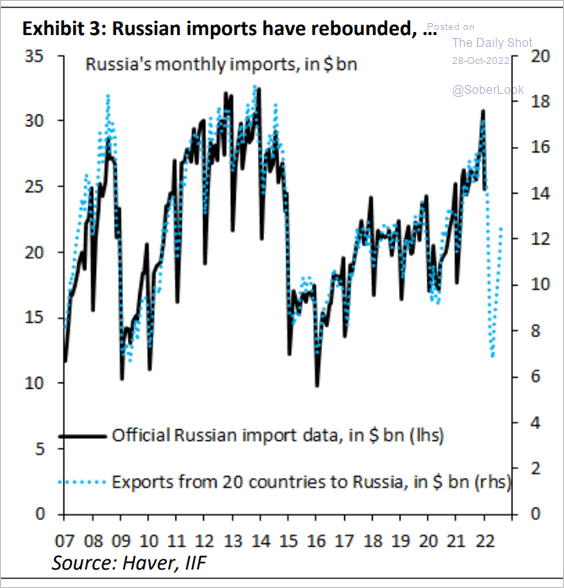
2. Russia’s FX reserves continue to decline.
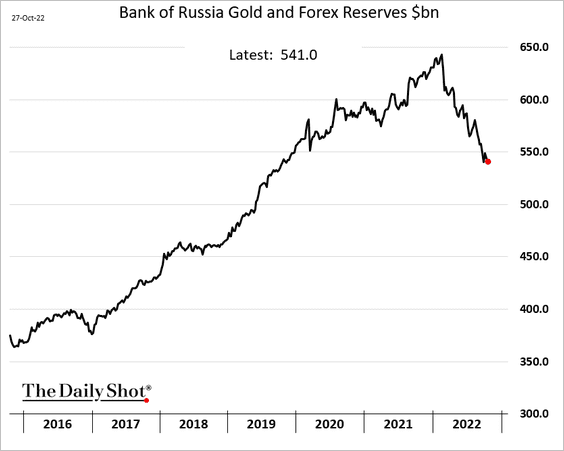
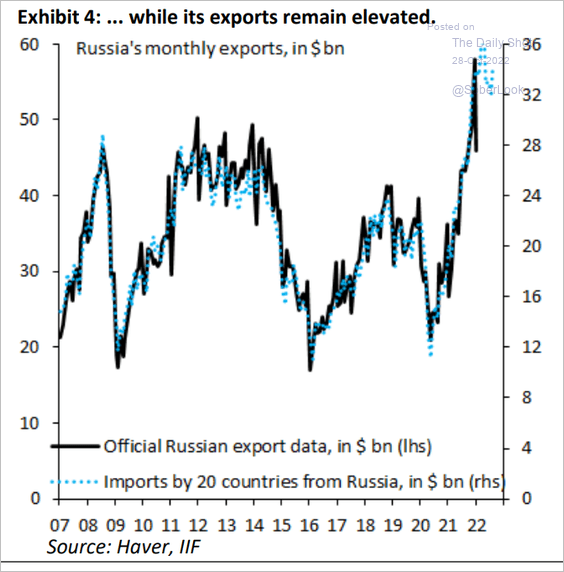
Russia’s trade has been robust despite the sanctions.
• Imports:
 Source: IIF
• Exports:
 Source: IIF
——————–
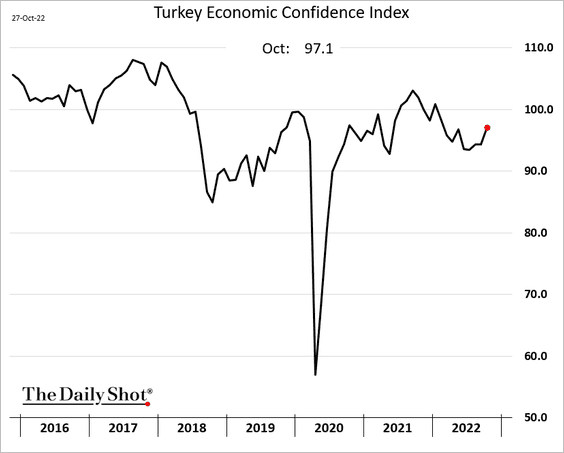
3. Turkey’s economic confidence improved this month.
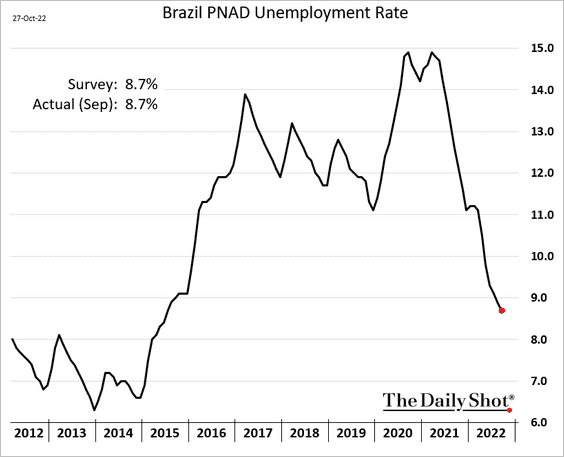
4. Brazil’s unemployment rate continues to move lower.
5. EM equities are seeing inflows.
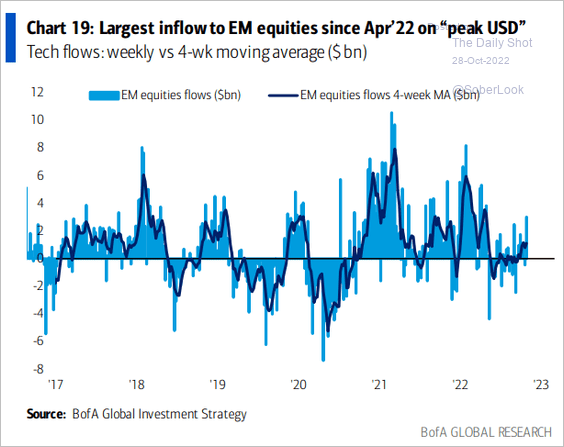 Source: BofA Global Research
Back to Index
Energy
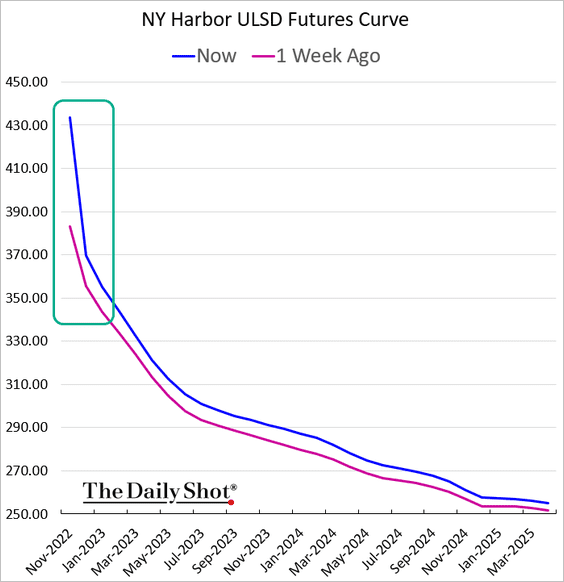
1. US diesel prices are surging …
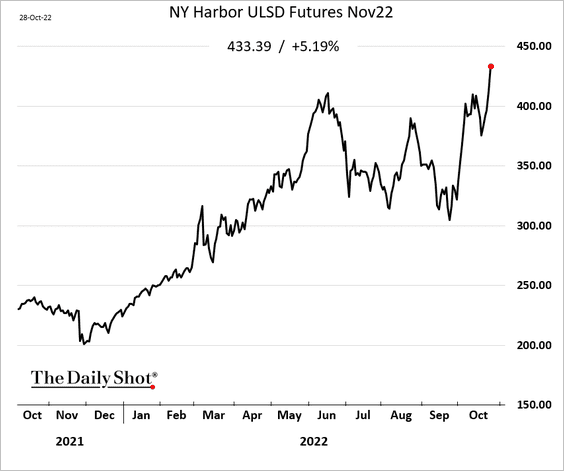
… boosting backwardation (an indication of tight supplies).
——————–
2. Analysts have massively downgraded their projections for Russia’s natural gas exports.
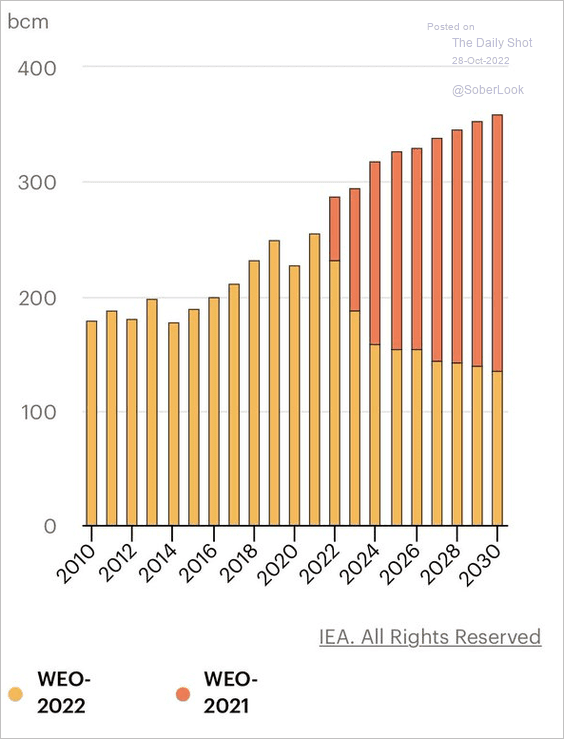 Source: @AndreasSteno
3. It’s going to be tricky for Russia to secure the oil tankers it needs to evade the G7 oil price cap.
 Source: S&P Global Commodity Insights
4. China is buying Russian oil which has been rebranded as Malaysian.
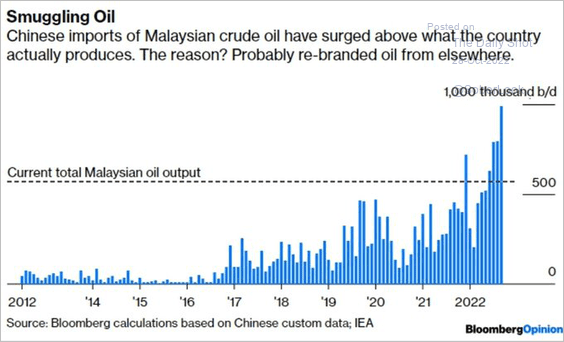 Source: @JavierBlas, @opinion
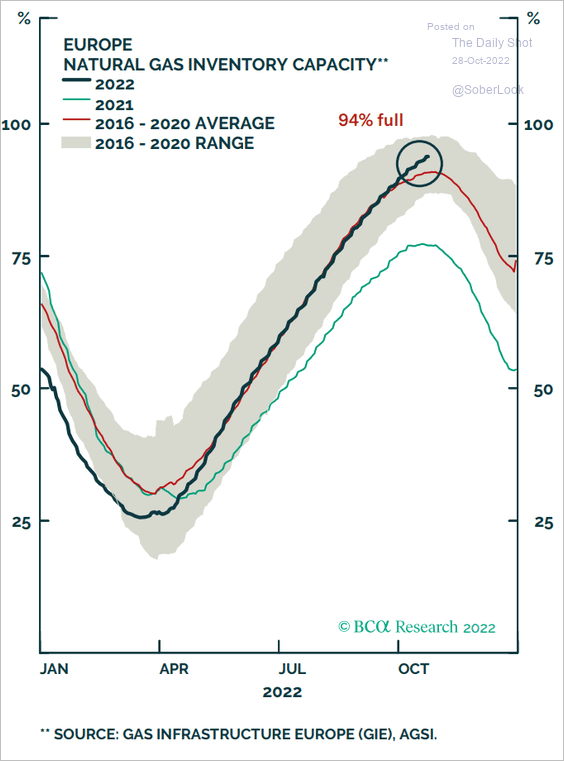
5. The EU’s natural gas inventories continue to climb.
 Source: BCA Research
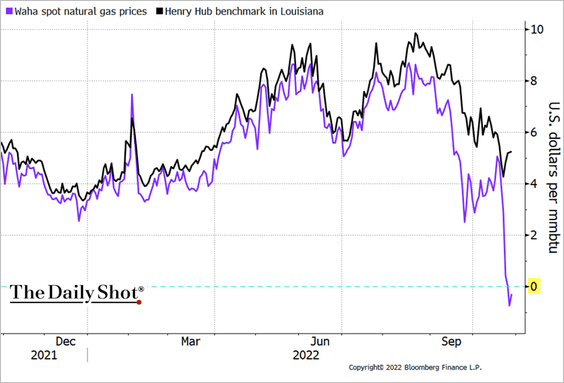
6. West Texas natural gas prices dipped below zero amid pipeline constraints.
 Source: @TheTerminal, Bloomberg Finance L.P.
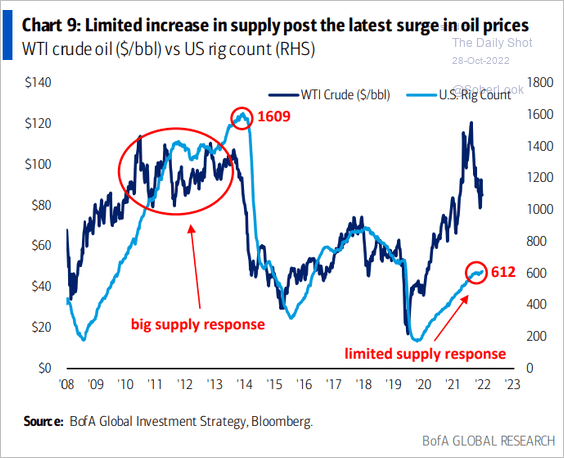
7. The US supply response to higher oil prices has been limited in this cycle.
 Source: BofA Global Research
Back to Index
Equities
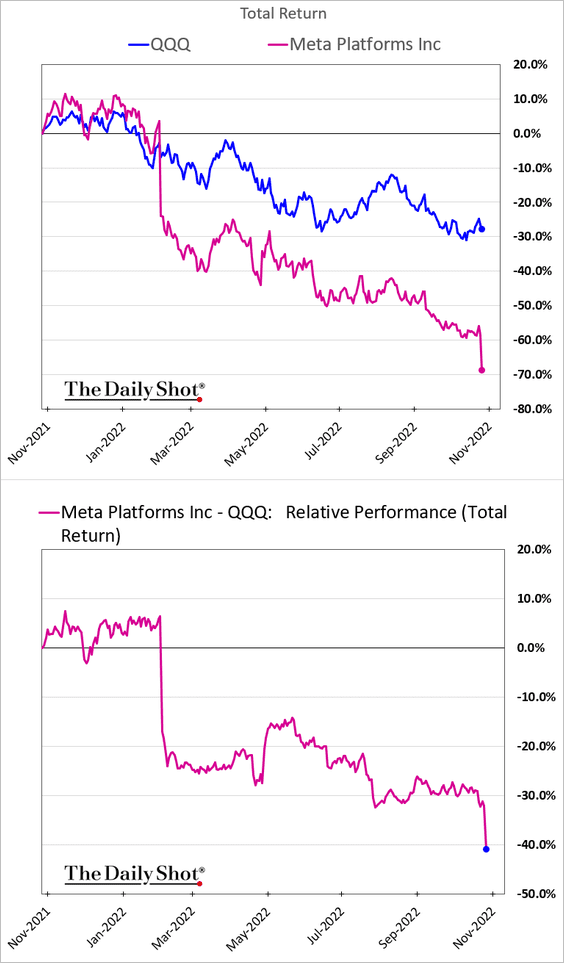
1. Tech mega-caps remain under pressure as results disappoint.
• Meta:
• Amazon after the close:
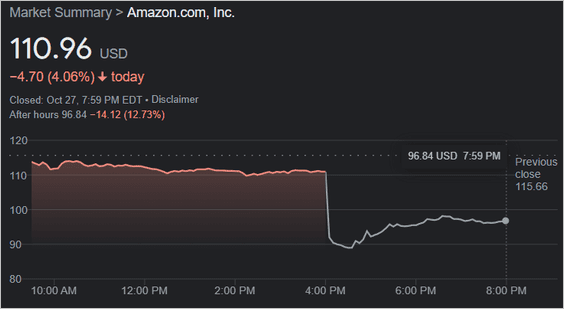
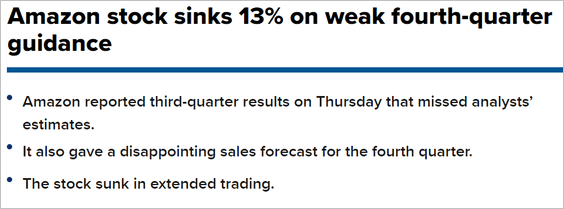 Source: CNBC Read full article
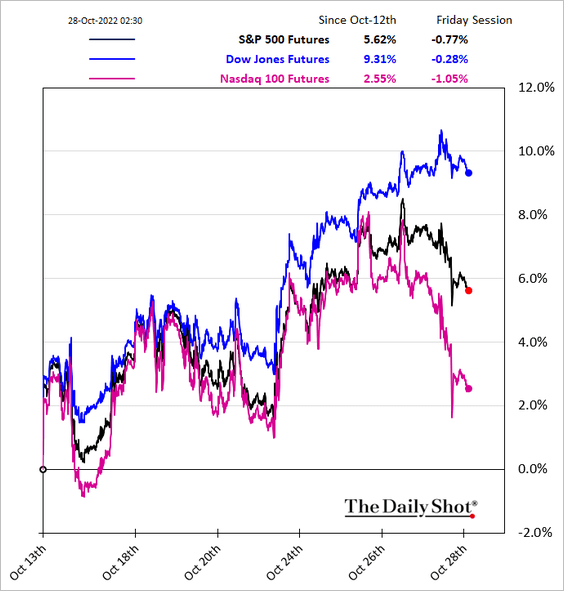
Large tech firms have become a significant drag on the market. Index futures have diverged massively as a result.
——————–
2. Small caps have been outperforming large-cap growth equities (2 charts).
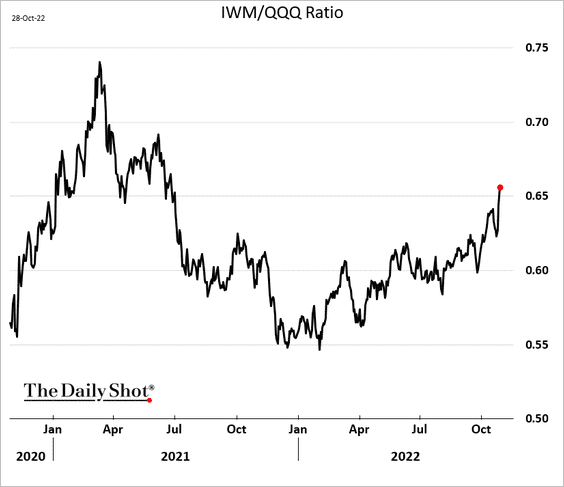
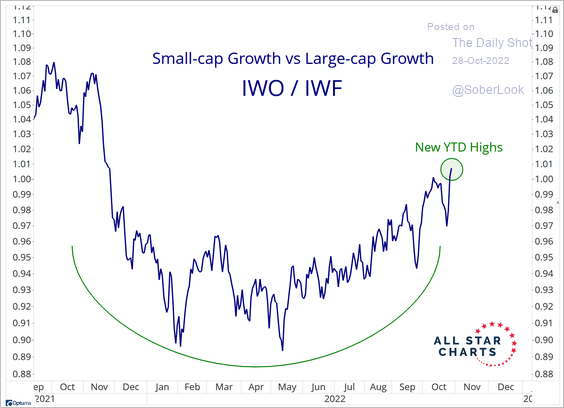 Source: @allstarcharts
——————–
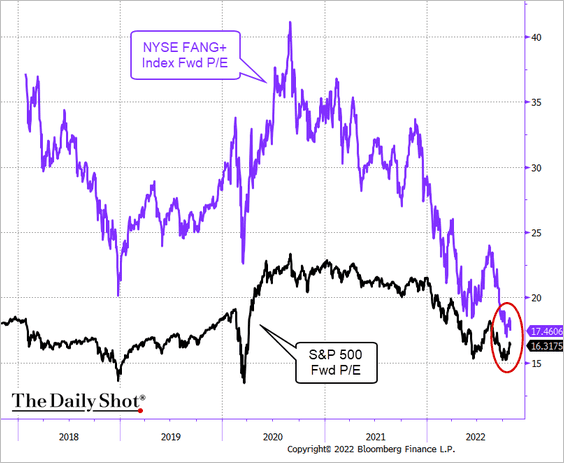
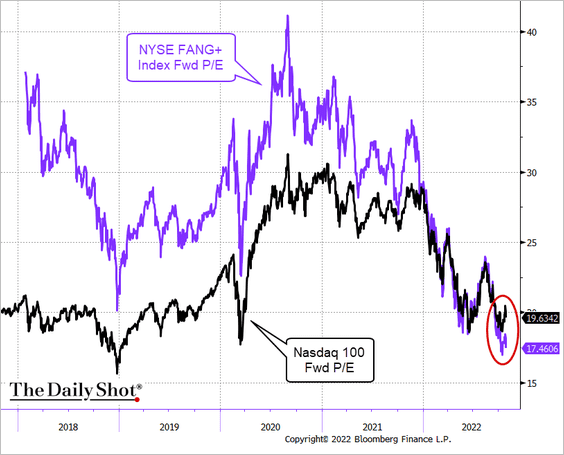
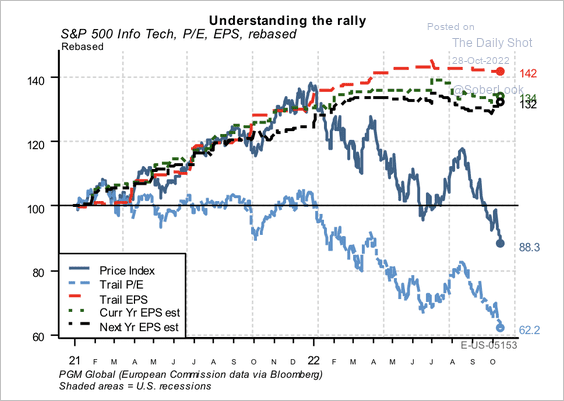
3. Tech mega-caps’ valuations are converging with key indices (2 charts).
——————–
4. Trailing earnings and forward estimates for tech have flatlined.
 Source: PGM Global
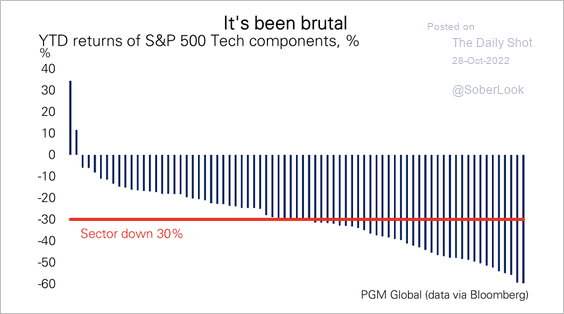
5. Nearly half of all tech stocks have fallen more than 30% this year.
 Source: PGM Global
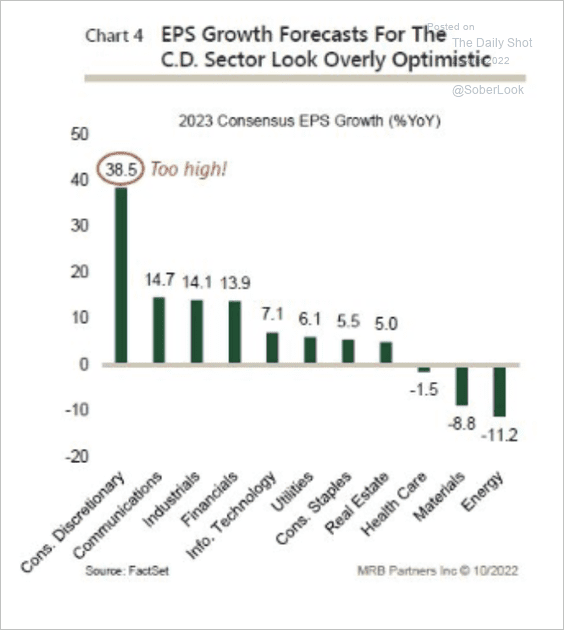
6. Next year’s earnings expectation for consumer discretionary is too high.
 Source: MRB Partners
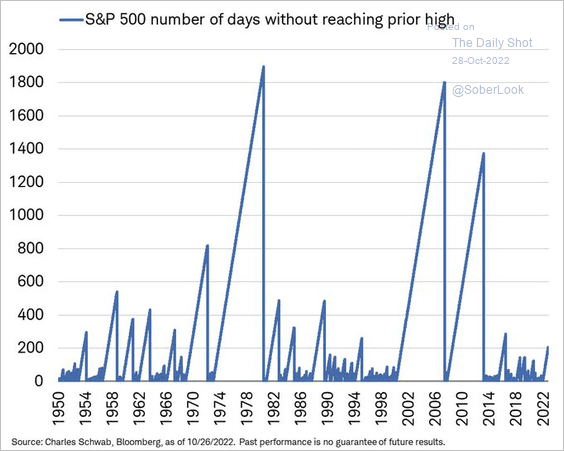
7. Here is the number of days without reaching the prior high. It may take a while.
 Source: @LizAnnSonders
8. The S&P 500 put/call premium ratio is elevated.
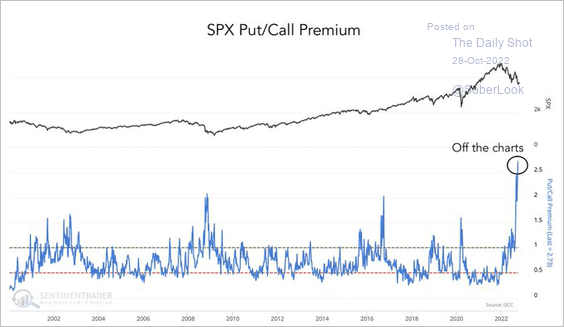 Source: SentimenTrader; @GameofTrades_
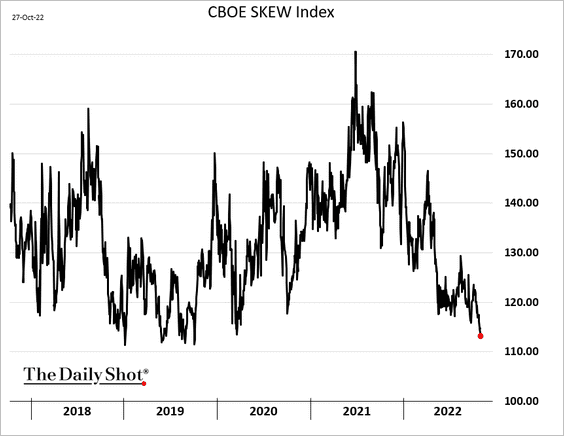
9. The equity market options skew is near pre-COVID lows.
10. The stock/bond price ratio is on the verge of breaking out.
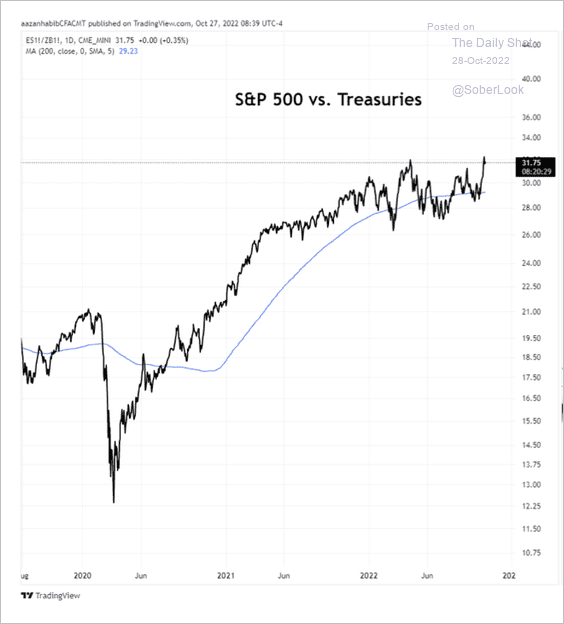 Source: Aazan Habib, Paradigm Capital
11. The US equity market risk premium is too low.
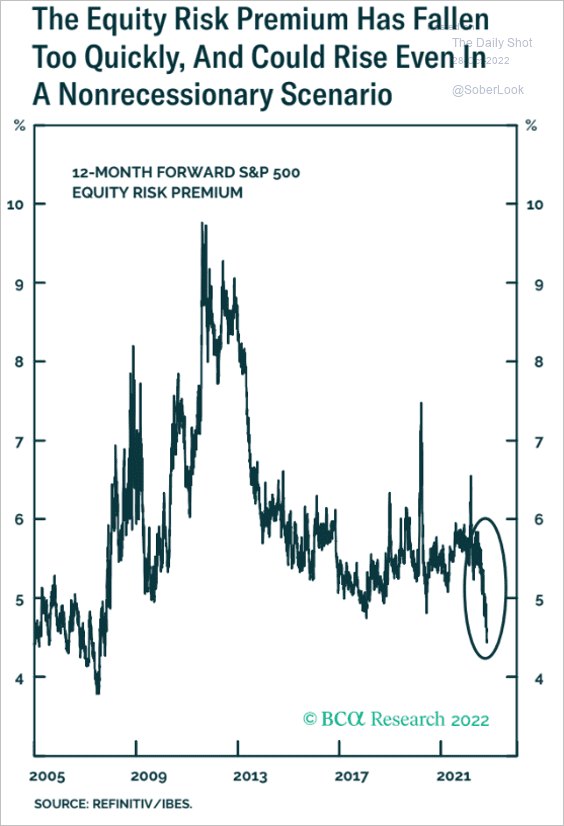 Source: BCA Research
Back to Index
Credit
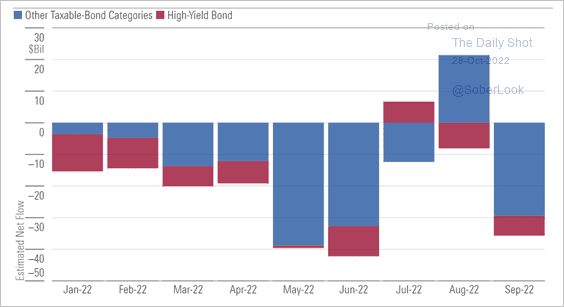
Taxable bond funds saw $36 billion in outflows in September, driven by a lower appetite for risk among US investors.
 Source: Morningstar Direct
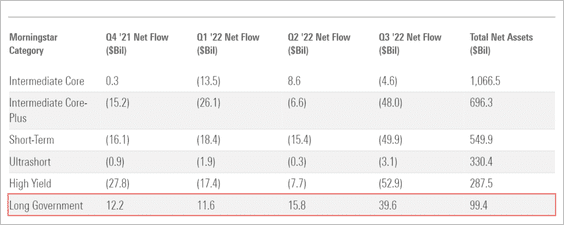
• Money has rushed out of most bond categories, but long-term government bond funds have stayed in high demand.
 Source: Morningstar Direct
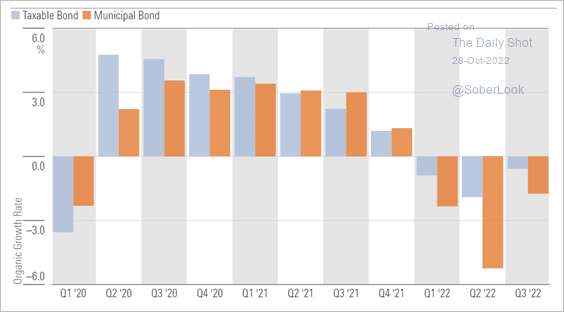
• Muni bond funds continue to see outflows.
 Source: Morningstar Direct
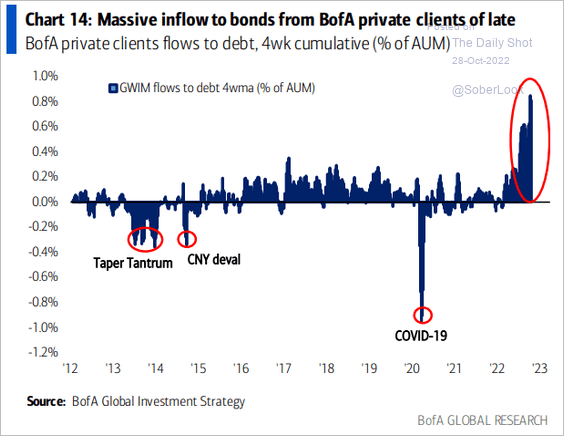
• But BofA’s clients have been moving into bonds.
 Source: BofA Global Research
Back to Index
Global Developments
1. Here is a look at housing market valuations in advanced economies.
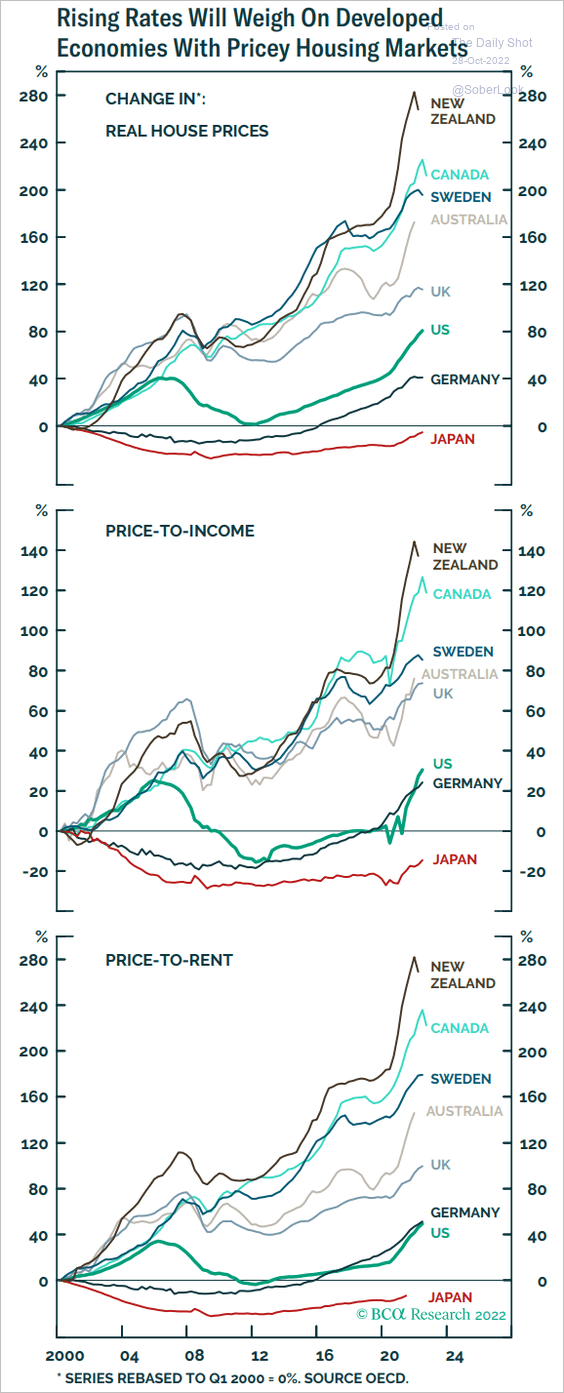 Source: BCA Research
2. The number of rate hikes around the world has been unprecedented.
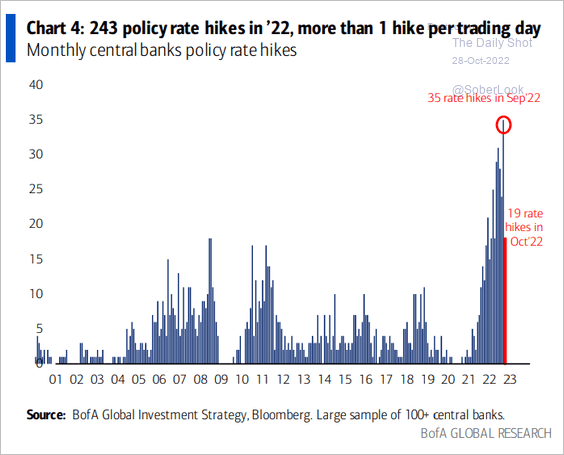 Source: BofA Global Research
——————–
Food for Thought
1. Shipments of manufactured homes:
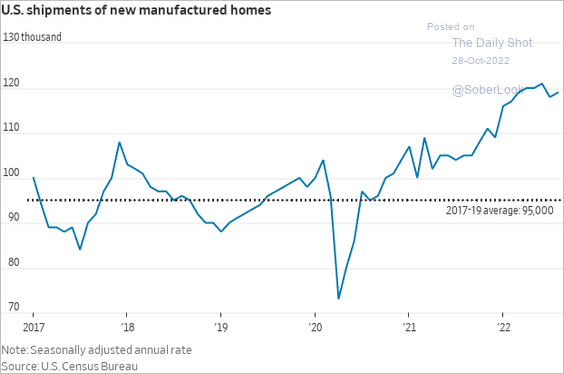 Source: @WSJ Read full article
2. US holiday sales by category:
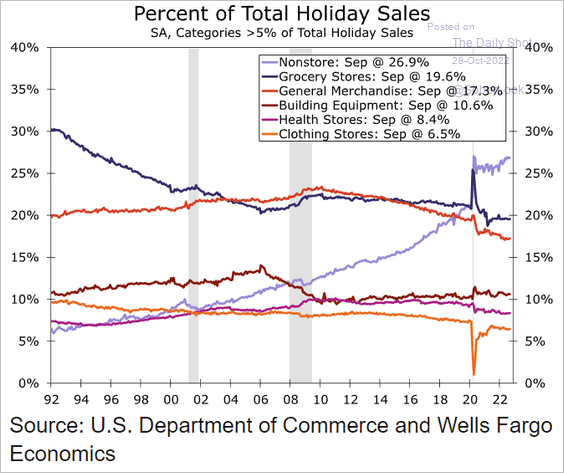 Source: Wells Fargo Securities
3. Amazon Prime Days sales growth:
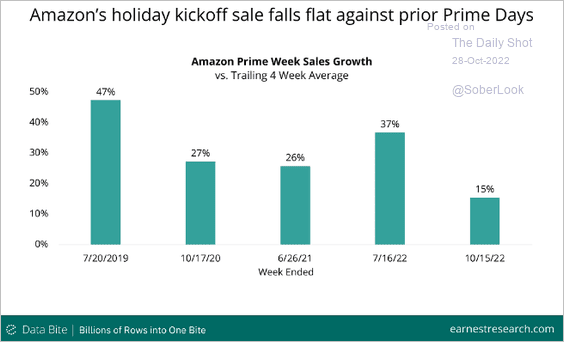 Source: Earnest Research
4. VR-AR users:
 Source: Statista
5. Various news media consumers with at least a bachelor’s degree:
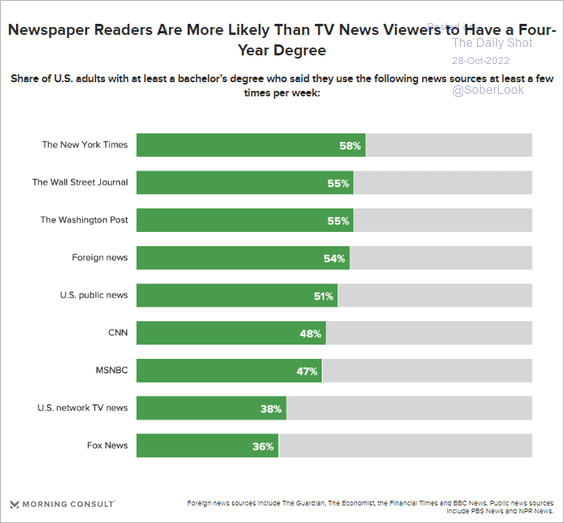 Source: Morning Consult Read full article
6. Ukrainians’ confidence in their military:
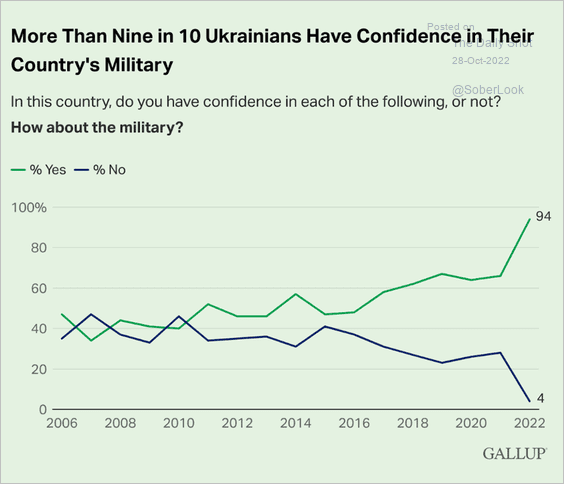 Source: Gallup
7. Life expectancy changes since 2019:
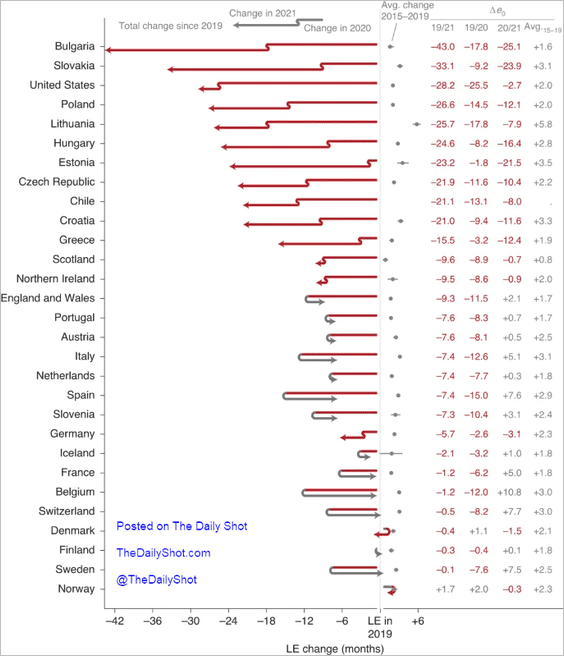 Source: Nature Read full article
8. Halloween spending:
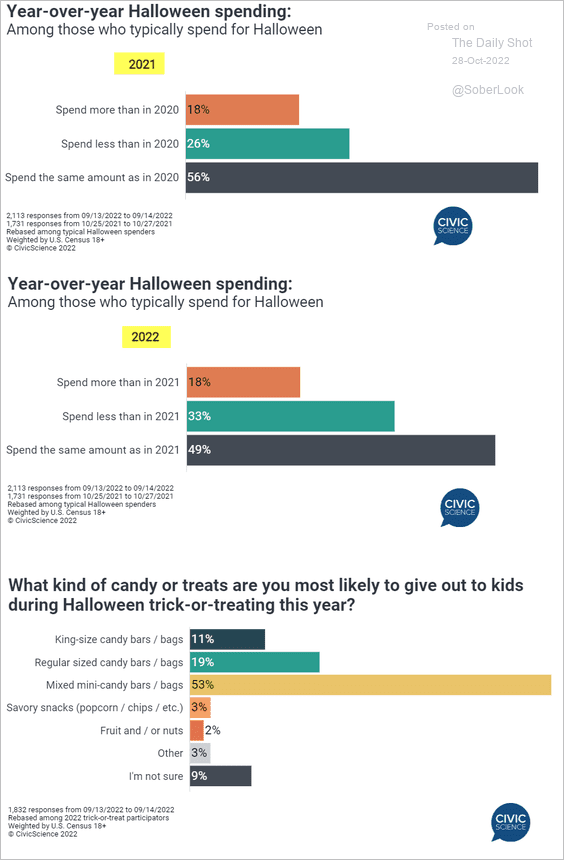 Source: @CivicScience Read full article
——————–
Have a great weekend!
Back to Index