
The Daily Shot: 31-Oct-22
• The United States
• Canada
• The United Kingdom
• The Eurozone
• Europe
• Japan
• Asia – Pacific
• China
• Emerging Markets
• Commodities
• Energy
• Equities
• Alternatives
• Credit
• Rates
• Global Developments
• Food for Thought
The United States
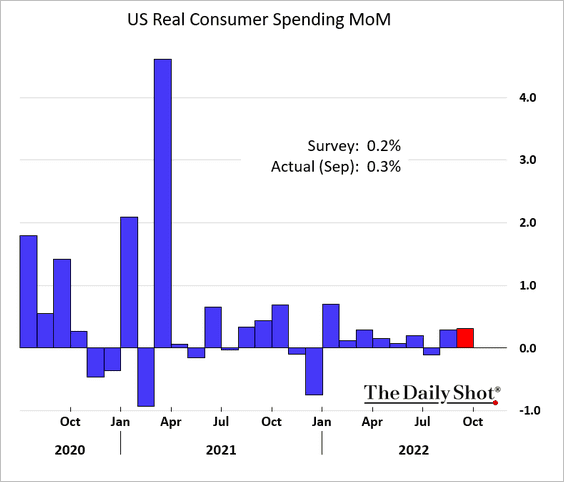
1. Household consumption remains resilient despite the headwinds, with spending rising again in September.
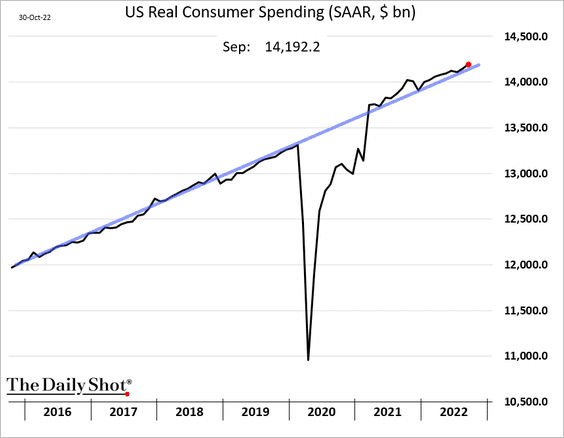
Real consumption continues to follow the pre-COVID trend, …
… supported by excess savings.
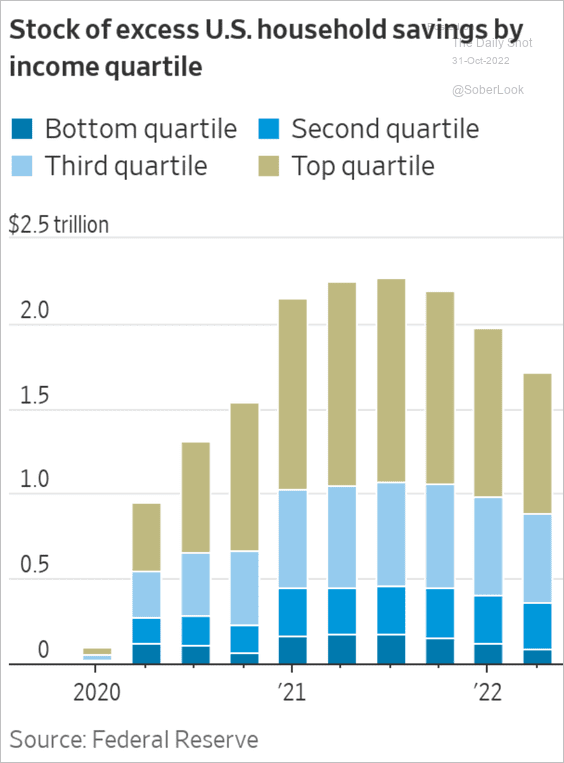 Source: @WSJ Read full article
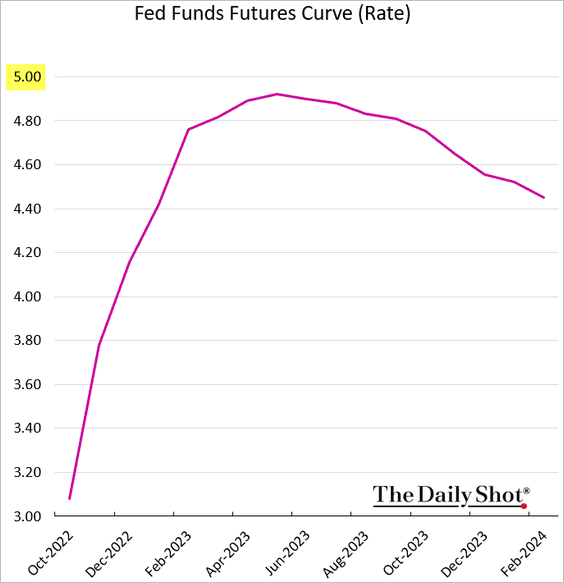
Robust spending means more hikes from the Fed and rates remaining higher for longer. Economists now see the terminal rate at 5%.
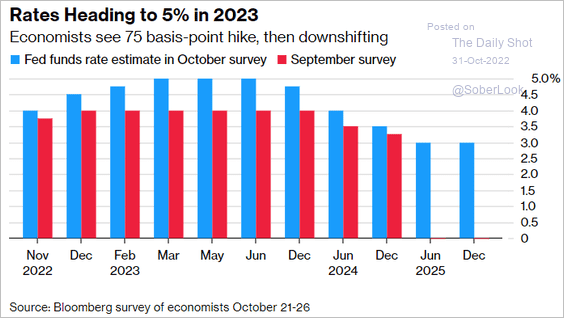 Source: @business, @SteveMatthews12, @SarinaYoo Read full article
Market expectations are also not far from 5%.
——————–
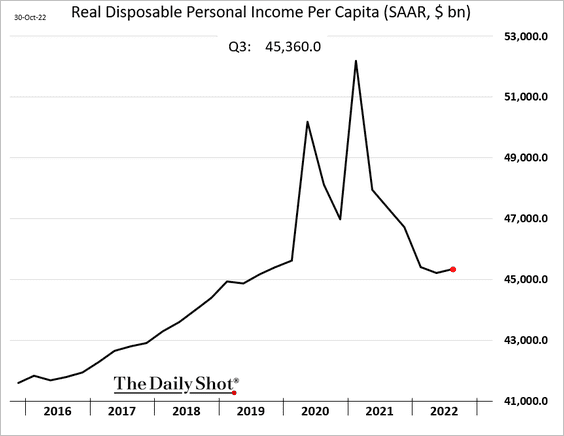
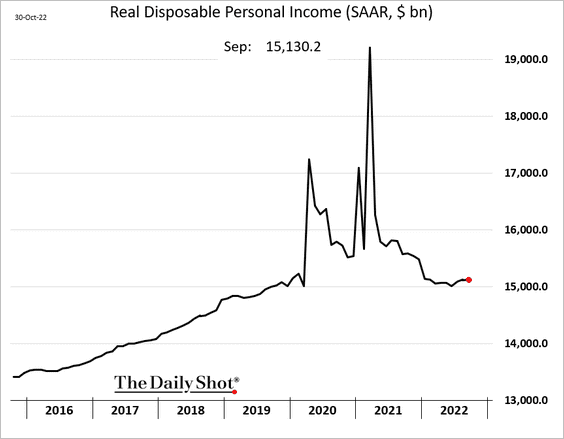
2. Real incomes inched higher last quarter.
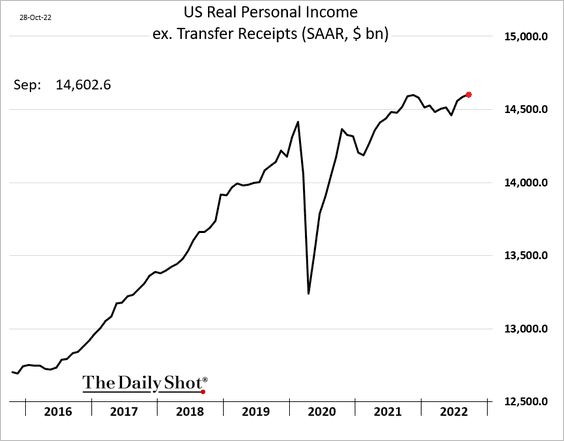
Here is real income excluding government payments.
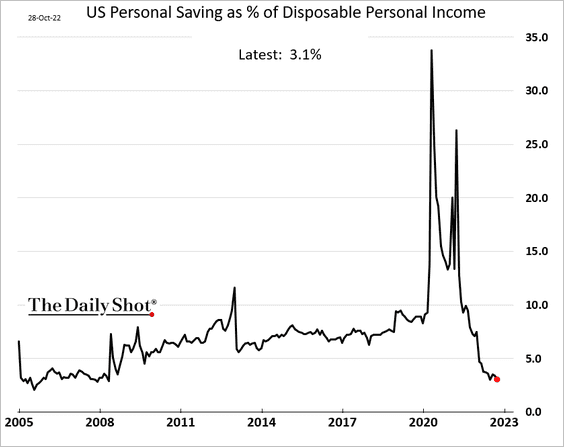
3. Savings as a share of disposable income continue to trend lower.
——————–
4. Next, we have some updates on inflation.
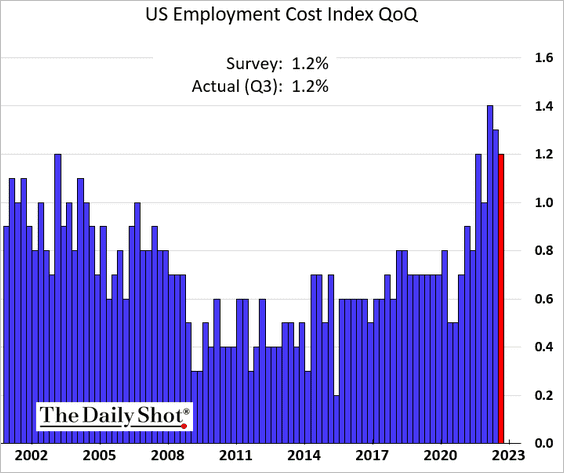
• The employment cost index saw another strong increase last quarter.
• Is wage growth rolling over?
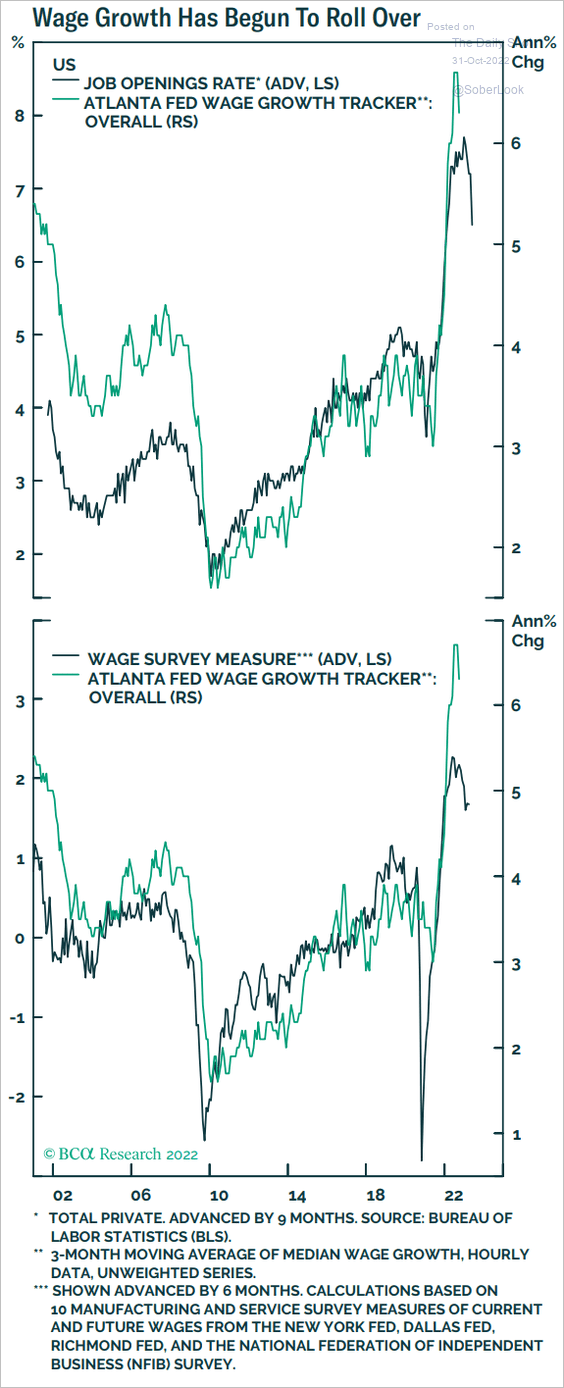 Source: BCA Research
• As the CPI report showed, inflation accelerated in September. Here is the core PCE price index.

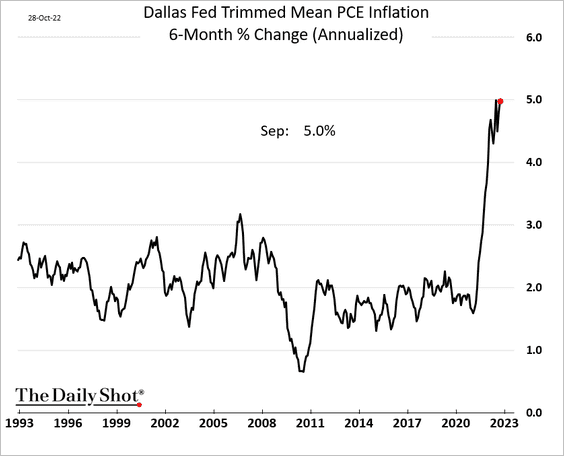
This chart shows the trimmed-mean PCE inflation (six-month changes). Fed officials tend to monitor this index closely.
• A 1970s-style double-top inflation ahead?
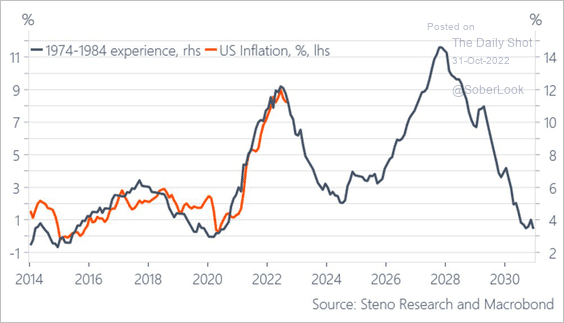 Source: @AndreasSteno
• Volcker’s action took years to work itself into inflation expectations.
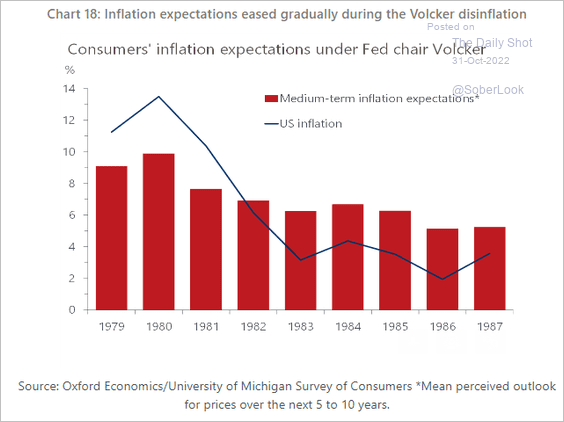 Source: Oxford Economics
• Tightening liquidity (see chart) signals rapid moderation in the CPI.
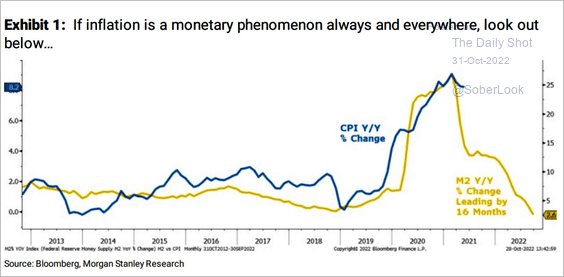 Source: Morgan Stanley Research; @WallStJesus
——————–
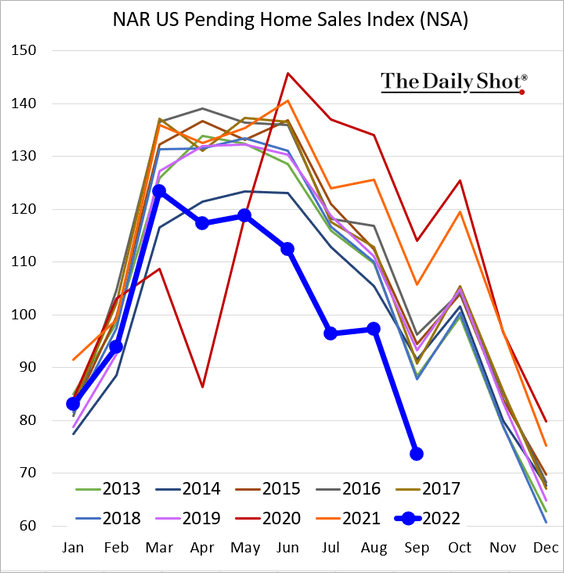
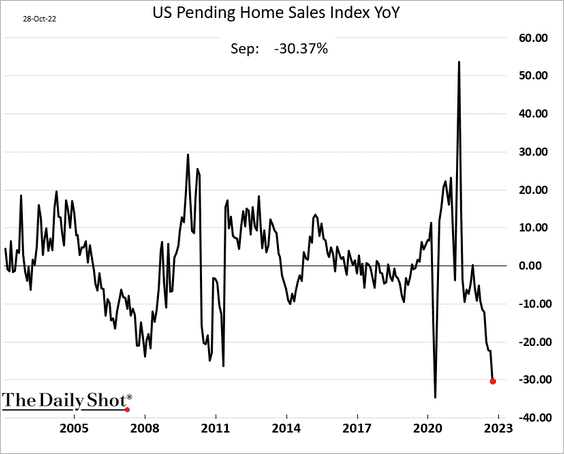
5. Pending home sales are down 30% from a year ago.
——————–
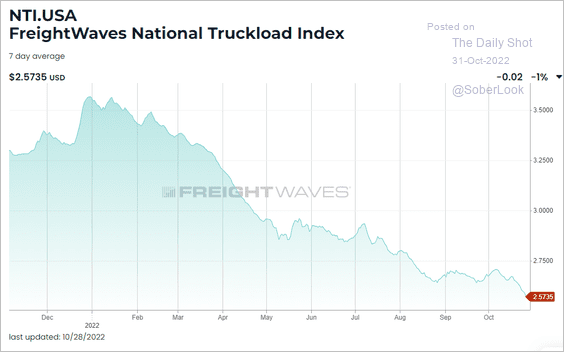
6. Truckload rates continue to fall, …
 Source: FreightWaves
… putting pressure on trucking companies’ sales.
 Source: Evercore ISI Research
——————–
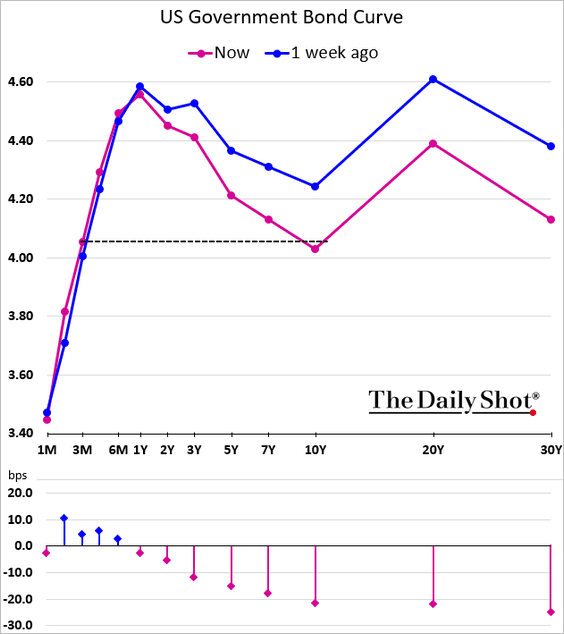
7. The Treasury curve moved deeper into inversion territory last week, with the 3-month yield now above the 10yr.
Back to Index
Canada
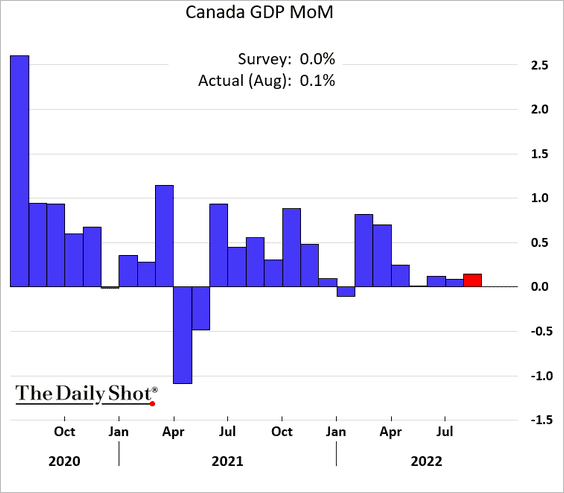
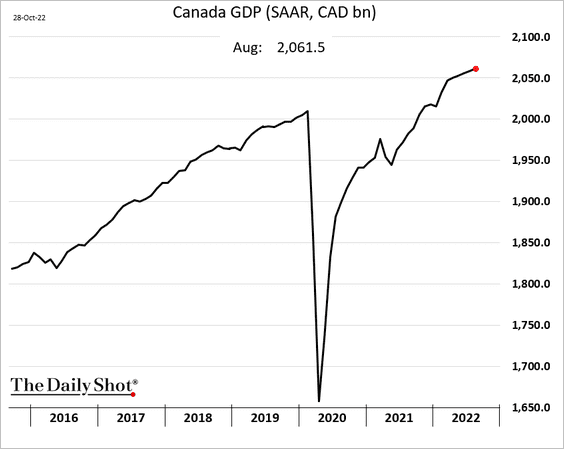
The economy expanded again in August. The market expected flat GDP for the month.
Back to Index
The United Kingdom
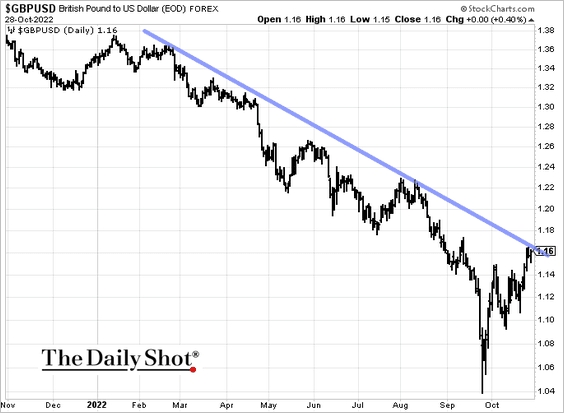
1. GBP/USD is testing resistance.
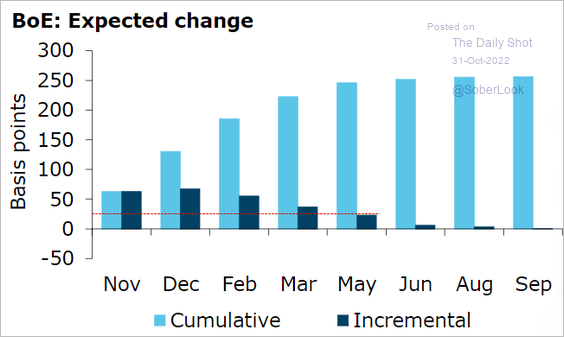
2. The market expects a 50 bps rate hike in each of the next three MPC meetings.
 Source: @ANZ_Research
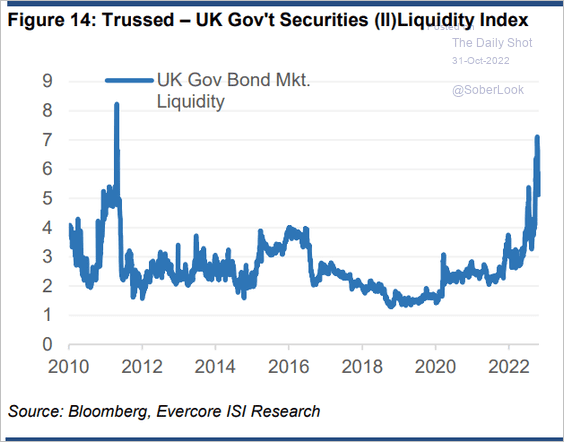
3. Gilt liquidity has been poor.
 Source: Evercore ISI Research
4. Corporate spreads point to a weakening labor market.
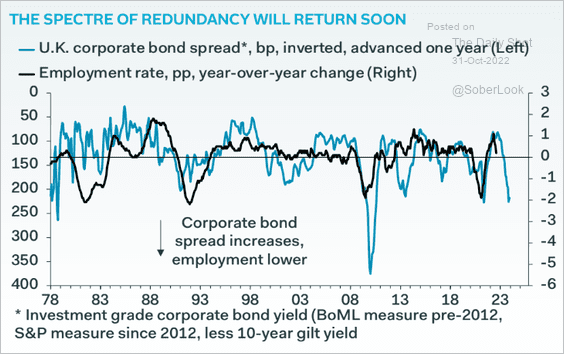 Source: Pantheon Macroeconomics
Back to Index
The Eurozone
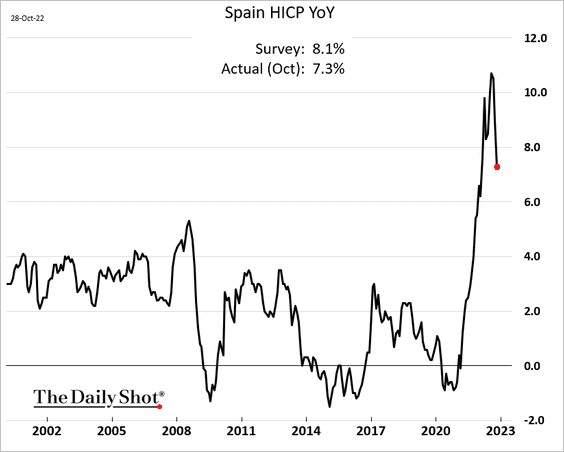
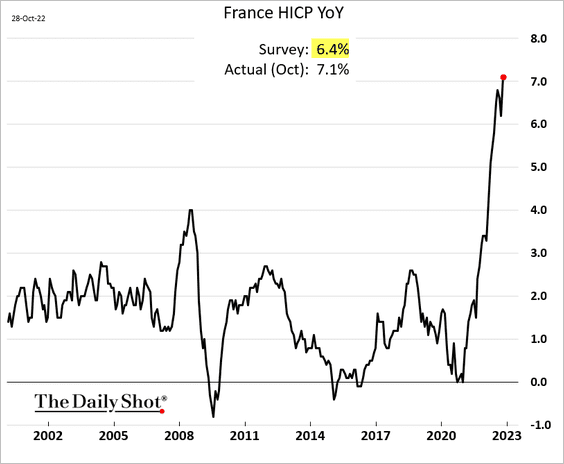
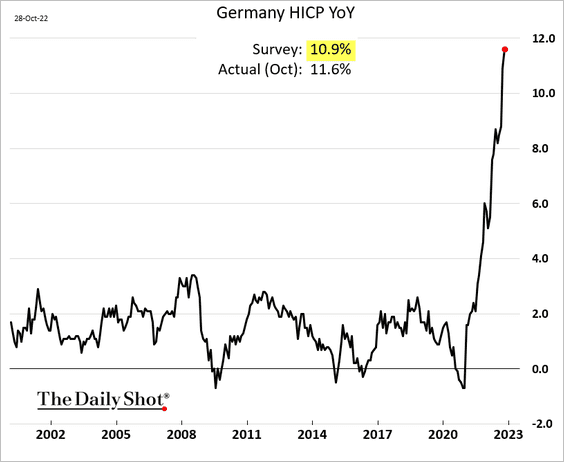
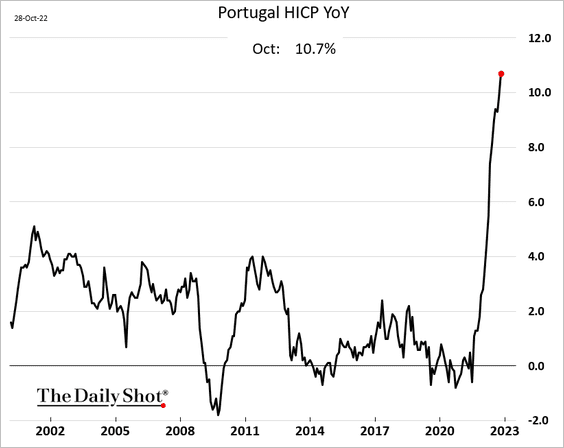
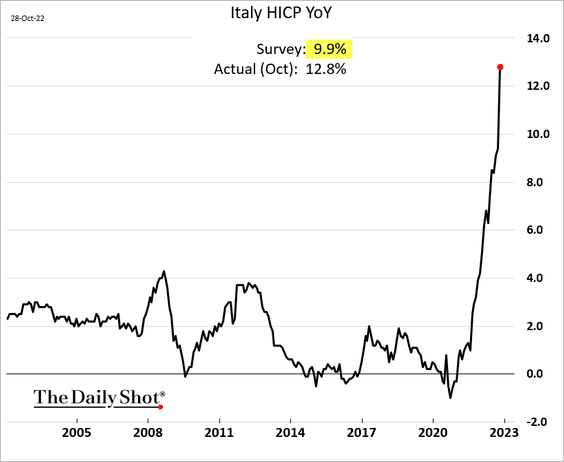
1. With the exception of Spain, where inflation is moderating, the October CPI reports topped forecasts, hitting new highs.
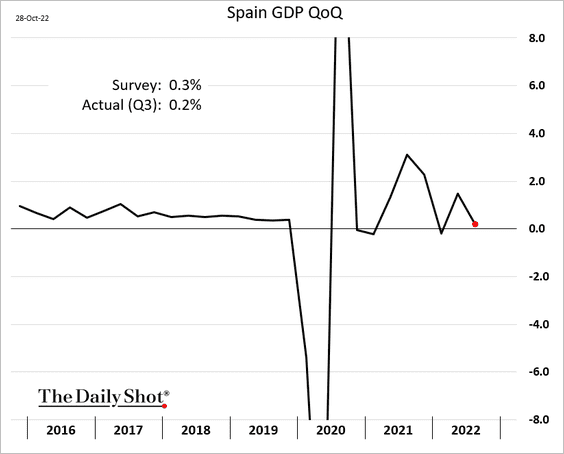
• Spain:
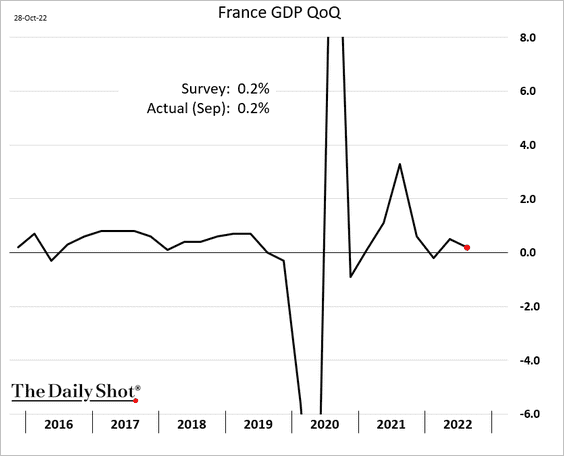
• France:
• Germany:
• Portugal:
• Italy:
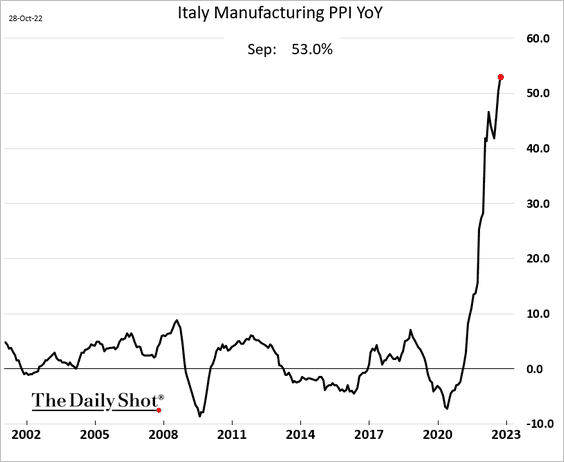
By the way, Italy’s PPI is above 50%.
• Here is an estimate for the Eurozone-level CPI from Barclays Research.
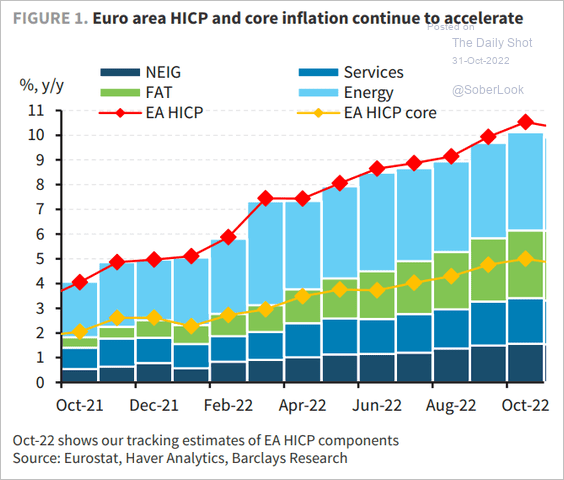 Source: Barclays Research
• Inflation has been much stickier than expected.
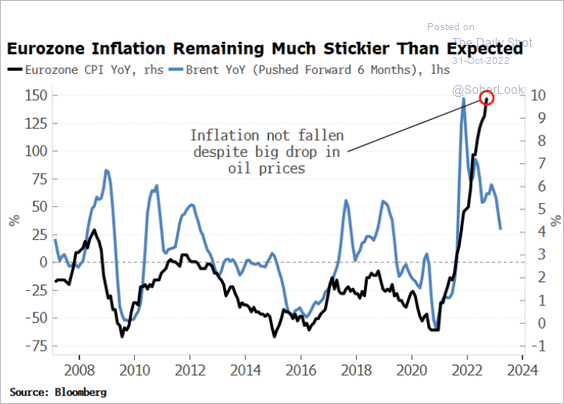 Source: Simon White, Bloomberg Markets Live Blog
• The market sees another 75 bps rate hike from the ECB in December.
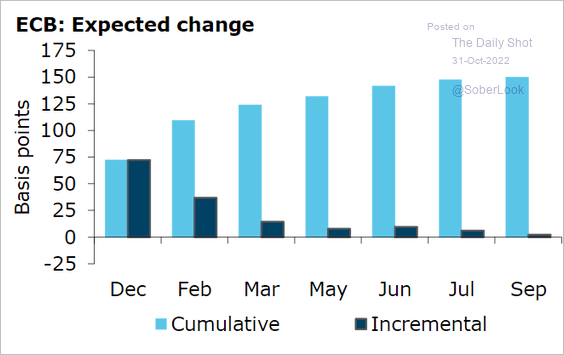 Source: @ANZ_Research
——————–
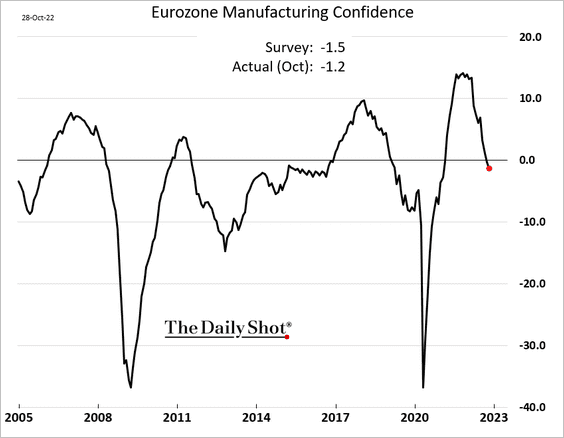
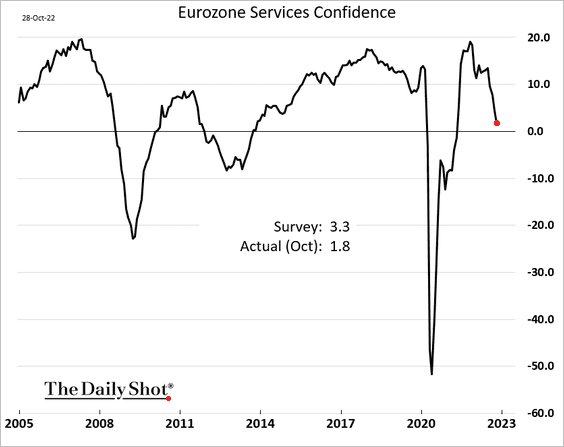
2. Economic sentiment has been softening.
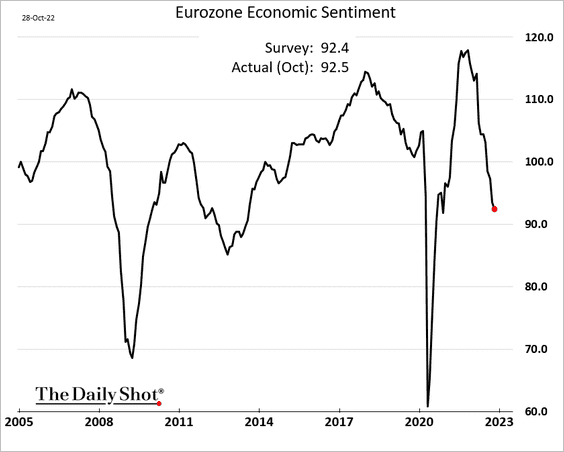
• Manufacturing:
• Services:
——————–
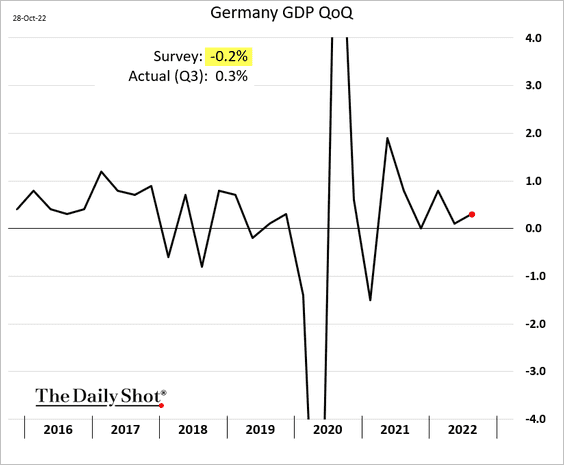
3. Germany’s economy unexpectedly expanded last quarter.
– German electricity consumption points to a slowdown in Q4.
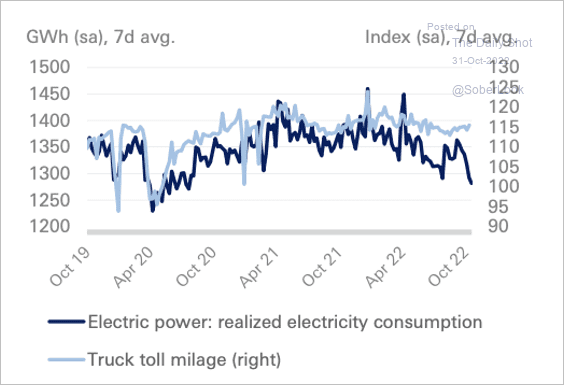 Source: Deutsche Bank Research
– Survey indicators also signal weakness ahead.
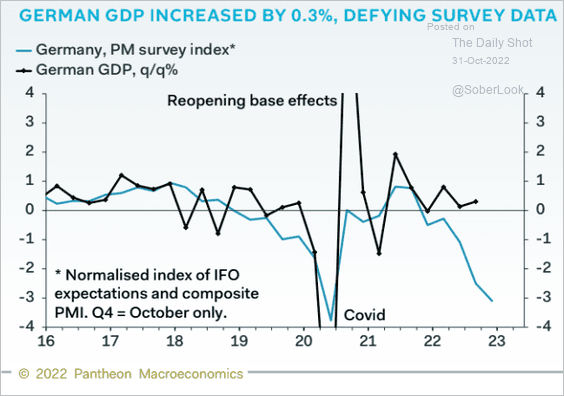 Source: Pantheon Macroeconomics
• French and Spanish economies also grew modestly in Q3.
——————–
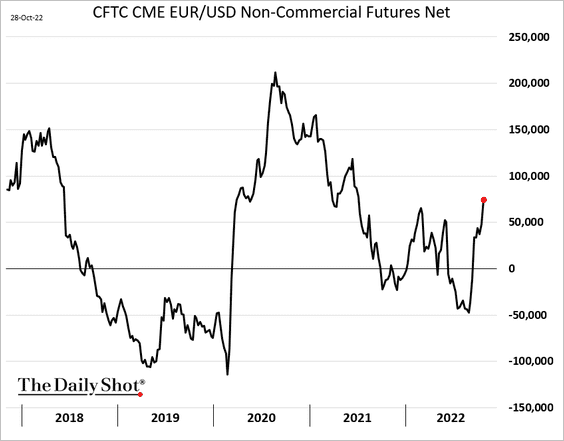
4. Speculative accounts have become more upbeat on the euro.
A large portion of the euro’s decline has been driven by the US dollar’s strength.
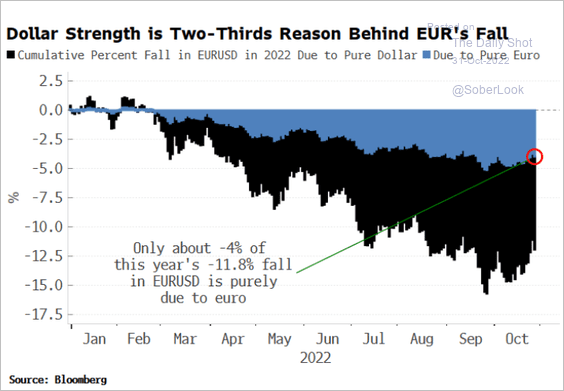 Source: Simon White, Bloomberg Markets Live Blog
Back to Index
Europe
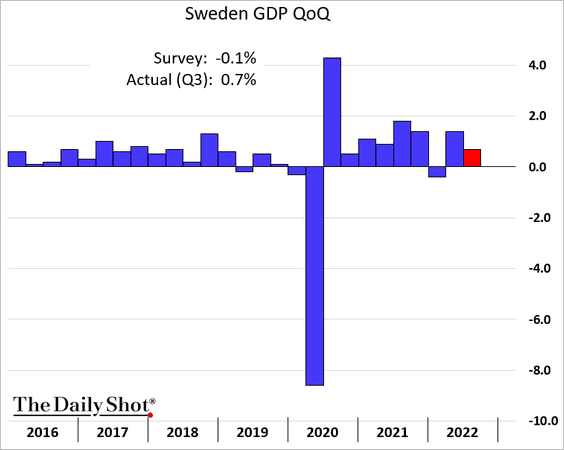
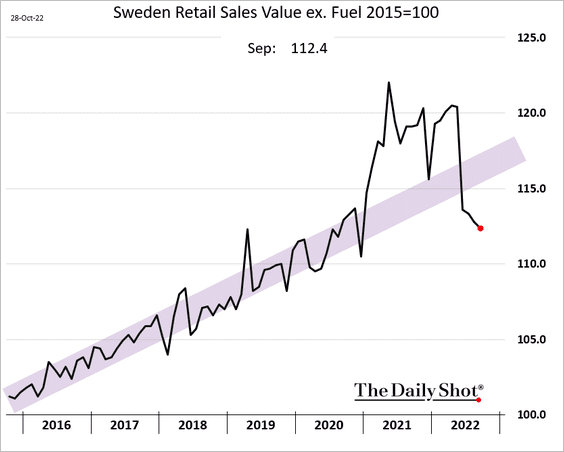
1. Sweden’s Q3 GDP growth topped expectations.
Retail sales have been softening.
——————–
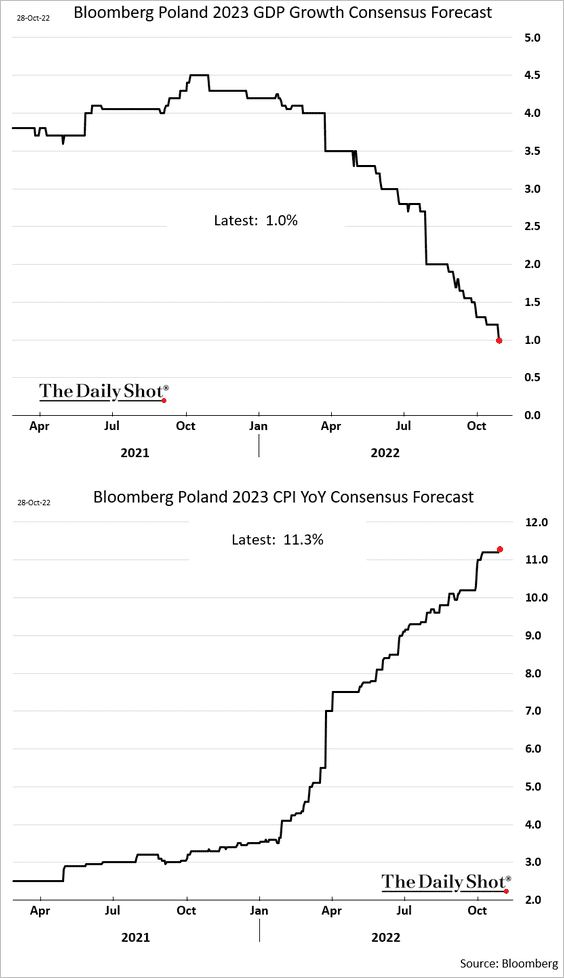
2. Poland’s projected growth for next year is now only 1%, while inflation is expected to top 11% in 2023.
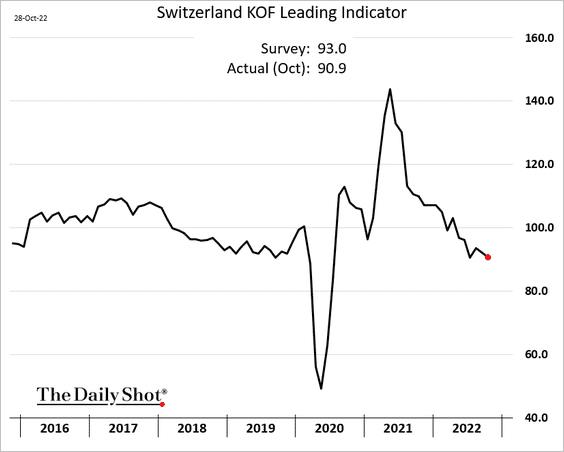
3. The Swiss leading index hit the lowest level since the initial COVID wave.
4. Next, we have some data on coal usage and air pollution in Europe.
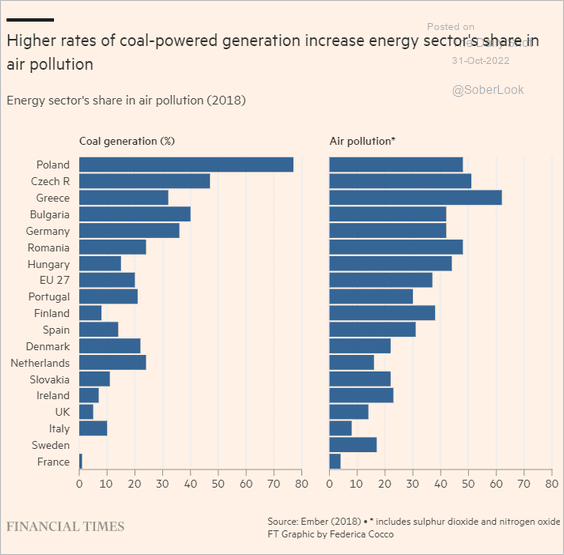 Source: @financialtimes Read full article
Back to Index
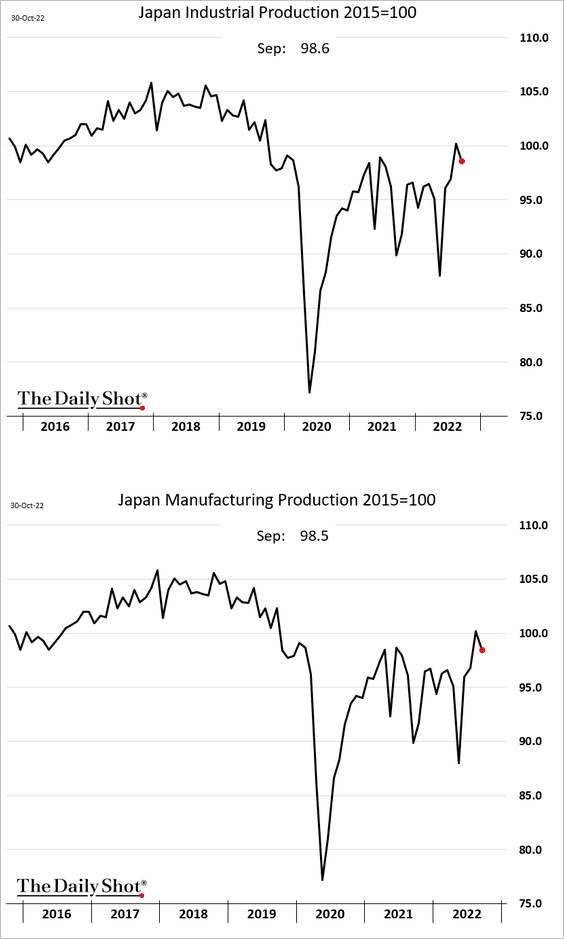
Japan
1. Industrial production declined in September.
2. Retail sales moved higher last month, but the nominal and real indicators are diverging.
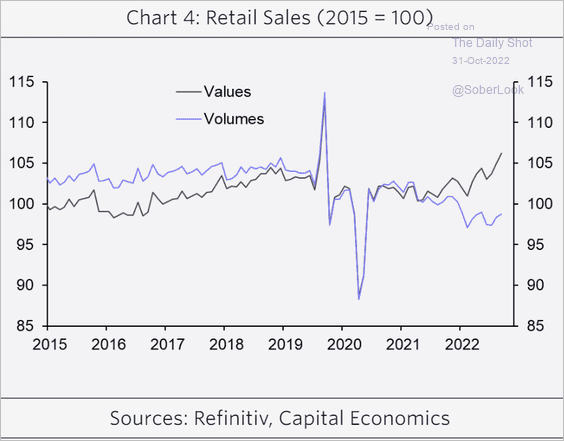 Source: Capital Economics
Back to Index
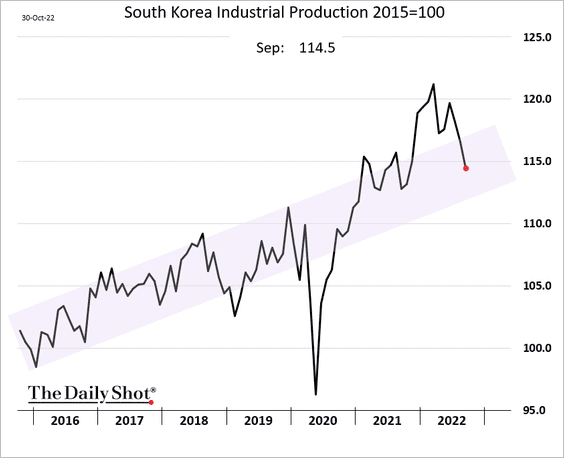
Asia – Pacific
1. South Korea’s industrial production is back inside the pre-COVID trend.
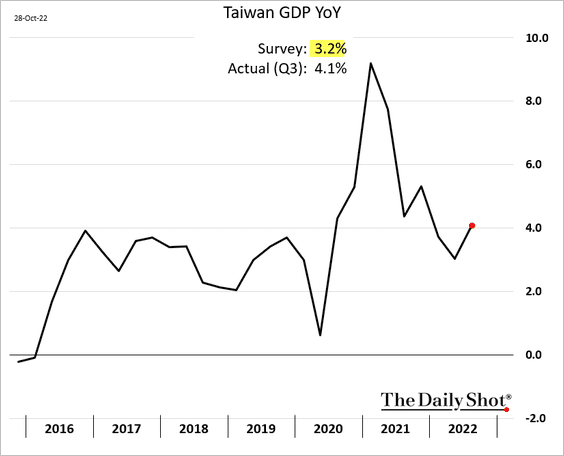
2. Taiwan’s Q3 GDP surprised to the upside.
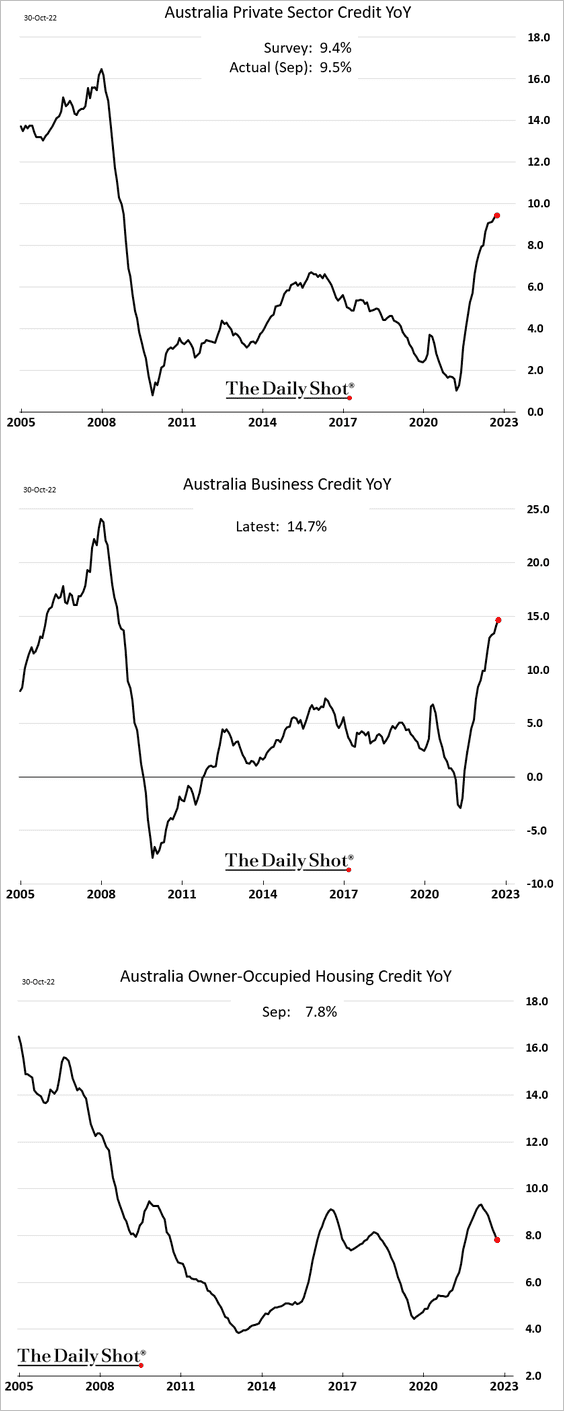
3. Next, we have some updates on Australia.
• Private-sector credit continues to grow, driven by business loans. Housing credit growth is moderating.
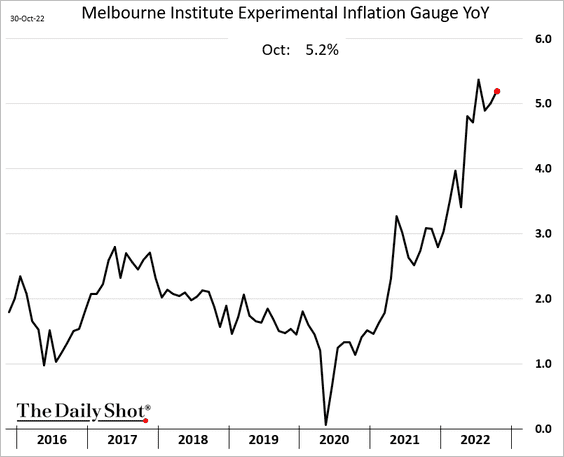
• Inflation strengthened a bit last month.
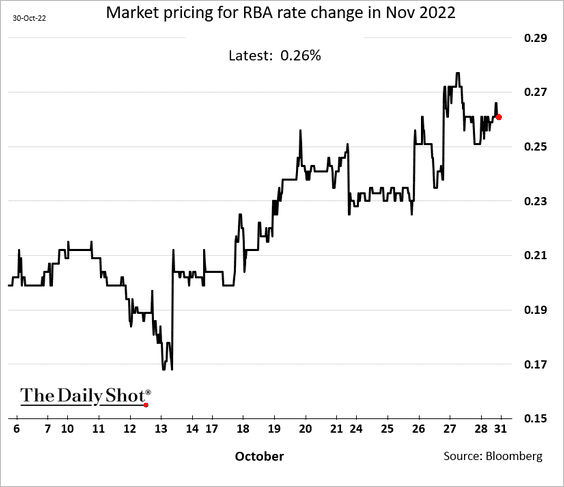
• What should we expect from the RBA?
 Source: @business, @Swatisays, @GarfieldR1966 Read full article
The market sees a 25 bps rate hike.
Back to Index
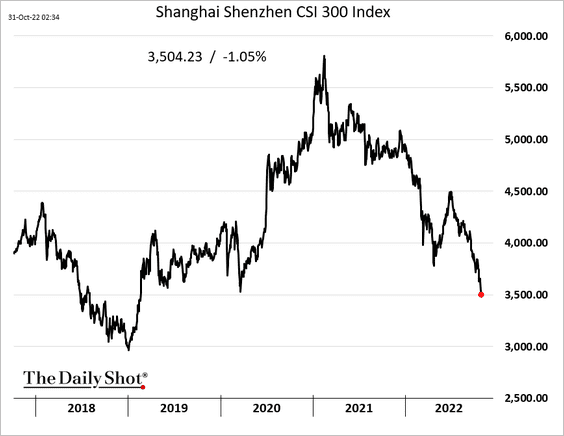
China
1. Mainland-listed stocks remain under pressure.
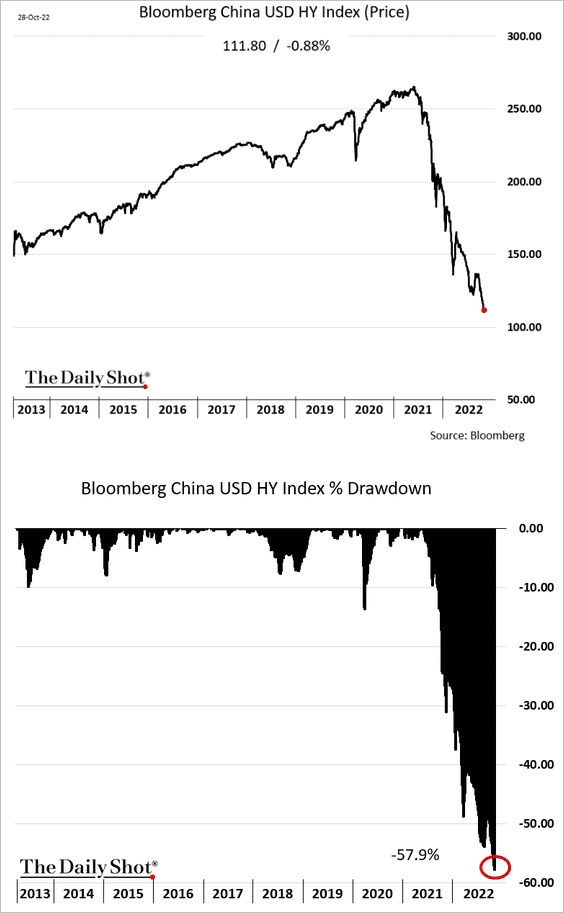
2. The USD-denominated HY index drawdown is nearing 60%.
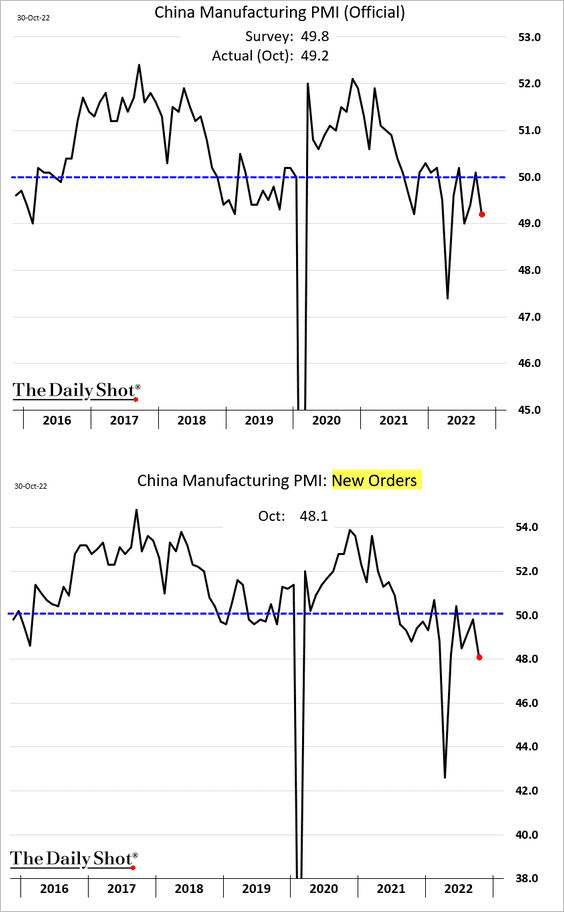
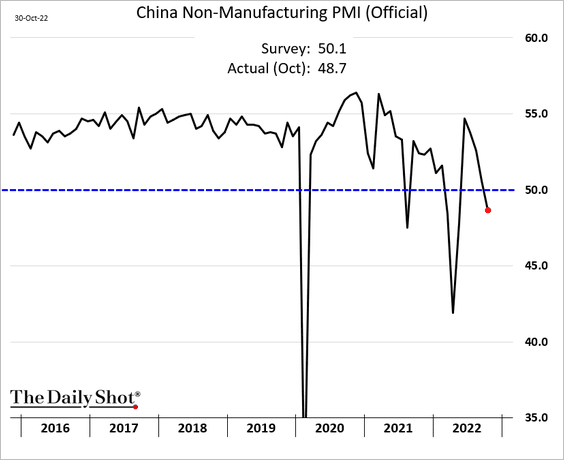
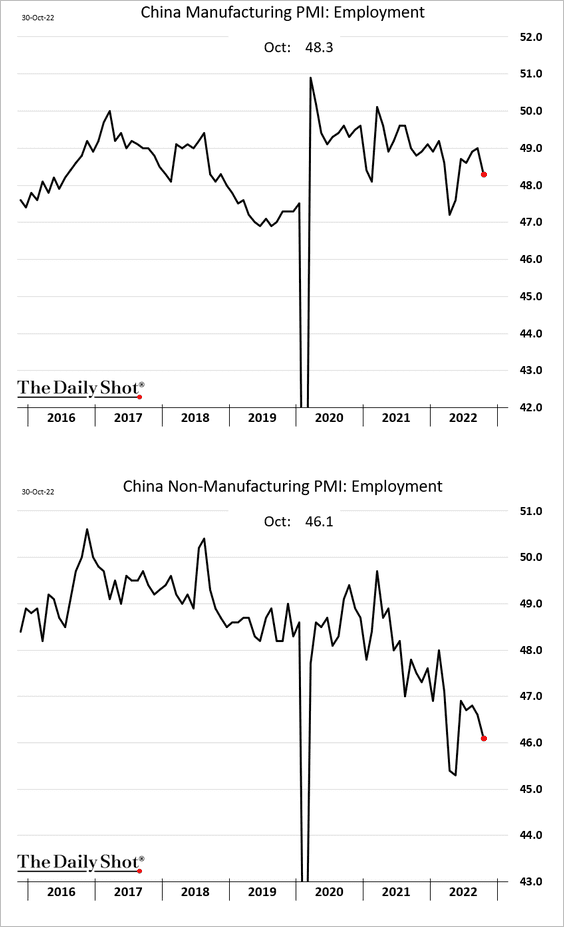
3. The official PMI indicators signal a contraction in business activity in October.
• Manufacturing:
• Non-manufacturing:
Employment indices moved lower.
——————–
4. The credit impulse remains low relative to prior cycles, which could stall a meaningful recovery.
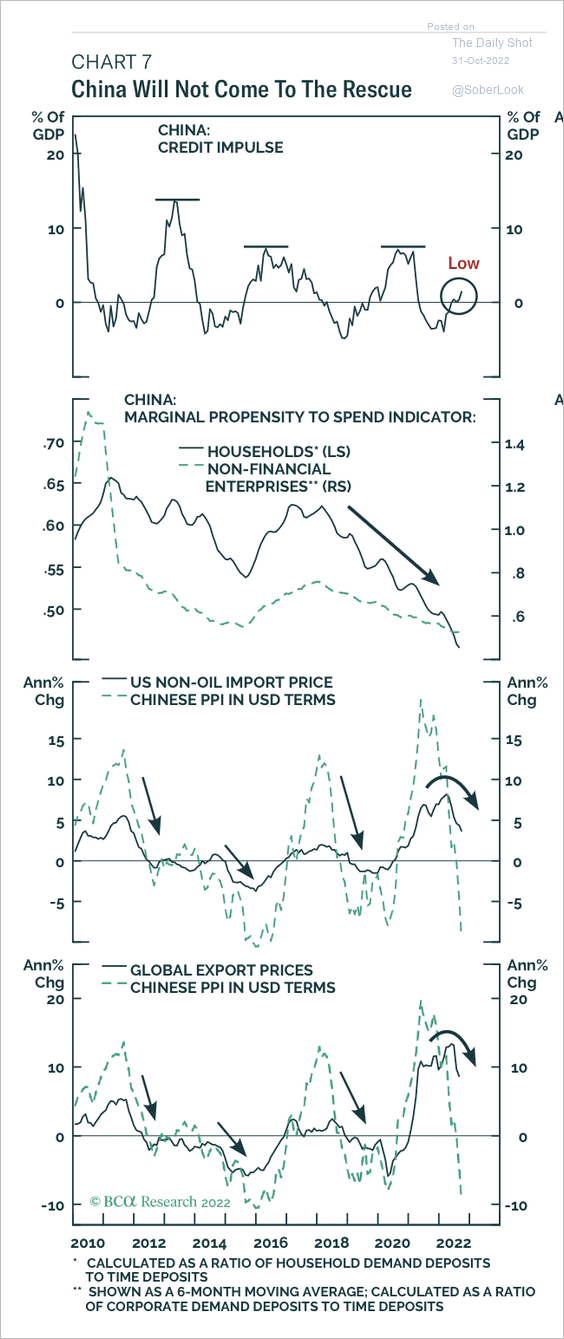 Source: BCA Research
Back to Index
Emerging Markets
1. Let’s begin with Brazil.
• Lula defeated Bolsonaro.
 Source: Reuters Read full article
• The Brazilian real typically weakens six months before elections and then gradually recovers.
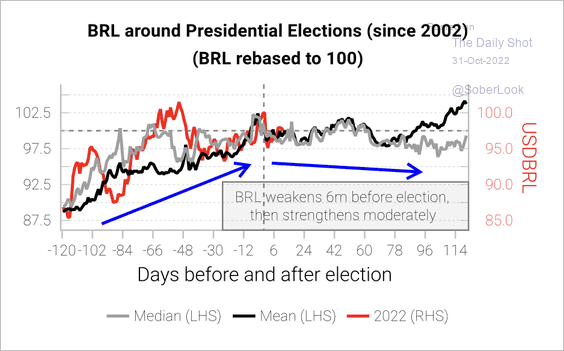 Source: Variant Perception
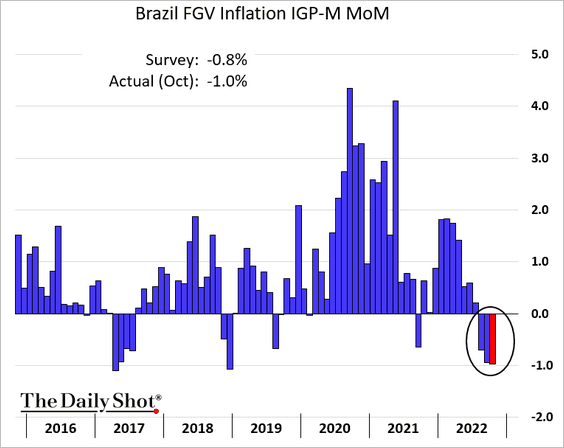
• Inflation continues to ease.
• Declining inflation and a lower cash rate could benefit Brazilian government bonds.
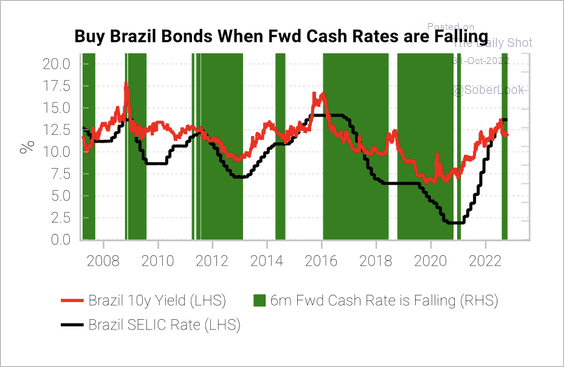 Source: Variant Perception
——————–
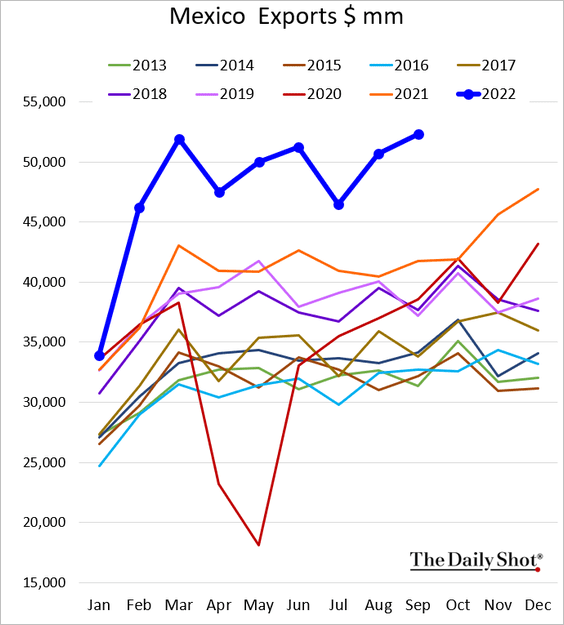
2. Mexico’s trade deficit shrunk sharply in September, …
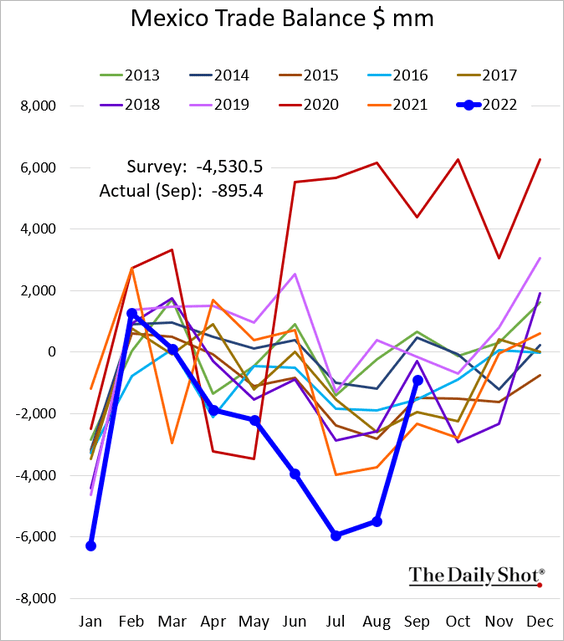
… as exports surge.
——————–
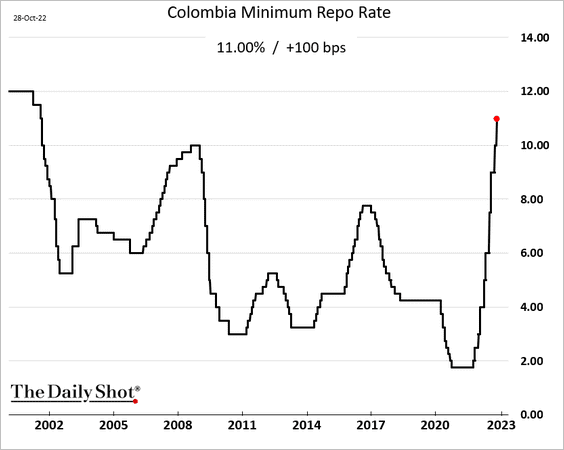
3. Colombia’s central bank hiked rates again.
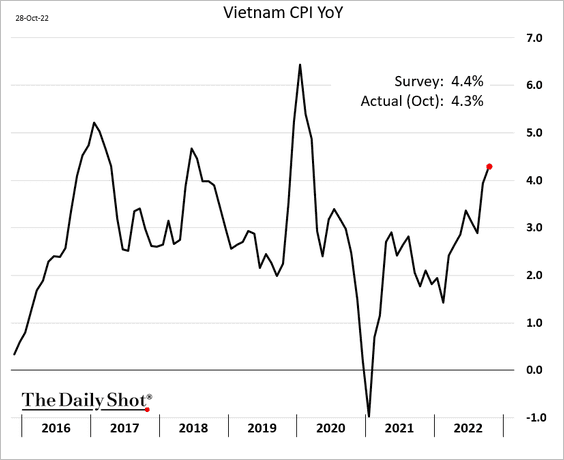
4. Vietnam’s inflation is grinding higher.
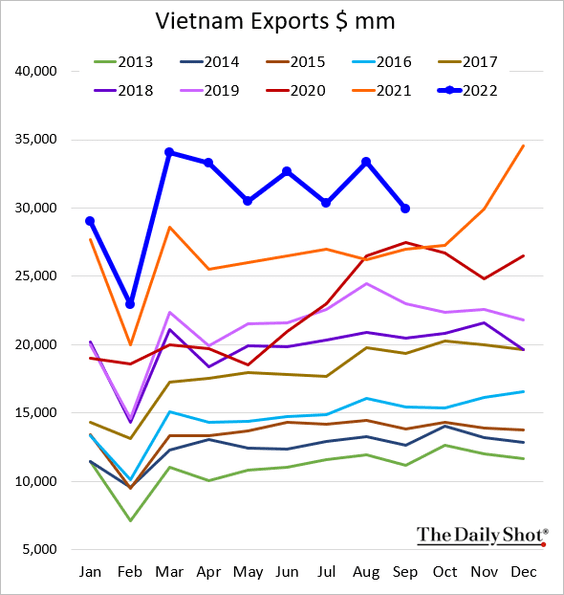
Exports softened in September.
——————–
5. Peak inflation across EM countries could mark the end of the hiking cycle.
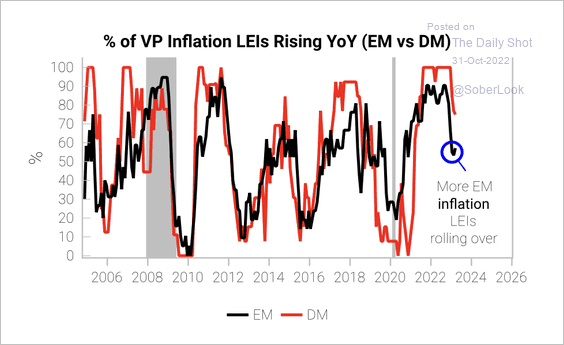 Source: Variant Perception
6. Bond fund outflows have been relentless.
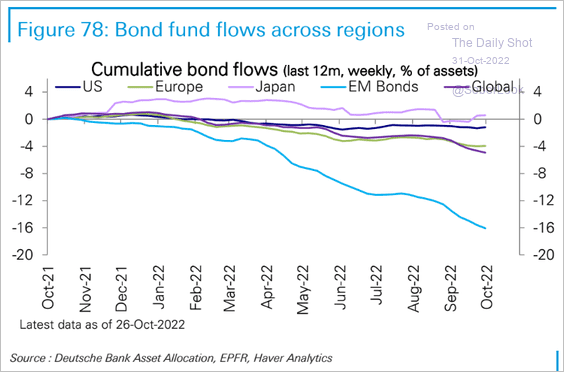 Source: Deutsche Bank Research
Back to Index
Commodities
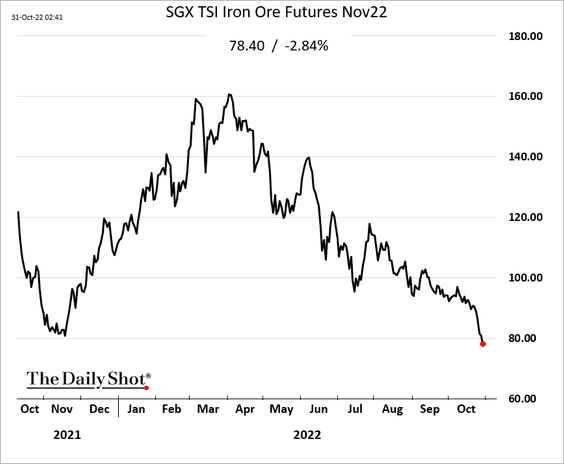
1. China’s softening demand for steel …
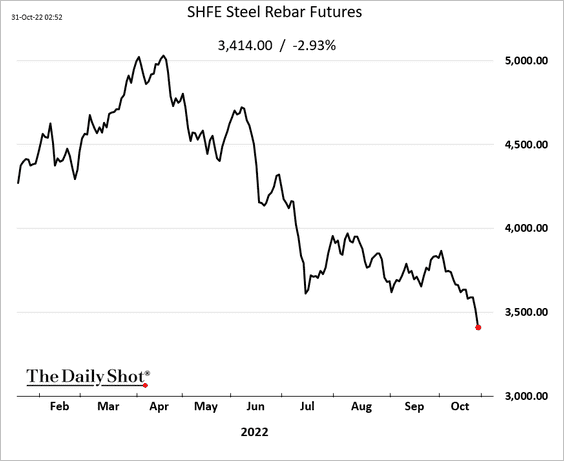
… continues to pressure iron ore.
——————–
2. Wheat surged after Russia pulled out of the Ukrainian grain export deal.
 Source: S&P Global Commodity Insights
 Source: Reuters Read full article
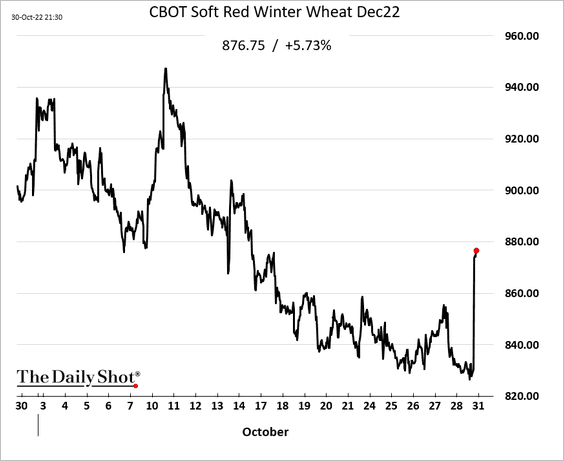
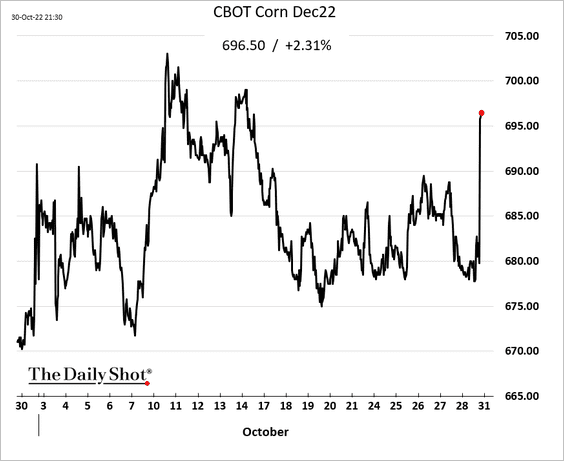
Corn futures are up as well.
Here are Ukraine’s grain exports since the start of the war.
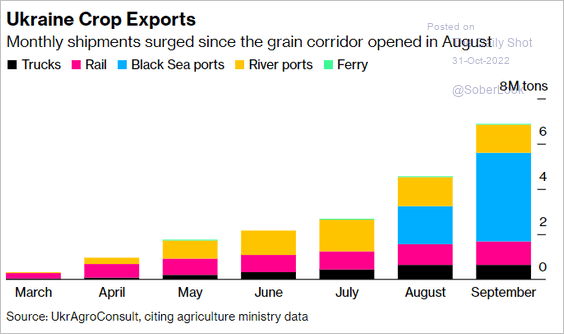 Source: @bpolitics Read full article
——————–
3. Industrial metals have underperformed this year, while energy remains on top. (chart shows YTD performance)
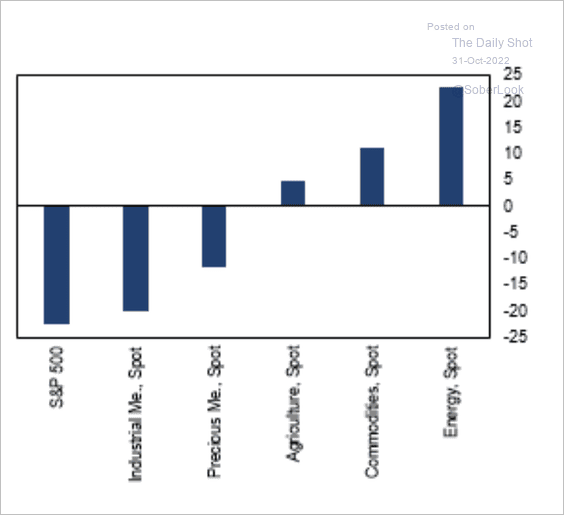 Source: Fitch Solutions Macro Research
4. This chart shows events that contributed to gold price moves.
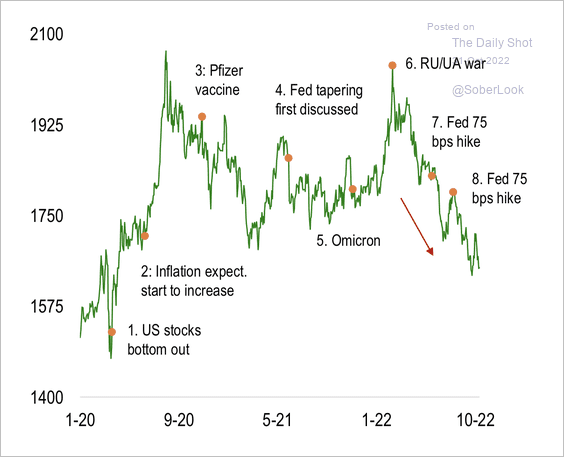 Source: Numera Analytics
5. Sentiment in gold, oil, and copper remains weak.
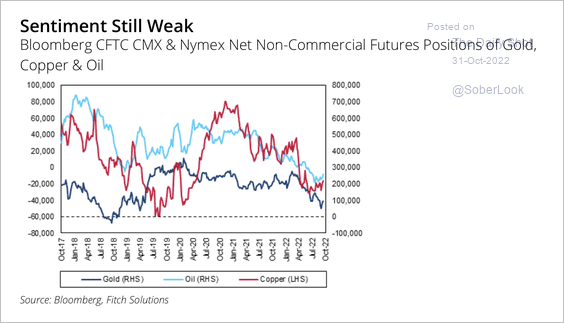 Source: Fitch Solutions Macro Research
Back to Index
Energy
1. Saudi oil revenue surged this year.
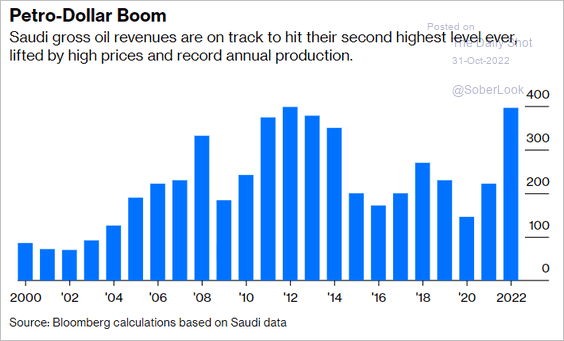 Source: @JavierBlas, @opinion Read full article
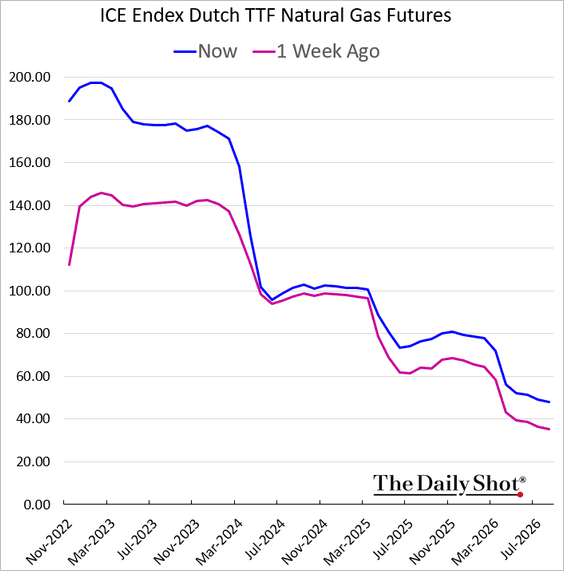
2. European natural gas front-end contango increased amid warmer weather and ample storage.
3. Solar energy growth has been exceeding expectations.
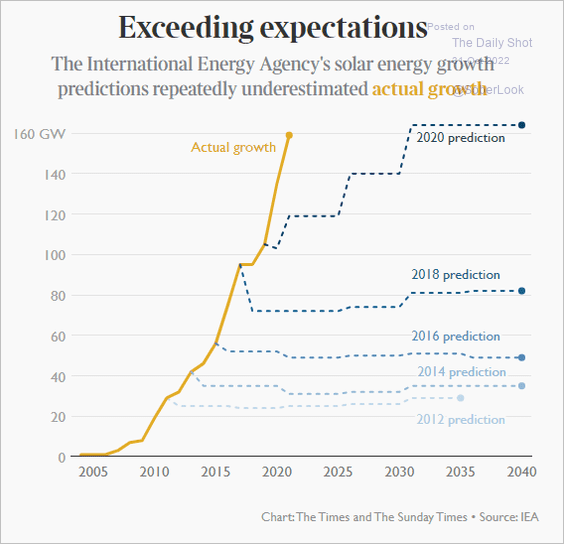 Source: @EmberClimate, @Times__Earth Read full article
Back to Index
Equities
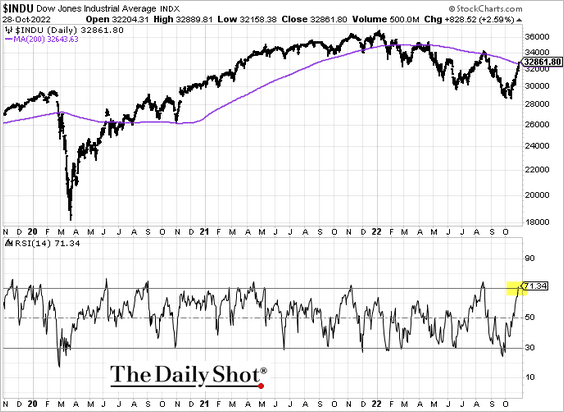
1. The S&P 500 closed above the 50-day moving average.
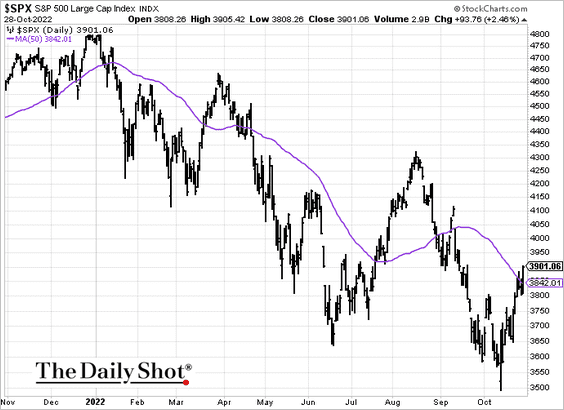
The Dow closed above its 200-day moving average and is now in overbought territory.
——————–
2. The Reddit crowd doesn’t exhibit significant participation in the recent equity bounce.
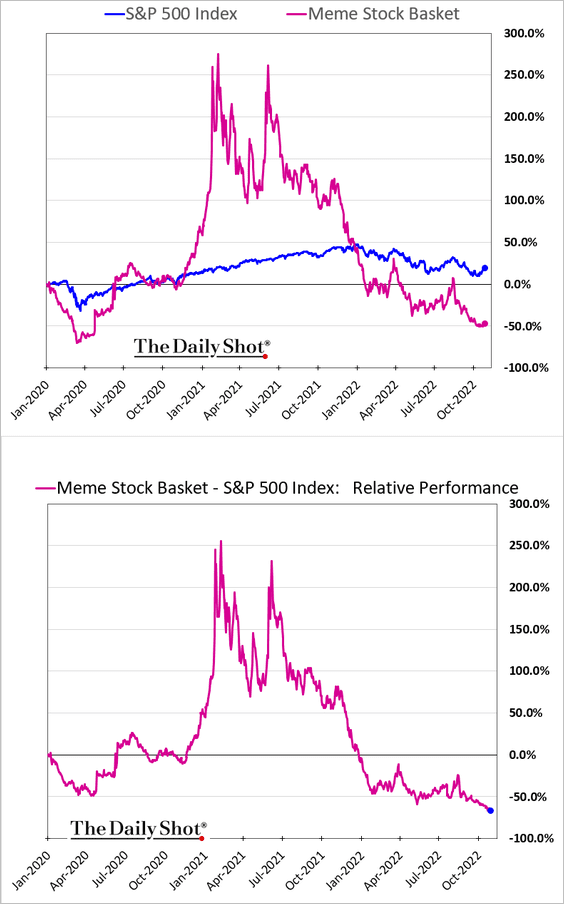
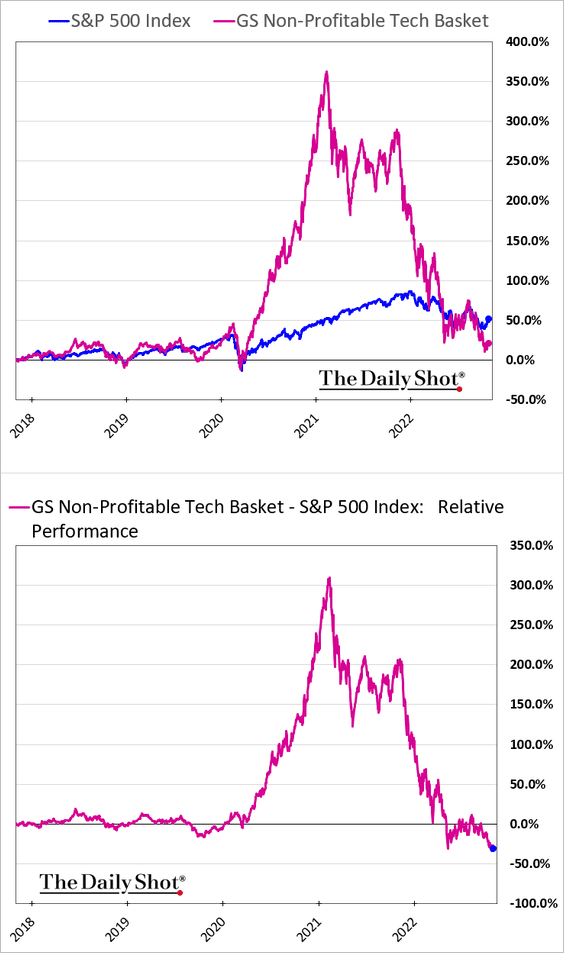
The non-profitable tech bubble, which was fueled by the Reddit crowd, has deflated.
——————–
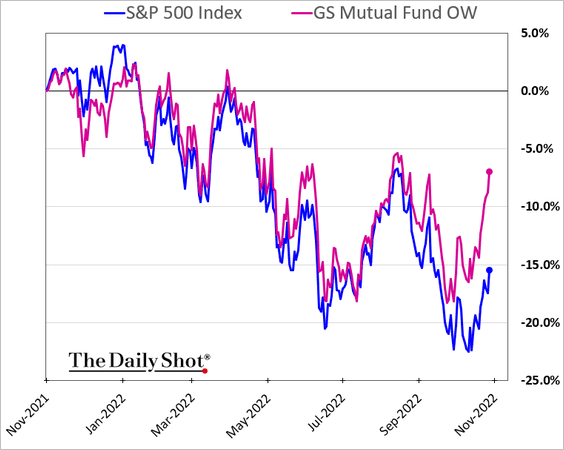
3. Mutual funds’ favorite stocks have been outperforming.
4. Will growth shares continue to trail value?
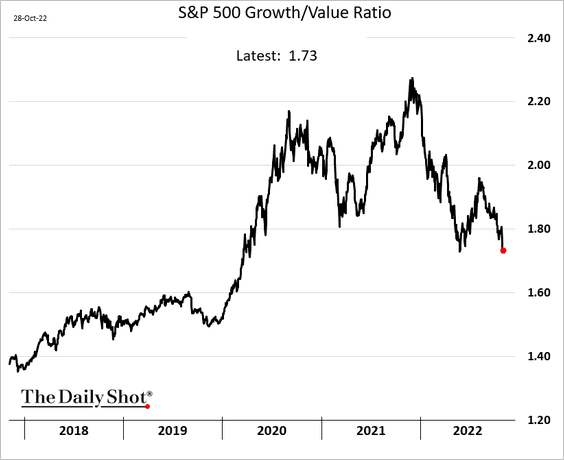
Most of the recent earnings downgrades have been in growth stocks.
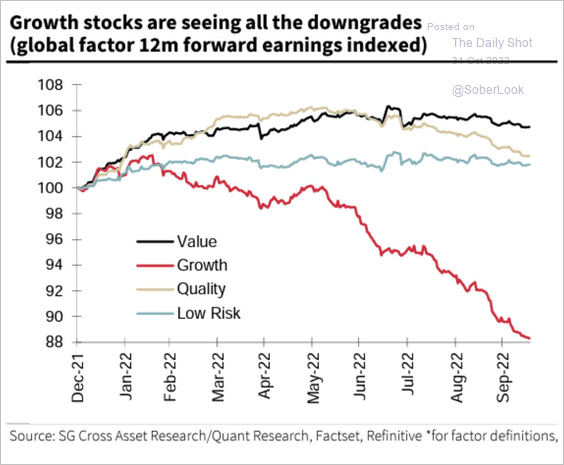 Source: Societe Generale Cross Asset Research; @simon_ree
——————–
5. About a turn-and-a-half of the S&P 500 forward PE multiple is attributable to tech mega-caps.
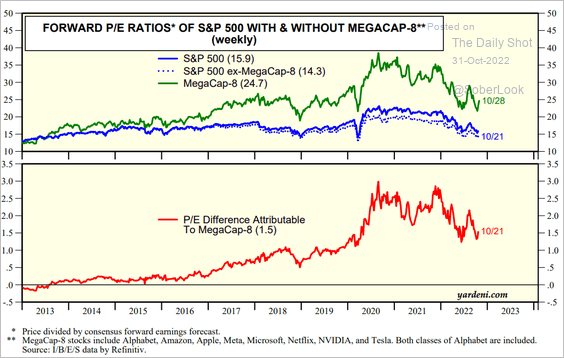 Source: Yardeni Research
6. Bearish bets on tech mega-caps surged last week.
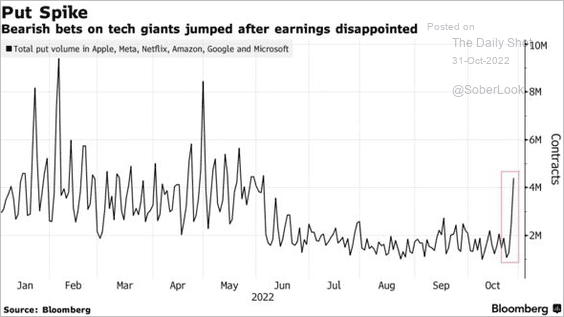 Source: @technology, @jwittenstein, @lena_popina, @JPBarnert Read full article
7. Earnings beats have been below average in this reporting season.
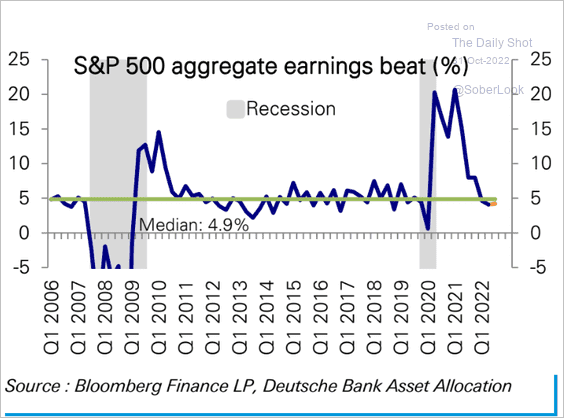 Source: Deutsche Bank Research
The Q3 earnings estimate ticked higher due to Amazon’s beat.
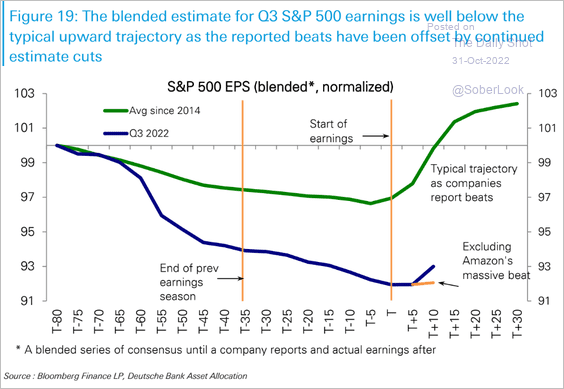 Source: Deutsche Bank Research
——————–
8. Higher equity valuations require a decline in real yields (2 charts).
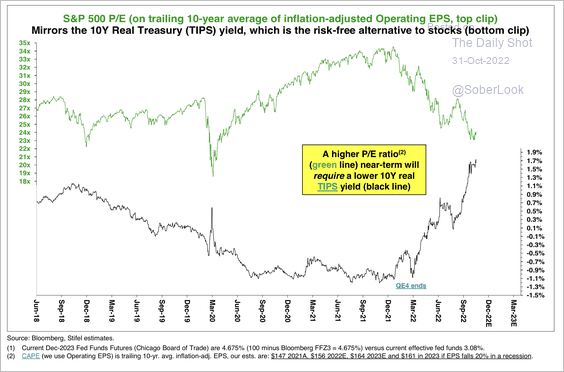 Source: Stifel
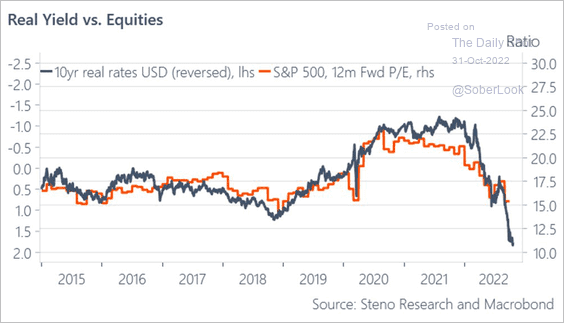 Source: @AndreasSteno
——————–
9. Financials and tech have been seeing inflows in recent weeks (2 charts).
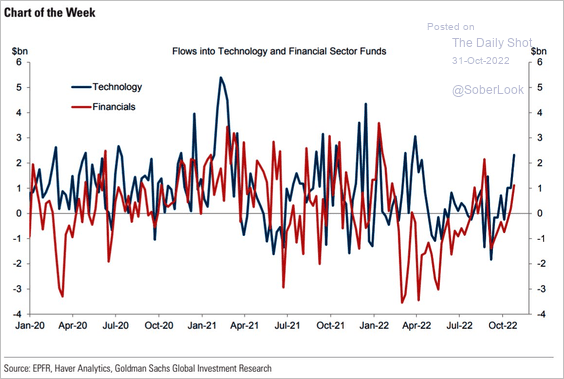 Source: Goldman Sachs; @WallStJesus
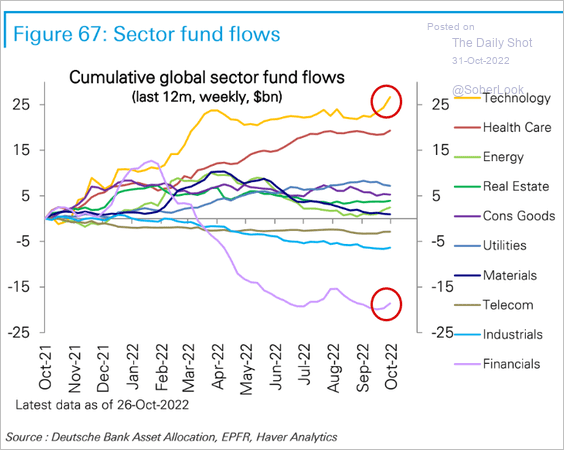 Source: Deutsche Bank Research
——————–
10. SPAC deals are still being announced, which for many companies has been the only way to go public these days. Many merger deadlines are coming up, prompting SPACs to close deals.
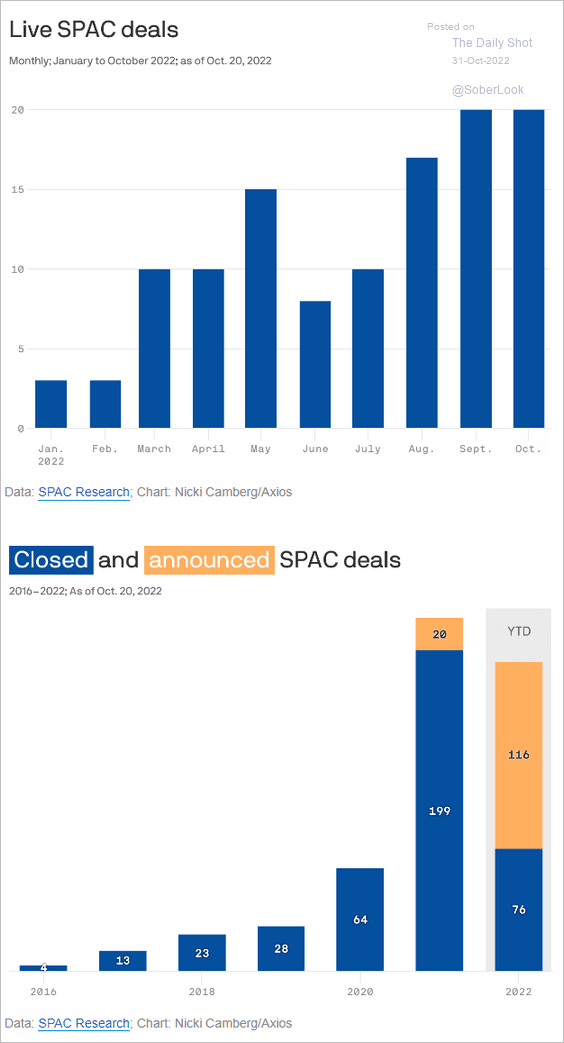 Source: @axios
11. Inverse ETF activity has been surging.
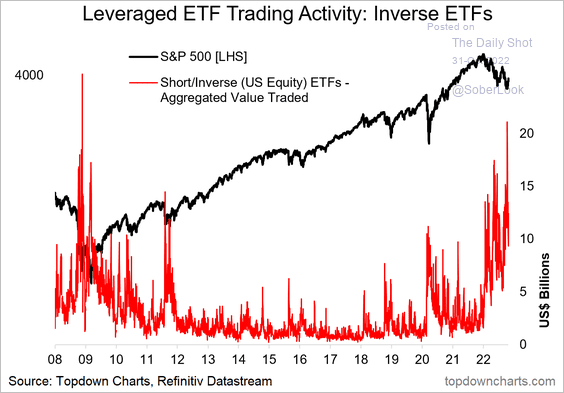 Source: @Callum_Thomas, @topdowncharts
12. Volatility markets are focused on the payrolls and the CPI reports. Here is the S&P 500 implied vol term structure.
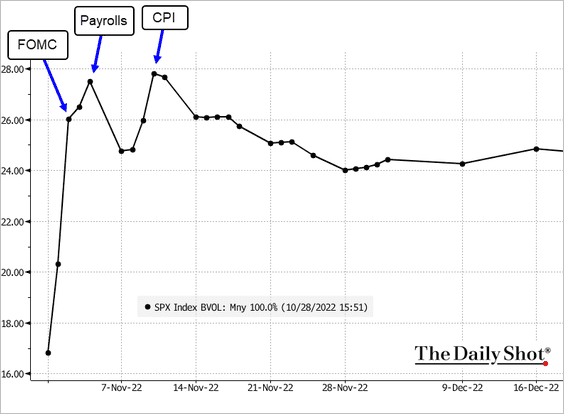 Source: @TheTerminal, Bloomberg Finance L.P.
Back to Index
Alternatives
1. Private equity markets have been growing faster than public ones.
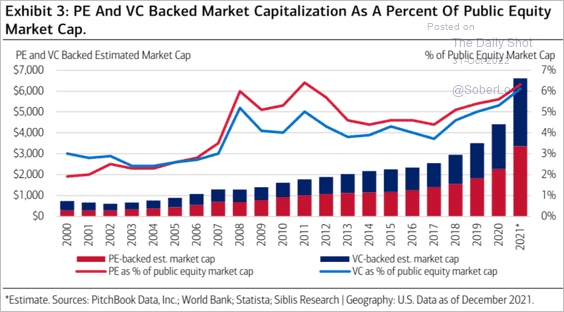 Source: Merrill Lynch
2. The median US seed valuation is well above last year’s levels as investors focus on larger projects.
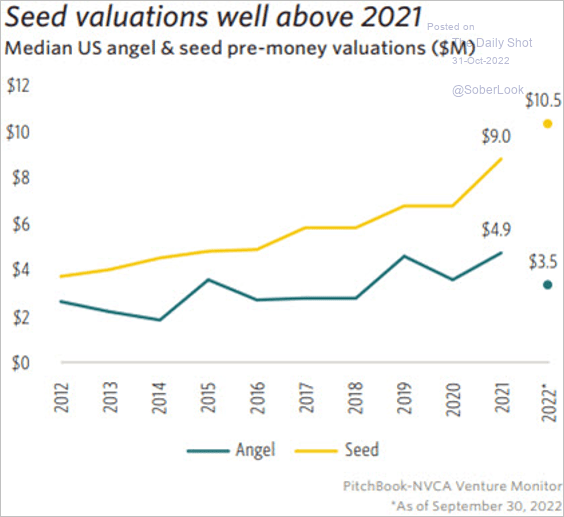 Source: PitchBook
3. Valuation pressure led to several canceled SPAC deals this year, according to PitchBook.
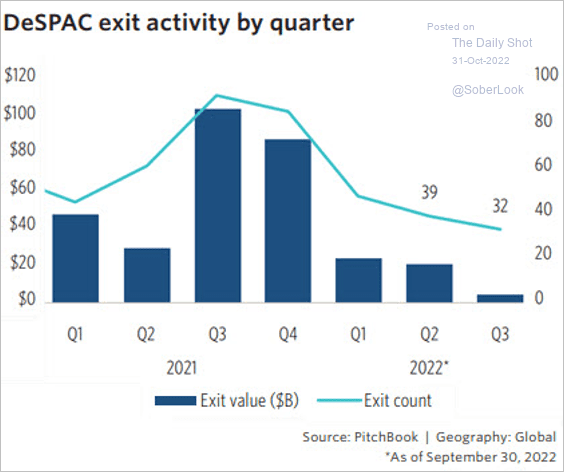 Source: PitchBook
Back to Index
Credit
1. Twitter loans will boost banks’ hung debt pile.
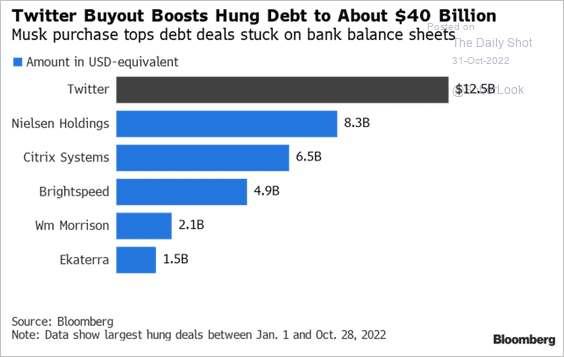 Source: @markets, @jillrshah, @claireruckin Read full article
More LBO debt on the way?
 Source: @WSJ Read full article
——————–
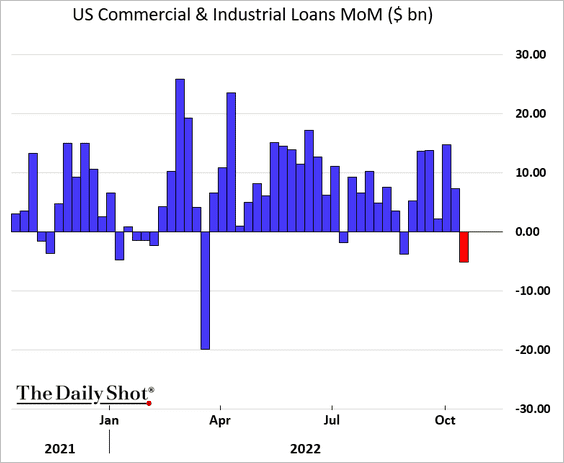
2. Will we see a pullback in US business lending?
Back to Index
Rates
1. It’s been a really bad year for Treasuries.
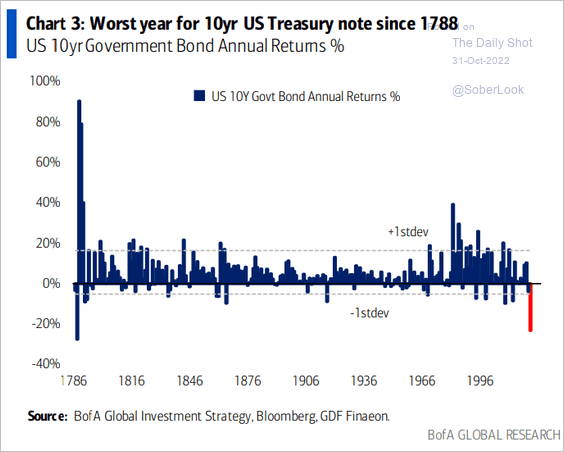 Source: BofA Global Research
 Source: BCA Research
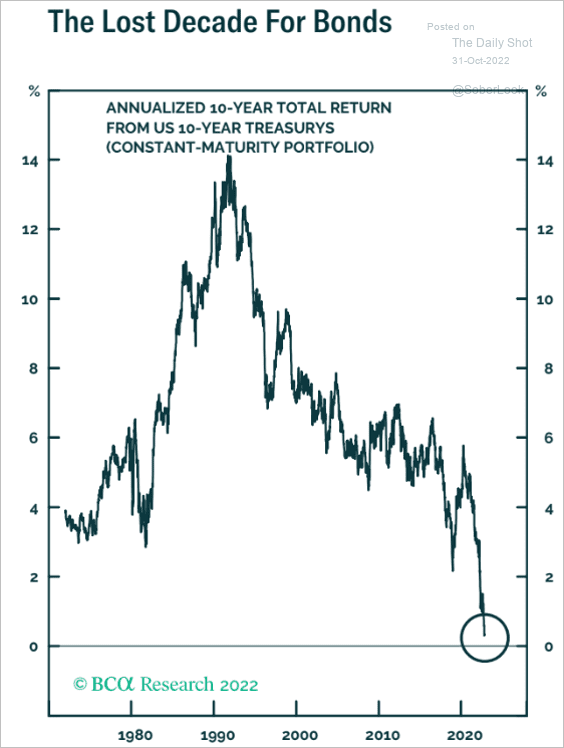
Long-term debt 10-year rolling returns hit a 50-year low.
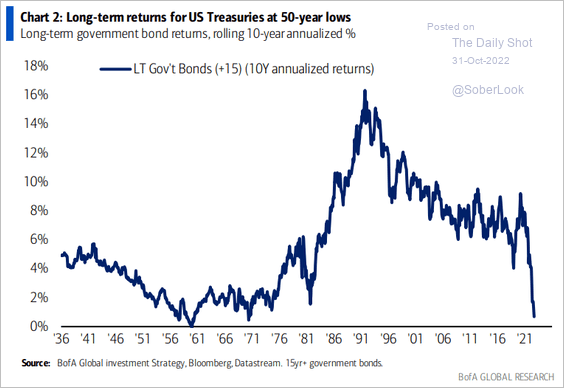 Source: BofA Global Research
——————–
2. TIPS valuations are out of line with commodities.
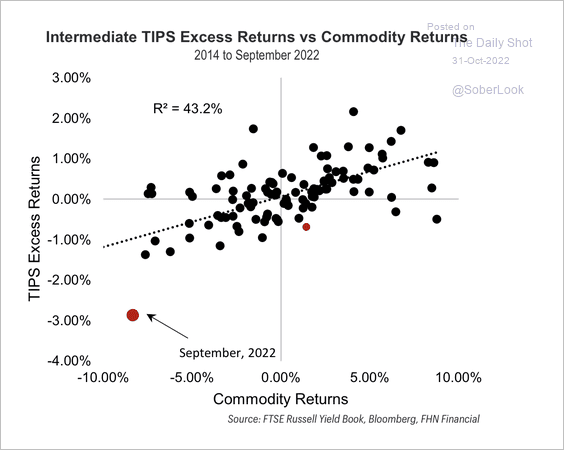 Source: FHN Financial
Back to Index
Global Developments
1. Global manufacturing activity is weak as demand deteriorates.
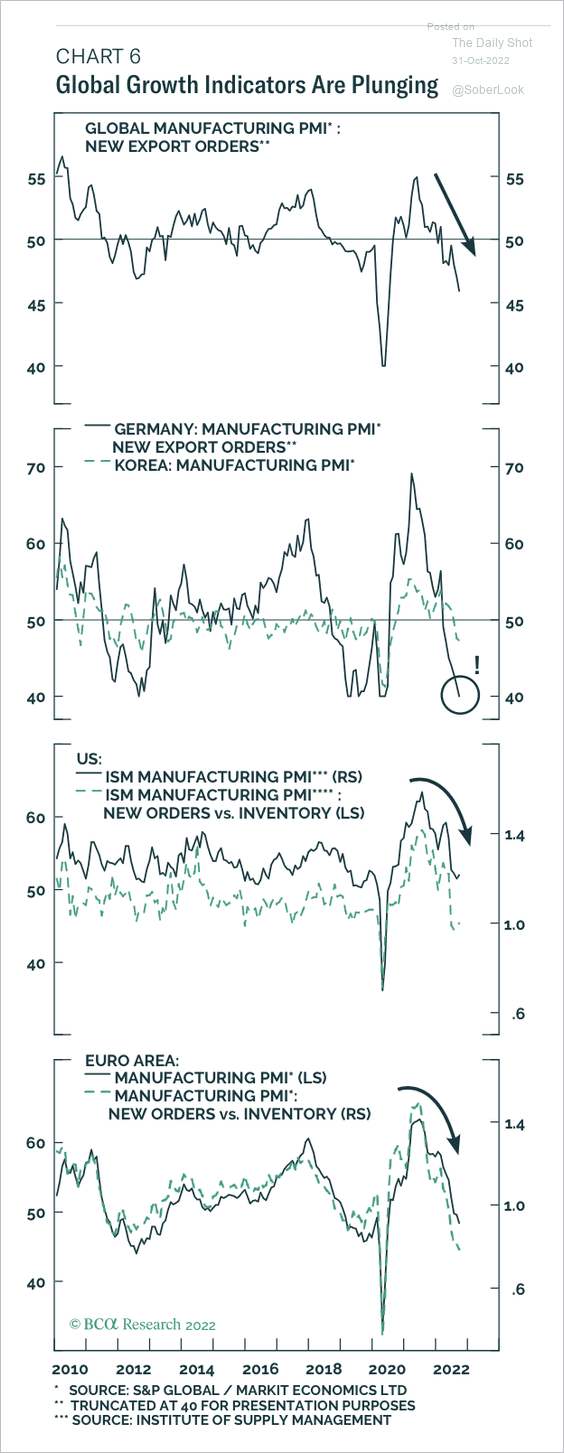 Source: BCA Research
2. A pause in bond yield gains and a sell-off in European natural gas prices have fueled another risk-on phase for markets.
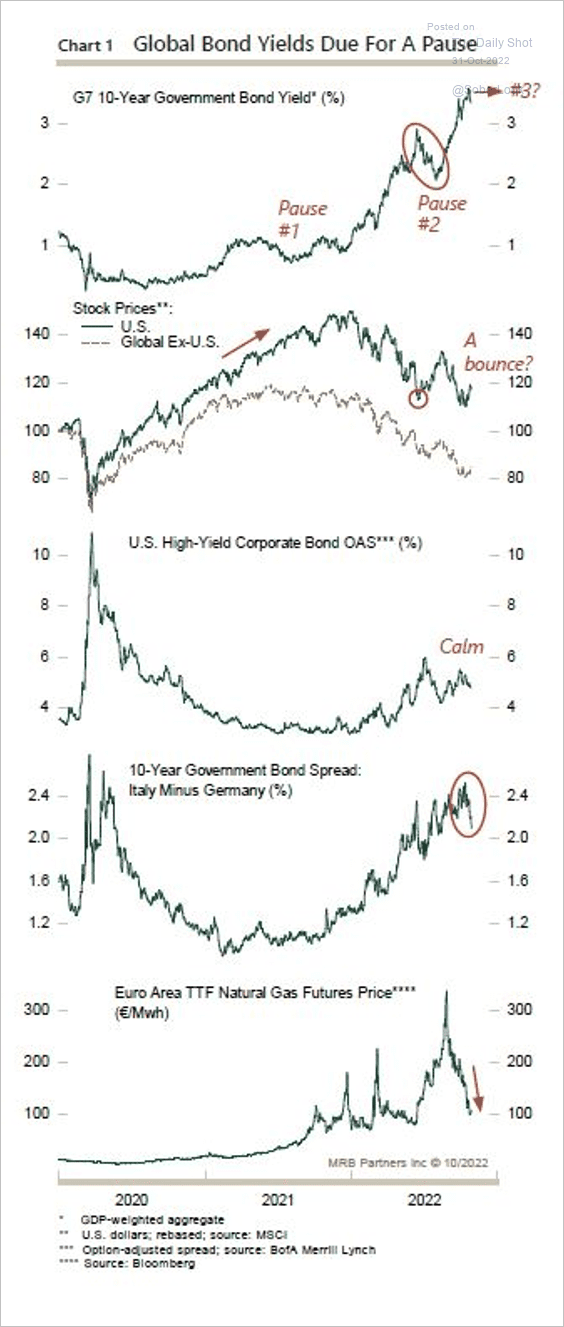 Source: MRB Partners
3. The CPI diffusion index is signaling inflation peak.
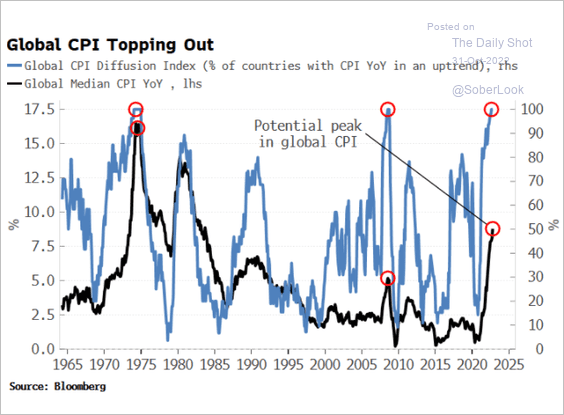 Source: Simon White, Bloomberg Markets Live Blog
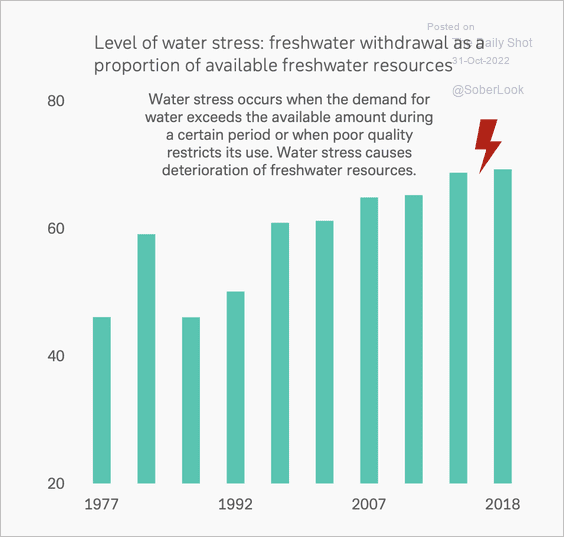
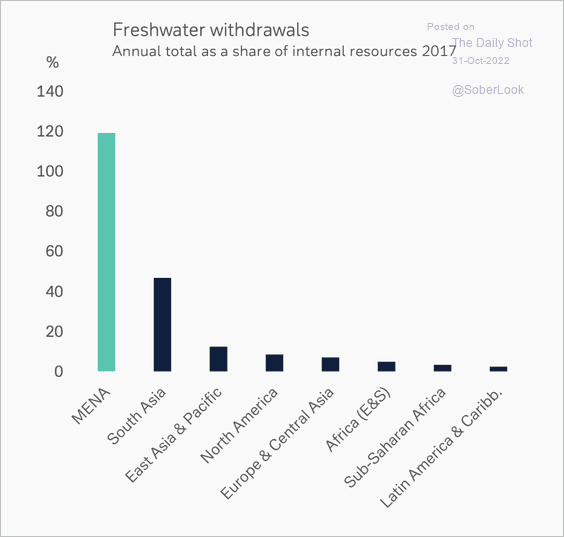
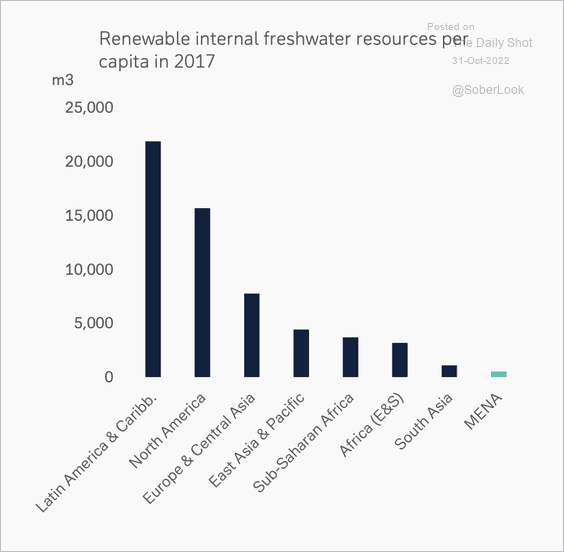
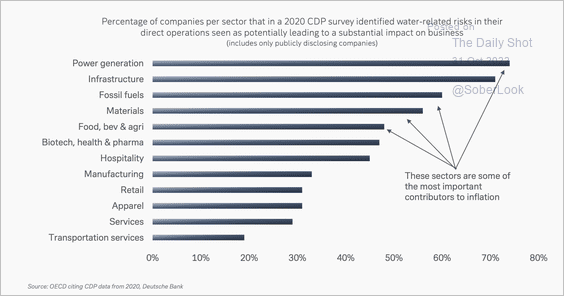
4. Global “water stress” is rising, especially in the MENA region. (3 charts)
 Source: Deutsche Bank Research
 Source: Deutsche Bank Research
 Source: Deutsche Bank Research
Companies have identified water-related risks as having a potentially large impact on operations, particularly in power and infrastructure.
 Source: Deutsche Bank Research
Back to Index
Food for Thought
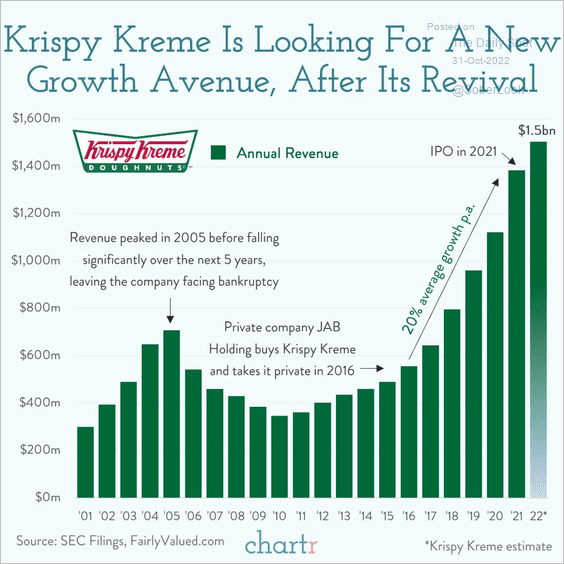
1. Krispy Kreme’s revival:
 Source: @chartrdaily
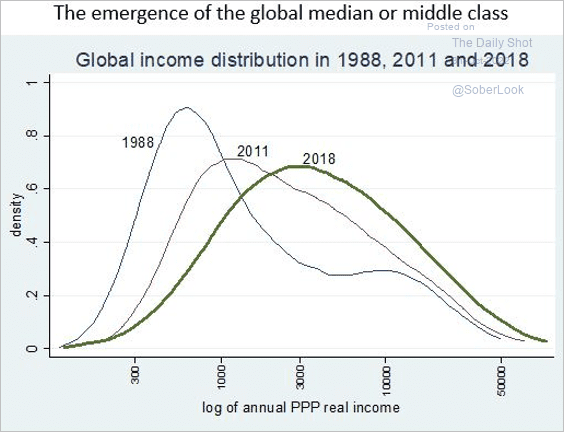
2. Global income distribution:
 Source: @BrankoMilan
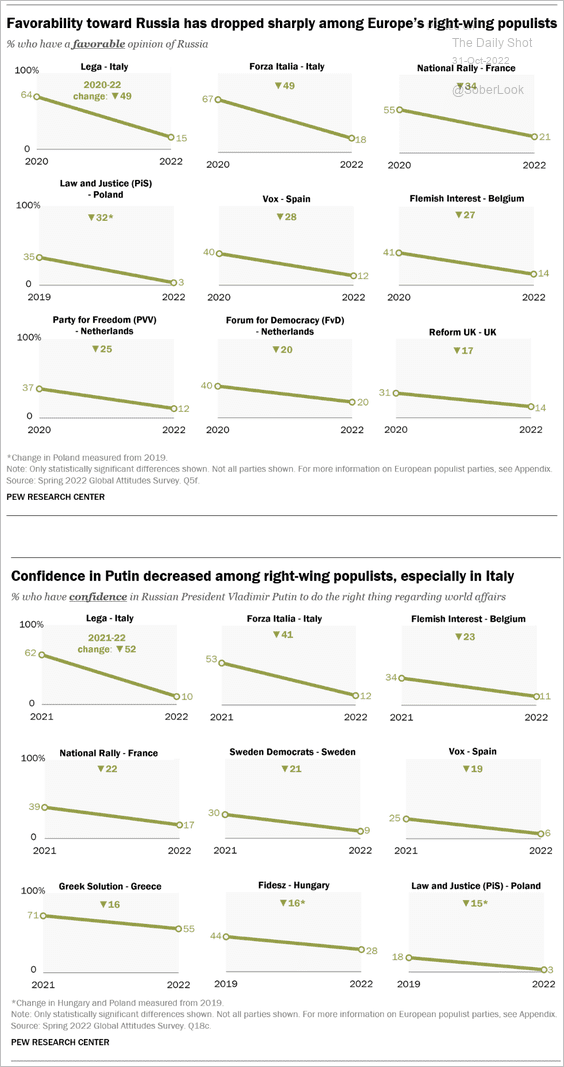
3. European right-wing populists’ views on Russia and Putin:
 Source: Pew Research Center
4. Defense expenditure:
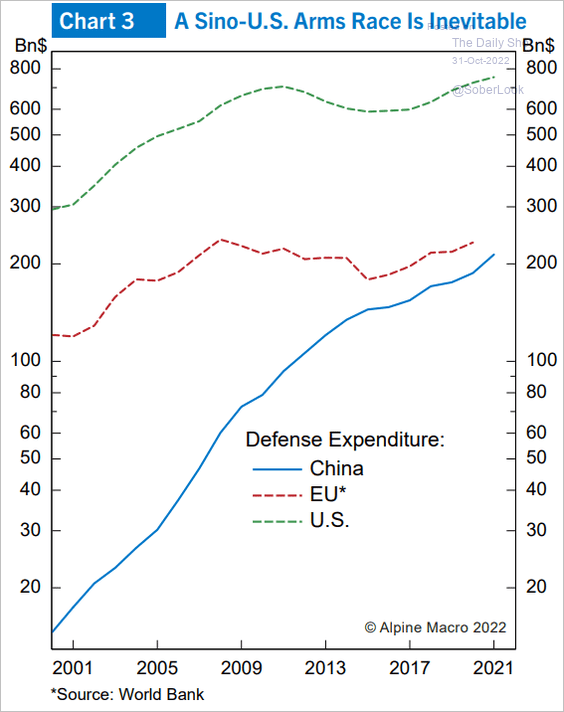 Source: Alpine Macro
5. Ukrainians’ views on continuing the war with Russia:
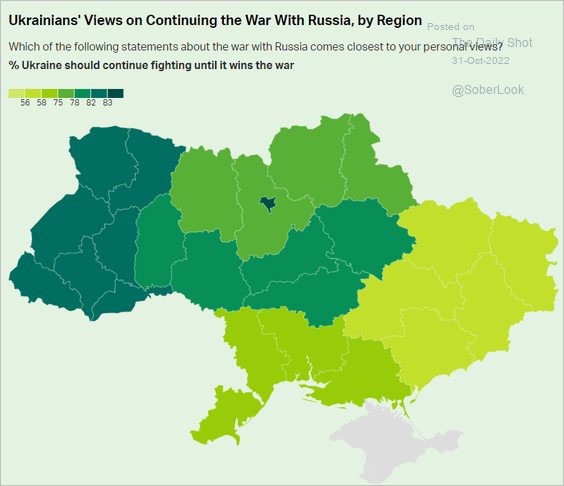 Source: Gallup Read full article
6. Most stressed countries:
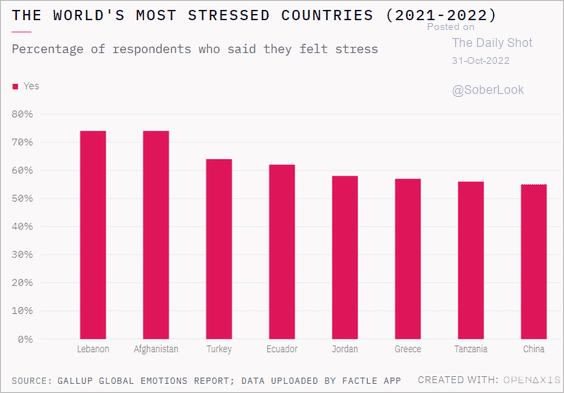 Source: @OpenAxisHQ
7. Eligible Black voters:
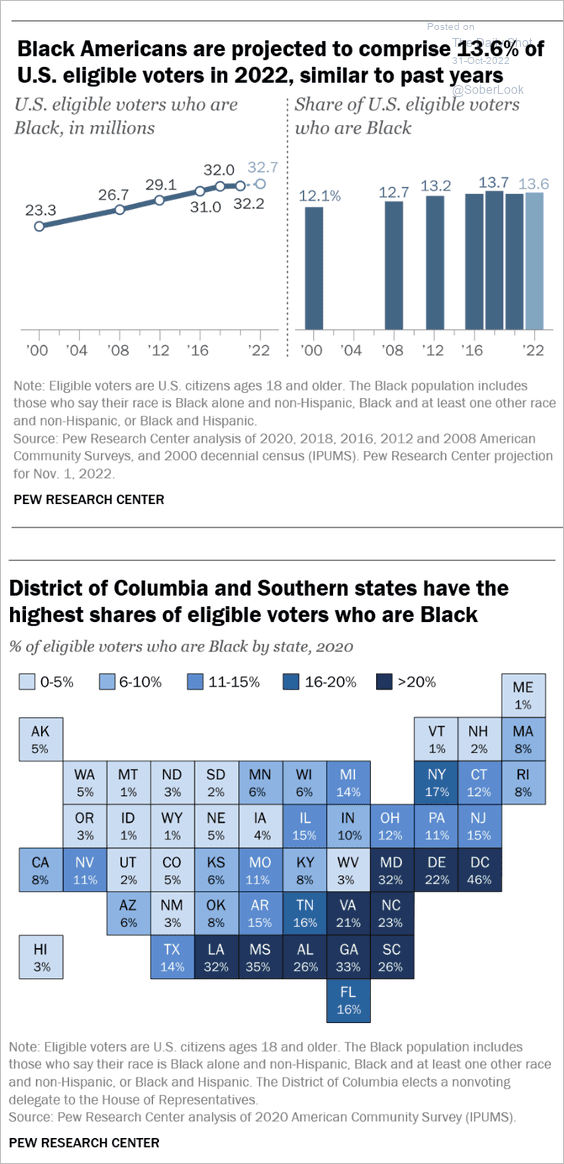 Source: Pew Research Center Read full article
• Eligible Asian voters:
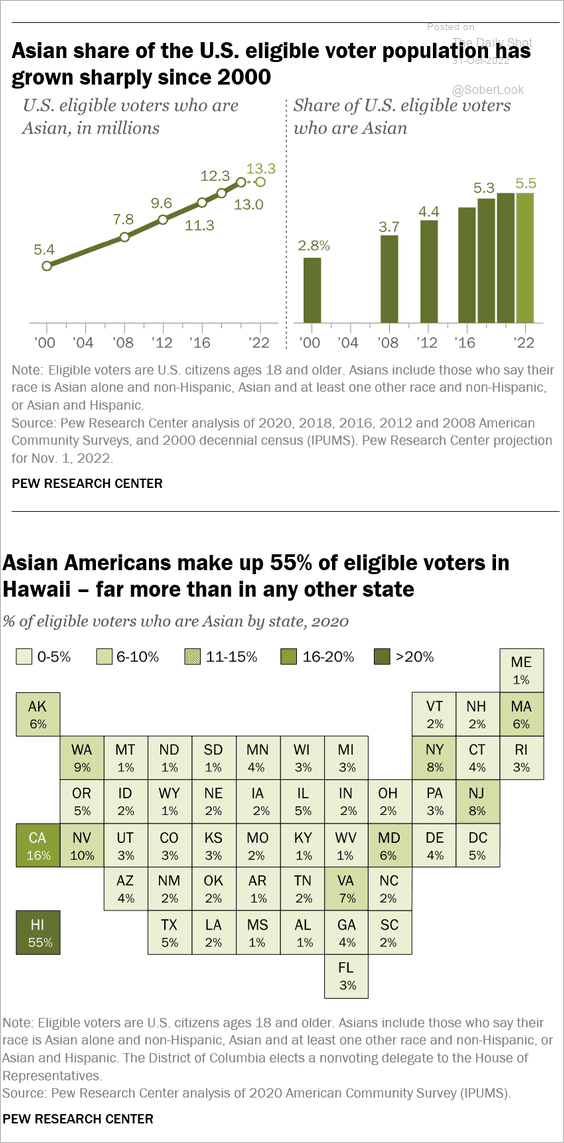 Source: Pew Research Center Read full article
• Eligible Latino voters:
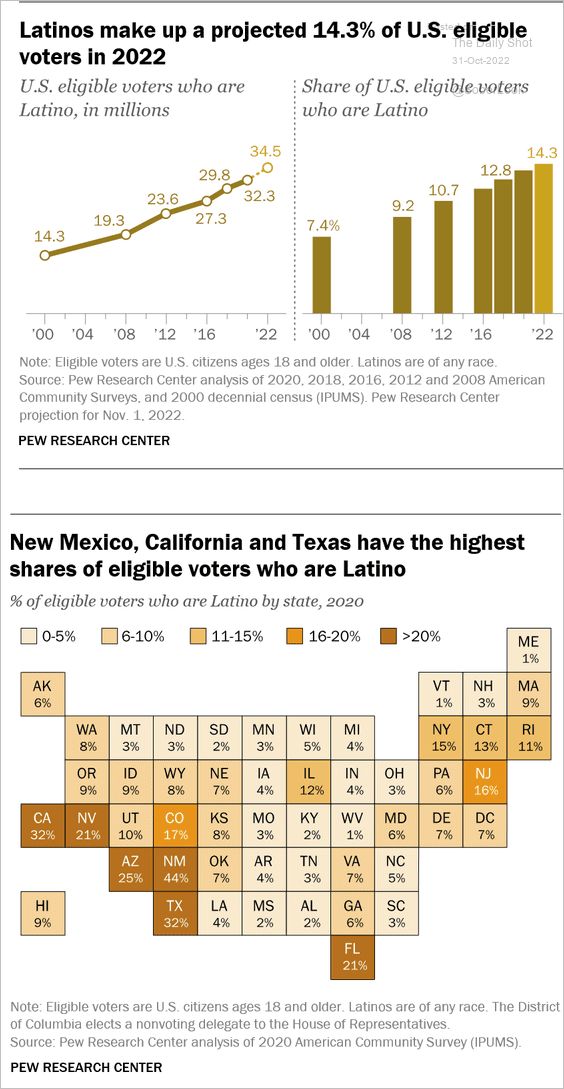 Source: Pew Research Center Read full article
——————–
8. Halloween candy prices:
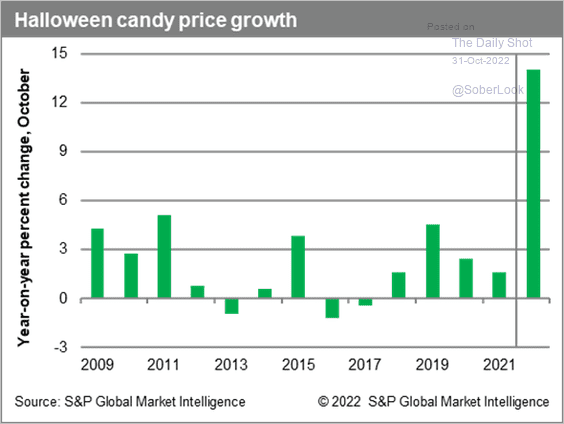 Source: S&P Global Market Intelligence
• The latest Halloween scare:
 Source: @tomfishburne Read full article
Back to Index