
The Daily Shot: 10-Nov-22
• The United States
• Canada
• The United Kingdom
• The Eurozone
• Japan
• Asia – Pacific
• Emerging Markets
• Cryptocurrency
• Energy
• Equities
• Credit
• Food for Thought
The United States
1. Let’s begin with the housing market.
• Mortgage applications are running at 2014 levels, down over 41% from a year ago.
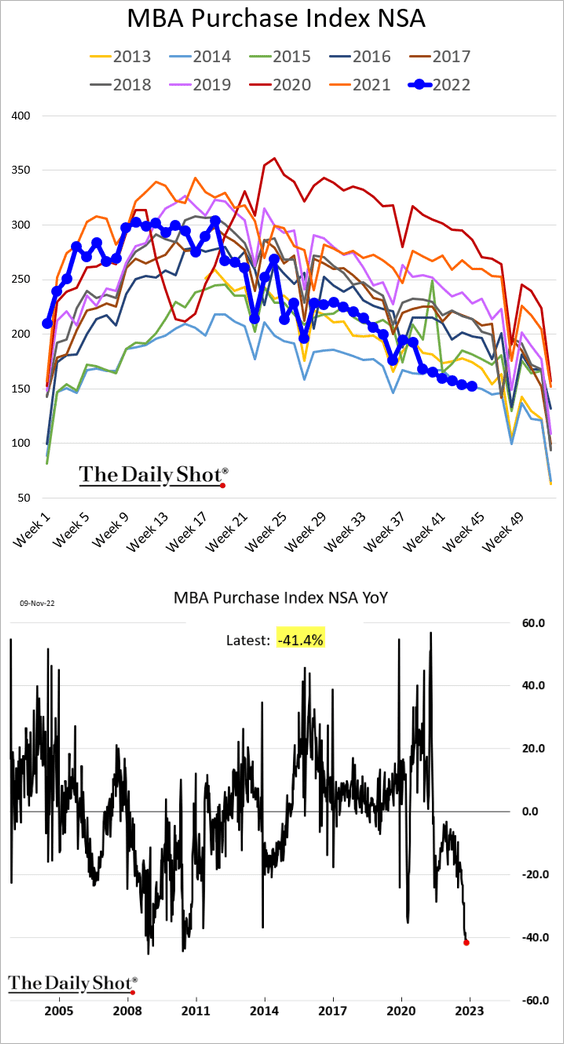
Here is the rate lock count.
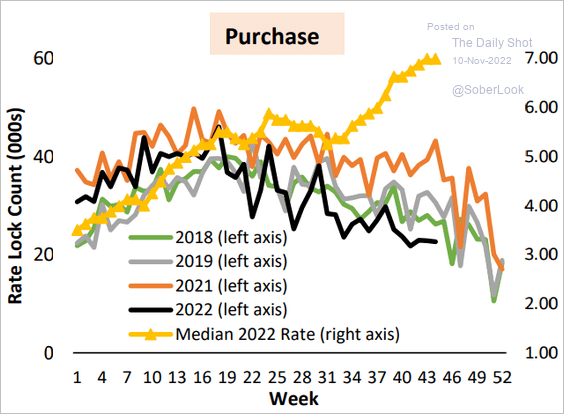 Source: AEI Housing Center
• The decline in existing home sales has been rapid, …
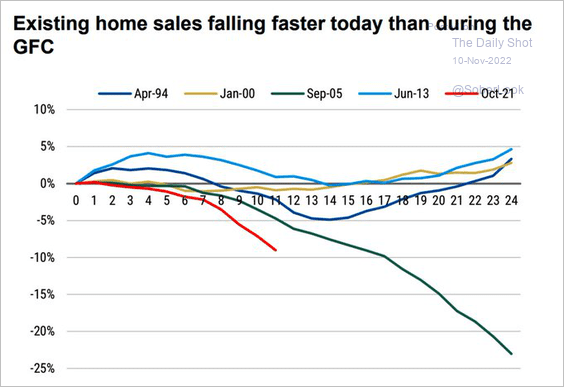 Source: Morgan Stanley Research; @WallStJesus
… as housing affordability deteriorated.
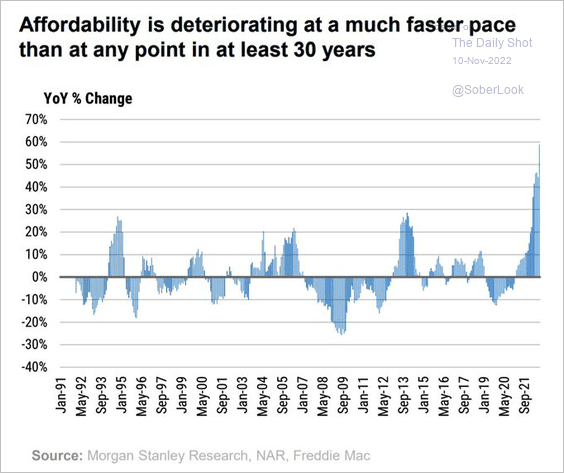 Source: Morgan Stanley Research; @WallStJesus
• Low housing inventories point to positive home price appreciation on a year-over-year basis.
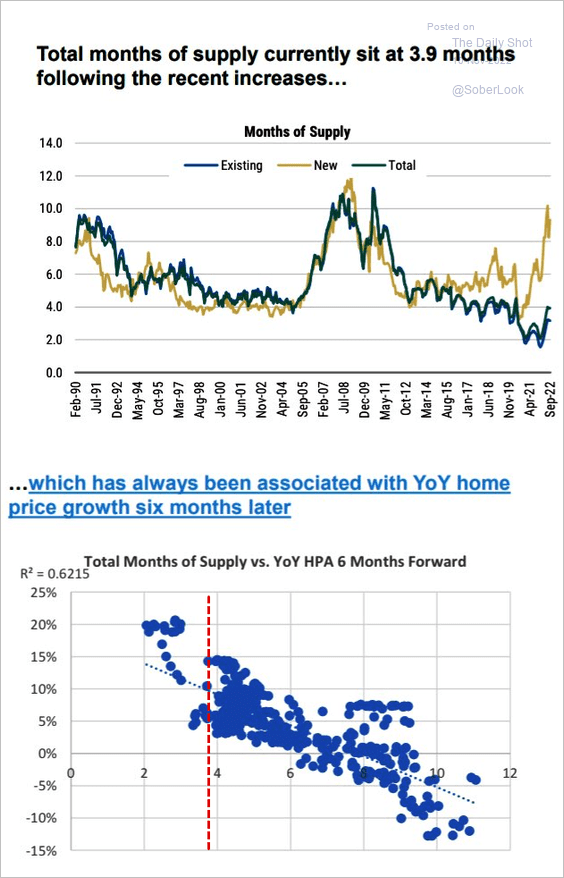 Source: Morgan Stanley Research; @WallStJesus
• However, the AEI Housing Center sees a steep year-over-year decline in home prices by the end of next year.
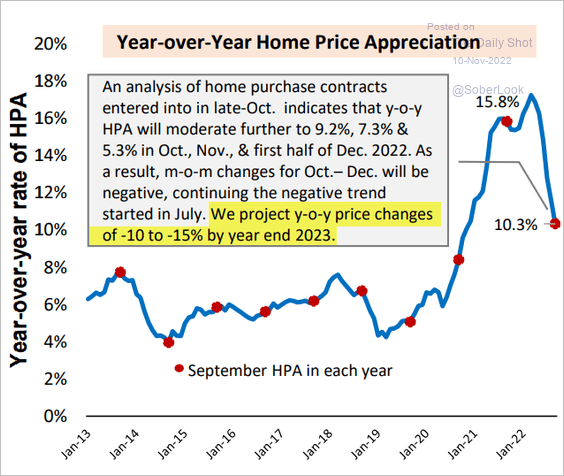 Source: AEI Housing Center
• The mortgage rate spike also signals lower prices ahead (note that this chart shows nominal home prices).
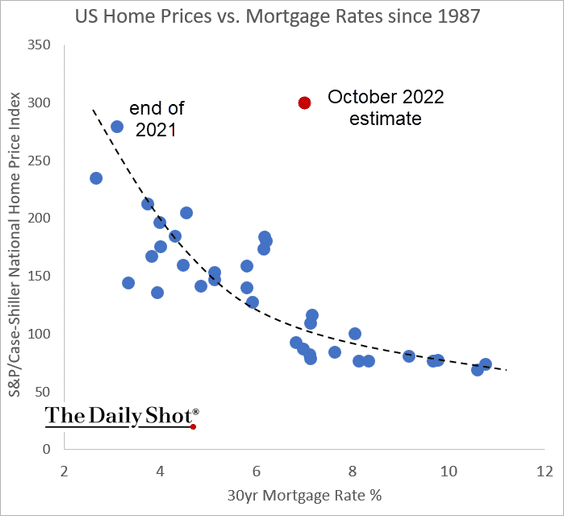 h/t @MacroAlf
• The Evercore ISI homebuilder sales index continues to deteriorate.
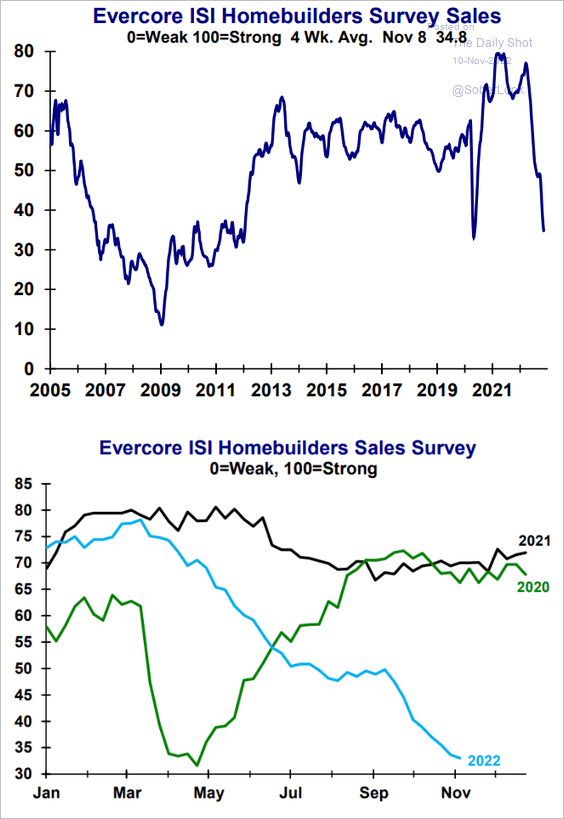 Source: Evercore ISI Research
• This chart shows homeowners’ equity and mortgage balances as a share of GDP.
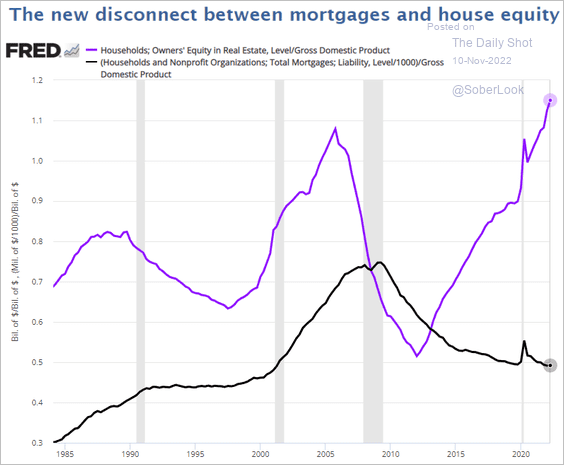 Source: @stlouisfed Read full article
——————–
2. Next, we have some updates on inflation.
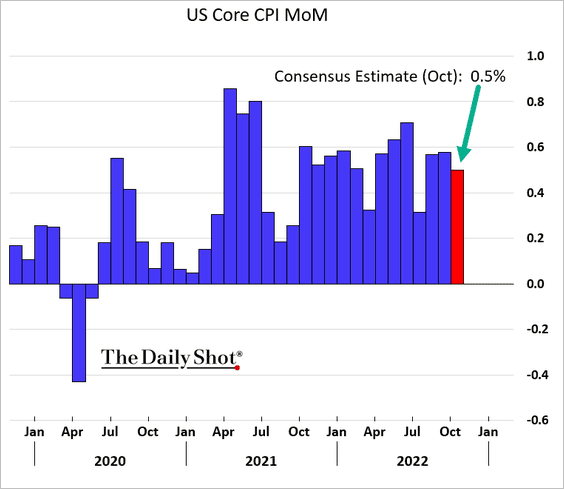
• What should we expect from the CPI report today? Here is the consensus estimate for the core CPI (monthly changes).
• Morgan Stanley’s estimate is in line with the consensus, showing that core services kept inflation elevated.
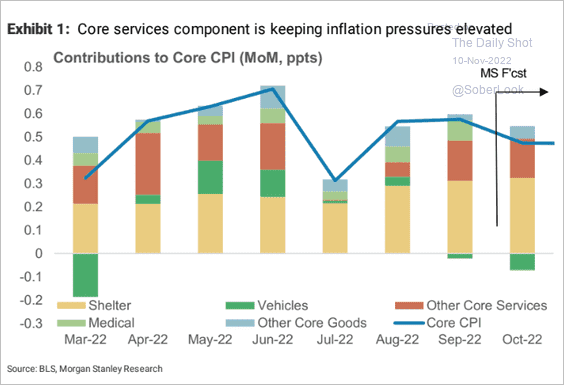 Source: Morgan Stanley Research
• Nomura’s estimate is below consensus. Used vehicles, other core goods, and health insurance are expected to be a drag on core inflation.
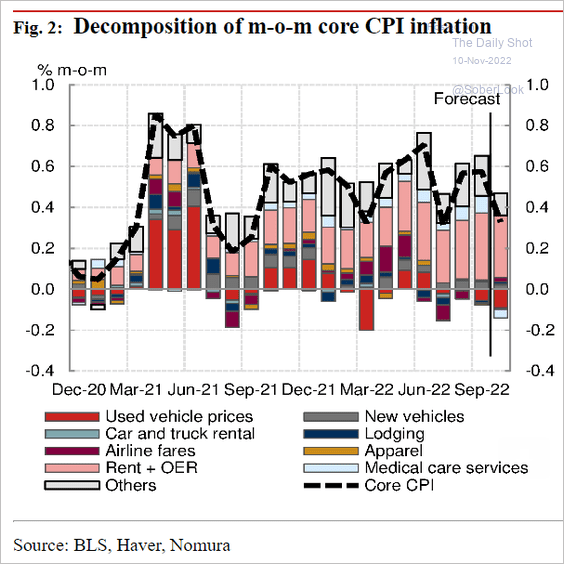 Source: Nomura Securities
– Here is Nomura’s core goods CPI forecast:
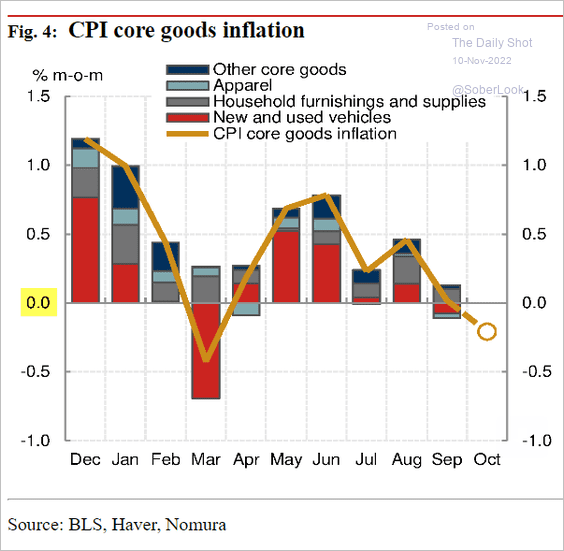 Source: Nomura Securities
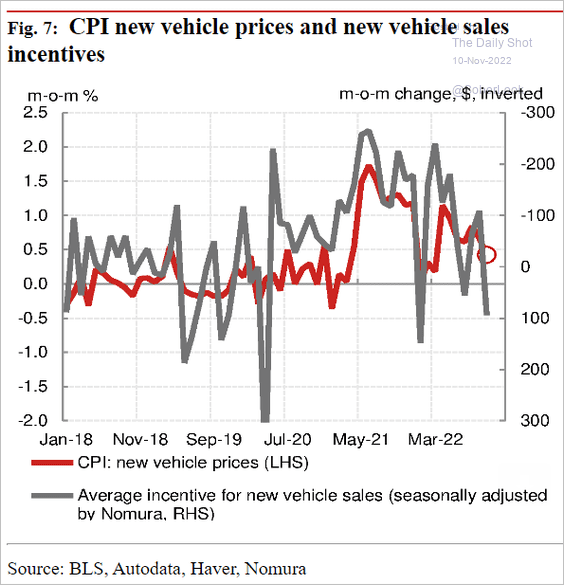
– Increased incentives for new vehicles point to slower price gains.
 Source: Nomura Securities
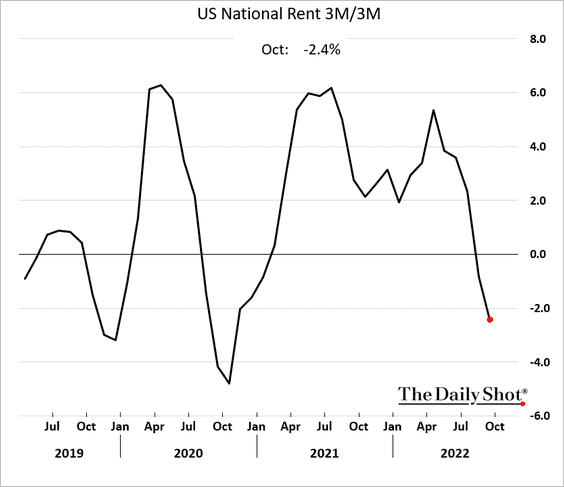
• Rent inflation is negative on a 3-month rolling basis, according to Rent.
 Source: Rent. Read full article
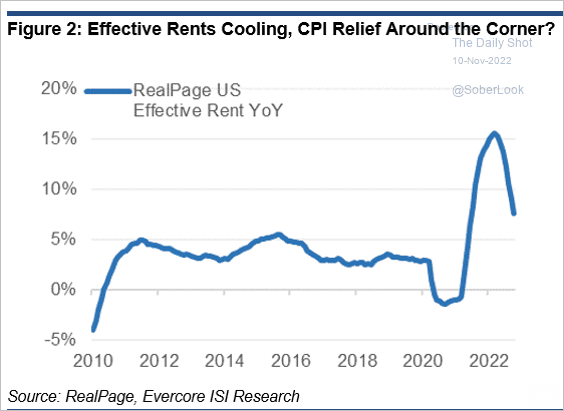
– Here is the RealPage rent index (year-over-year).
 Source: Evercore ISI Research
– Nomura sees rent inflation moderating slowly.
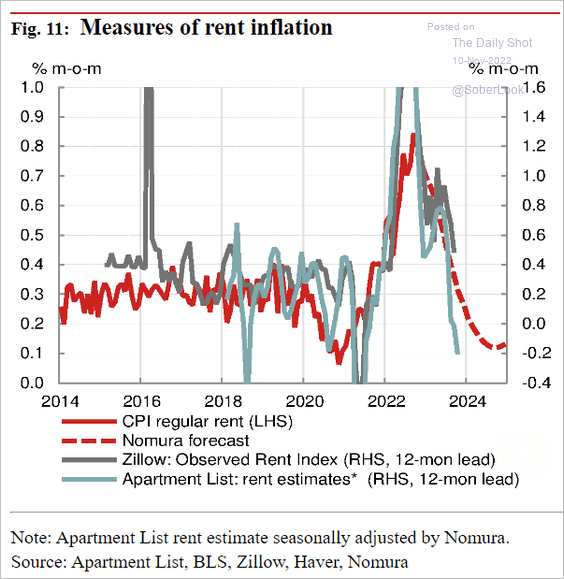 Source: Nomura Securities
• Is it different this time?
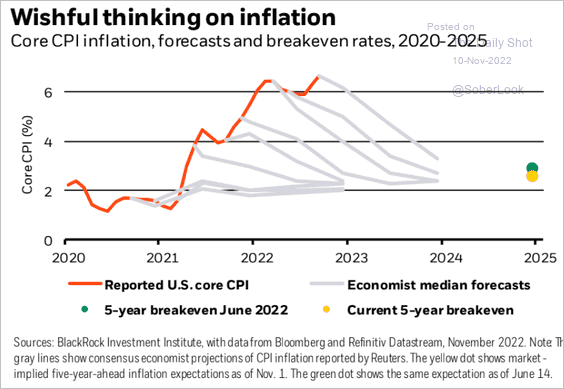 Source: BlackRock Investment Institute
• Inflation in the US and the Eurozone is driven by different factors (2 charts).
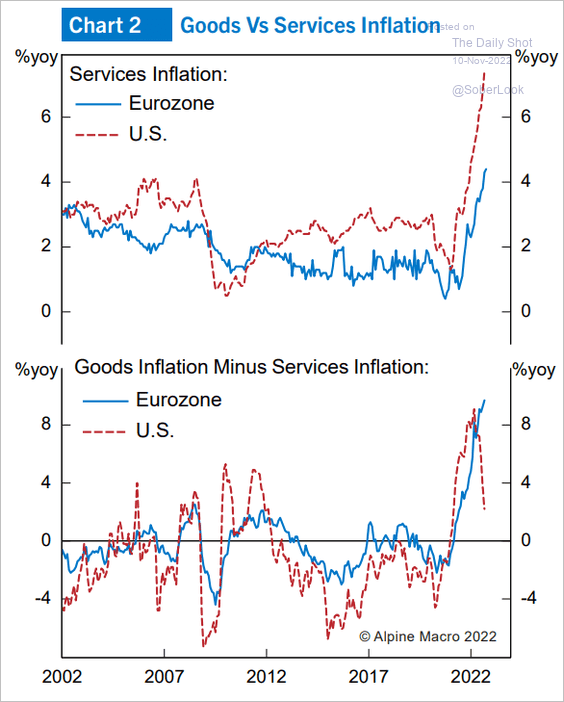 Source: Alpine Macro
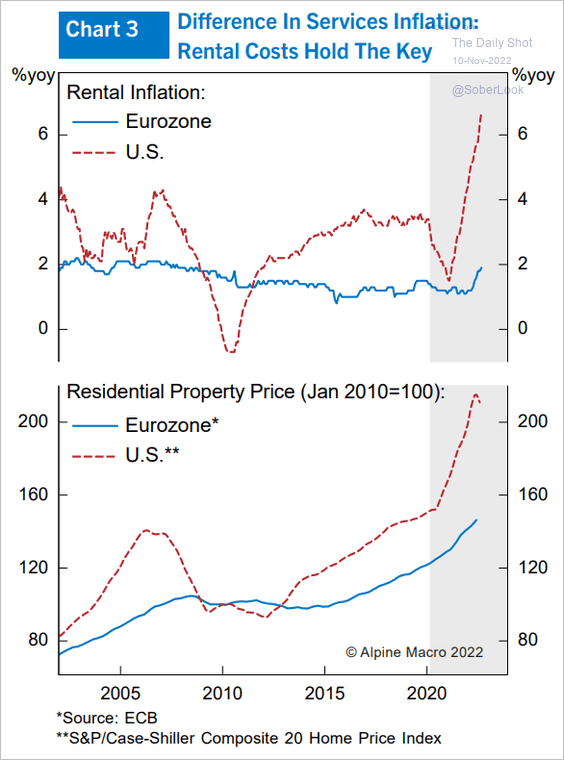 Source: Alpine Macro
• Long-term consumer inflation expectations are back at pre-2014 levels.
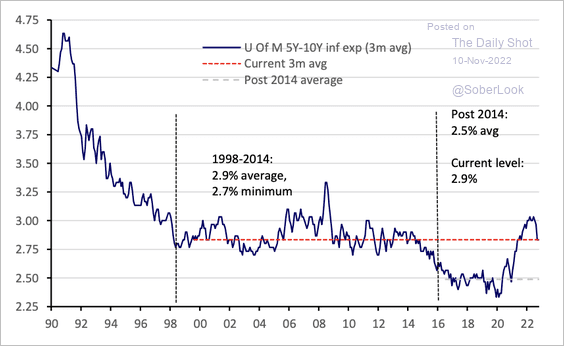 Source: Deutsche Bank Research
• The public starts noticing inflation when the CPI hits 4-5%.
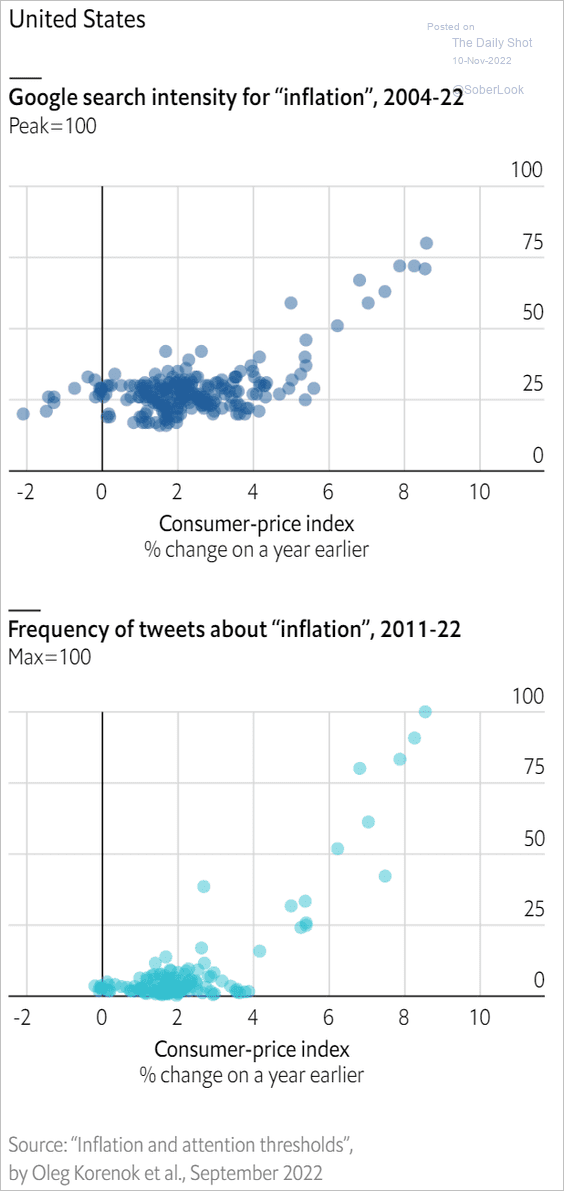 Source: The Economist, h/t @jessefelder Read full article
• China’s PPI is in negative territory, which signals slower gains in US producer prices.
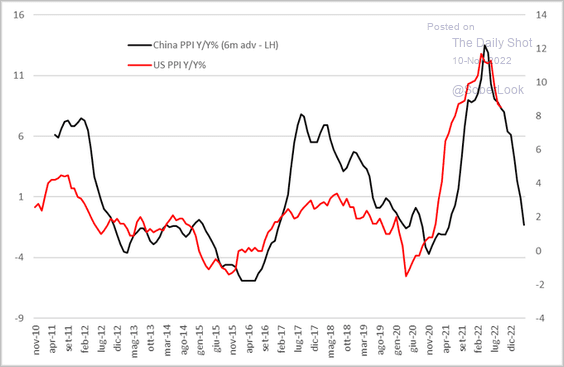 Source: @CavaggioniMario
——————–
3. The Atlanta Fed’s GDPNow model now has the Q4 GDP growth at 4%, well above consensus.
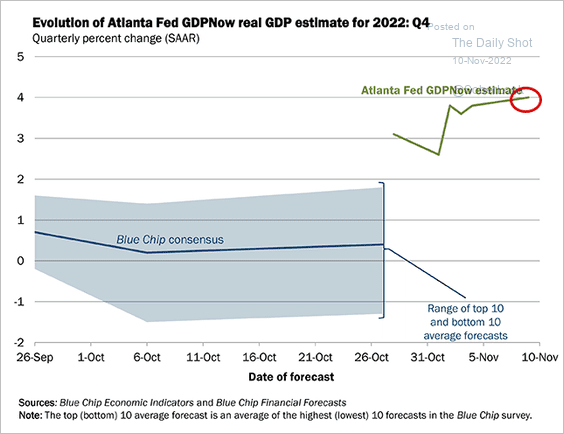 Source: @AtlantaFed
A recession during the third year of a presidential cycle? There is a first time for everything.
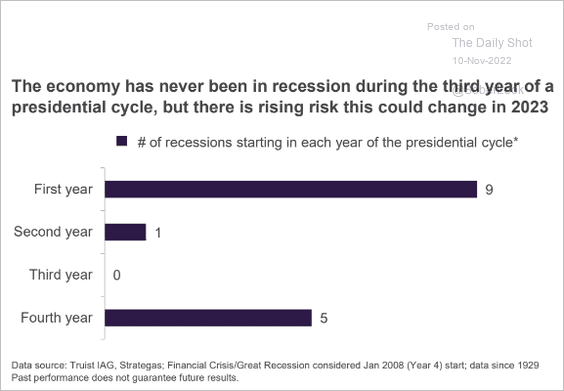 Source: Truist Advisory Services
Back to Index
Canada
1. Here is a look at the spectacular October employment report by sector.
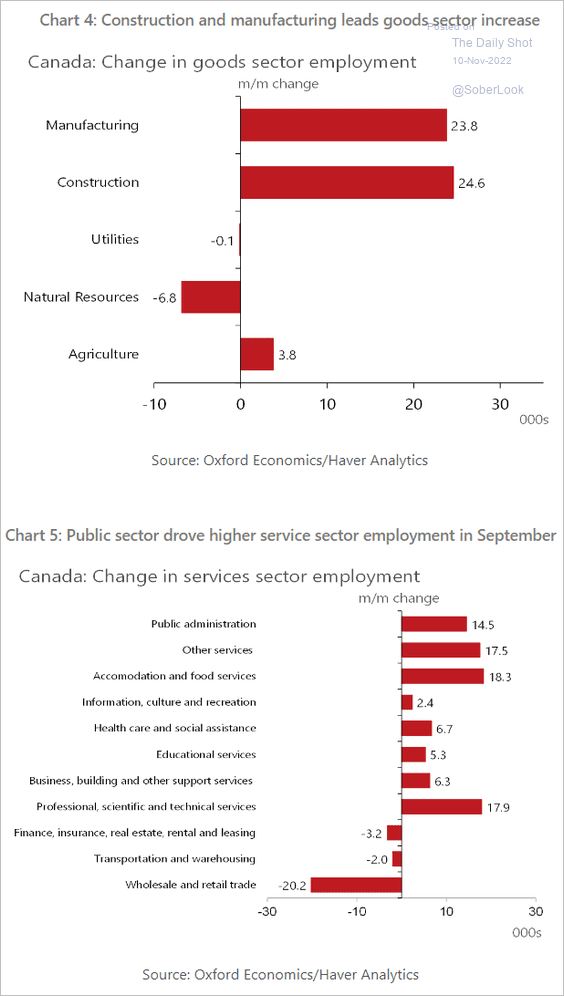 Source: Oxford Economics
2. Retirements and sickness are keeping the labor market tight.
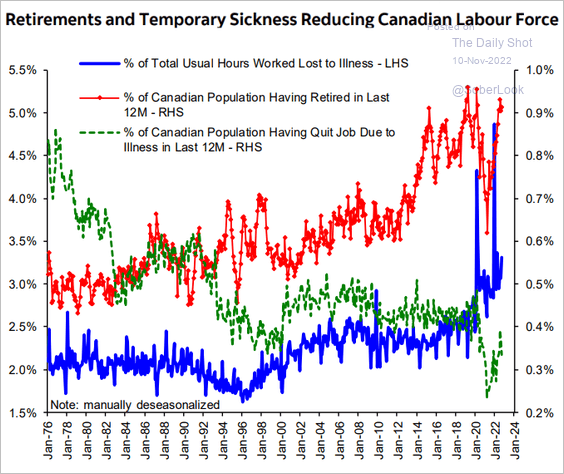 Source: Hugo Ste-Marie, Portfolio & Quantitative Strategy Global Equity Research, Scotia Capital
3. Oxford Economics sees a rough year ahead for Canada’s economy.
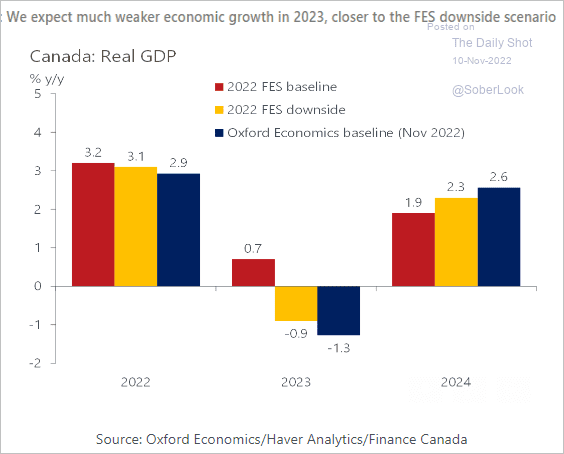 Source: Oxford Economics
Back to Index
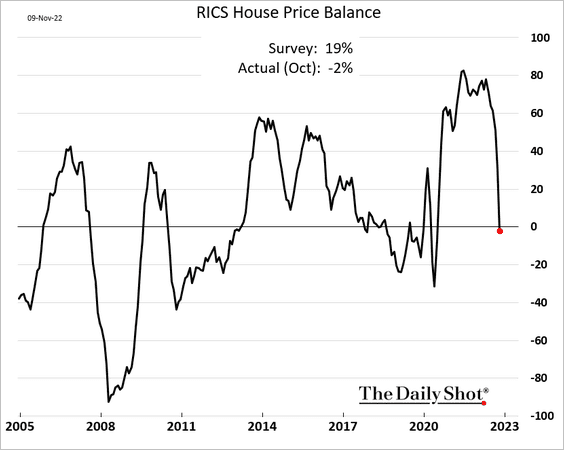
The United Kingdom
The housing market is under pressure.
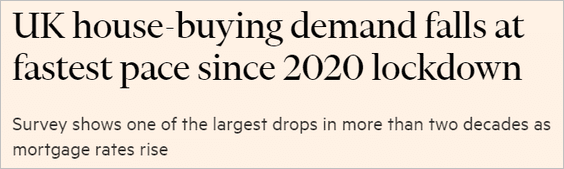 Source: @financialtimes Read full article
Back to Index
The Eurozone
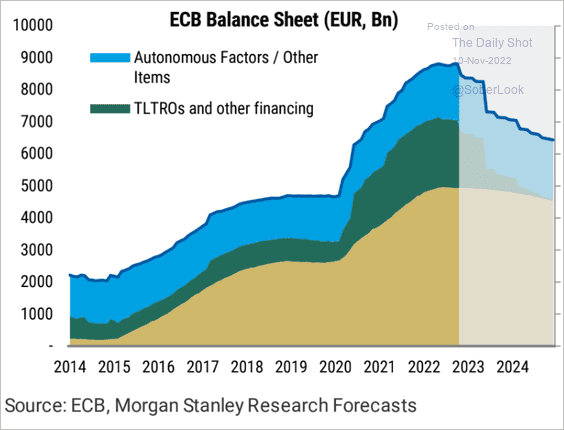
1. The TLTRO runoff will keep reducing the ECB’s (Eurosystem’s) balance sheet.
 Source: BCA Research
Here is a forecast from Morgan Stanley.
 Source: Morgan Stanley Research
• The cost for TLTRO tranches for certain banks will move to at least 1.5% later this month, which is still attractive given the substantial repricing of interest rates this year. The chart below shows covered and preferred senior unsecured bond yields for 2024 maturities.
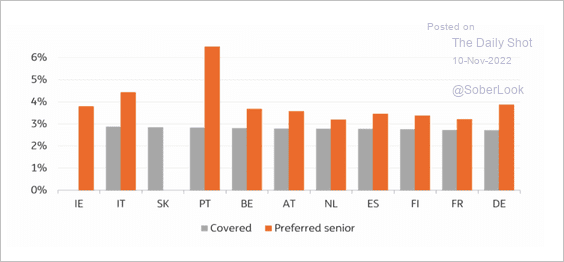 Source: ING
The TLTRO cost increase is more relevant for banks in core Eurozone countries, which have access to less expensive market funding, according to BCA Research.
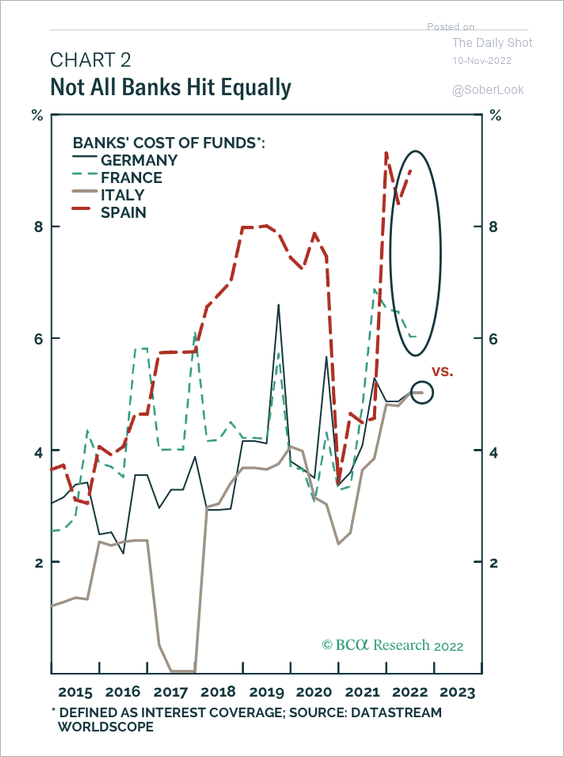 Source: BCA Research
——————–
2. The TARGET2 imbalances keep widening.
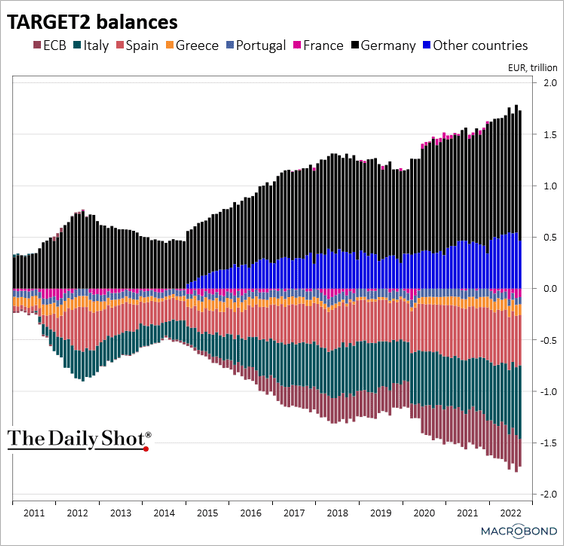 Source: Chart and data provided by Macrobond
3. The ECB’s “profit” is deteriorating as interest rates surge.
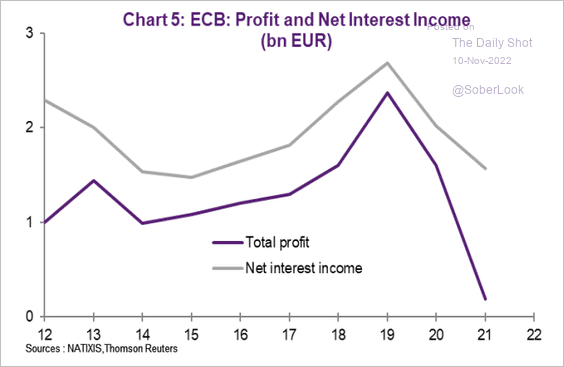 Source: Natixis
4. The consensus ECB rate trajectory has diverged from the market.
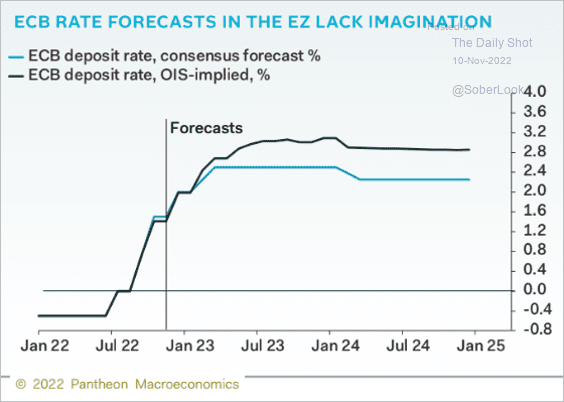 Source: Pantheon Macroeconomics
5. Energy dependency is fueling inflation.
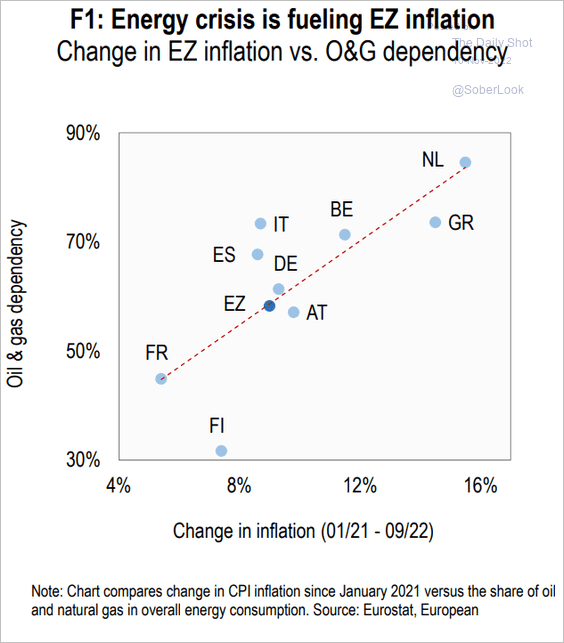 Source: Numera Analytics
6. Who owns oil tankers moving Russian oil?
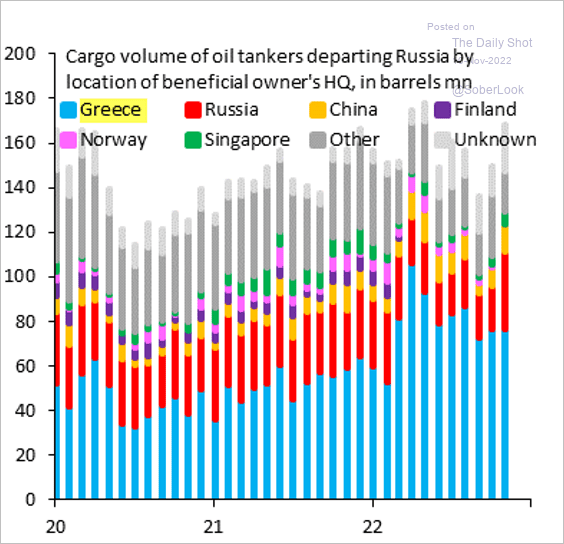 Source: @RobinBrooksIIF, @JonathanPingle
Back to Index
Japan
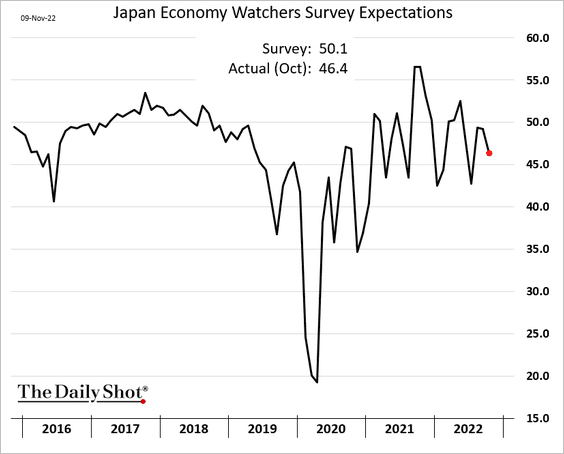
1. The October Economy Watchers Expectations indicator surprised to the downside. Notice how volatile the index has been since the start of the pandemic.
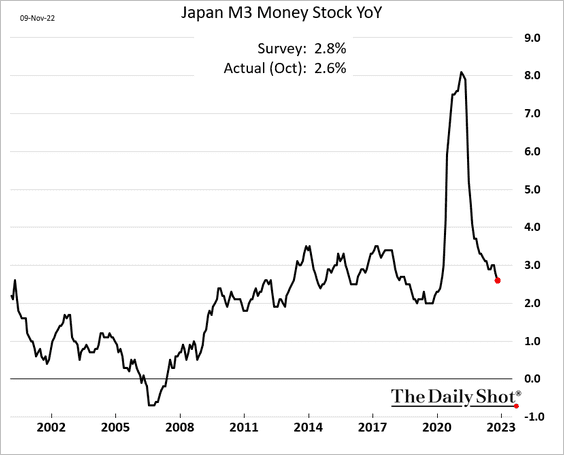
2. Growth in Japan’s broad money supply continues to moderate.
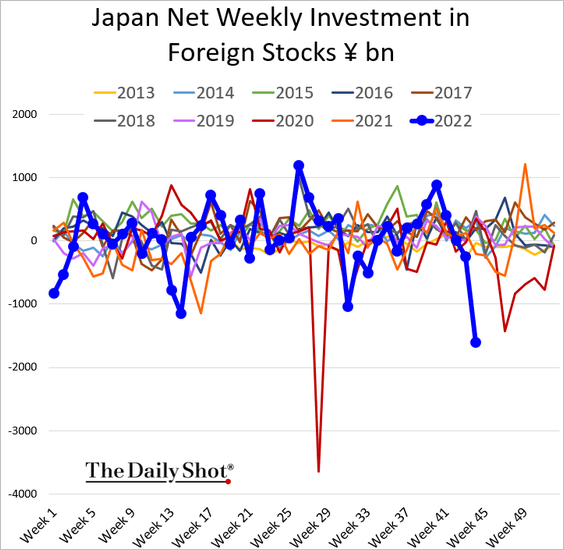
3. Japanese investors have been dumping foreign stocks.
Back to Index
Asia – Pacific
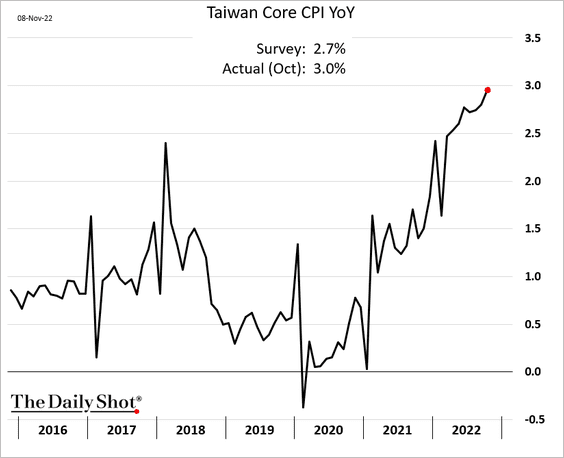
1. Taiwan’s inflation continues to climb.
2. New Zealand is moving toward a cashless economy.
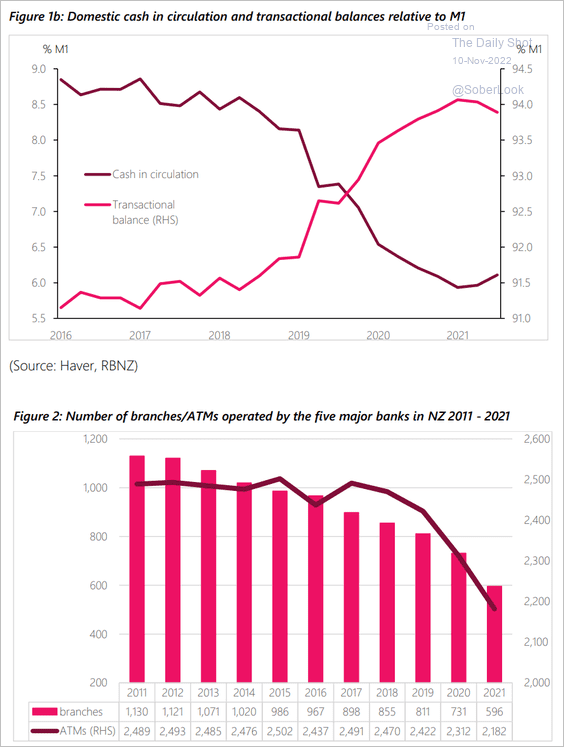 Source: BIS Read full article
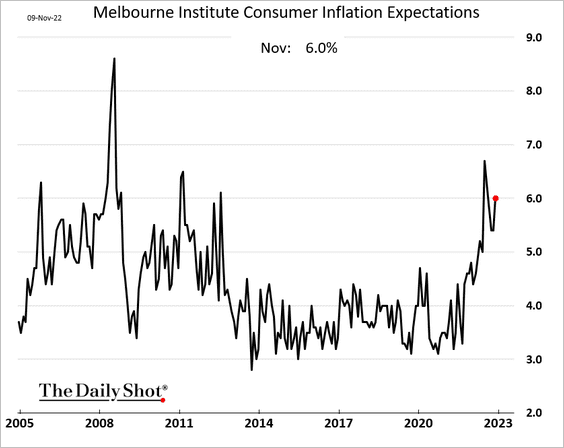
3. Australian inflation expectations are back at 6% this month.
Back to Index
Emerging Markets
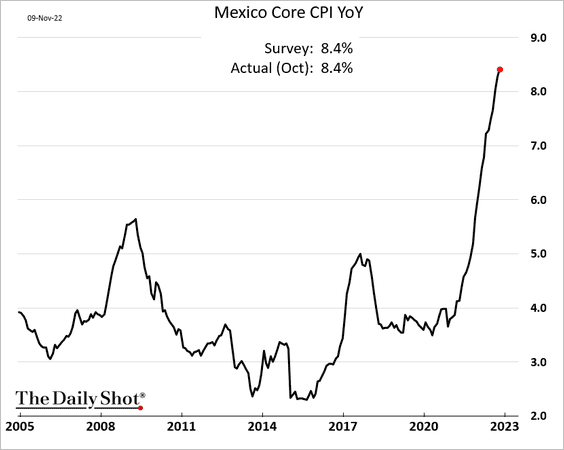
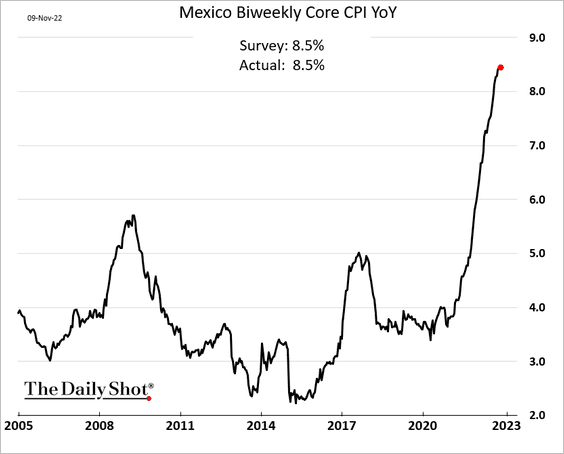
1. Mexico’s inflation keeps surging.
However, the biweekly index shows signs of peaking.
Separately, Mexico is highly exposed to the US economy and rates.
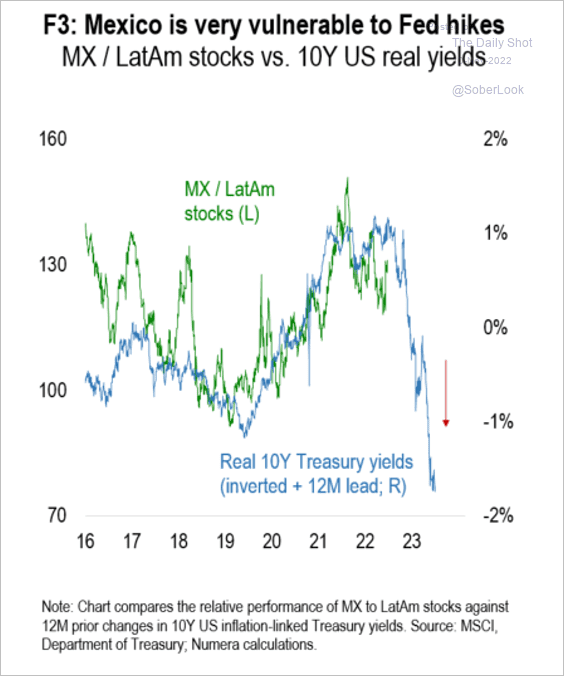 Source: Numera Analytics
——————–
2. Brazil’s retail sales climbed more than expected in September.
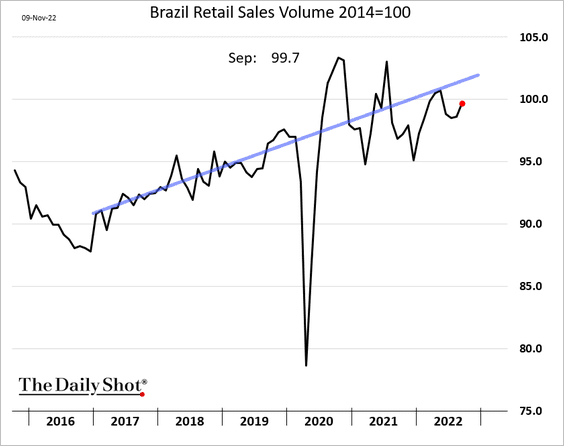
Brazilian assets have outperformed this year but could experience volatility if Bolsonaro contests election results, according to BCA Research.
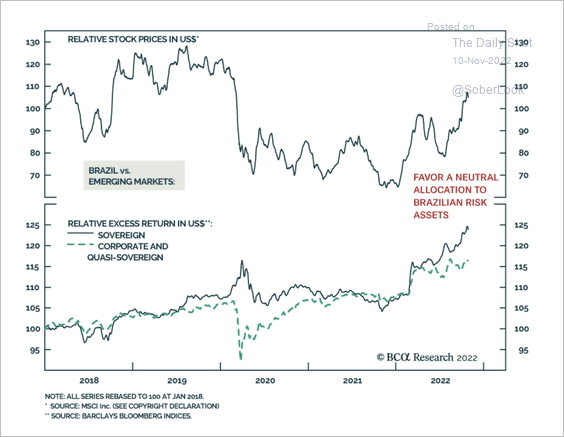 Source: BCA Research
——————–
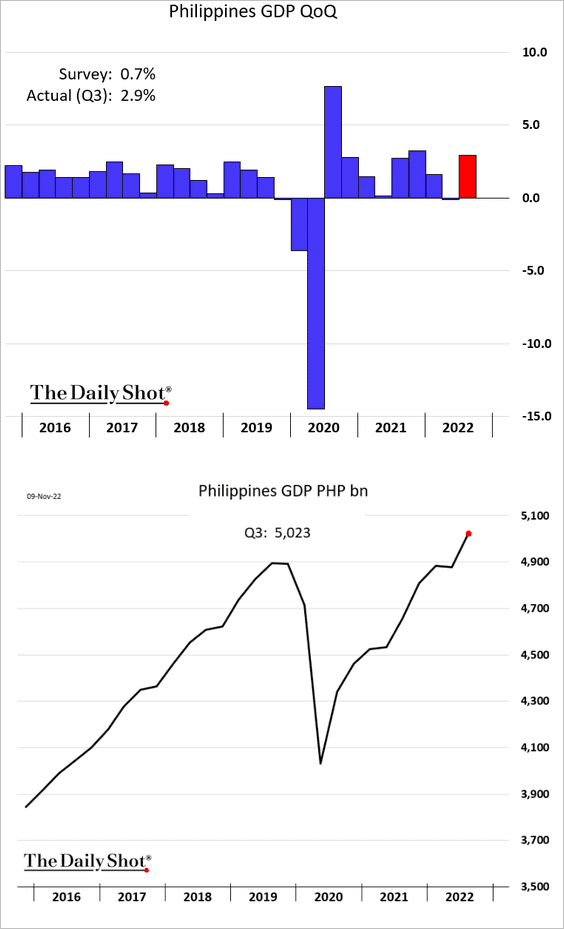
3. The Philippine third-quarter GDP growth surprised to the upside.
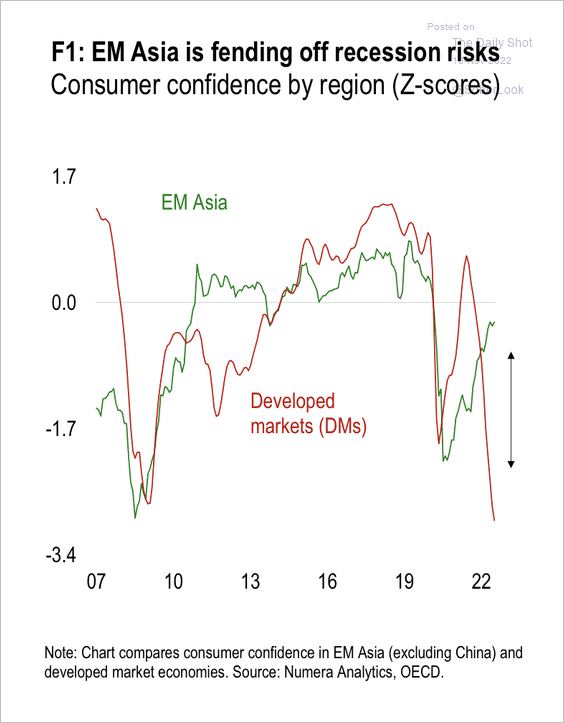
4. Consumer confidence in EM Asia is holding up versus developed markets.
 Source: Numera Analytics
Back to Index
Cryptocurrency
1. Binance will not acquire FTX after all, which triggered another round of selling in crypto market.
 Source: @WSJ Read full article
• Bitcoin appears to have found support near 16k.
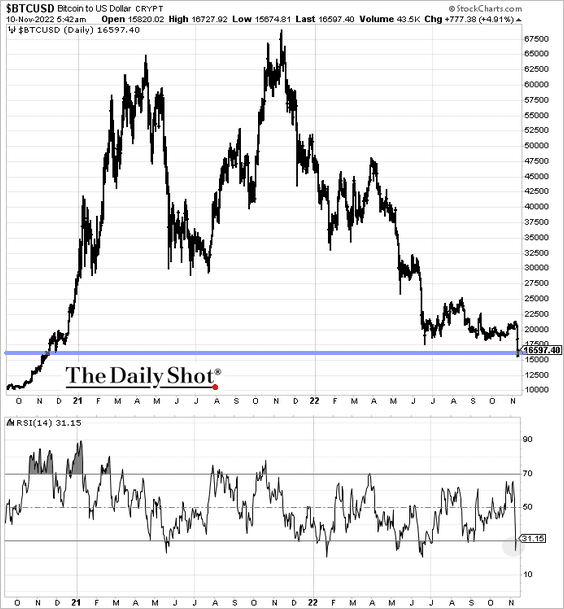
• Bitcoin is down about 76% from its peak, compared with an 83% max drawdown during the 2018 bear market.
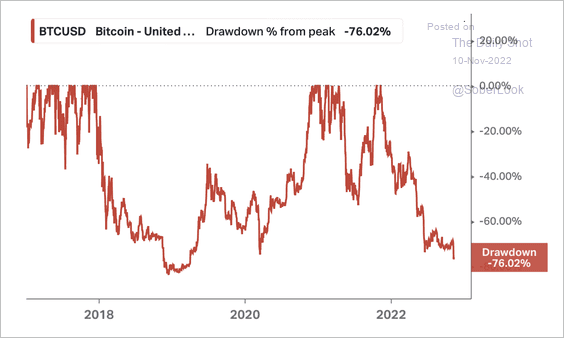 Source: Koyfin
• More room to fall?
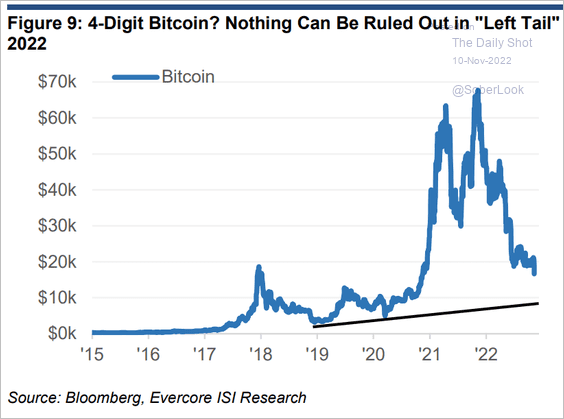 Source: Evercore ISI Research
2. Long BTC liquidations increased over the past two days.
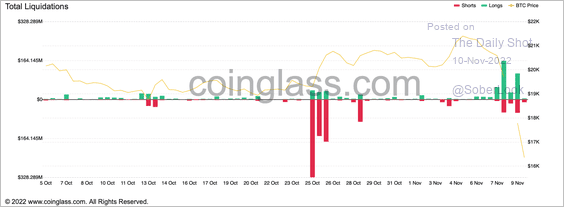 Source: Coinglass
3. Only investors who acquired bitcoin in 2017 and earlier are in profit, based on the average exchange withdrawal price analyzed by Glassnode.
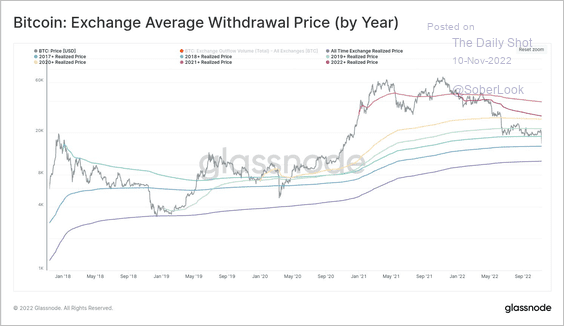 Source: @glassnode
4. Bitcoin’s implied volatility keeps surging.
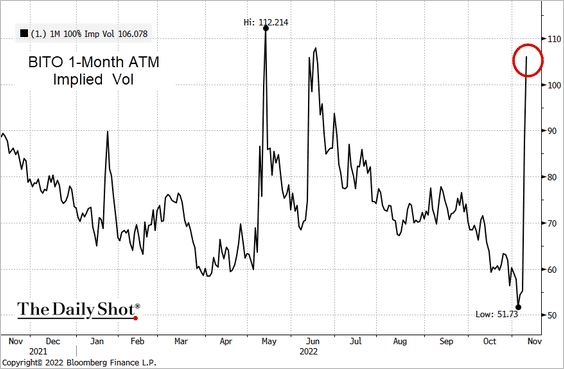 Source: @TheTerminal, Bloomberg Finance L.P.
5. The Crypto Fear & Greed Index returned to “extreme fear” territory.
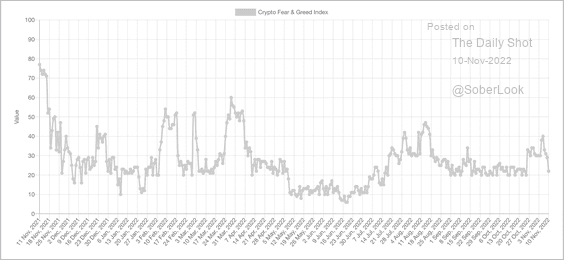 Source: Alternative.me
6. Retail investors bought crypto-linked products going into the crash.
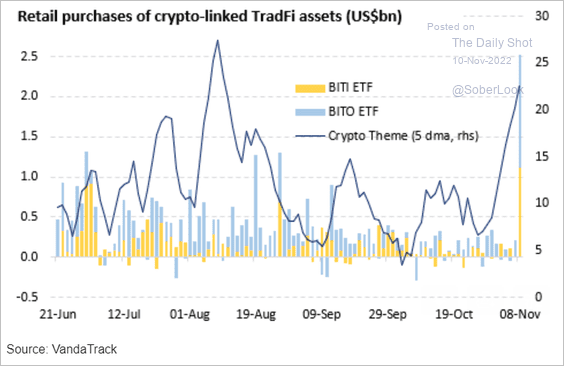 Source: Vanda Research
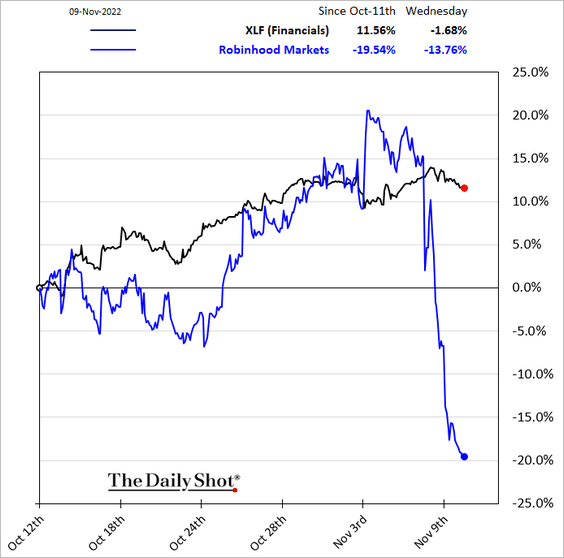
7. Robinhood shares took a hit this week, driven by the crypto rout.
Back to Index
Energy
1. Brent is at the 50-day moving average.
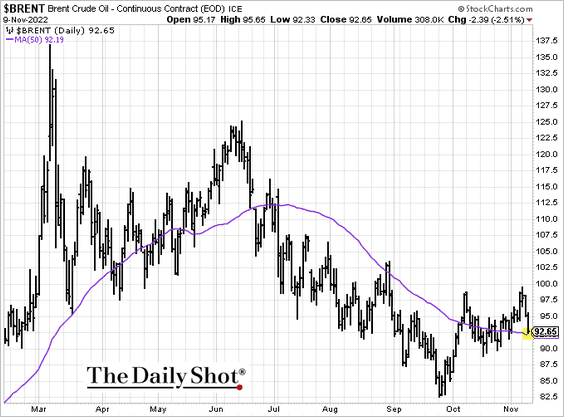
 Source: Reuters Read full article
——————–
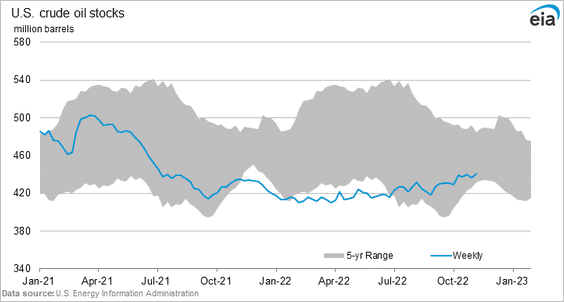
2. US oil inventories increased last week.
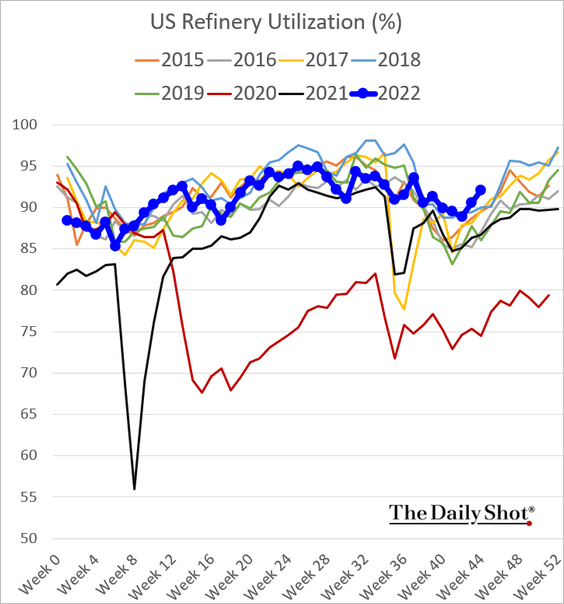
3. US refinery utilization is at a multi-year high for this time of the year.
4. Distillates inventories remain very low, …
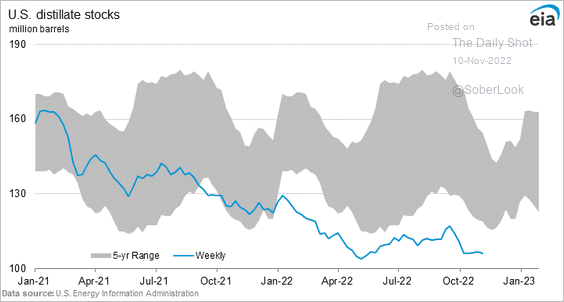
… driving up diesel and heating oil prices.
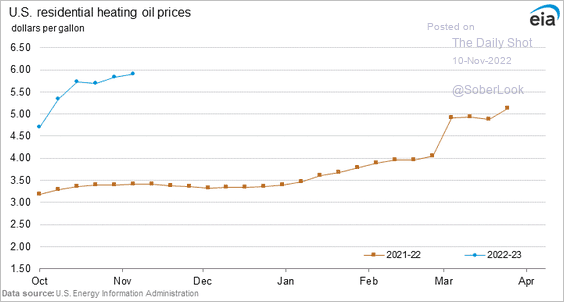 Source: @EIAgov
This chart shows US East Coast distillates imports.
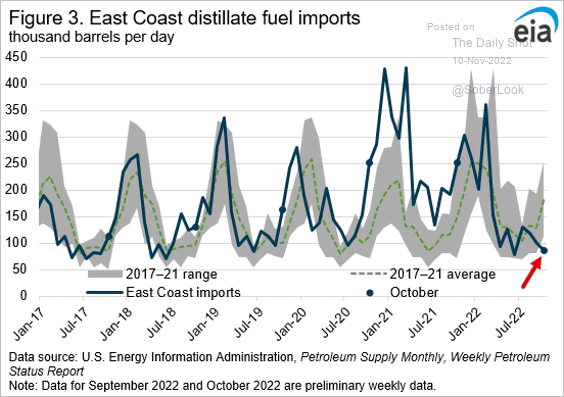 Source: @EIAgov
Back to Index
Equities
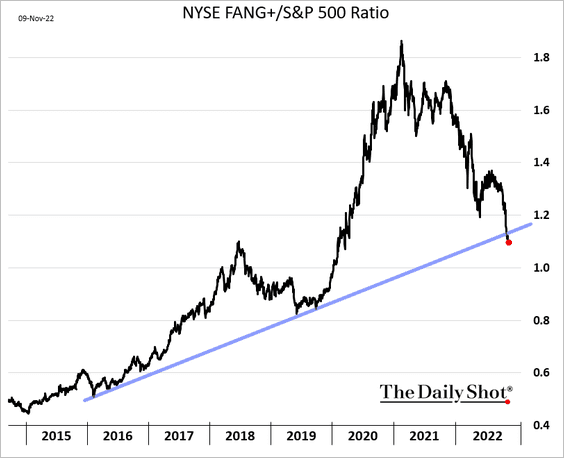
1. Tech mega-caps continue to underperform.
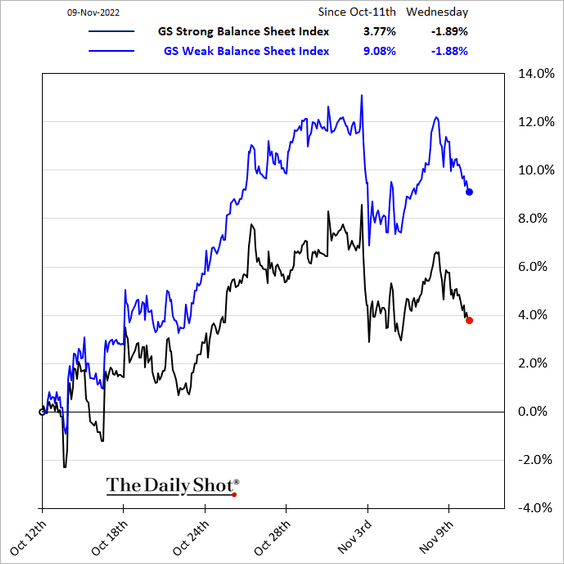
2. Related to the trend above, companies with weak balance sheets have been outperforming.
3. Growth stocks are down almost 25% vs. value over the past 12 months.
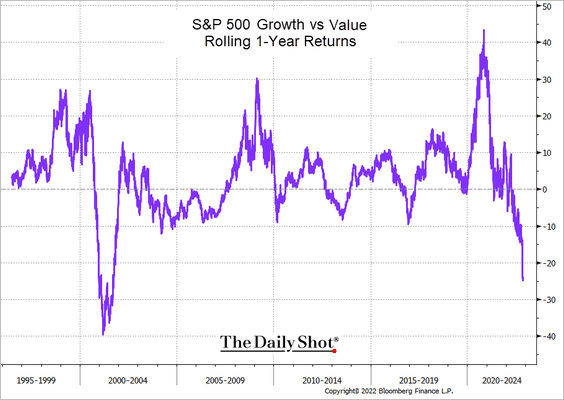 Source: @TheTerminal, Bloomberg Finance L.P.
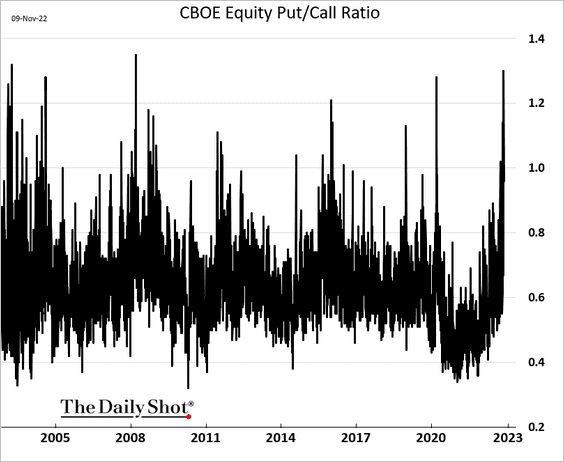
3. The put/call ratio surged this week.
4. New lows continue to exceed new highs.
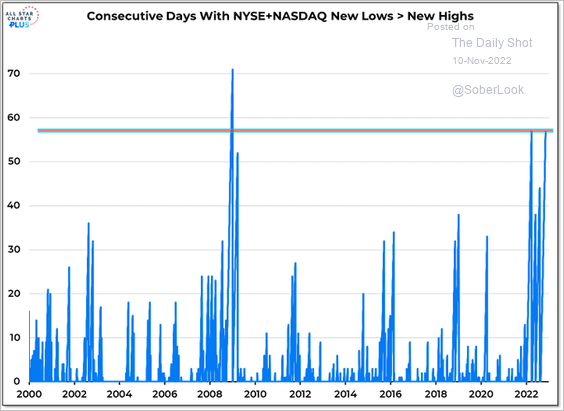 Source: @WillieDelwiche
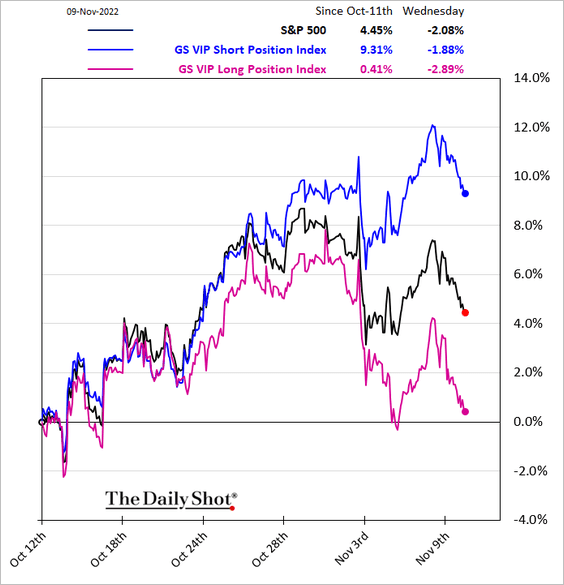
5. Hedge funds’ most loved stocks have massively underperformed their preferred short positions.
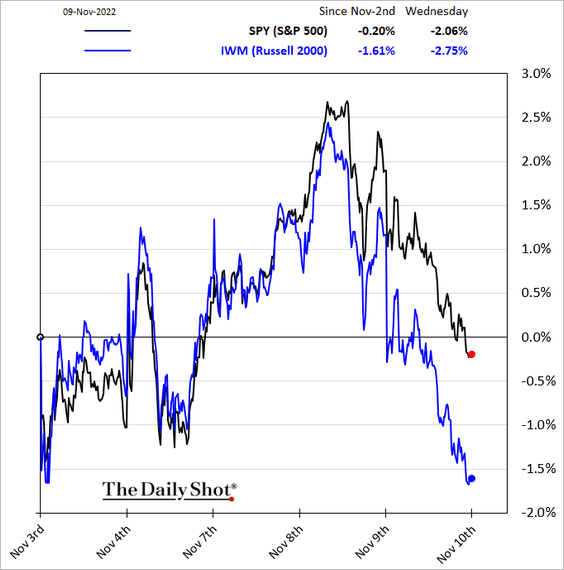
6. Small caps are underperforming again.
7. Retail investors have been buying equities in recent days (2 charts).
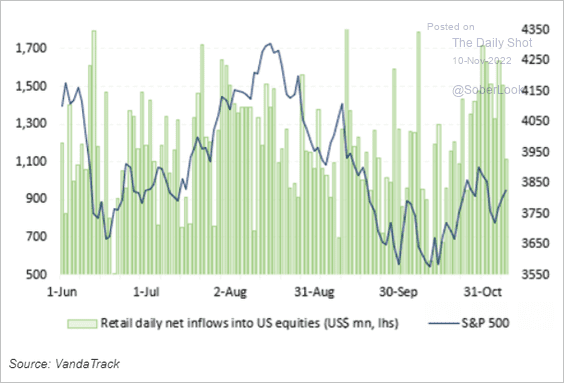 Source: Vanda Research
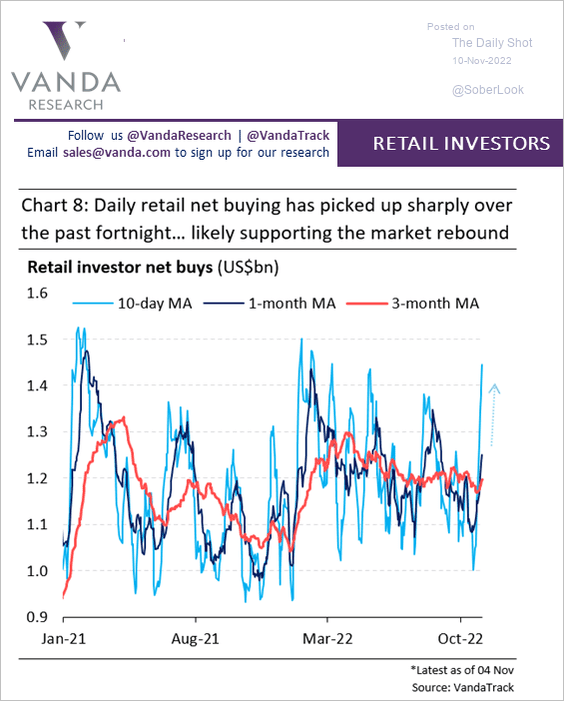 Source: Vanda Research
8. Next, we have some sector updates.
• Sector performance since the 2020 election:
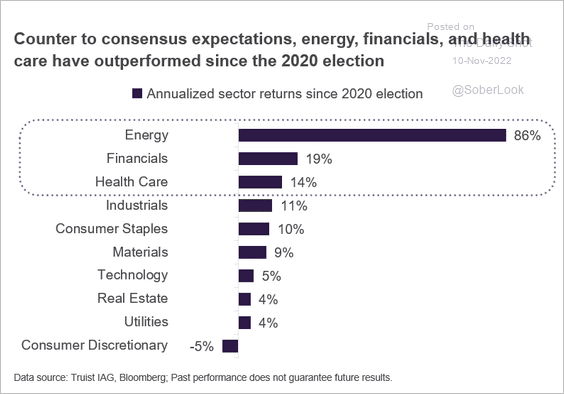 Source: Truist Advisory Services
• Financials vs. tech:
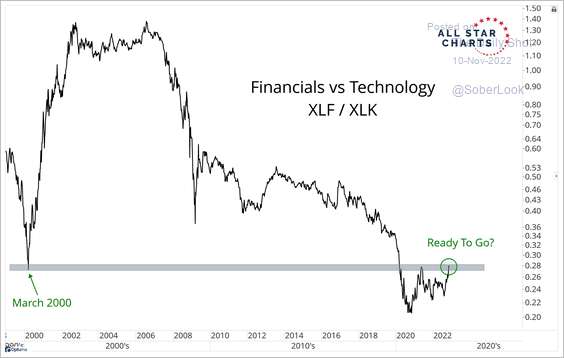 Source: @allstarcharts
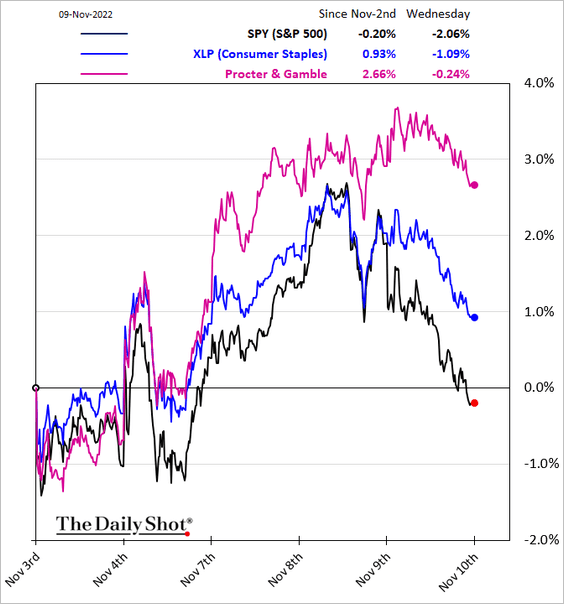
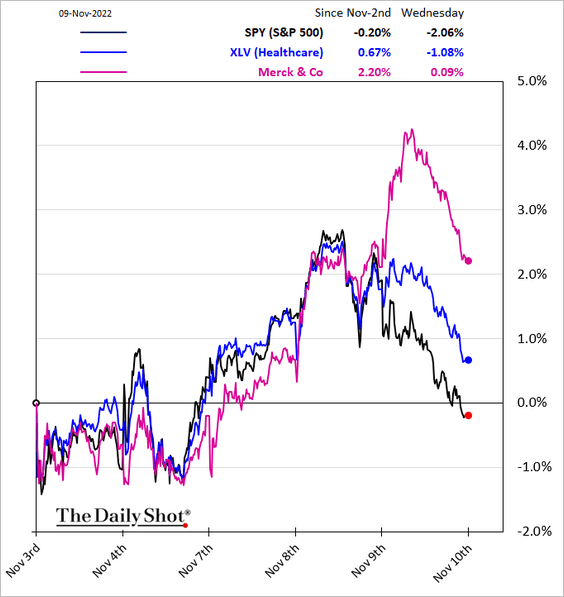
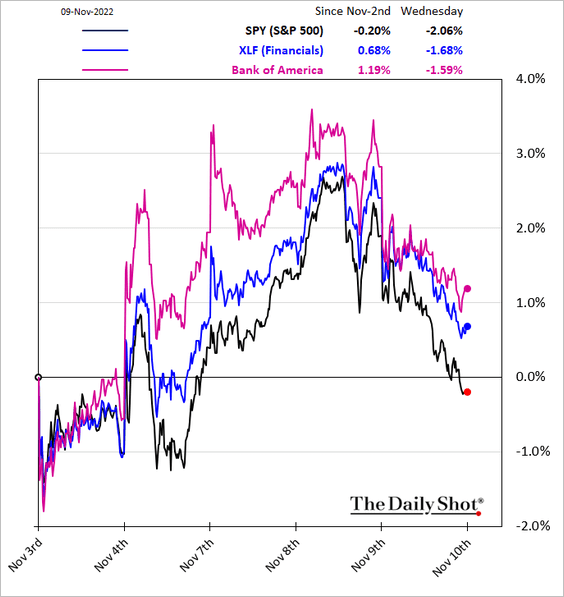
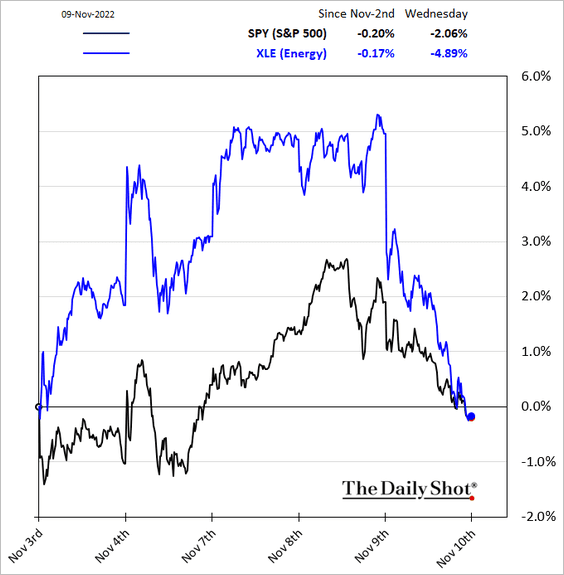
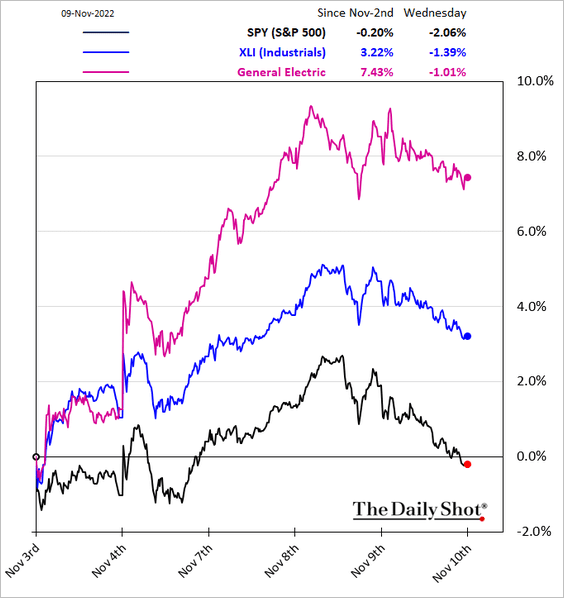
• Sector performance over the past five business days:
– Consumer Staples:
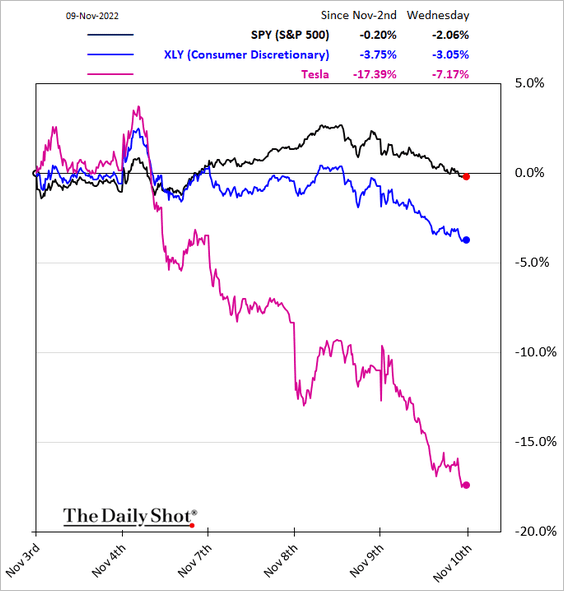
– Consumer Discretionary:
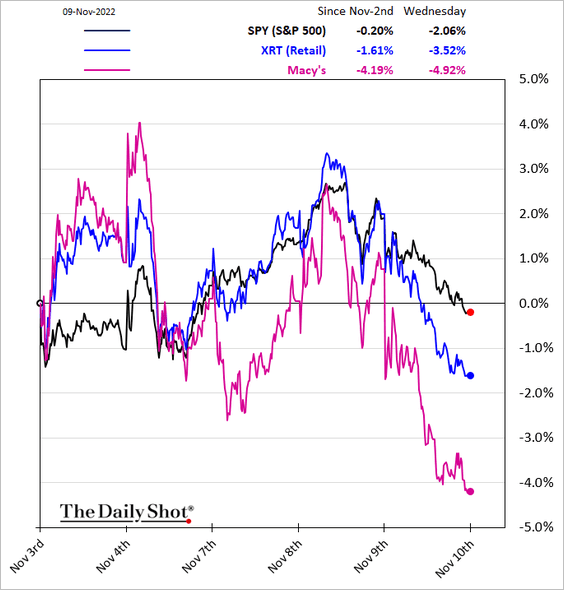
– Retail:
– Healthcare:
– Financials:
– Energy:
– Industrials (2 charts):
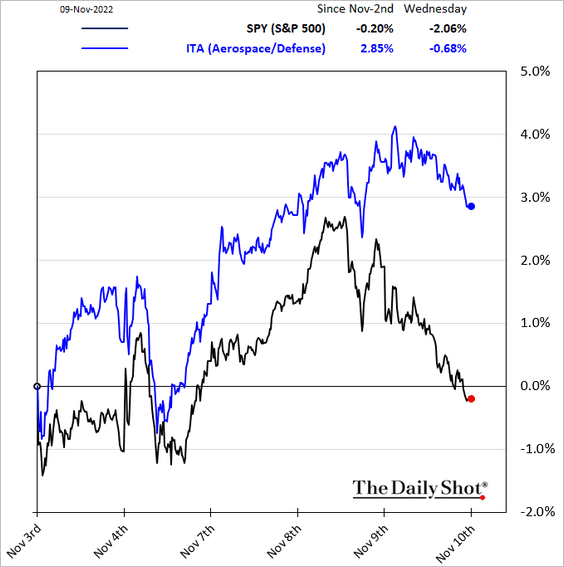
– Transportation:
![]()
– Semiconductors:
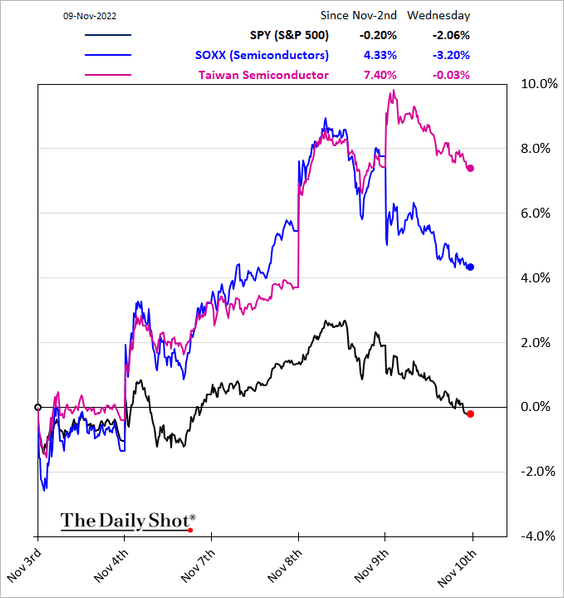
Back to Index
Credit
1. The rise in equity volatility points to wider US investment-grade credit spreads.
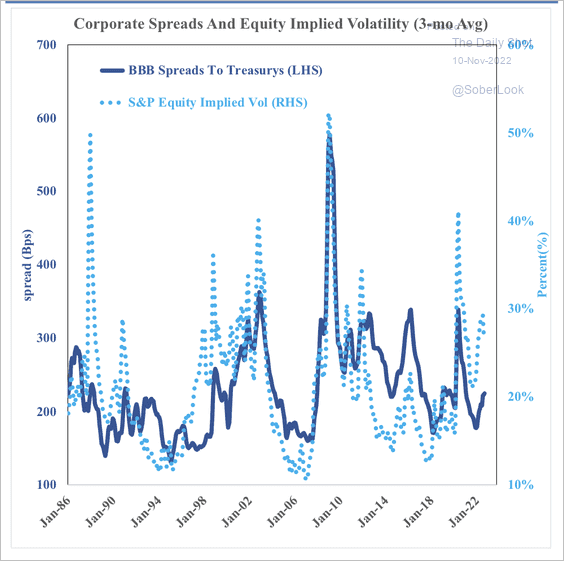 Source: SOM Macro Strategies
2. Tighter credit conditions signal higher default rates ahead.
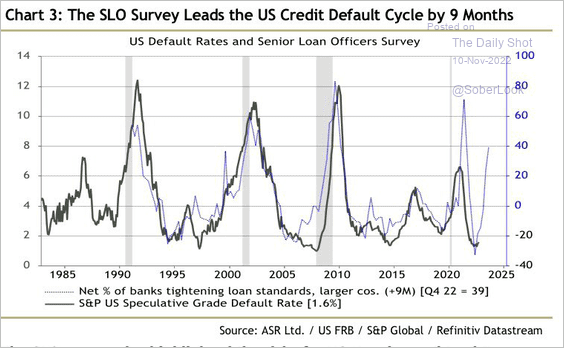 Source: @IanRHarnett
3. Interest coverage has increased as leverage has fallen.
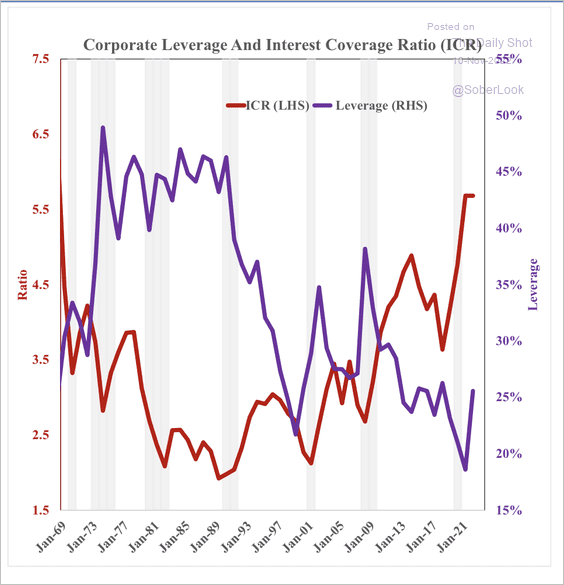 Source: SOM Macro Strategies
——————–
Food for Thought
1. Global food prices:
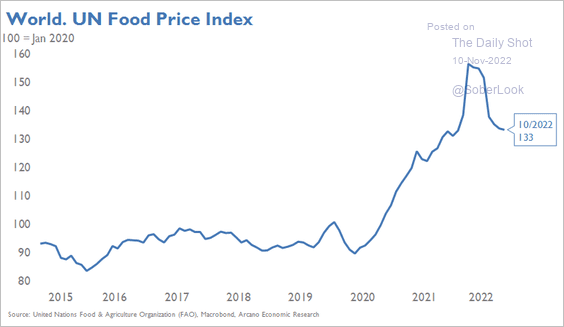 Source: Arcano Economics
2. The US Strategic Petroleum Reserve:
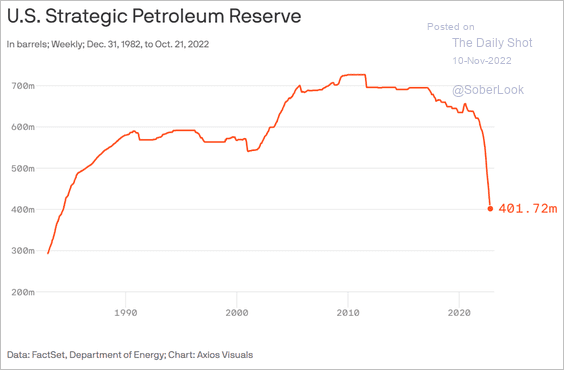 Source: @axios Read full article
3. The world’s biggest employers:
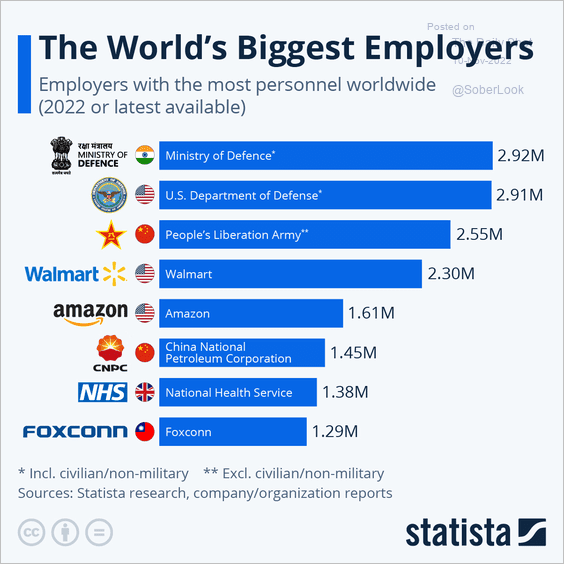 Source: Statista
4. Ukrainian refugees in Europe:
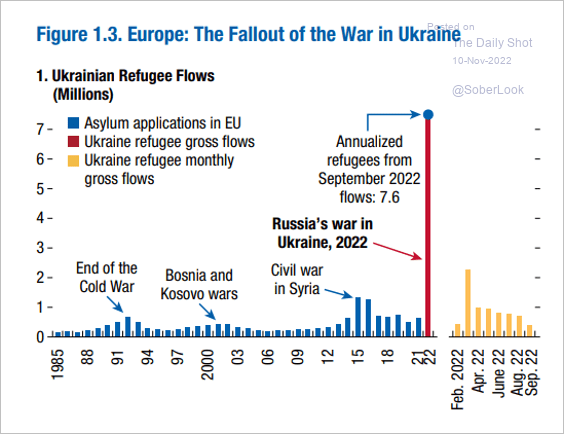 Source: IMF Read full article
5. Internet censorship around the world:
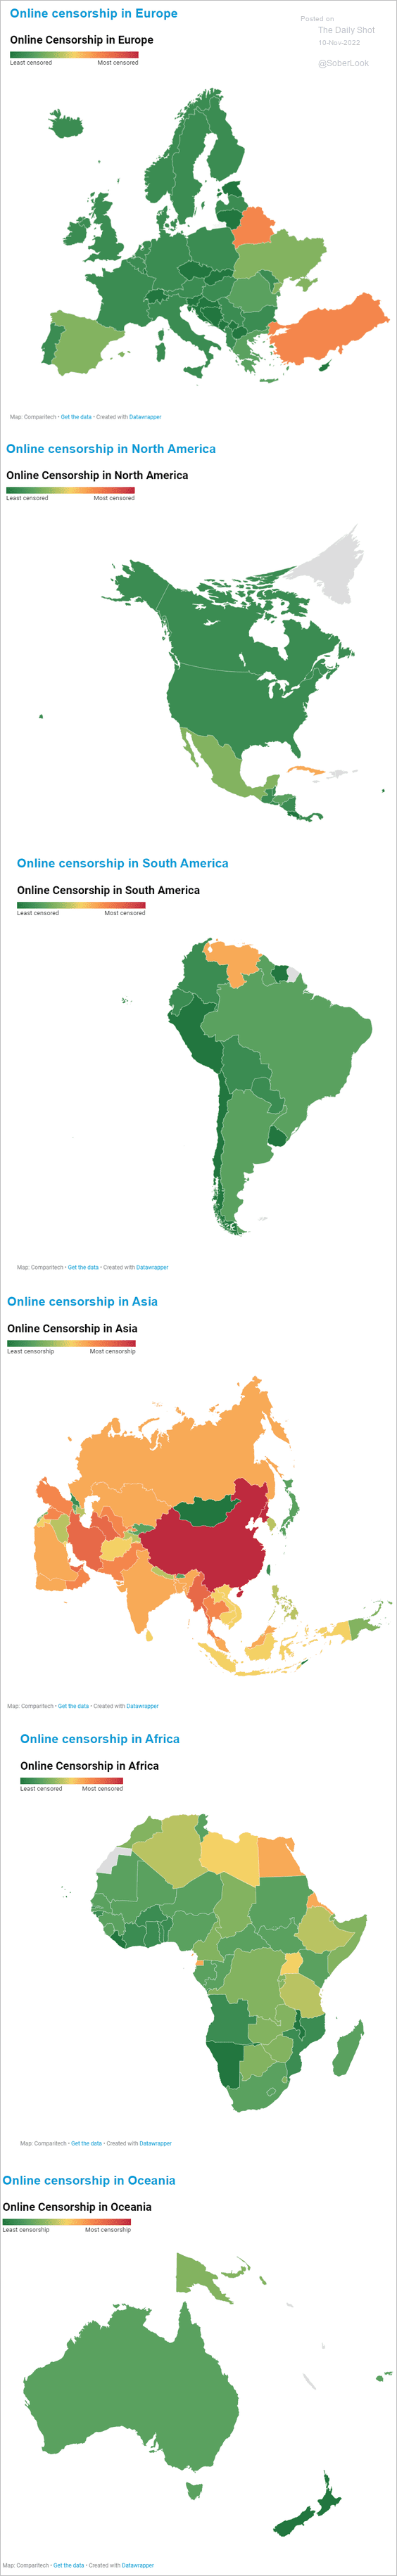 Source: Comparitech Read full article
6. The number of territorial changes over time:
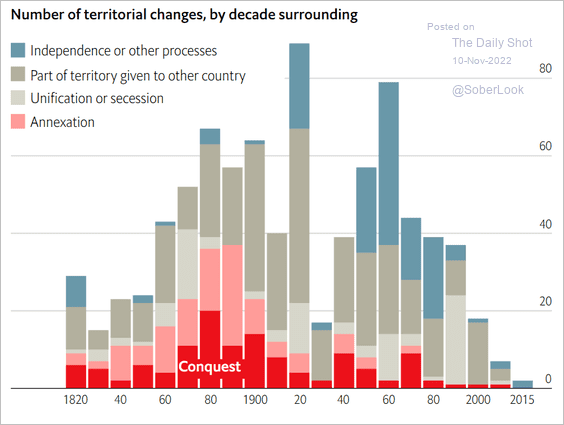 Source: The Economist Read full article
7. Horror movies’ market share:
 Source: @chartrdaily
——————–
.
Back to Index