
The Daily Shot: 17-Nov-22
• The United States
• Canada
• The United Kingdom
• The Eurozone
• Europe
• Japan
• Australia
• China
• Cryptocurrency
• Energy
• Equities
• Rates
• Food for Thought
The United States
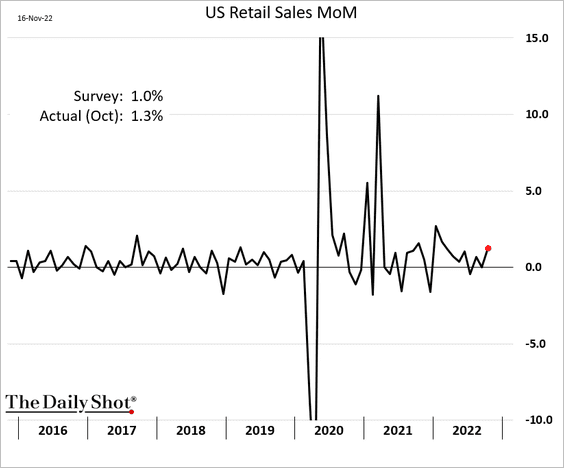
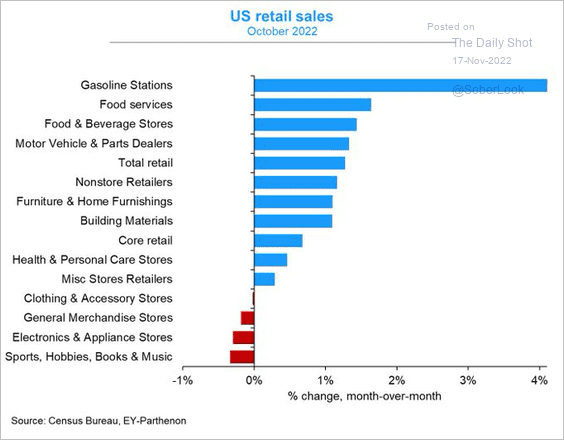
1. Retail sales topped expectations, suggesting that consumers are willing to spend despite the surge in prices.
 Source: @WSJ Read full article
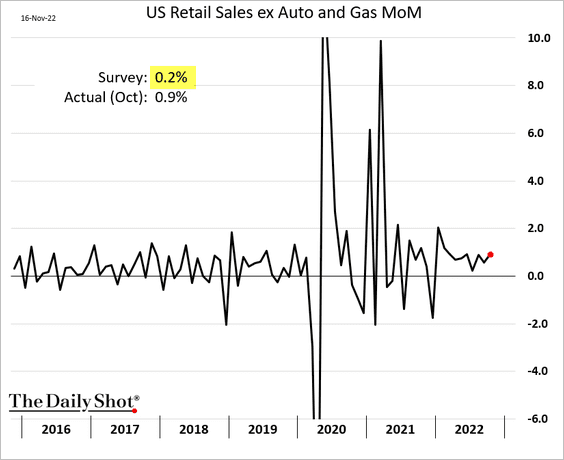
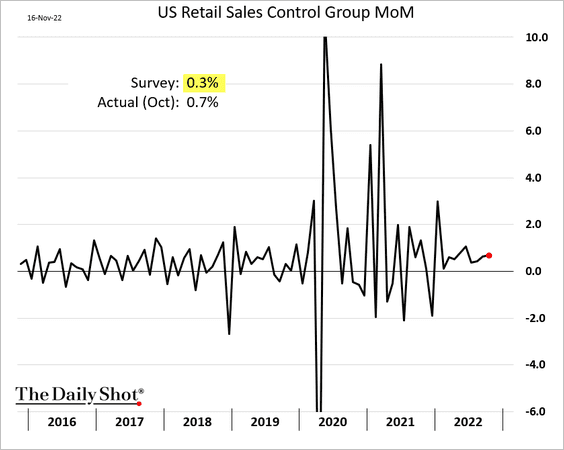
• Core retail sales were particularly strong.
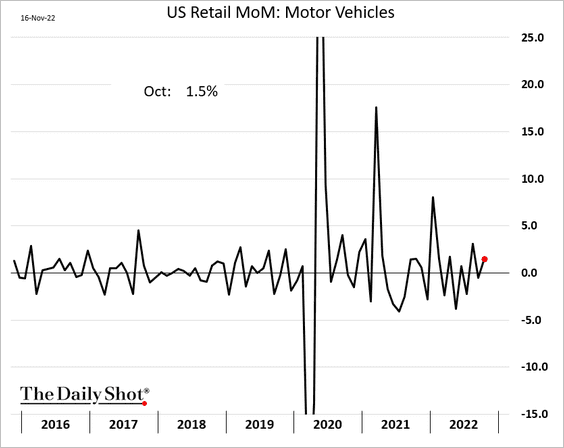
• Vehicle sales also increased.
• Here are the October changes by category.
 Source: @GregDaco
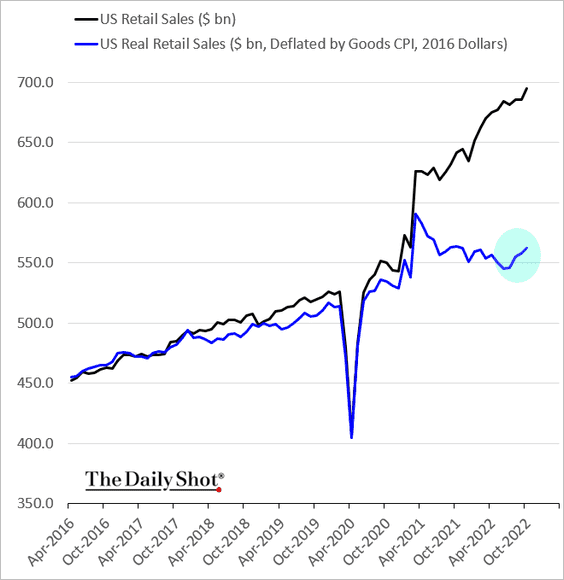
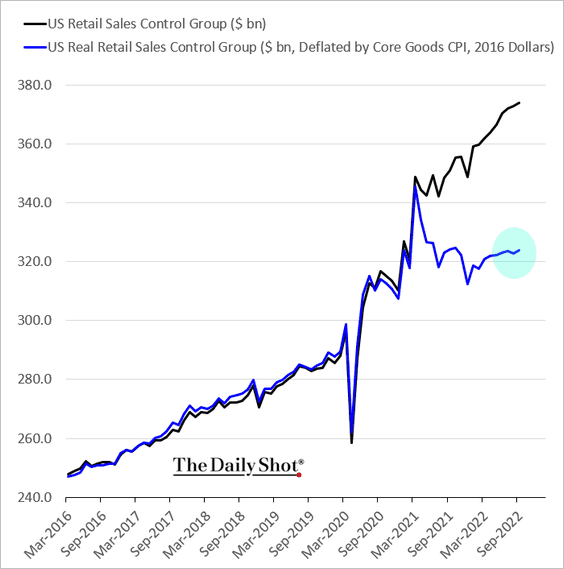
• The charts below show the levels of retail sales in nominal and real terms.
• The nonstore (online) share of retail sales remains well above pre-COVID levels.
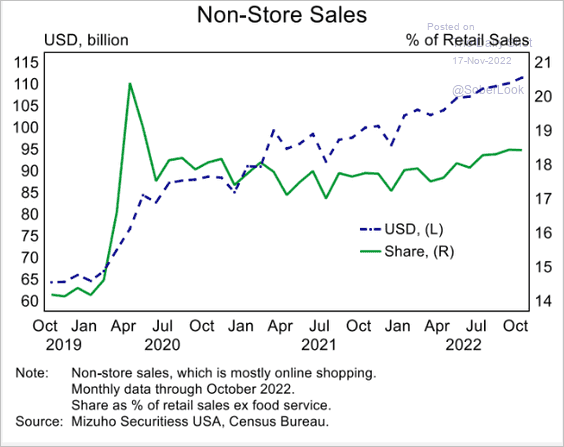 Source: Mizuho Securities USA
• Despite strong retail sales in October, real holiday spending is expected to be down this year for the first time since the GFC.
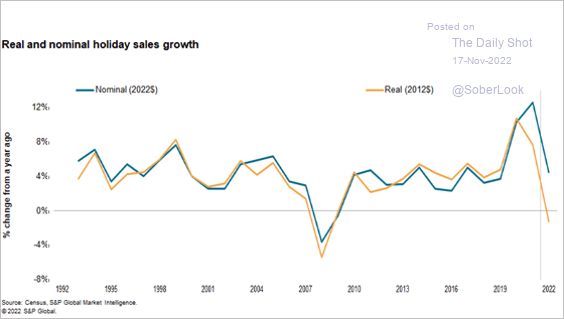 Source: S&P Global Market Intelligence
——————–
2. The Atlanta Fed’s GDPNow model estimate for the Q4 GDP growth jumped to 4.4% (annualized) in response to stronger-than-expected retail sales.
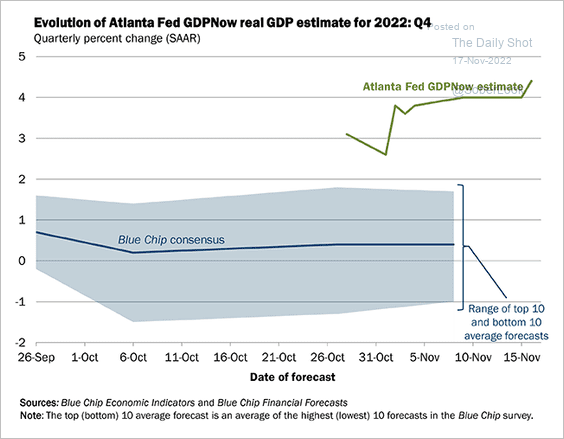 Source: @AtlantaFed Read full article
The bump came from expected goods spending this quarter.
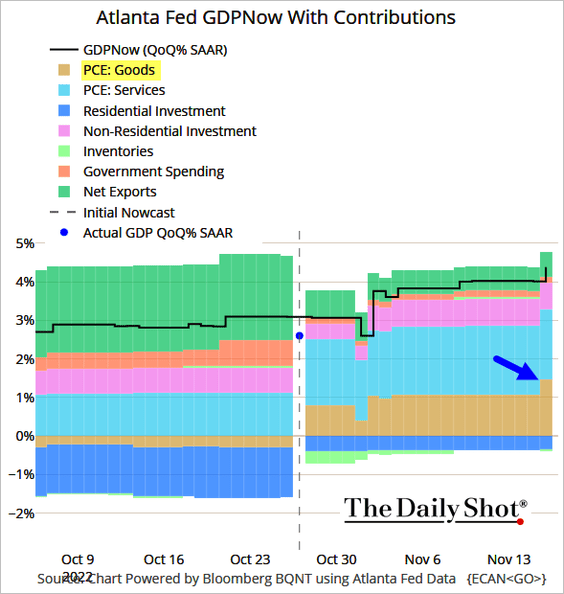 Source: @TheTerminal, Bloomberg Finance L.P.
——————–
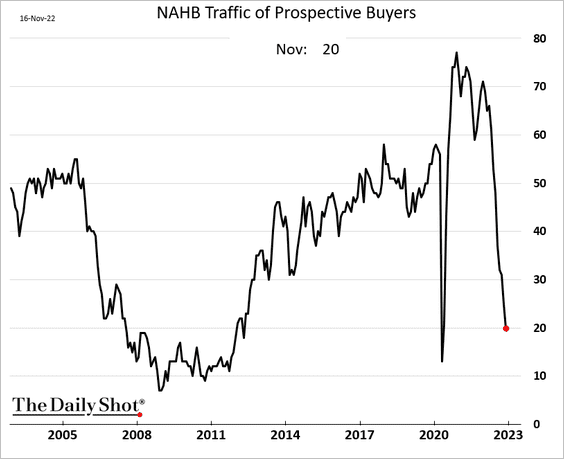
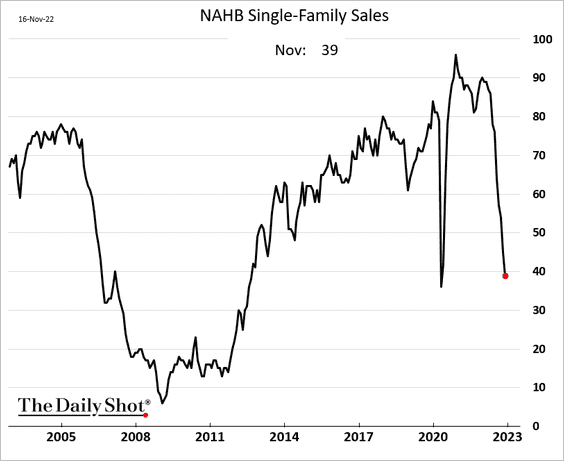
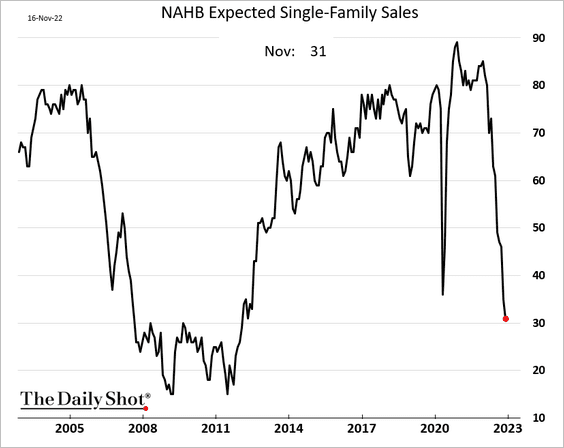
3. Homebuilder sentiment is crashing.
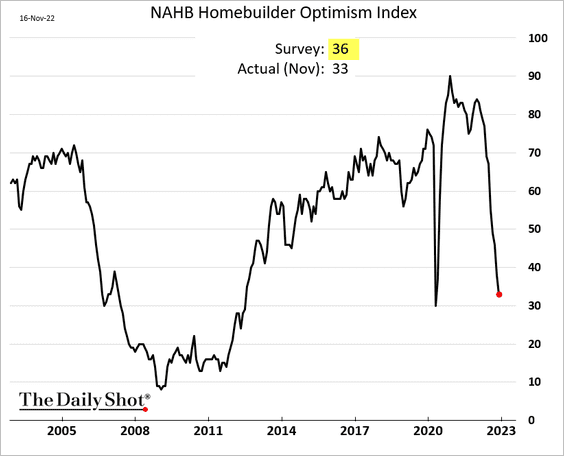
• Buyer traffic:
• Sales index:
• Expected sales:
What does it mean for residential construction?
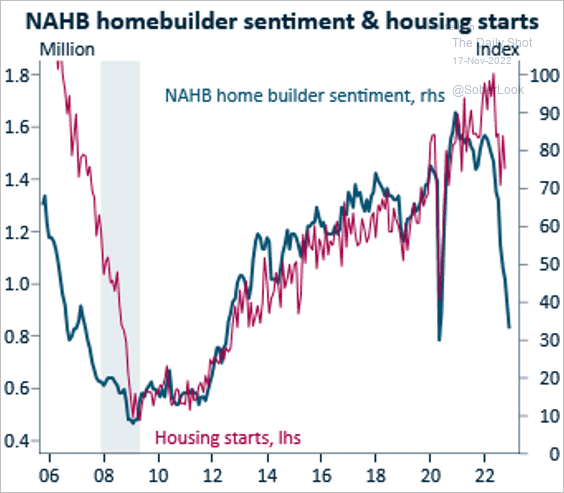 Source: @IFM_Economist
——————–
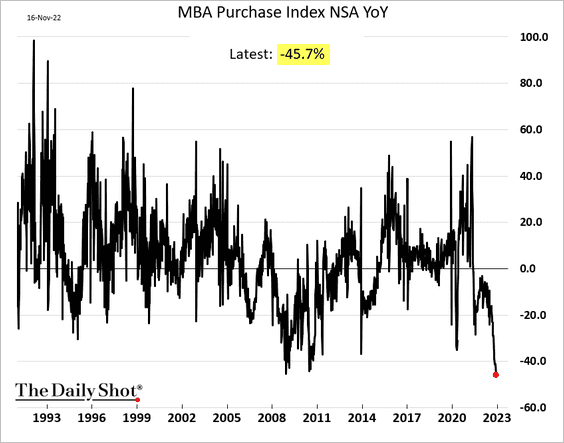
4. Mortgage applications hit the lowest level in a decade, …
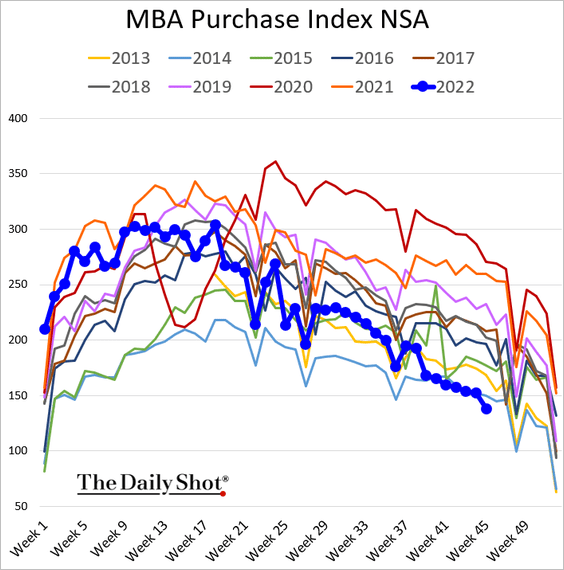
… with the biggest year-over-year decline on record.
——————–
5. The NY Fed’s index of service firms (in New York State, northern New Jersey, and southwestern Connecticut) points to a deterioration in business activity.
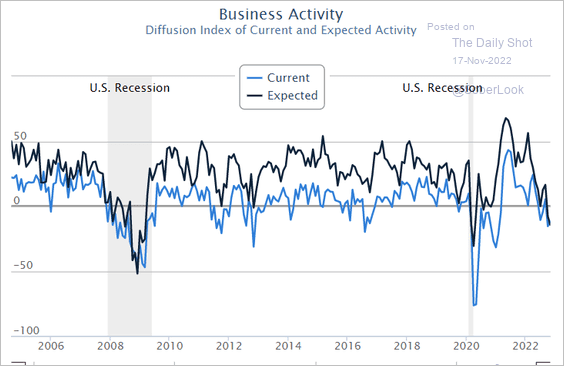 Source: Federal Reserve Bank of New York
6. Industrial production edged lower last month.
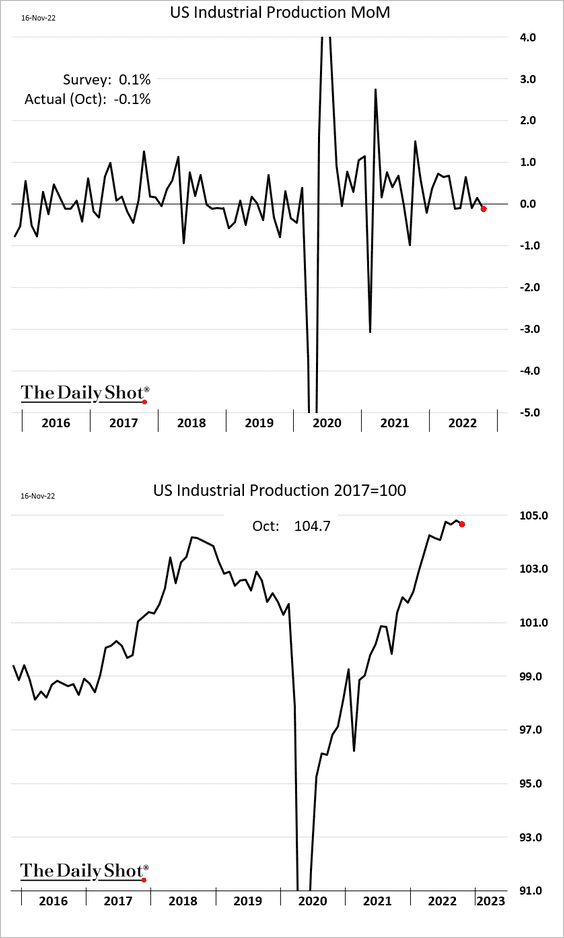
However, manufacturing output kept rising.
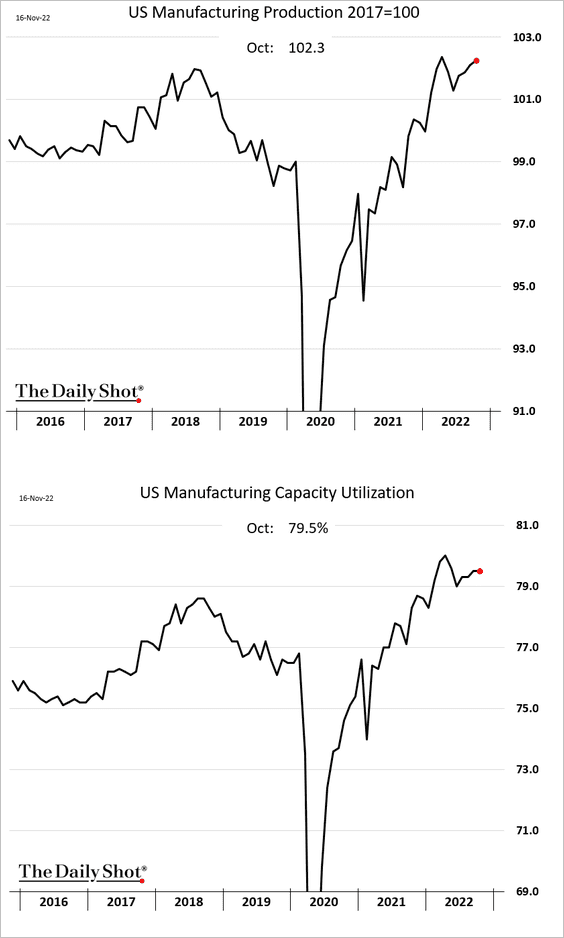
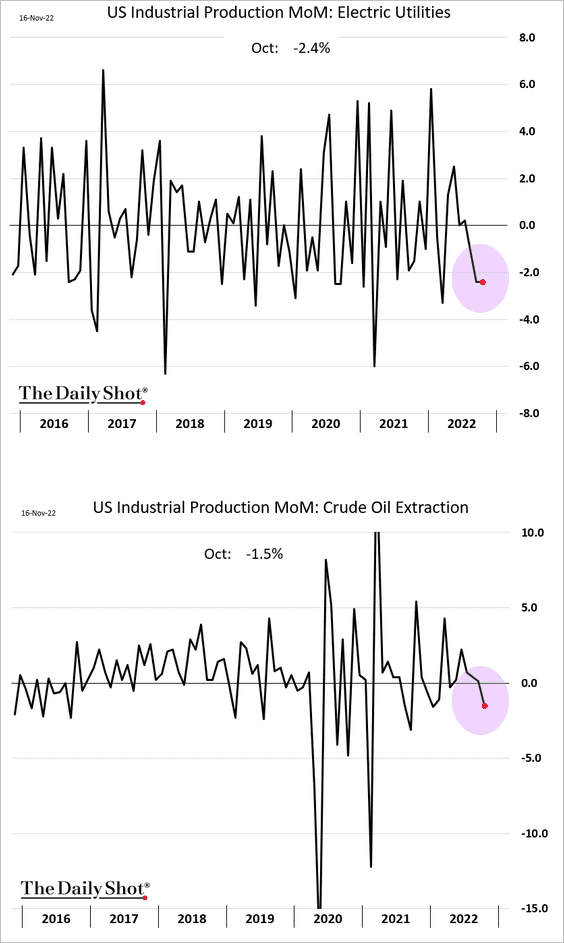
The weakness in industrial production was driven by utilities (warmer than usual weather) and softer oil production.
——————–
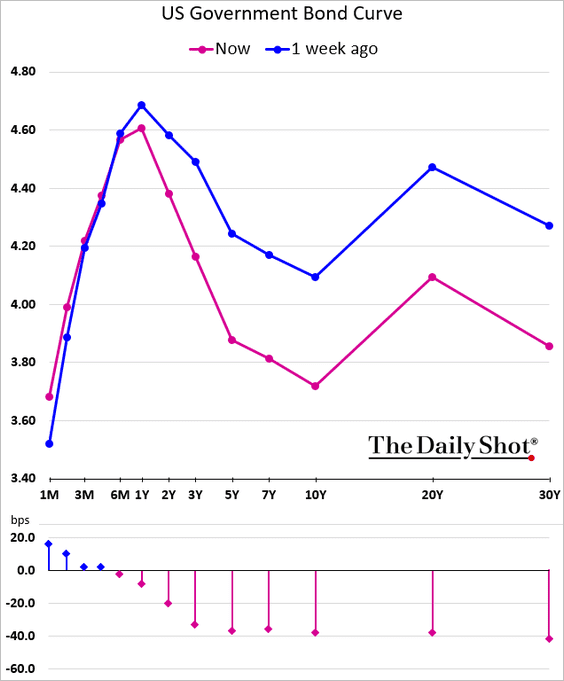
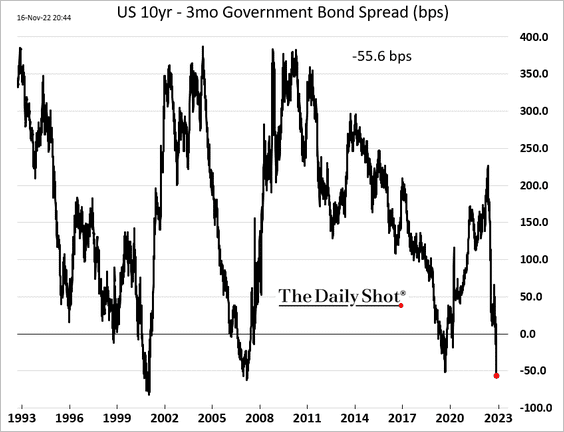
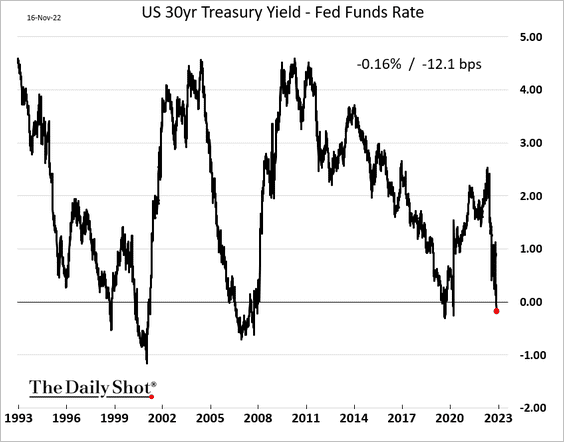
7. The last time the Treasury curve was this inverted was in early 1982.
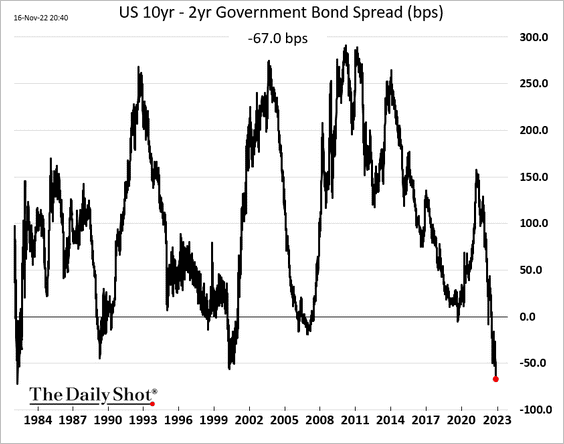
• 10yr vs. 3-month T-bill:
• 30yr vs. the fed funds rate:
——————–
8. The yield curve inversion signals an impending recession, which we also see in the survey of professional forecasters.
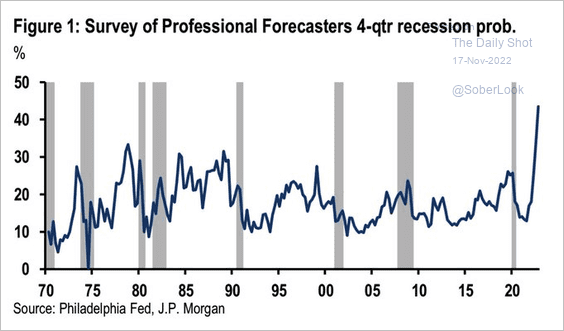 Source: JP Morgan Research; @WallStJesus
Tight financial conditions also signal a sharp economic downturn.
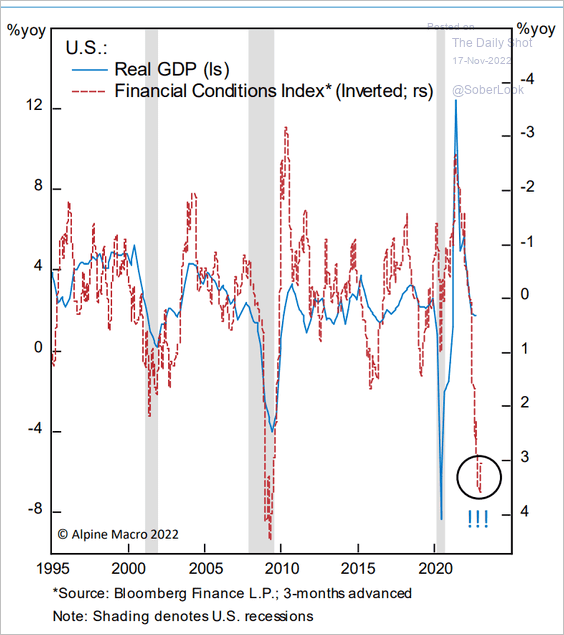 Source: Alpine Macro
Not everyone agrees. As we saw earlier (chart here), Morgan Stanley expects slower growth but not a recession. Goldman also sees a much lower chance of a recession than consensus estimates.
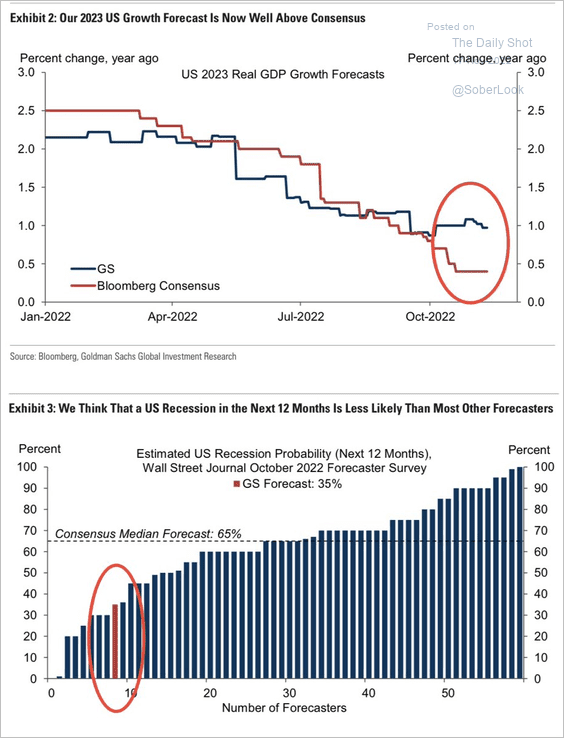 Source: Goldman Sachs; @carlquintanilla
Back to Index
Canada
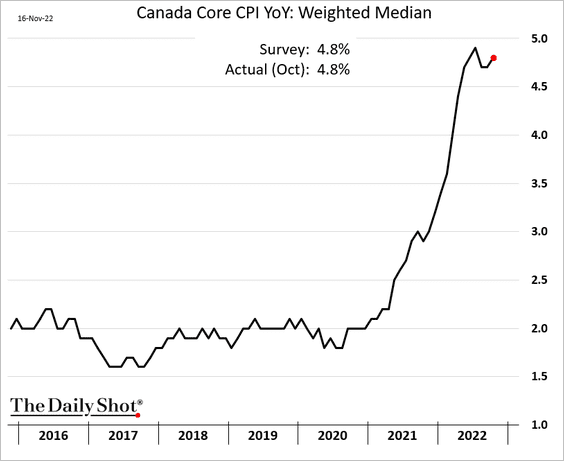
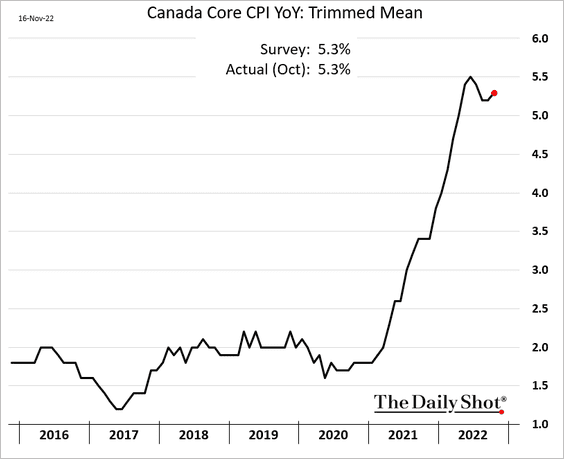
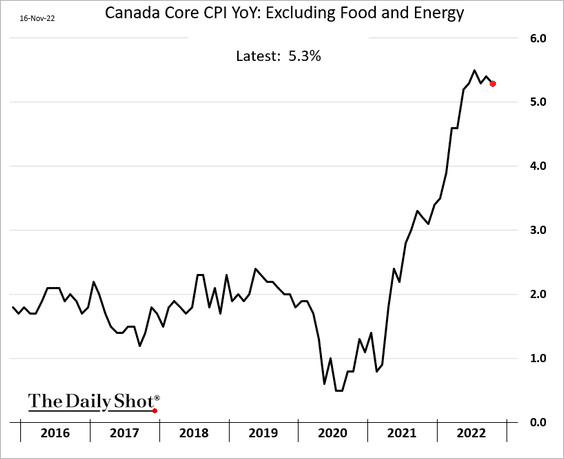
1. The inflation report was roughly in line with forecasts.
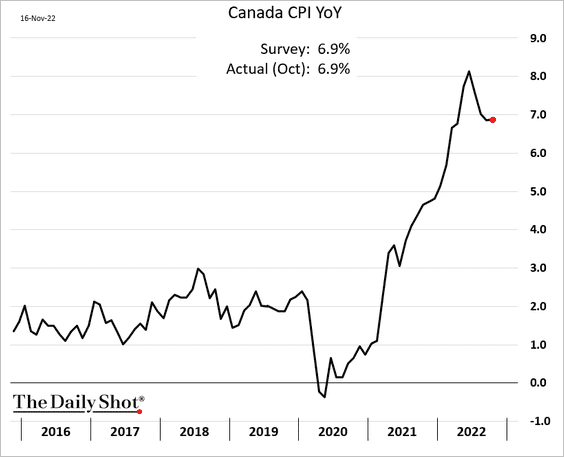
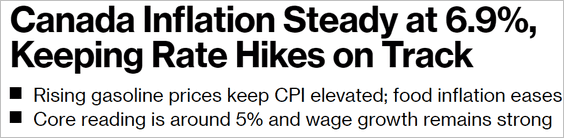 Source: @business, @rtkwrites Read full article
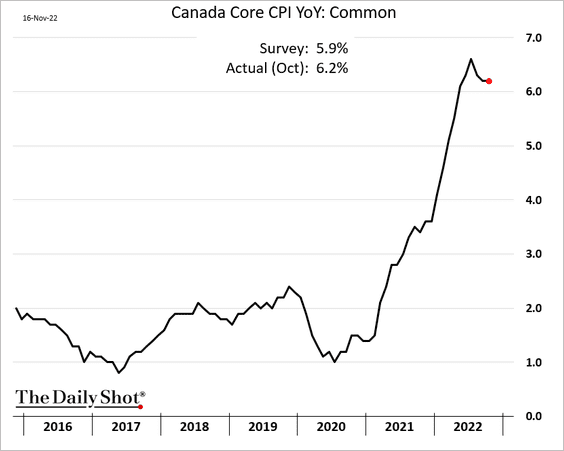
Core inflation remains sticky (4 charts).
However, the three-month chart looks promising.
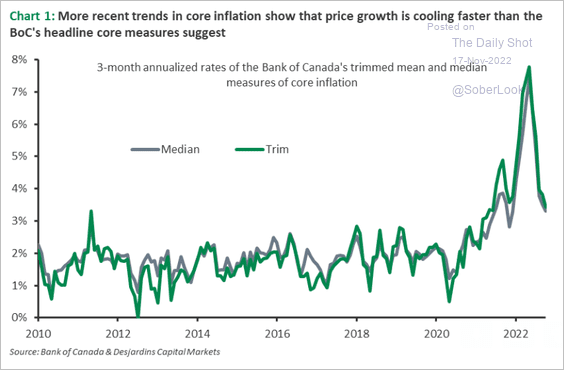 Source: Desjardins
Housing-related inflation has slowed.
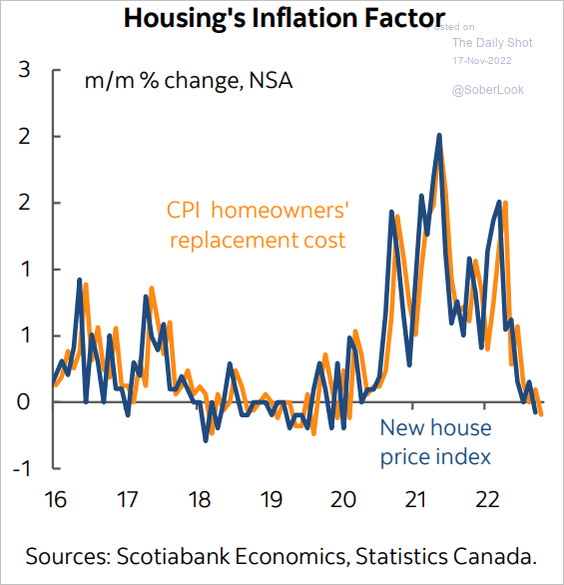 Source: Scotiabank Economics
——————–
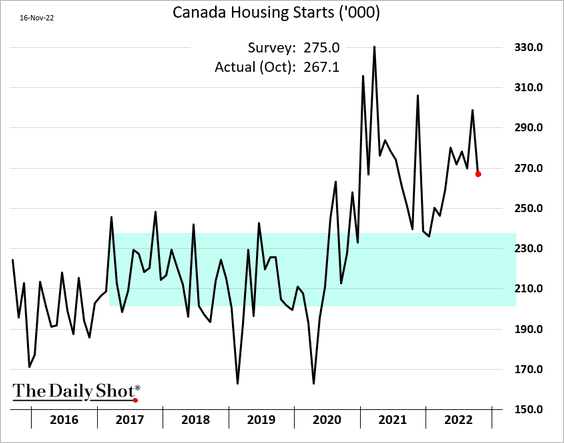
2. Housing starts remain well above pre-COVID levels.
Back to Index
The United Kingdom
1. The headline inflation blasted past 11%, topping expectations.
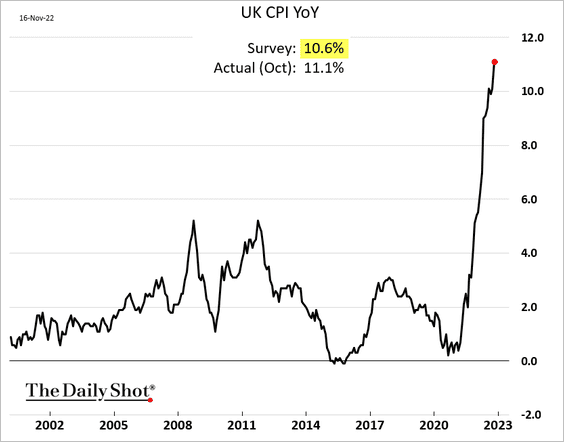
 Source: Reuters Read full article
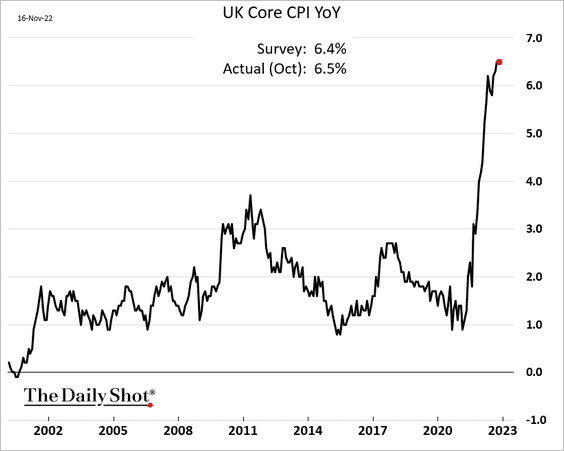
• The core inflation held steady.
• Here are the contributions to the year-over-year CPI index.
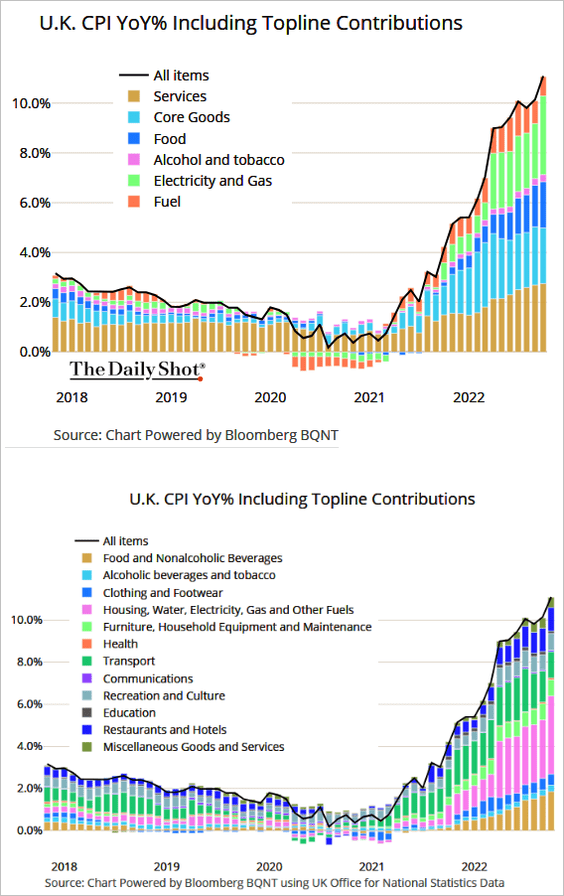 Source: @TheTerminal, Bloomberg Finance L.P.
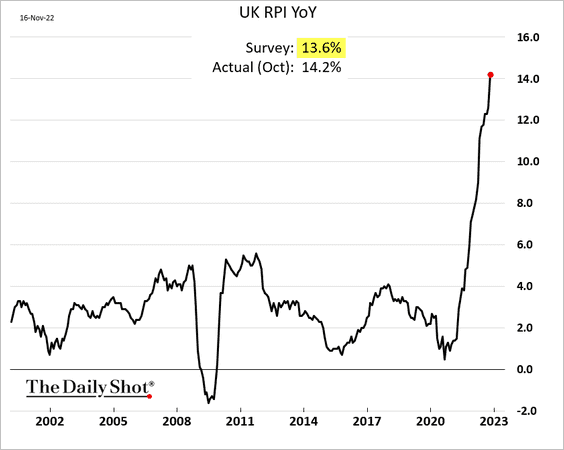
• Retail inflation also surprised to the upside, exceeding 14%.
• Here is a forecast from ING.
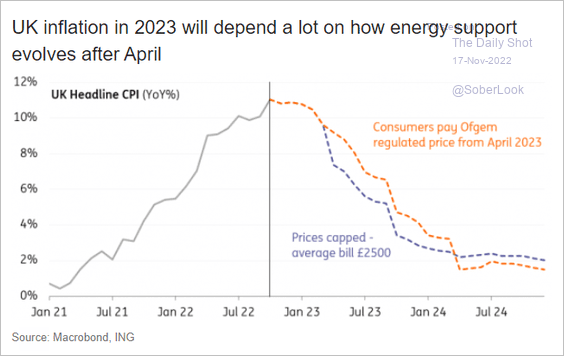 Source: ING
——————–
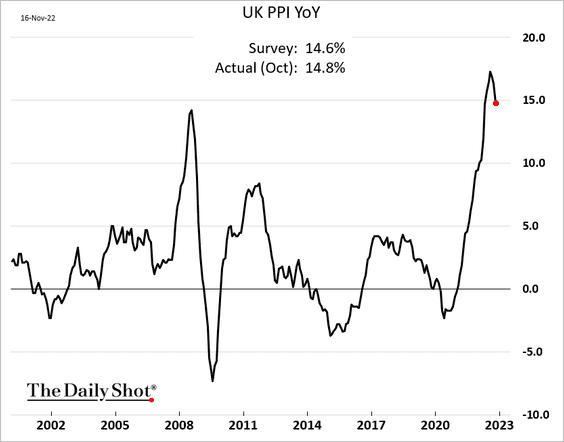
2. The PPI has peaked but was also above consensus estimates.
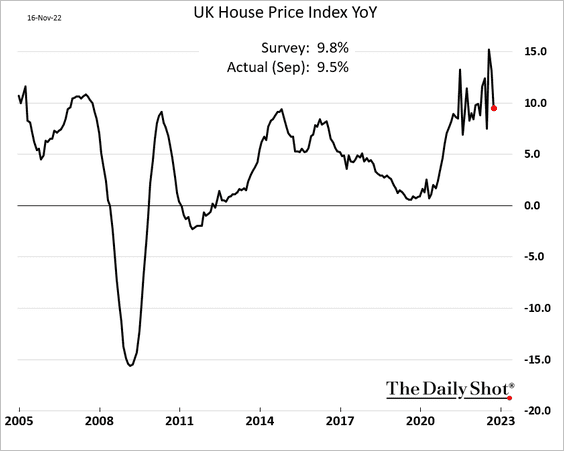
3. The official index of home prices was below estimates (for September). But this is old news – more timely indicators point to worsening housing market conditions last month.
4. Time for insulation measures?
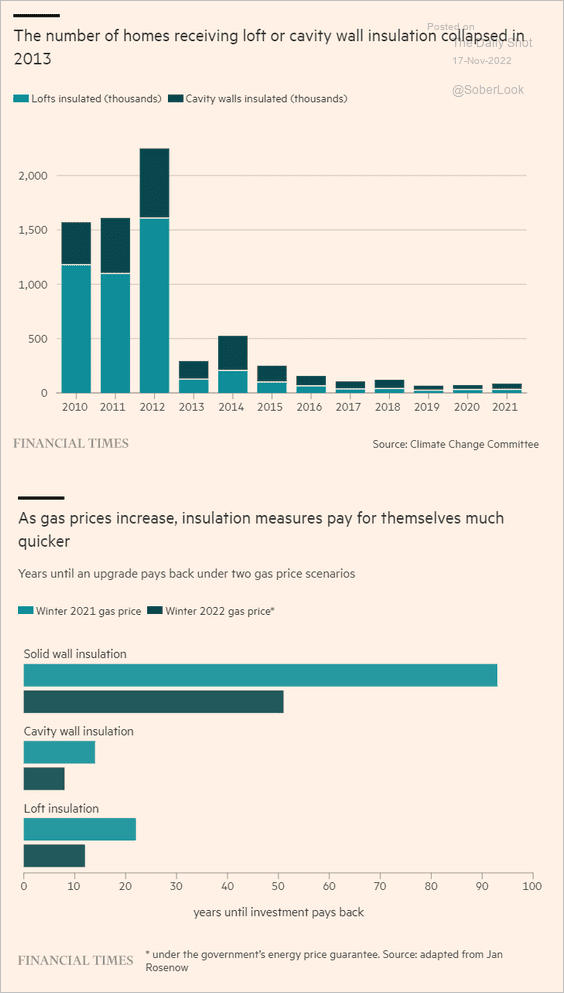 Source: @financialtimes Read full article
Back to Index
The Eurozone
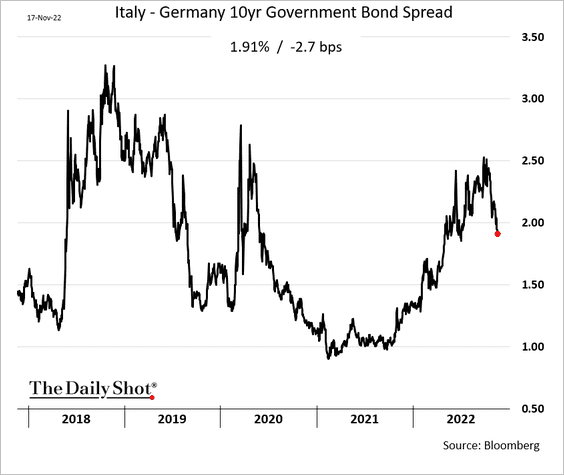
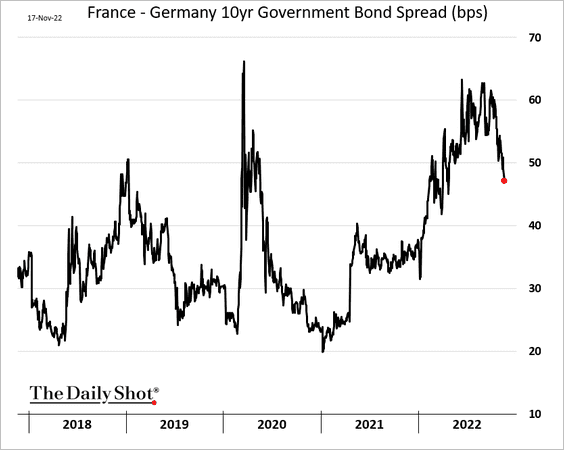
1. Spreads to Bunds have been falling.
• Italy:
• France:
——————–
2. Germany’s labor market has been tightening.
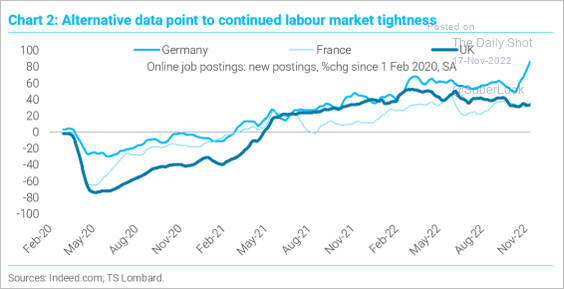 Source: TS Lombard
3. Portugal’s economy has outperformed this year.
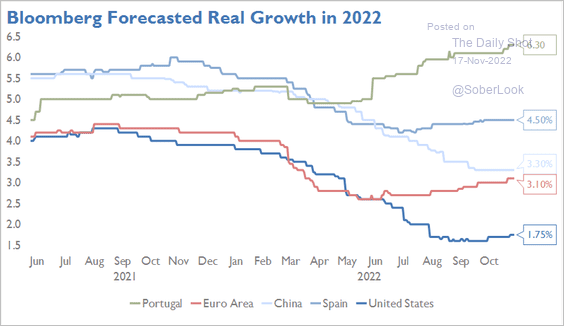 Source: Arcano Economics
4. The euro area economy and markets have lagged behind the US. Is the underperformance over?
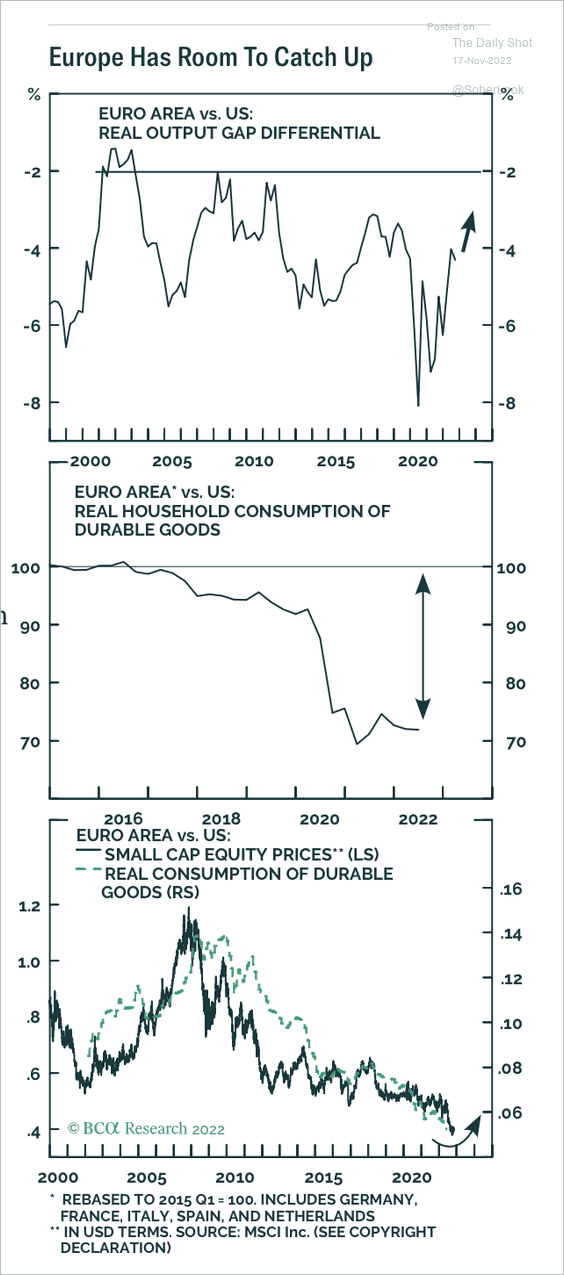 Source: BCA Research
Back to Index
Europe
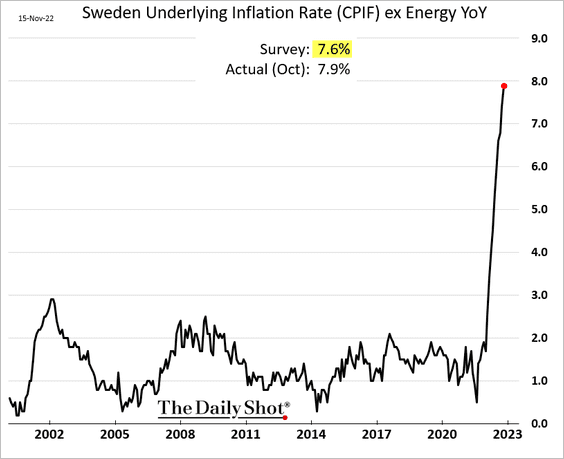
1. Sweden’s core inflation continues to surge.
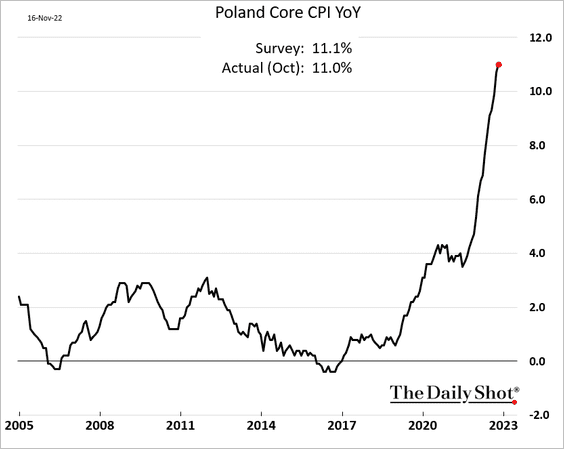
2. Poland’s core CPI hit 11%.
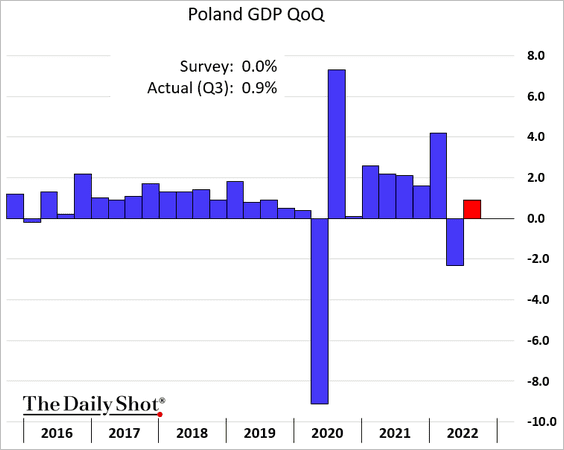
Poland’s GDP growth rebounded last quarter, avoiding a technical recession.
——————–
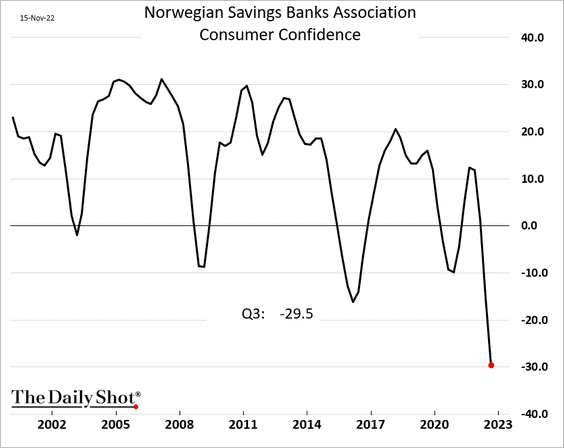
3. Norway’s consumer confidence has collapsed.
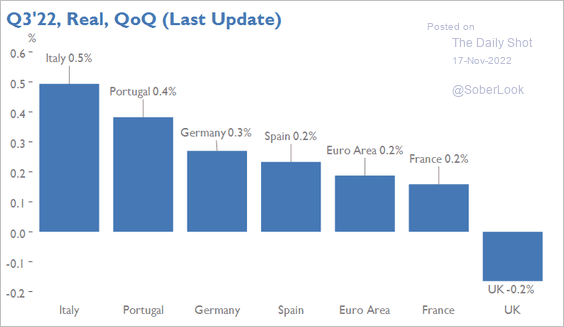
4. Here is a look at Q3 GDP growth in select economies.
 Source: Arcano Economics
5. Finally, we have social protection benefits expenditures in the EU.
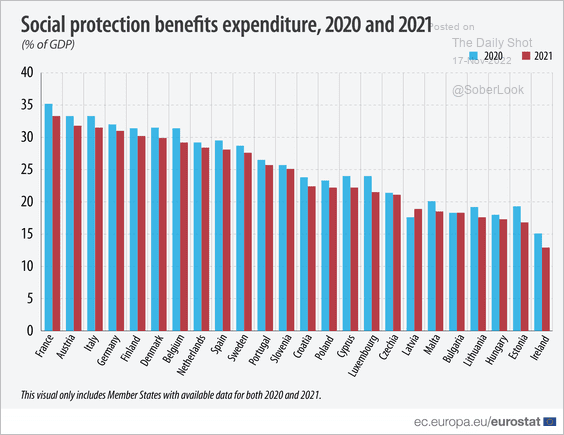 Source: Eurostat Read full article
Back to Index
Japan
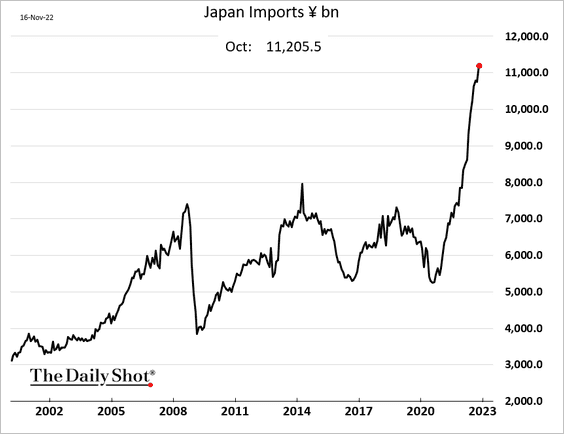
1. Japan’s trade deficit is holding near record levels, …
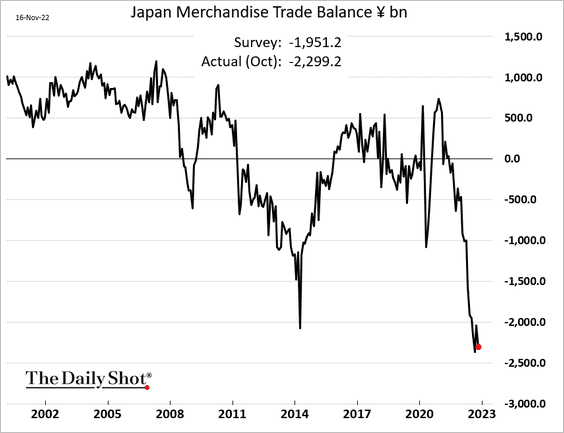
… as imports hit a new high.
——————–
2. The Nikkei long-dated call options are cheap relative to the SP 500 equivalents.
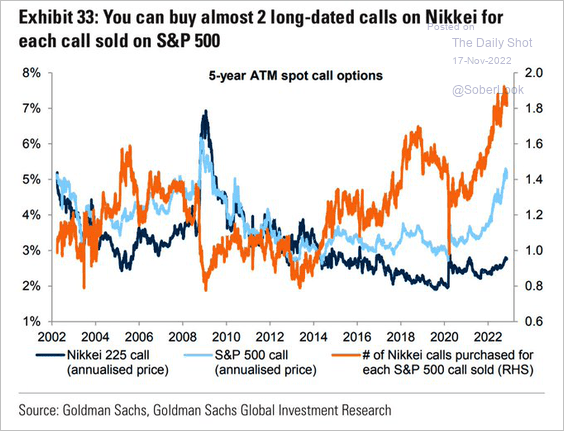 Source: Goldman Sachs; @WallStJesus
Back to Index
Australia
The labor market remains remarkably strong.
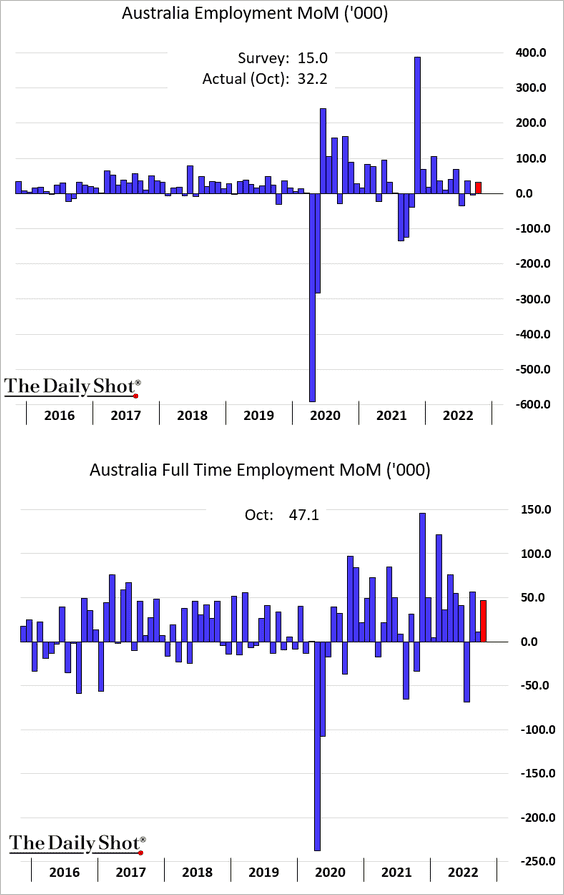
• The unemployment rate hit a multi-decade low.
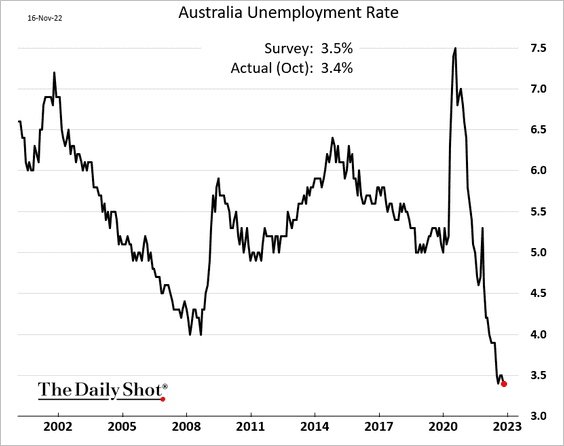
 Source: Reuters Read full article
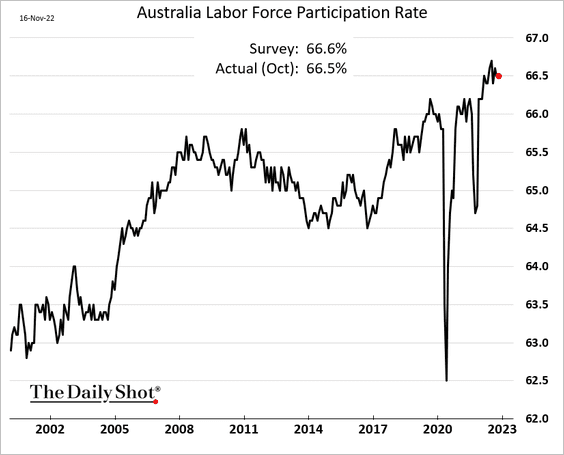
• Labor force participation remains well above pre-COVID levels.
• Here is the share of part-time employment.
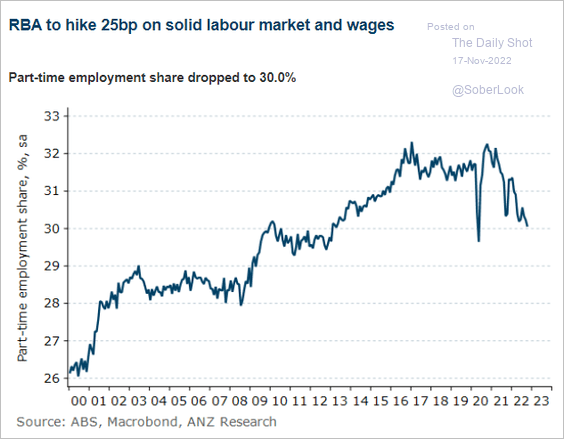 Source: @ANZ_Research
• Why did some Australians work fewer hours than usual?
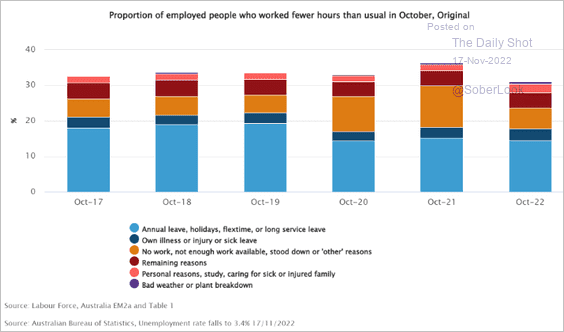 Source: ABC NEWS Read full article
The unemployment rate is expected to start climbing. Here are a couple of forecasts.
– Capital Economics:
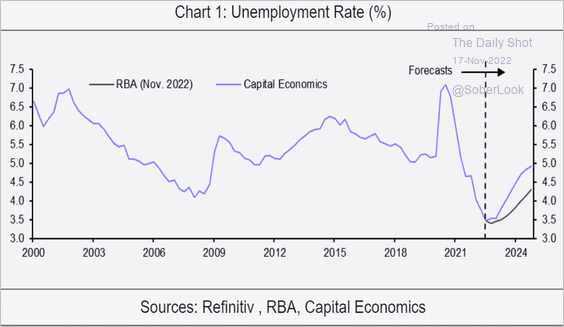 Source: Capital Economics
– ING:
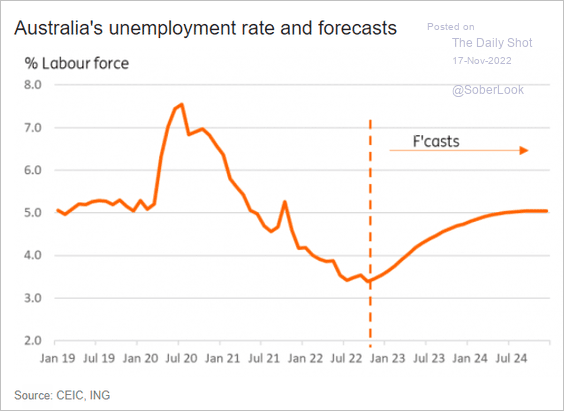 Source: ING
Back to Index
China
1. The COVID situation continues to pose a risk to economic activity.
 Source: AP Read full article
• COVID cases:
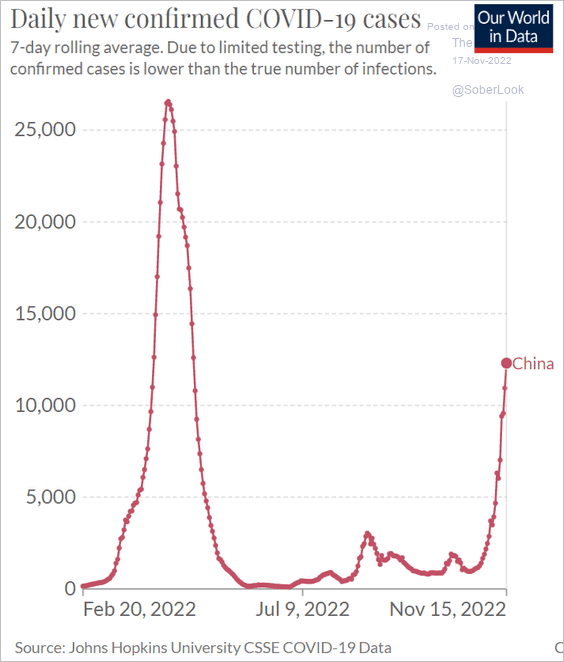 Source: Our World in Data
• Restrictions:
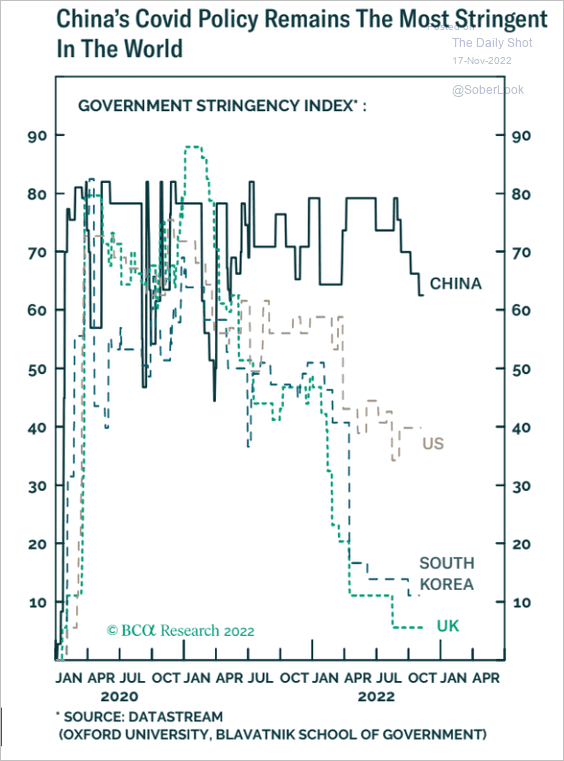 Source: BCA Research
——————–
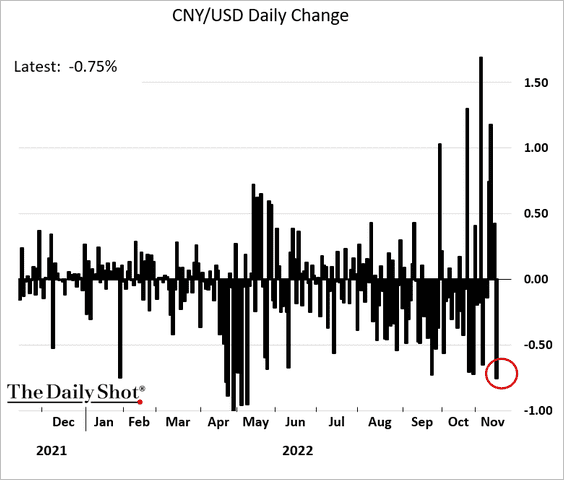
2. The renminbi declined.
3. China’s international debt issuance has grown massively over the past decade.
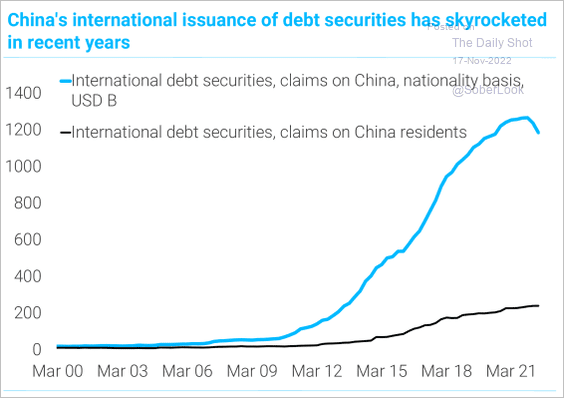 Source: TS Lombard
4. Oil imports from Russia keep rising.
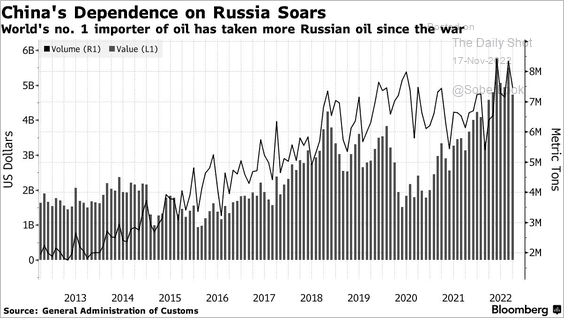 Source: @markets Read full article
Back to Index
Cryptocurrency
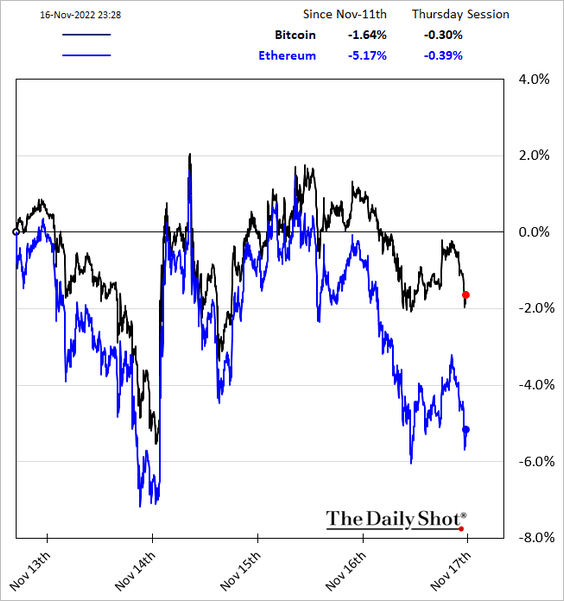
1. Ether has been underperforming.
By the way, here is a survey on how the Ethereum platform is used.
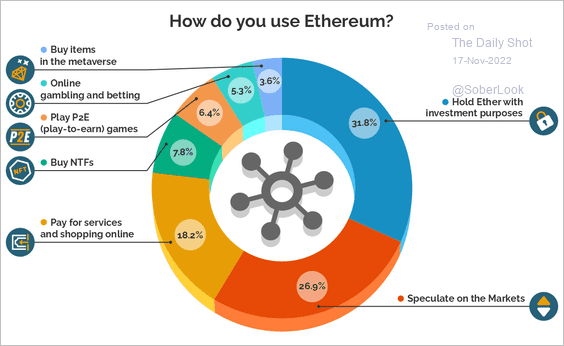 Source: BonusInsider Read full article
——————–
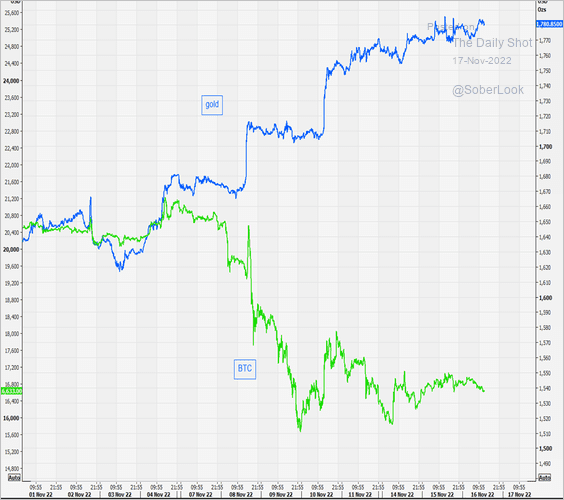
2. Bitcoin and gold have diverged sharply.
 Source: @themarketear
3. Bitcoin’s drawdown is nearing 80%.
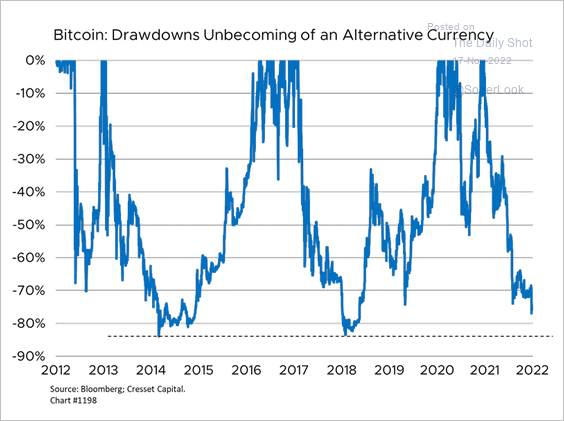 Source: Jack Ablin, Cresset Wealth Advisors
Back to Index
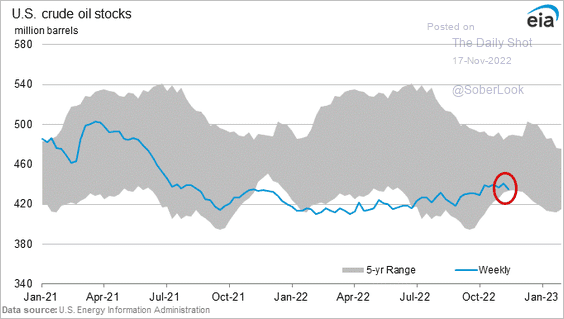
Energy
1. US oil inventories declined sharply last week.
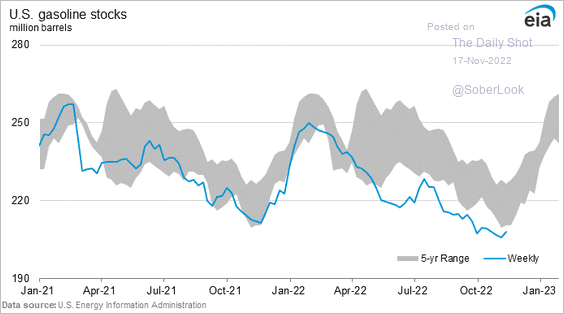
But gasoline inventories increased.
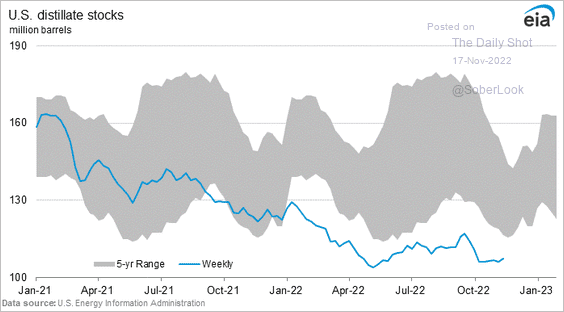
Distillates inventories remain at extreme lows, …
… driving up diesel and heating oil prices.
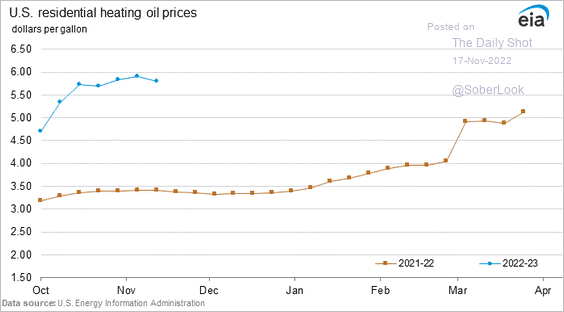
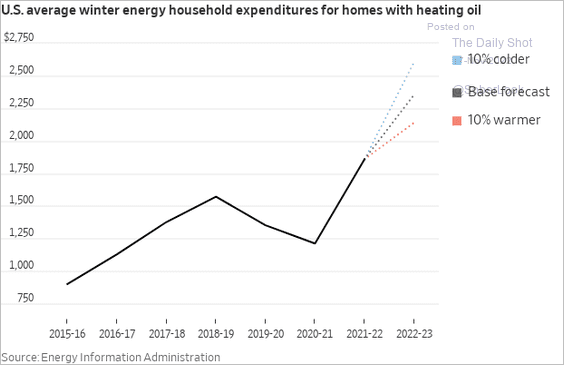 Source: @WSJ Read full article
——————–
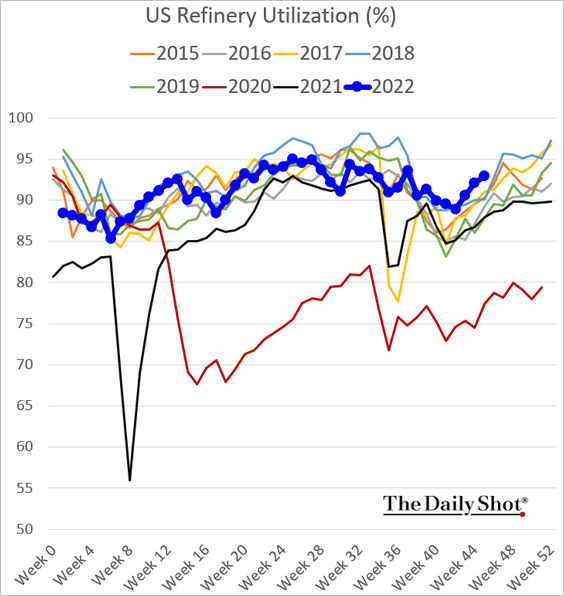
2. Refinery utilization remains elevated for this time of the year.
3. Will the looming economic slump lead to crude oil surpluses?
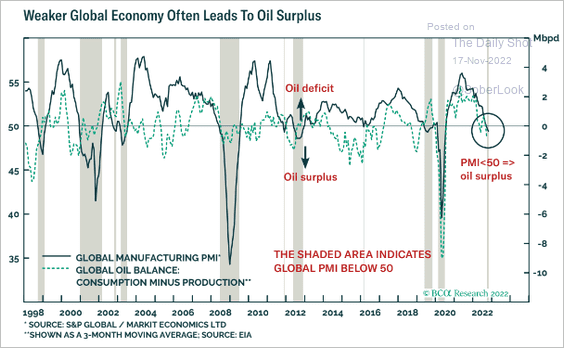 Source: BCA Research
4. This chart shows US clean energy installations.
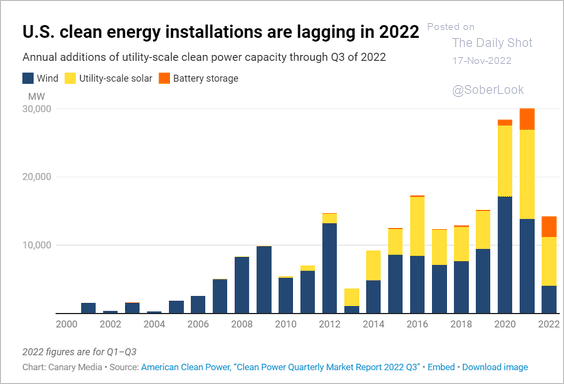 Source: Canary Media Read full article
Back to Index
Equities
1. The S&P 500 futures held resistance at the 200-day moving average.
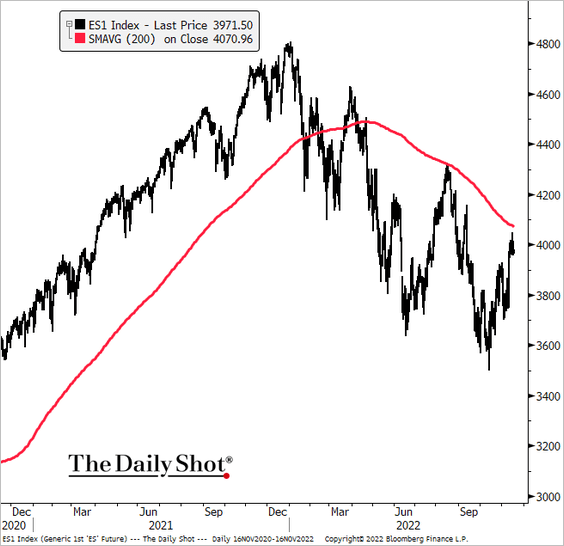 Source: @TheTerminal, Bloomberg Finance L.P.
2. We’ve had some sharp upswings this year.
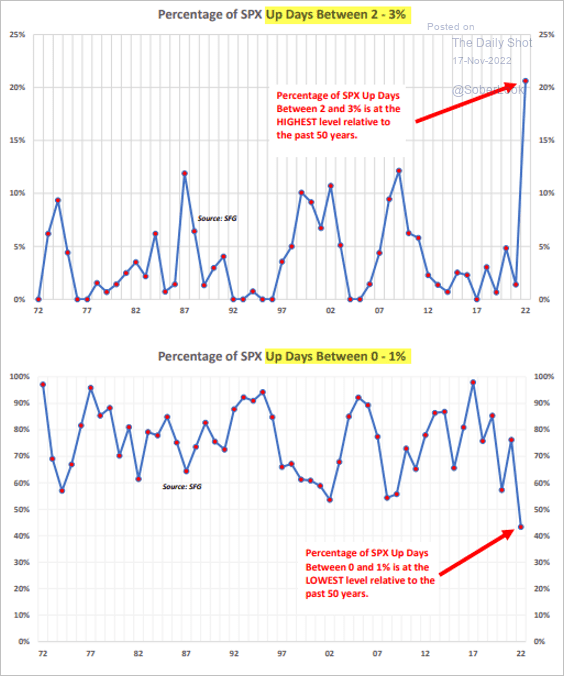 Source: Chris Murphy, Susquehanna International Group
3. Net earnings revisions continue to trend lower.
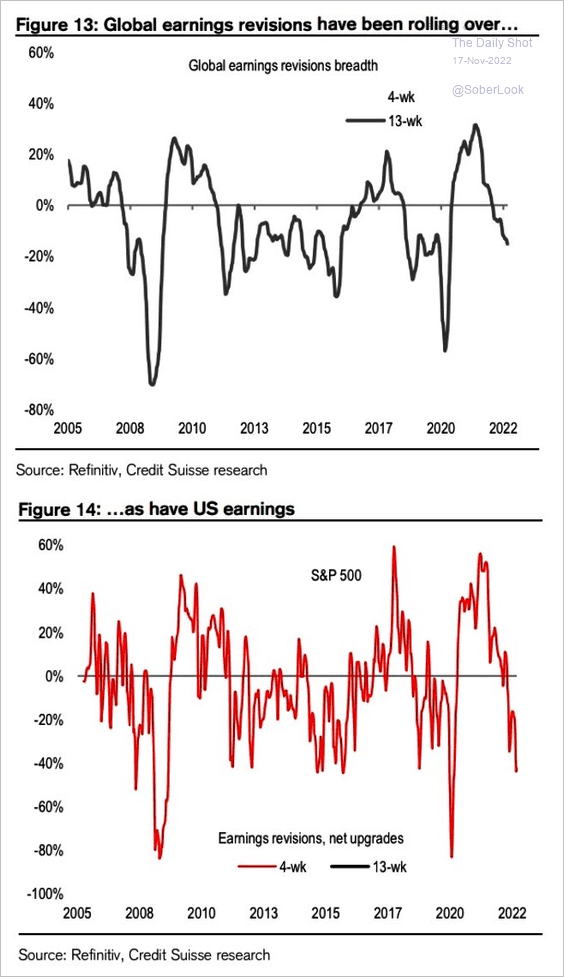 Source: Credit Suisse; @WallStJesus
Growth stocks continue to take the brunt of earnings downgrades.
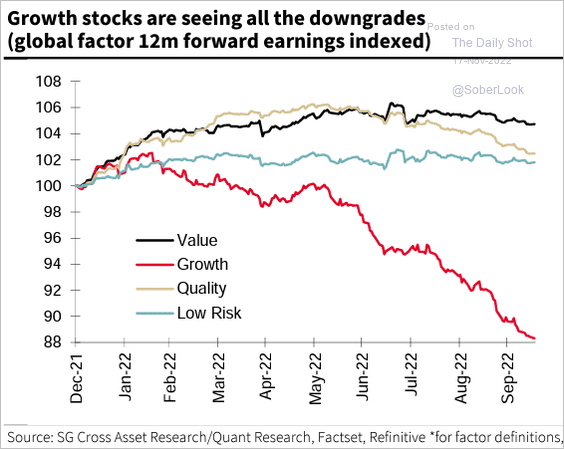 Source: Societe Generale Cross Asset Research; @MikeZaccardi, @TheTranscript_
——————–
4. Tighter credit conditions signal weaker revenue growth ahead.
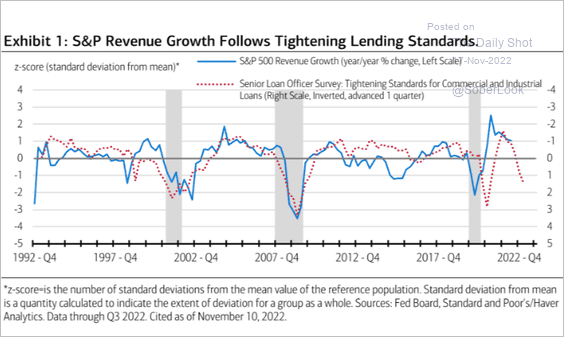 Source: Merrill Lynch
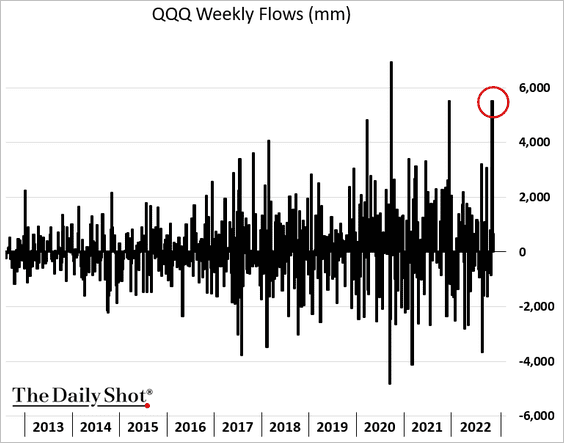
5. QQQ (NASDAQ 100 ETF) saw robust inflows recently.
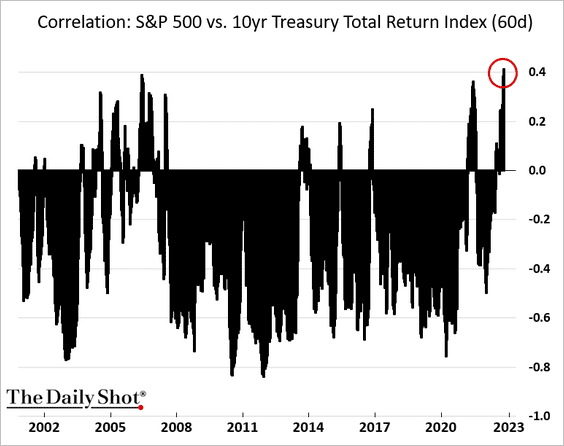
6. The correlation between stocks and bonds is hitting multi-year highs.
7. Options traders have been paying up for CPI-day protection.
 Source: Deutsche Bank Research
8. Next, we have some sector updates.
• Fund flows by sector:
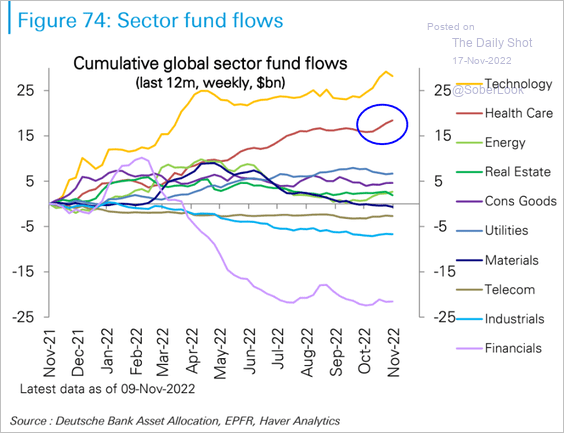 Source: Deutsche Bank Research
• The iShares Biotech ETF (at resistance):
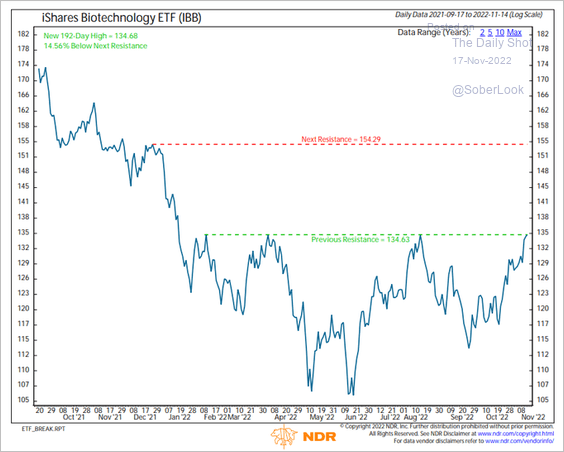 Source: @rob_anderson314
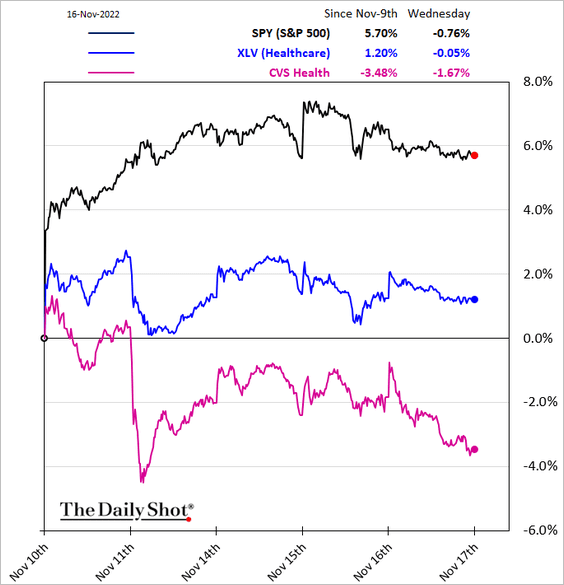
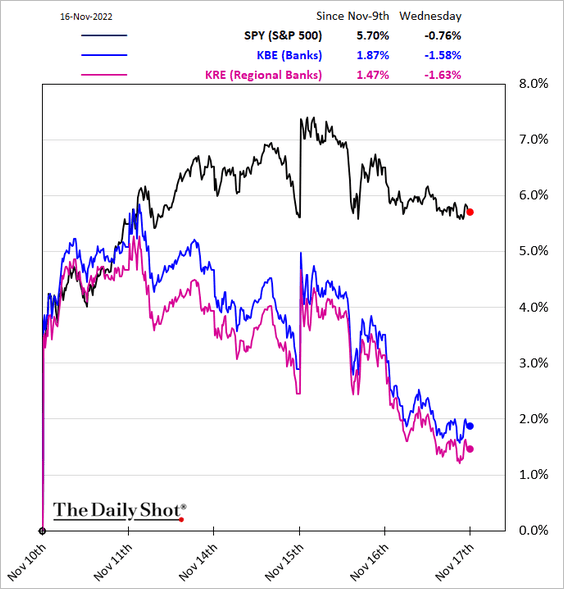
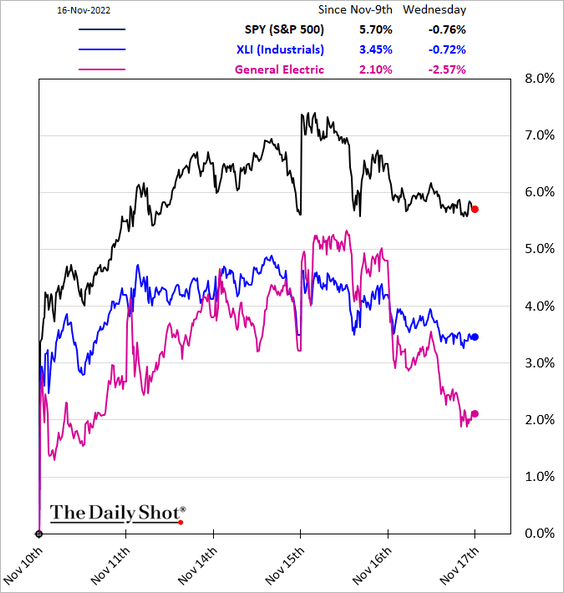
• Performance over the past five business days:
– Healthcare:
– Banks:
– Industrials:
– Semiconductors:
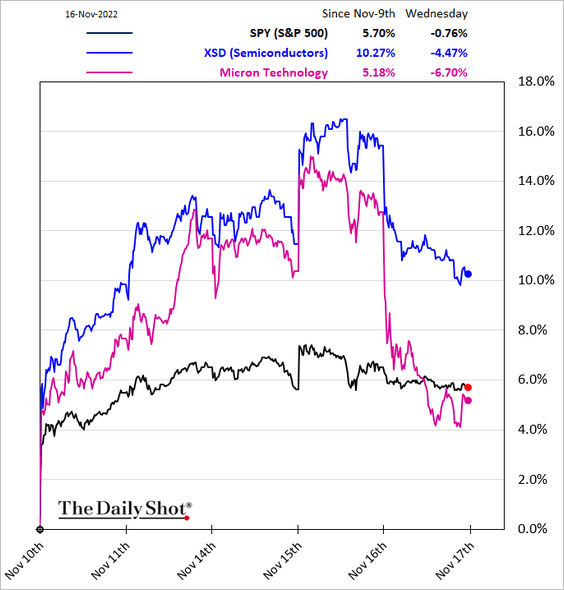
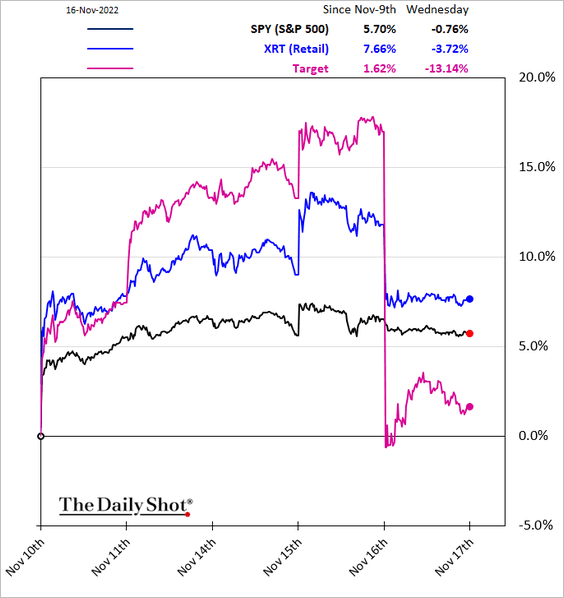
– Retail:
Back to Index
Rates
1. The 30-year TIPS yield (real yield) appears to be rolling over.
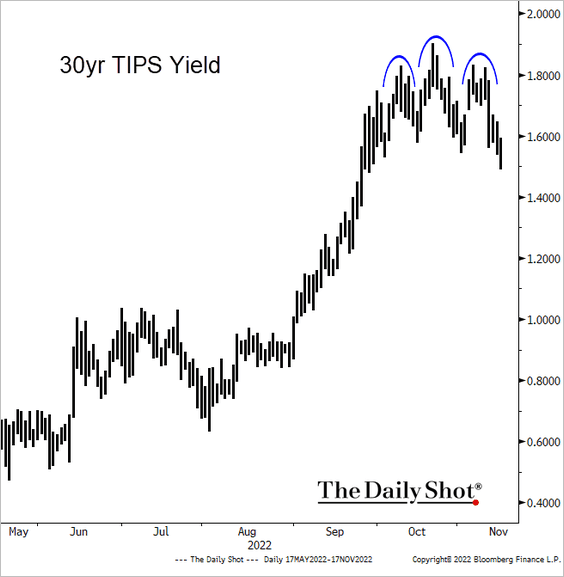 Source: @TheTerminal, Bloomberg Finance L.P.
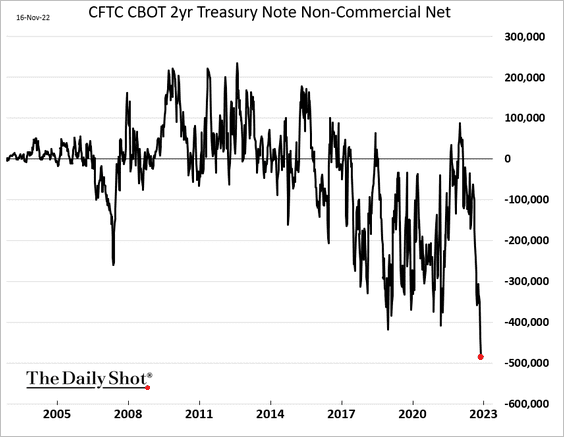
2. Speculative accounts are running massive bets against the 2-year Treasury note.
3. Monetary conditions are tighter than the fed funds rate indicates.
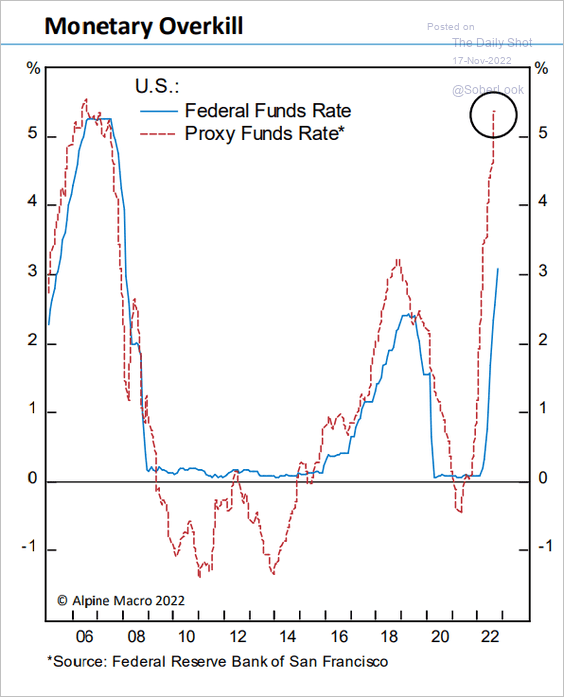 Source: Alpine Macro
4. The stock market is signaling lower Treasury yields ahead.
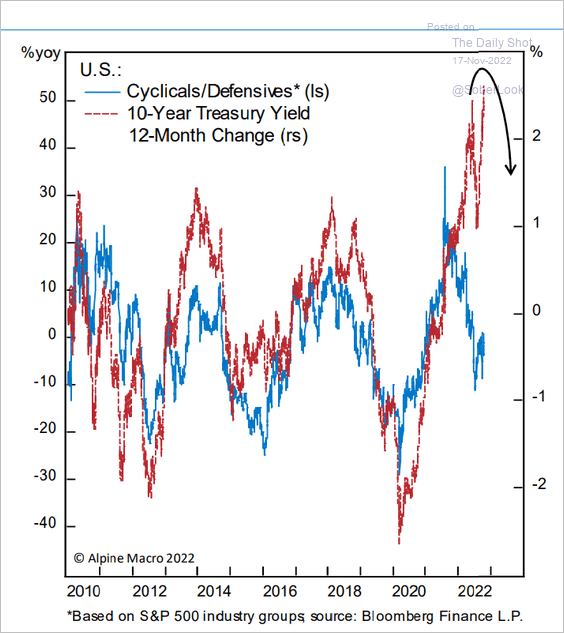 Source: Alpine Macro
5. Treasury market liquidity has been awful.
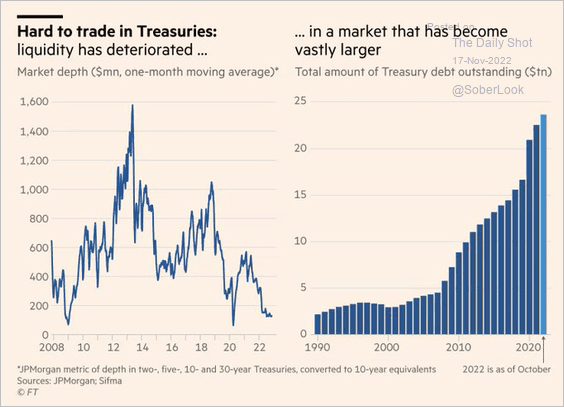 Source: @jessefelder, @FT Read full article
Back to Index
Food for Thought
1. Nominal and real spending on groceries in the US:
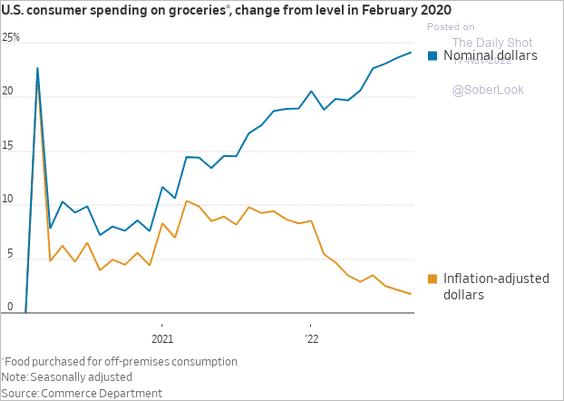 Source: @WSJ
2. Rising trade fragmentation risks:
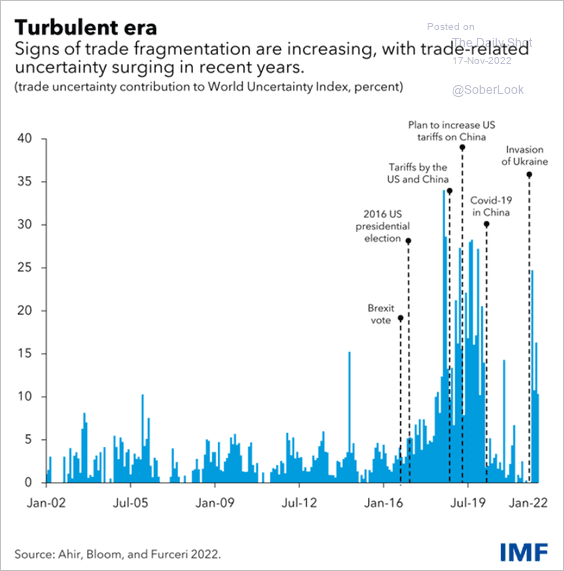 Source: IMF Read full article
3. Ukrainian seaborne grain exports:
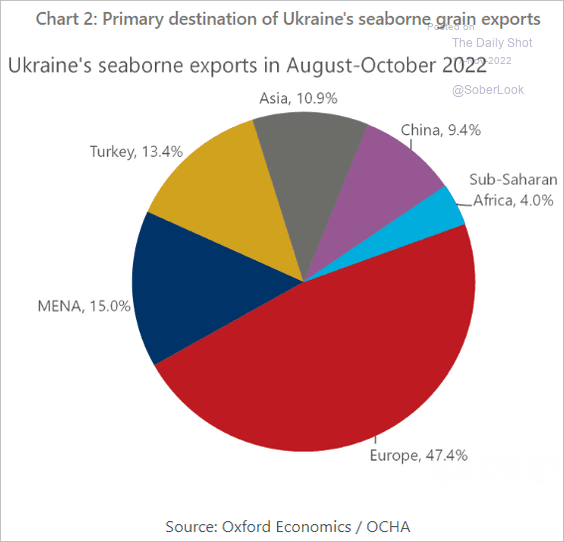 Source: @axios
4. Russia smuggling stolen Ukrainian grain:
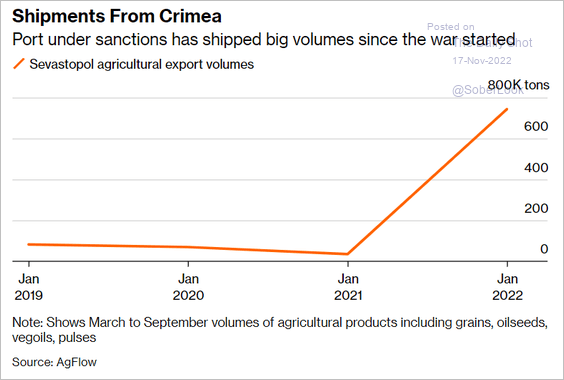 Source: @business Read full article
5. Who Americans spend their time with, by age:
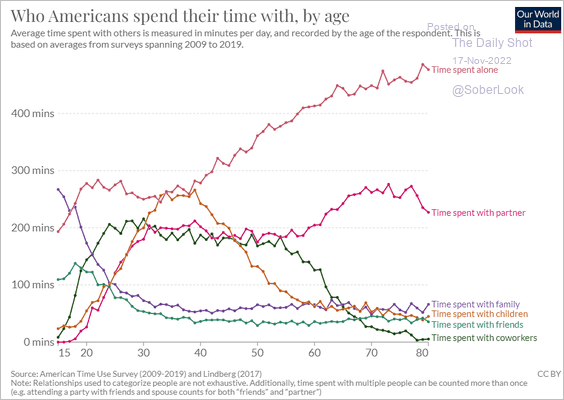 Source: Our World in Data
6. Antisemitic incidents:
 Source: Statista
7. Countries with the most golf courses:
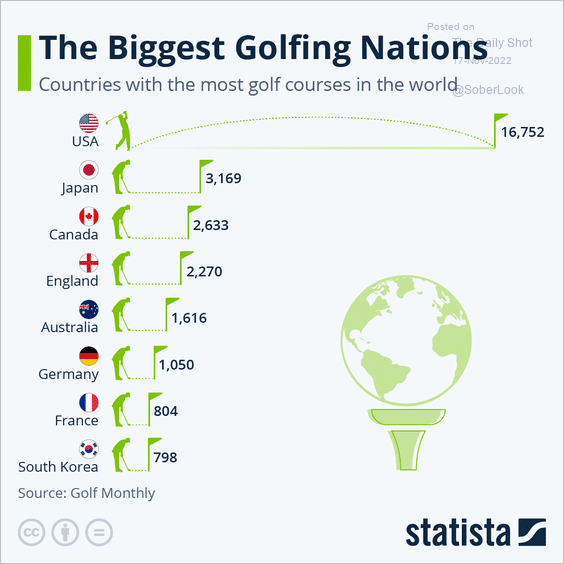 Source: Statista
——————–
Back to Index