
The Daily Shot: 21-Nov-22
• The United States
• Canada
• The United Kingdom
• The Eurozone
• Asia – Pacific
• China
• Emerging Markets
• Cryptocurrencies
• Commodities
• Energy
• Equities
• Credit
• Rates
• Global Developments
• Food for Thought
The United States
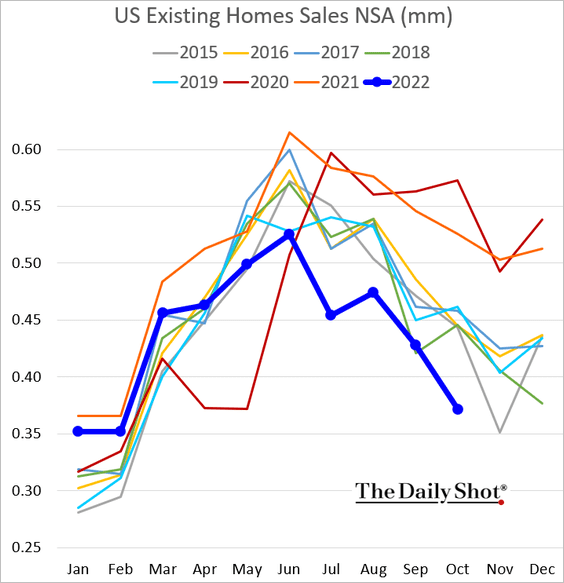
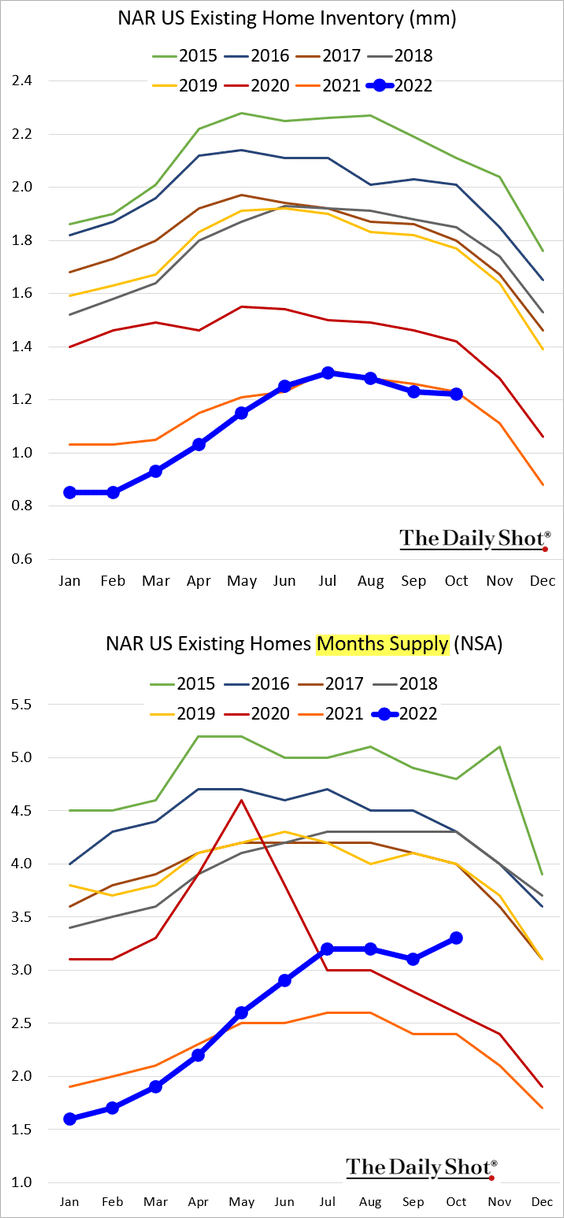
1. Let’s begin with the housing market.
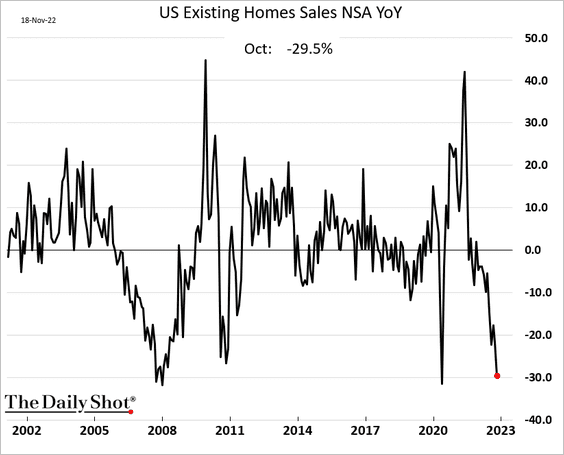
• Existing home sales were down almost 30% last month on a year-over-year basis.
– Here is the number of consecutive monthly declines.
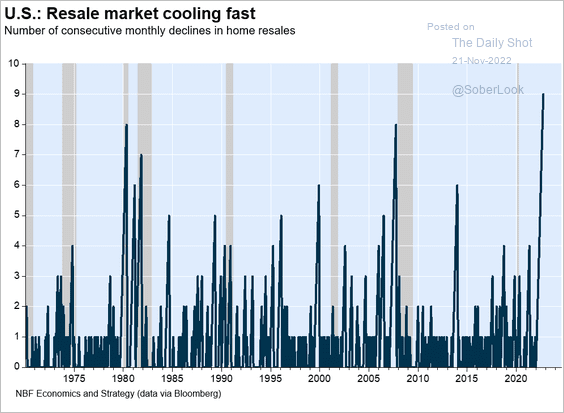 Source: Economics and Strategy Group, National Bank of Canada
– This chart shows the evolution of home sales across rate hiking cycles.
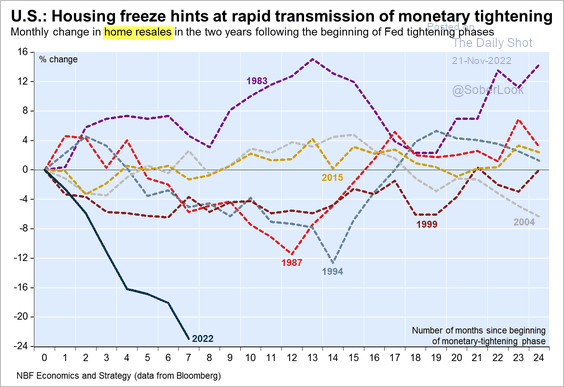 Source: Economics and Strategy Group, National Bank of Canada
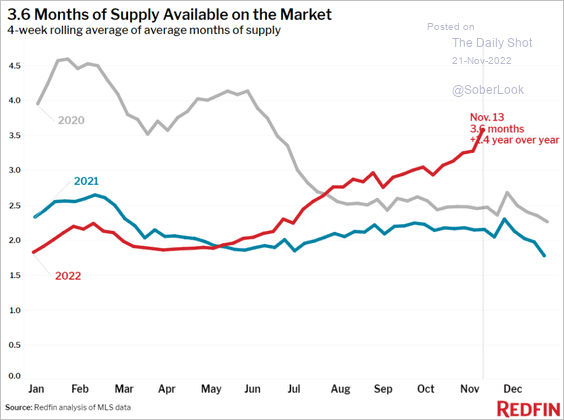
– Inventories are running at last year’s levels, but with slower sales, the months-of-supply indicator keeps climbing (2nd panel).
Here is a similar index from Redfin.
 Source: Redfin
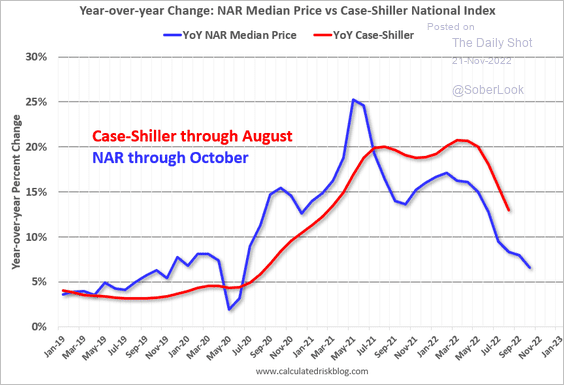
– The median price trend signals further weakness in home price appreciation.
 Source: Calculated Risk
——————–
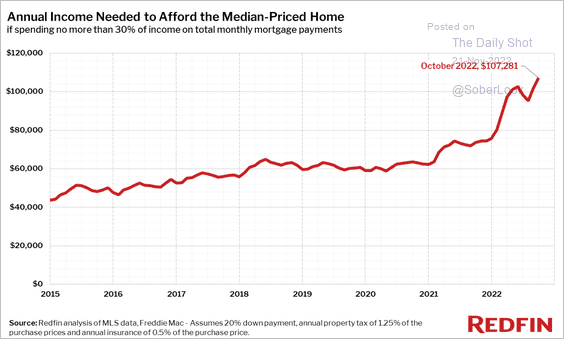
• This chart shows how much income is needed to afford the median-priced home.
 Source: Redfin
• More homeowners will be renting rather than selling their houses as homebuyer demand crashes.
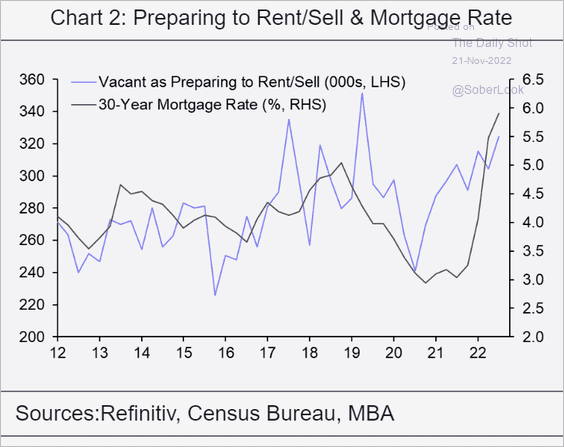 Source: Capital Economics
——————–
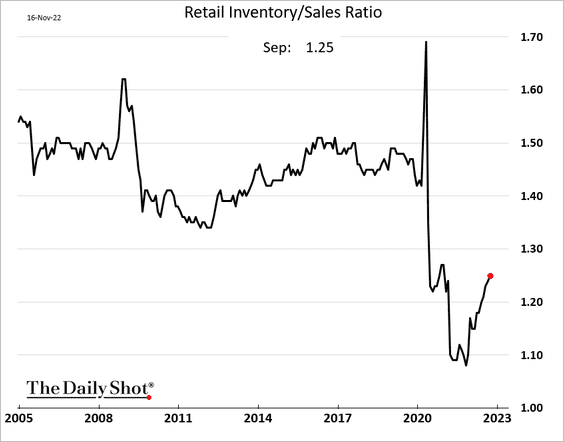
2. As of September, the retail inventories-to-sales ratio remained well below pre-COVID levels.
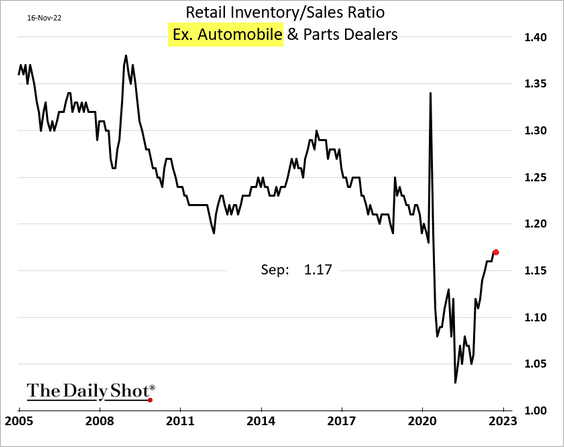
But the ratio has been nearing 2019 levels when vehicles are excluded.
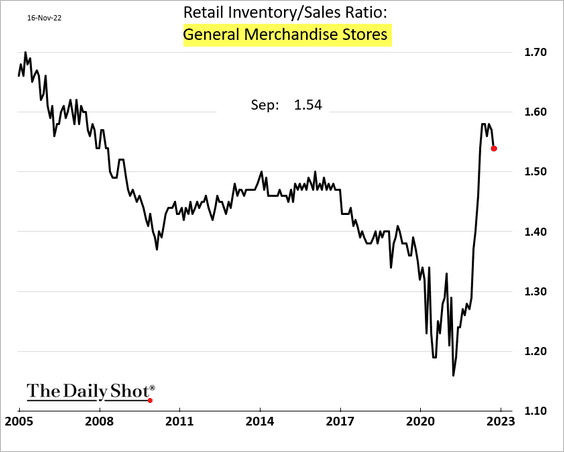
Here is the ratio for general merchandise stores.
——————–
3. “Real-time” indicators suggest that job openings continue to moderate, albeit slowly.
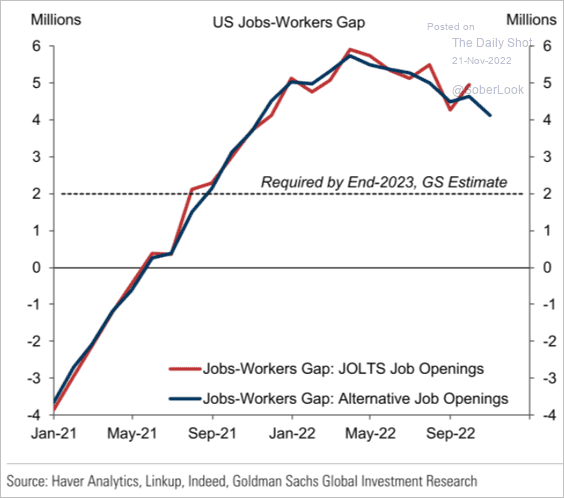 Source: Goldman Sachs
Layoff levels are not particularly high relative to initial unemployment claims.
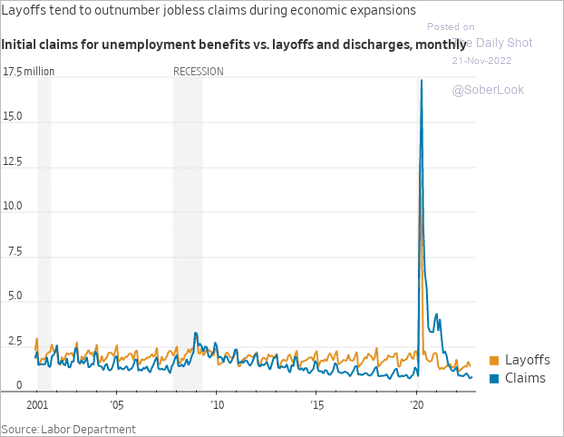 Source: @WSJ Read full article
——————–
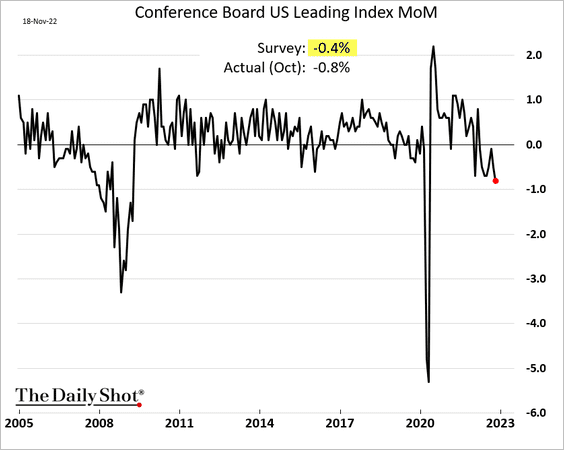
4. The Conference Board’s index of leading economic indicators has been down for eight months in a row.
The six-month rolling changes in the leading index are signaling a recession.
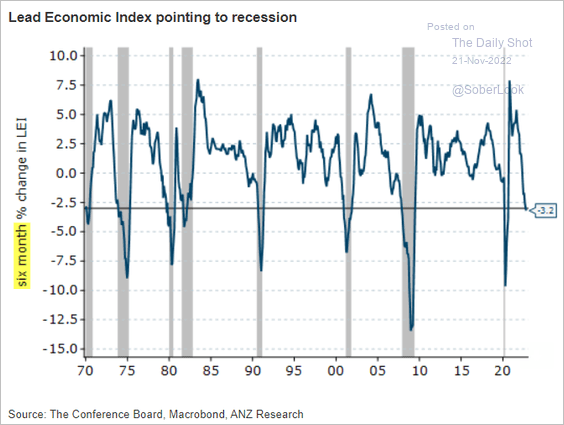 Source: @ANZ_Research
——————–
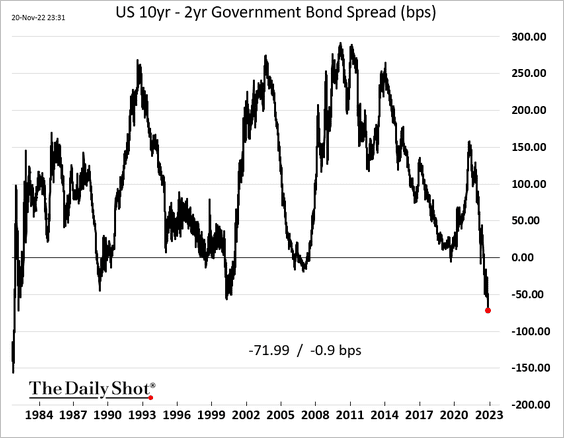
5. The Treasury curve inversion takes us back to 1981.
The RSM financial conditions index looks increasingly recessionary.
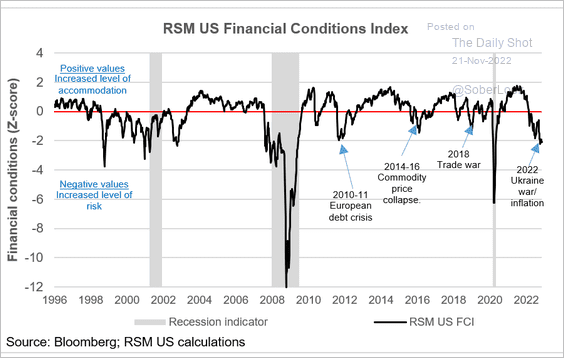 Source: RSM, @JoeBrusuelas
——————–
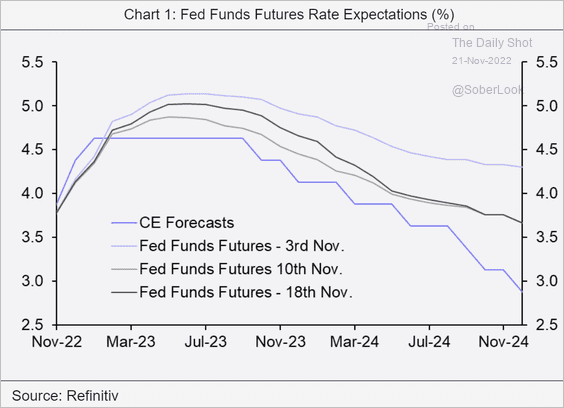
6. Goldman now sees rate hikes in February, March, and May, and no rate cuts in 2023.
 Source: Goldman Sachs
• ANZ also does not expect rate cuts next year.
 Source: @ANZ_Research
• But Capital Economics projects Fed rate cuts in the 2nd half of next year as the US enters a recession.
 Source: Capital Economics
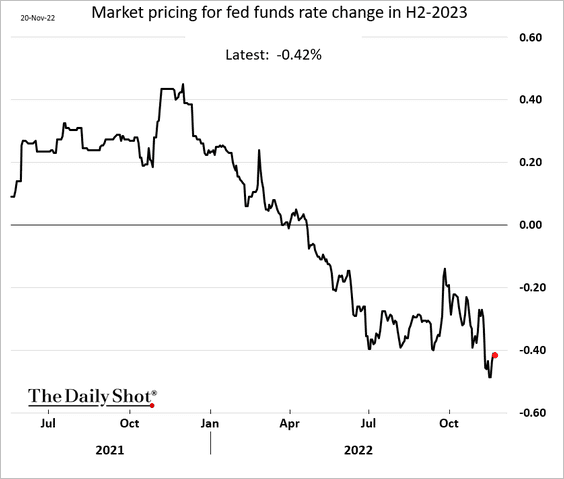
• The market is pricing in about 40 bps of rate hikes in the second half of 2023.
Back to Index
Canada
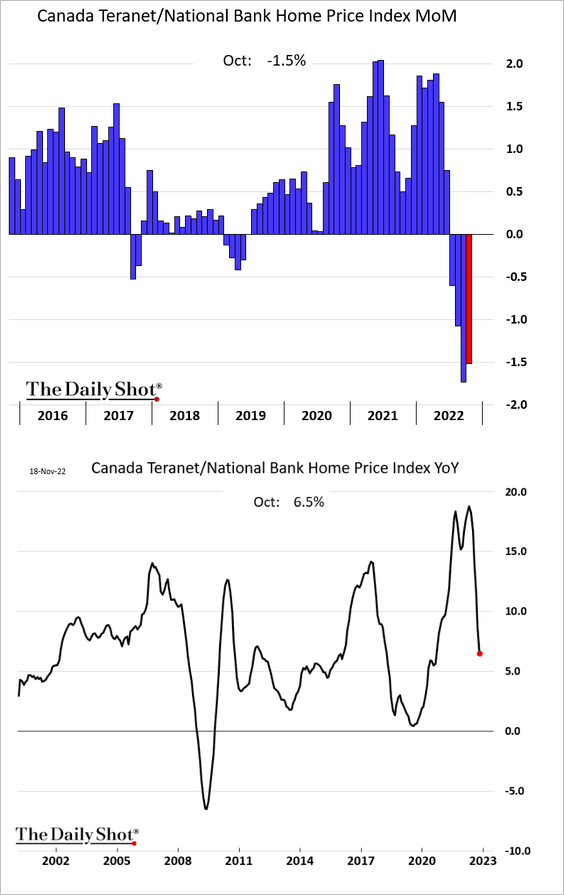
1. Home prices declined again last month.
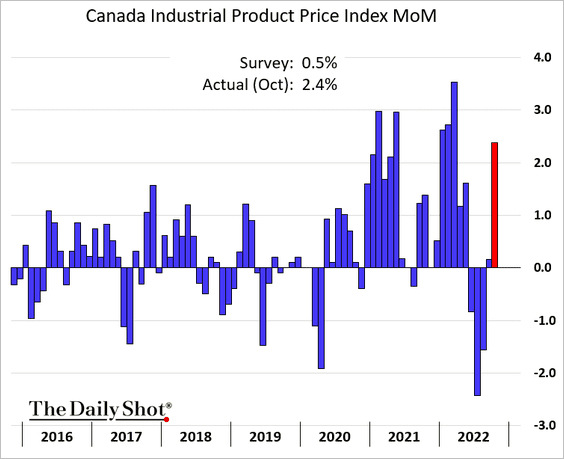
2. Industrial output prices increased sharply in October.
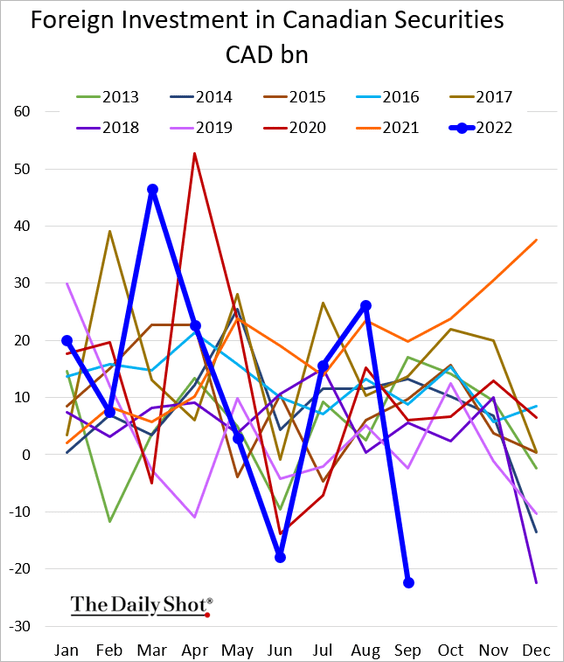
3. Foreigners pulled quite a bit of capital out of Canadian securities markets in September.
Back to Index
The United Kingdom
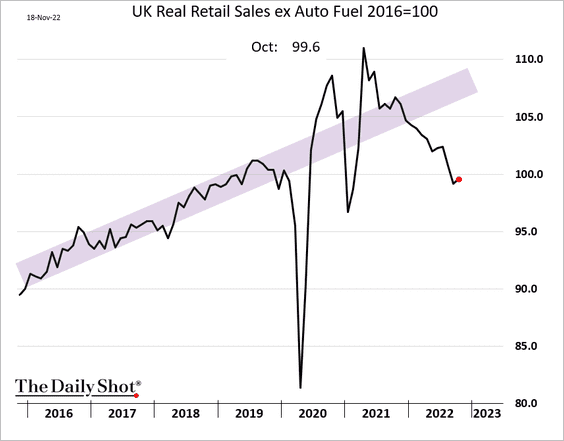
1. Retail sales ticked higher in October, but the trend doesn’t look promising.
2. The BoE has another 150 bps to go, according to Goldman.
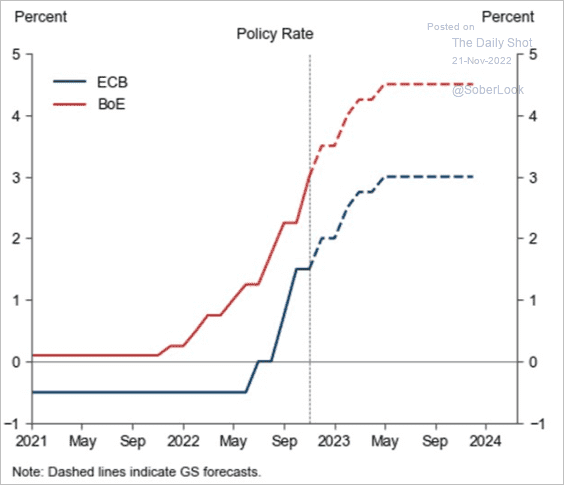 Source: Goldman Sachs
3. While the recovery trajectory is uncertain, forecasters agree on an economic downturn next year.
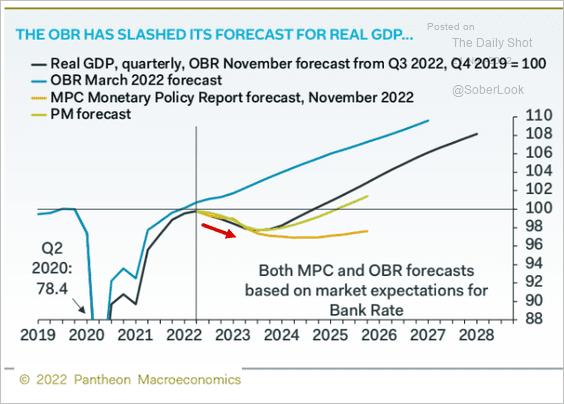 Source: Pantheon Macroeconomics
Back to Index
The Eurozone
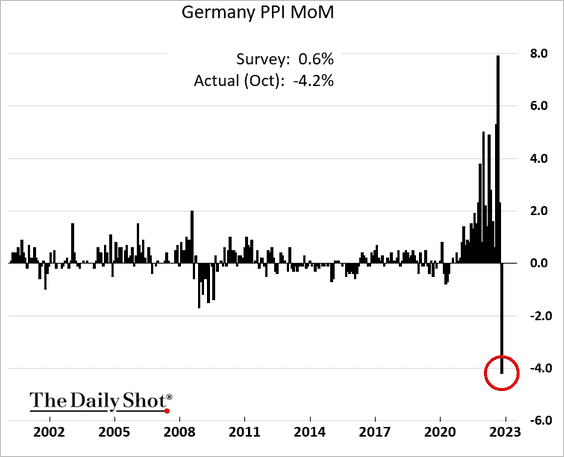
1. Let’s begin with Germany.
• The PPI tumbled last month, signaling a peak in Germany’s inflation.
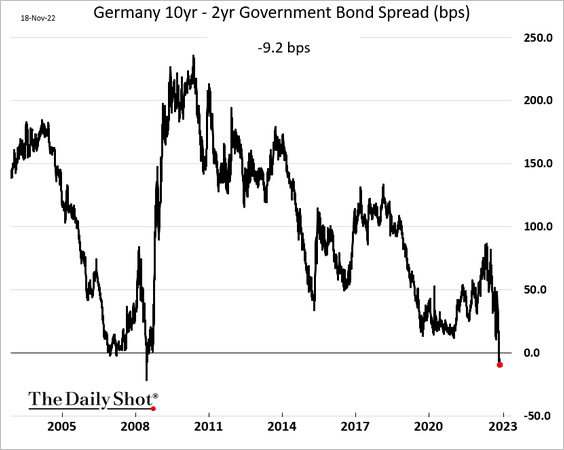
• Germany’s yield curve remains inverted.
• The auto sector output grew in September for the first time this year.
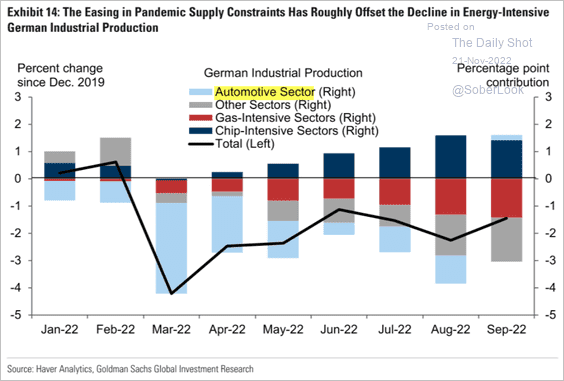 Source: Goldman Sachs
——————–
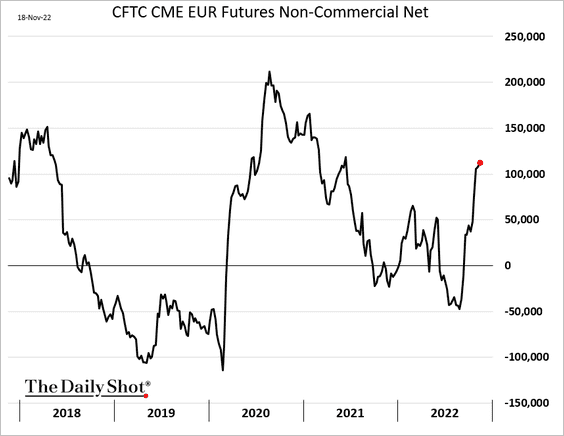
2. Speculative accounts continue to boost their bets on the euro.
3. Elevated energy prices make the euro area less competitive.
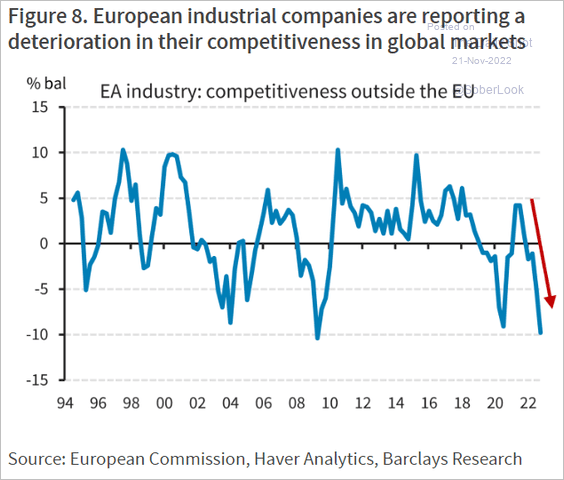 Source: Barclays Research
4. What are the drivers of lower housing demand?
 Source: @financialtimes Read full article
5. Commercial property markets are under pressure.
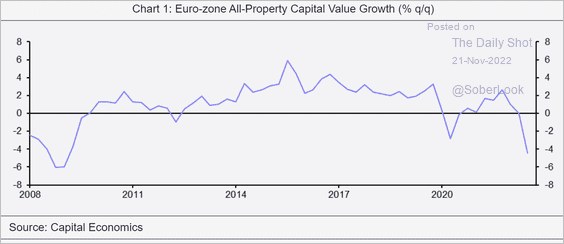 Source: Capital Economics
Back to Index
Asia – Pacific
1. Japan’s housing market has been oversupplied for decades.
 Source: @opinion Read full article
2. South Korea’s exports are well below last year’s levels but are not crashing.

Back to Index
China
1. COVID-related concerns persist, …
 Source: AP Read full article
… as new cases surge, …
 Source: Our World in Data
… and vaccinations grind to a halt.
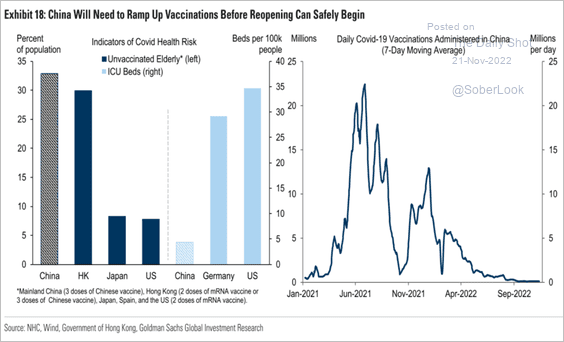 Source: Goldman Sachs
Mobility continues to deteriorate.
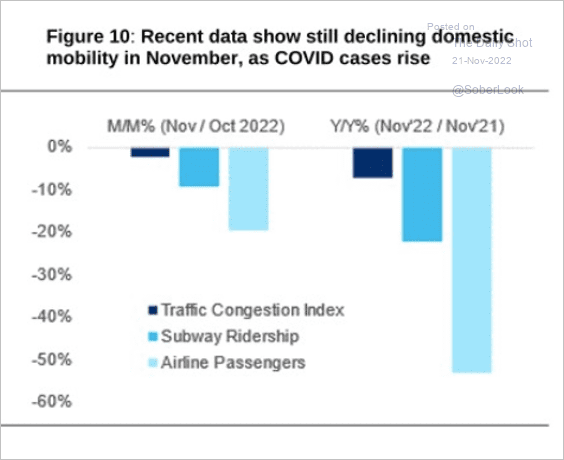 Source: Citi Private Bank
——————–
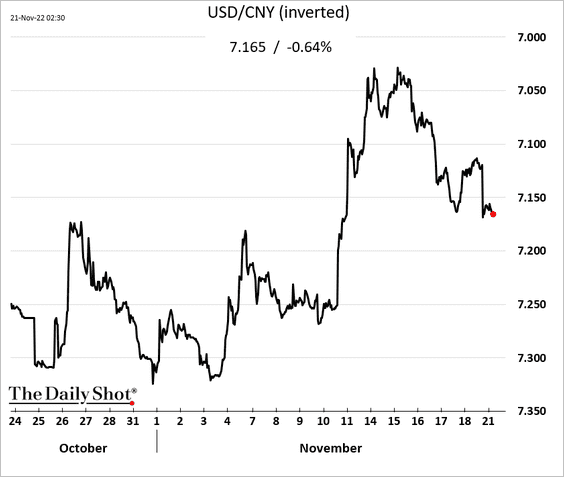
2. The renminbi is reversing recent gains.
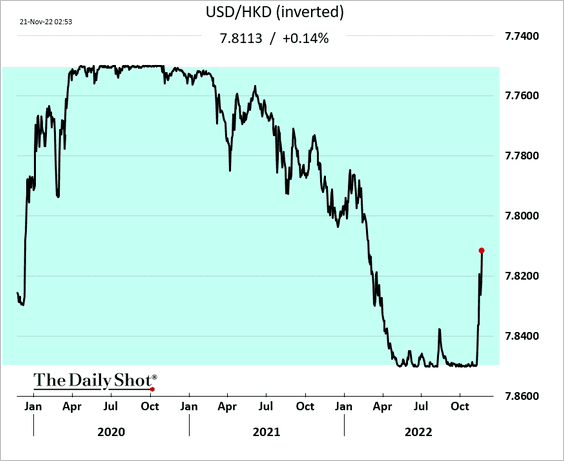
3. On the other hand, the Hong Kong dollar is rebounding as foreign capital flows back in.
4. Despite the recent bounce, China’s stocks still lag the broad EM index.
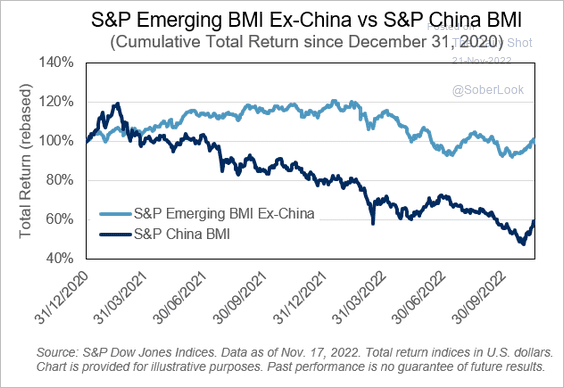 Source: S&P Dow Jones Indices
5. Consumption has been a drag on economic growth over the past two months.
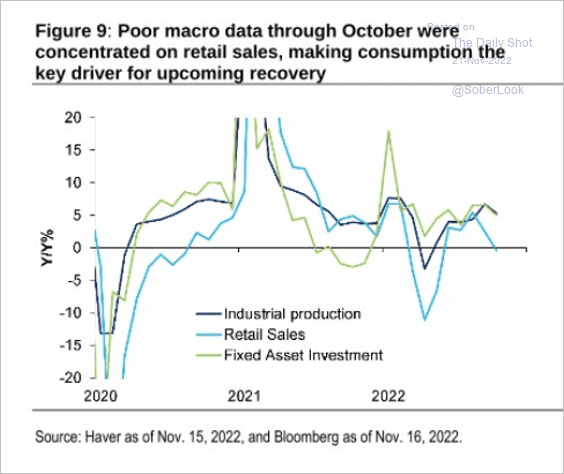 Source: Citi Private Bank
Back to Index
Emerging Markets
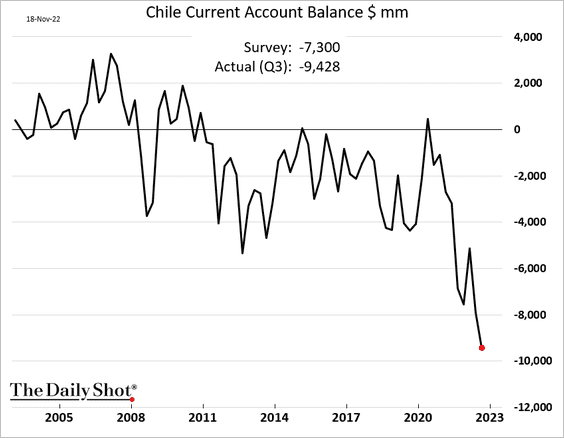
1. Chile’s GDP declined last quarter.
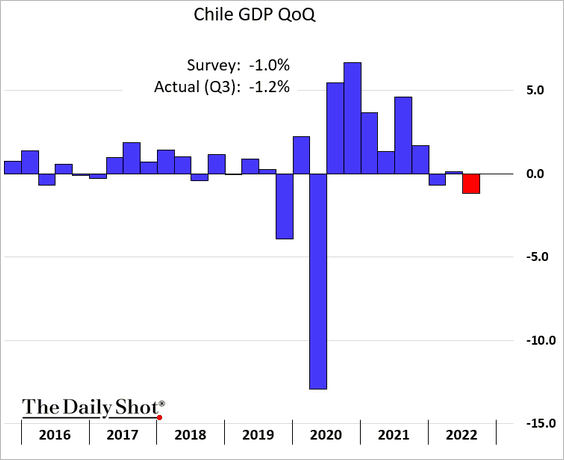
Economists expect a recession next year.
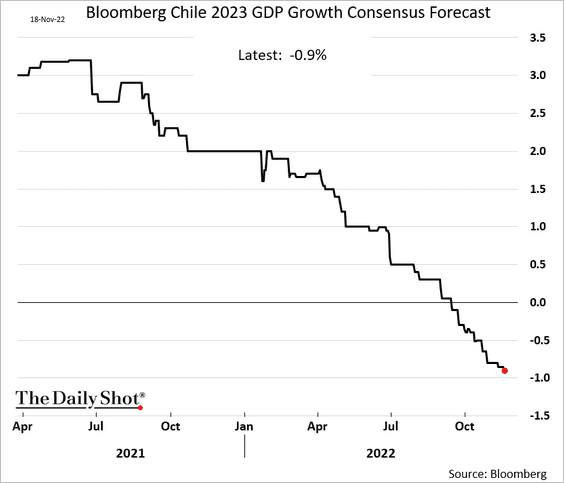
The current account deficit hit a new record.
——————–
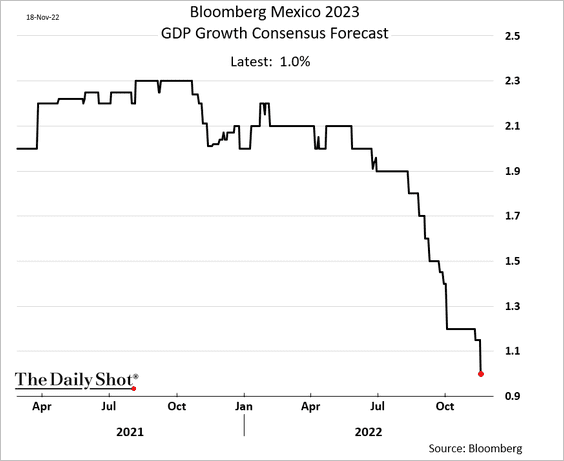
2. Mexico’s 2023 growth forecasts continue to move lower.
3. A lost decade for Brazil …
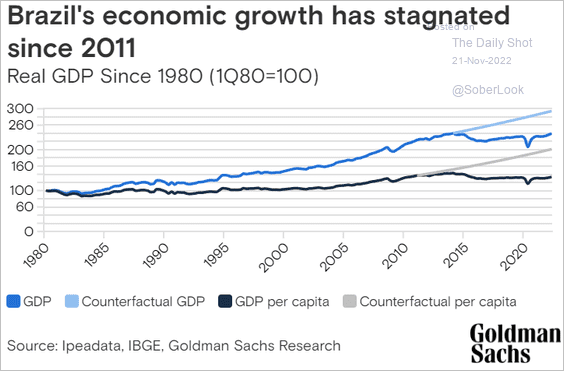 Source: Goldman Sachs
4. Credit growth in India increased this year, …
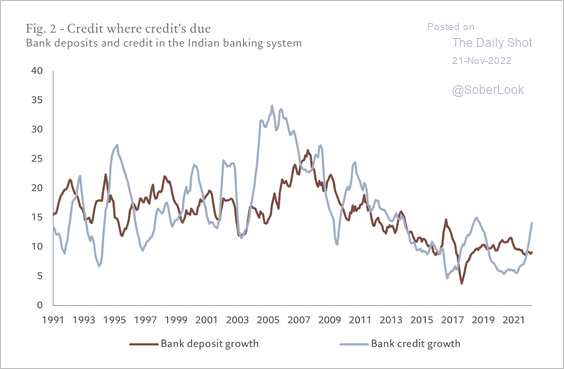 Source: Pictet Wealth Management Read full article
… which points to stronger CapEx growth ahead.
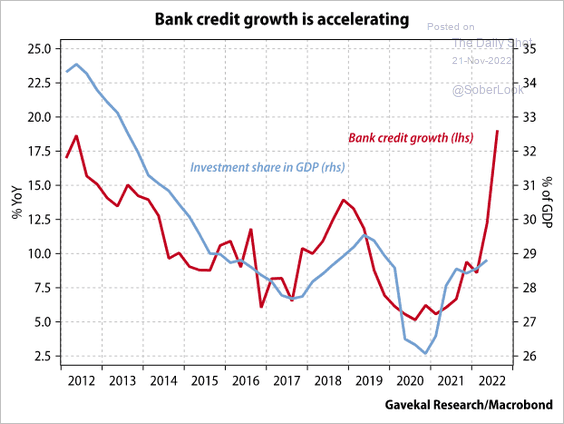 Source: Gavekal Research
——————–
5. Many EM firms took advantage of historically low rates to extend debt maturities. As a result, there is not much in the near-term financing wall, especially in high-yield, according to Pictet.
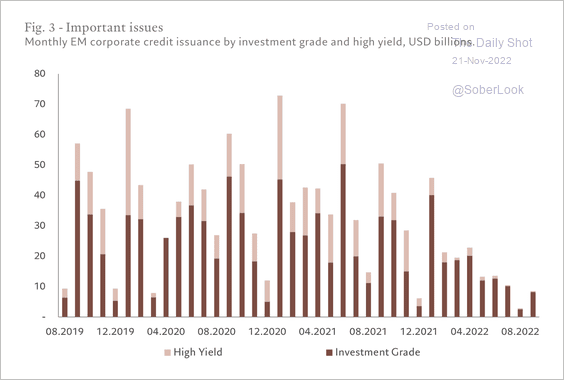 Source: Pictet Wealth Management Read full article
6. The maps below show Africa’s election cycle, public debt, policy rates, and economic growth.
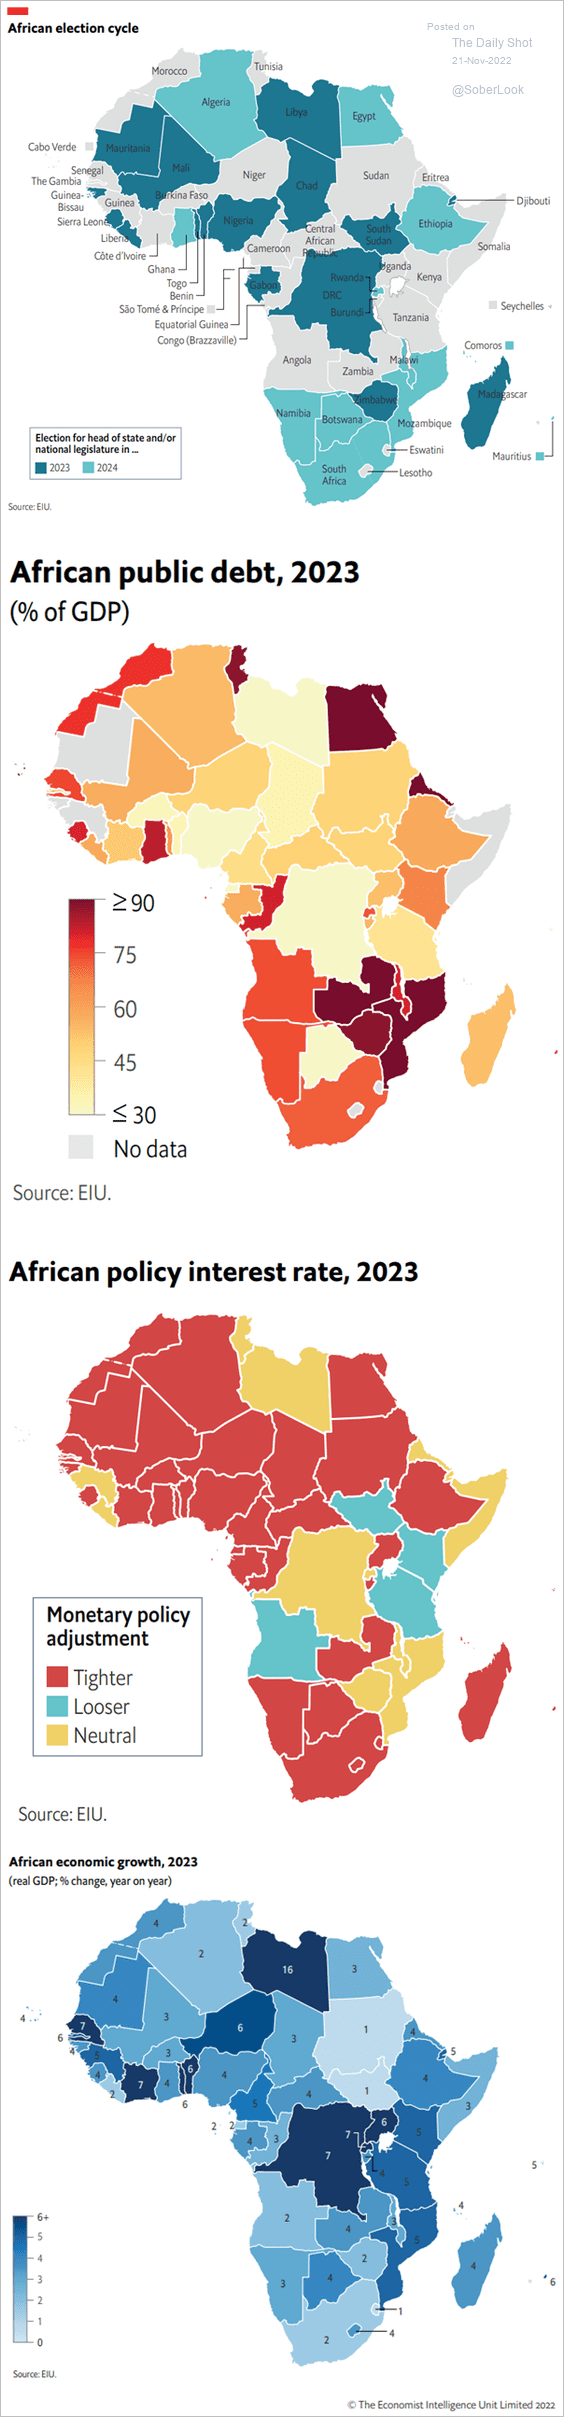 Source: The Economist Intelligence Unit
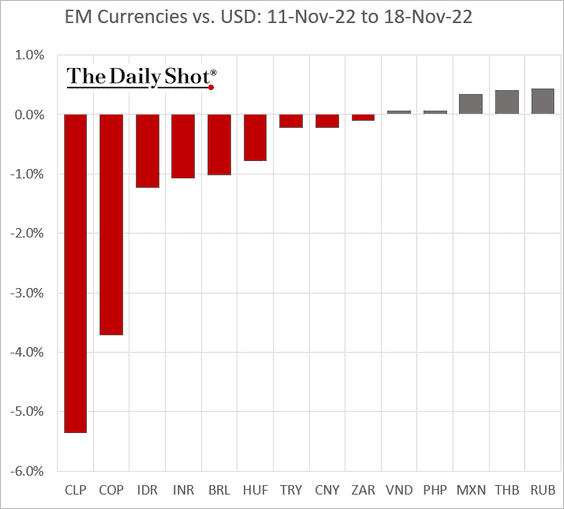
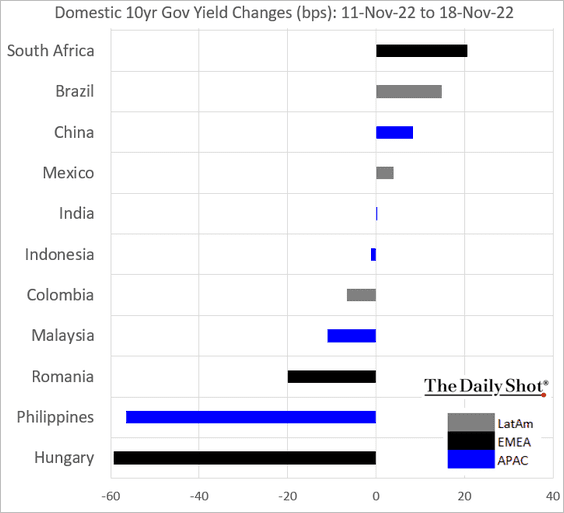
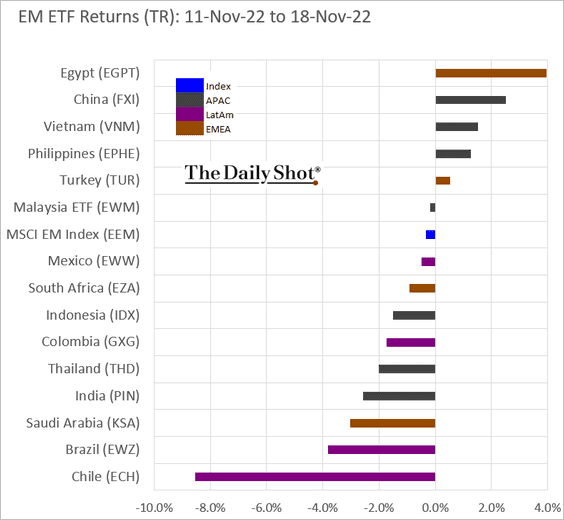
7. Next, we have some performance metrics from last week.
• Currencies:
• Bond yields:
• Equity ETFs:
Back to Index
Cryptocurrencies
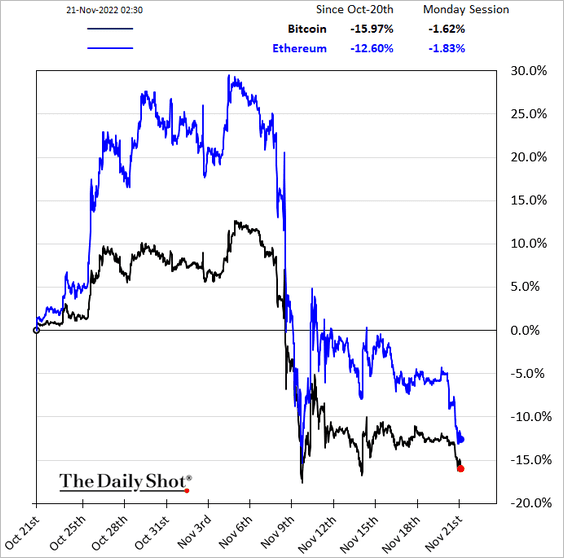
1. Bitcoin is back below 16k, …
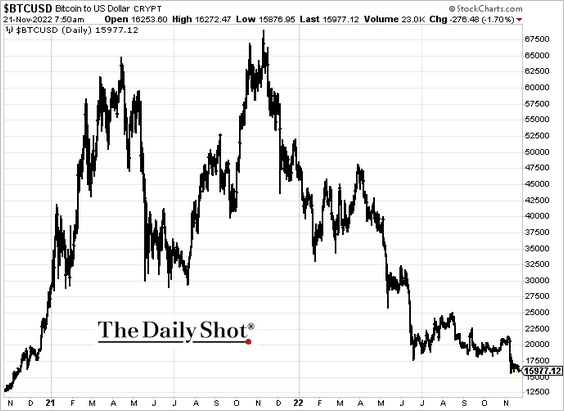
… as cryptos come under pressure again.
 Source: @business, @SKJagtiani Read full article
——————–
2. The BTC “hash price” (market value per unit of computing power) plunged to an all-time low, down 76% from its peak. The bitcoin mining industry is under pressure.
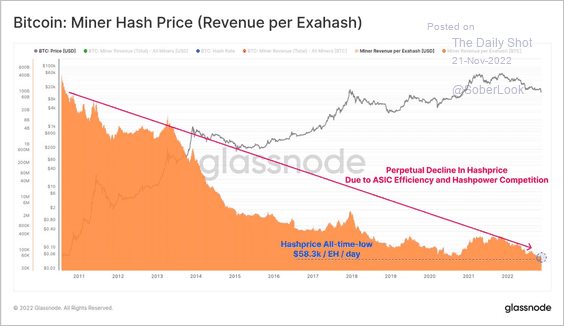 Source: @glassnode
3. Bitcoin’s implied volatility is starting to decline.
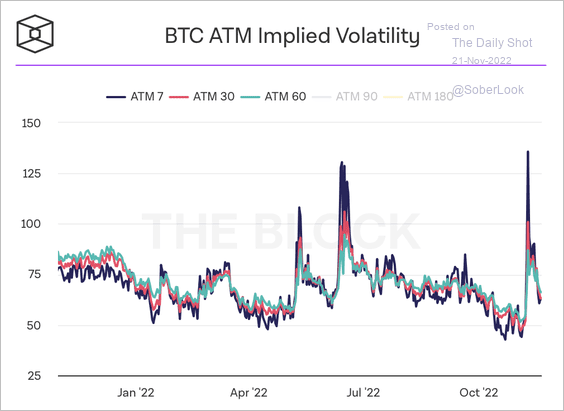 Source: The Block
4. Bitcoin and Ether’s put/call ratio has stabilized after the latest sell-off. (2 charts)
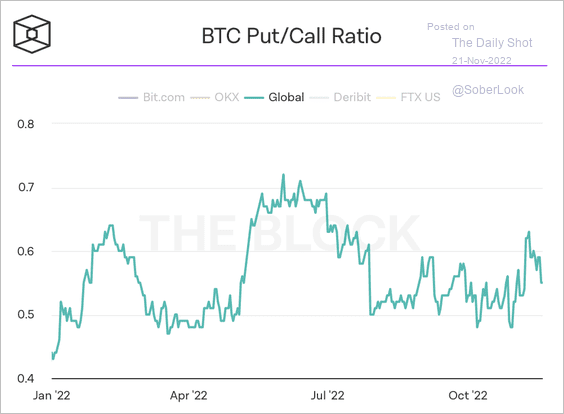 Source: The Block
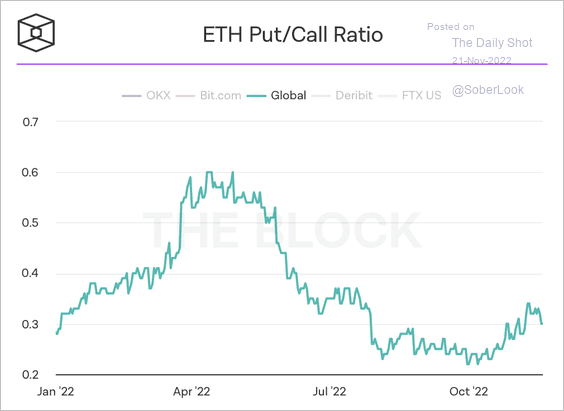 Source: The Block
——————–
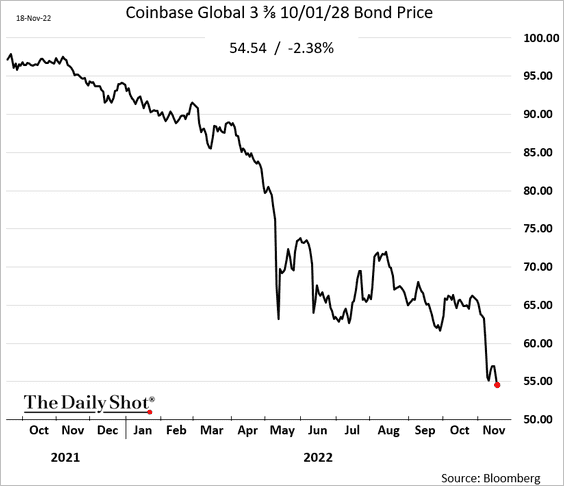
5. Coinbase debt price is nearing 50 cents on the dollar.
Back to Index
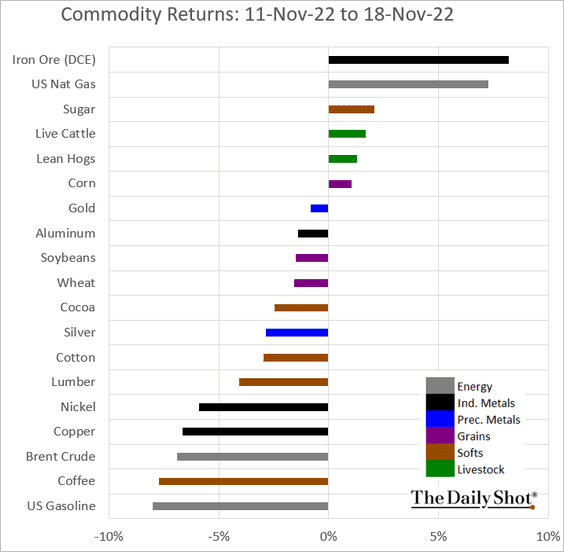
Commodities
Here is last week’s performance across key markets.
Back to Index
Energy
1. Brent crude is back below $90/bbl.
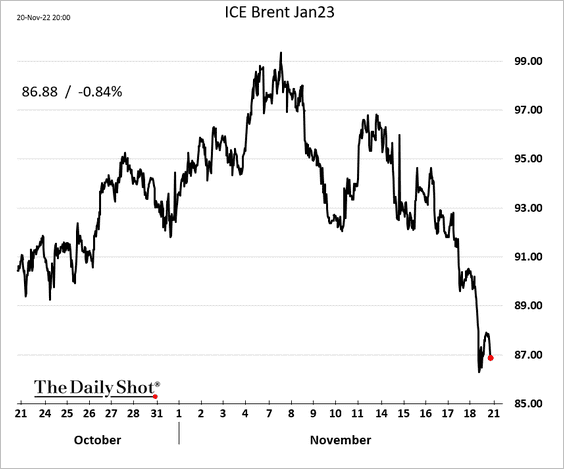
 Source: Reuters Read full article
Backwardation is shrinking.
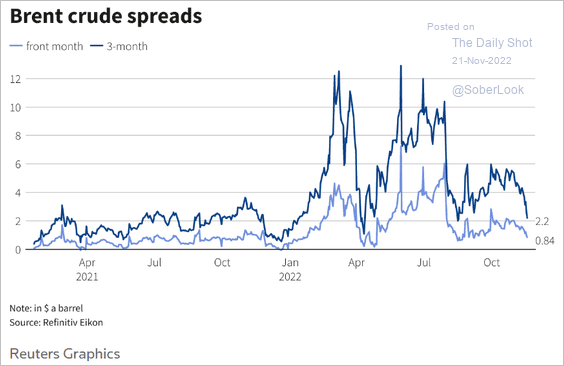 Source: Reuters Read full article
 Source: Reuters Read full article
——————–
2. Will oil markets swing back into deficit in the second half of next year?
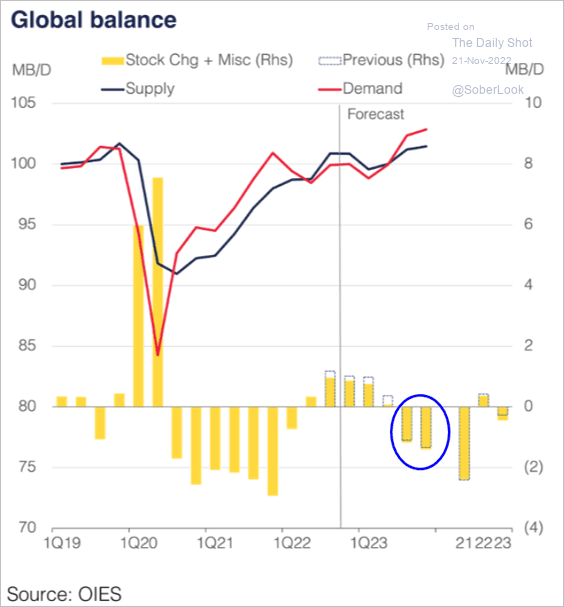 Source: Oxford Institute for Energy Studies
3. This chart shows the Russian gas supply to Europe.
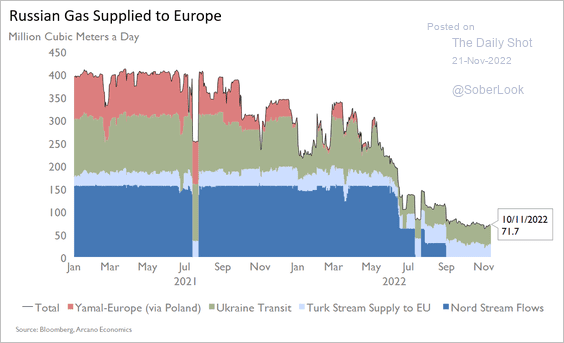 Source: Arcano Economics
4. US diesel-gasoline spreads keep widening due to distillates shortages.
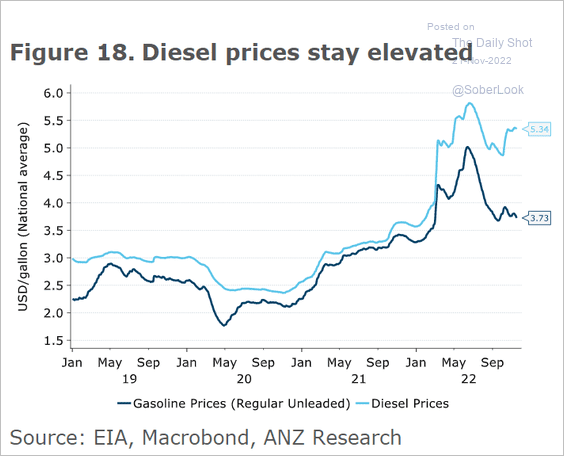 Source: @ANZ_Research
Back to Index
Equities
1. CEO sentiment points to deeper reductions in earnings.
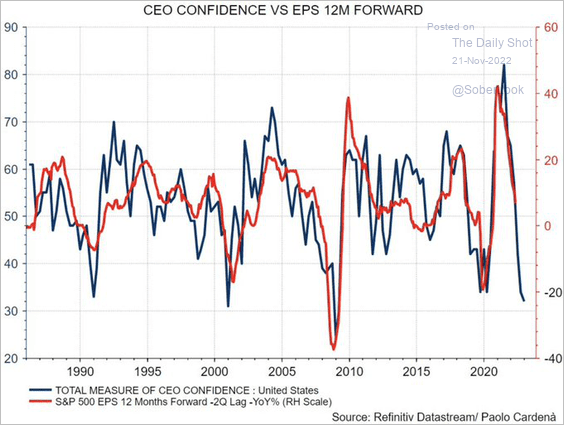 Source: @paolocardena
2. This chart shows long-term earnings growth in the S&P 500 (log scale).
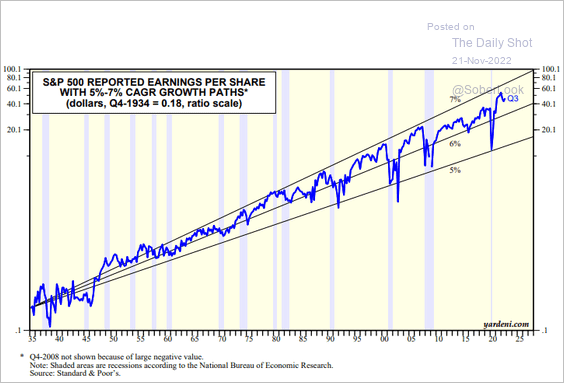 Source: Yardeni Research
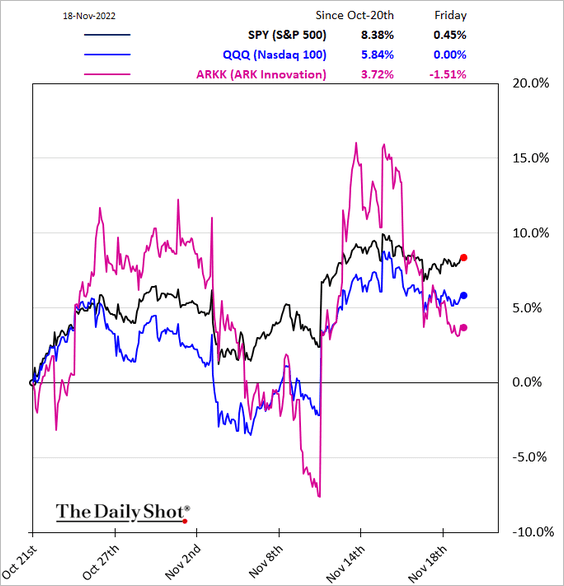
3. How long before the next record high for Nasdaq?
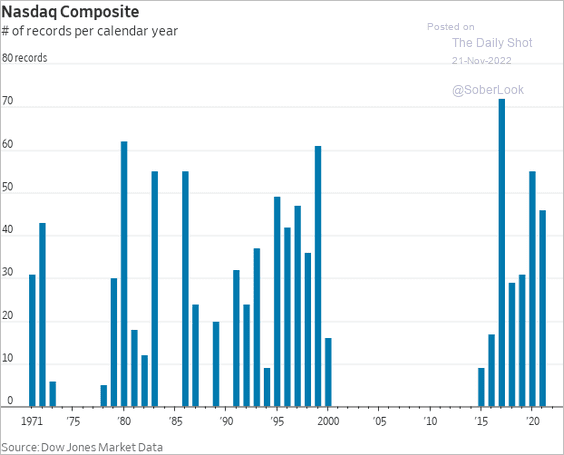 Source: @WSJ Read full article
4. Larger companies tend to have higher operating margins.
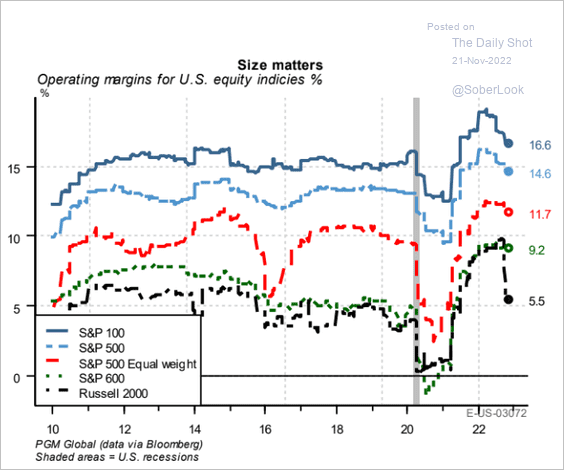 Source: PGM Global
5. This chart shows SPAC M&A activity over time.
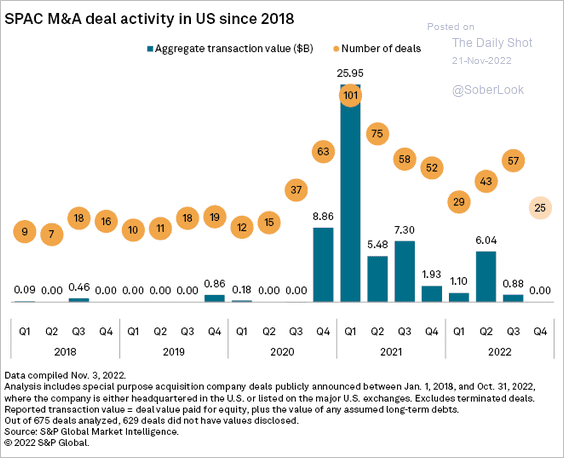 Source: S&P Global Market Intelligence
6. Options volume hit a new record this month.
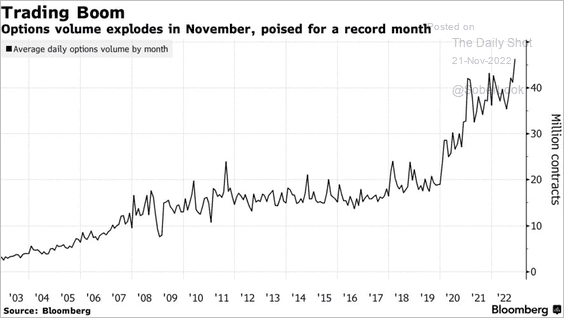 Source: @markets, @luwangnyc Read full article
But the net bullish opened options volume remains depressed.
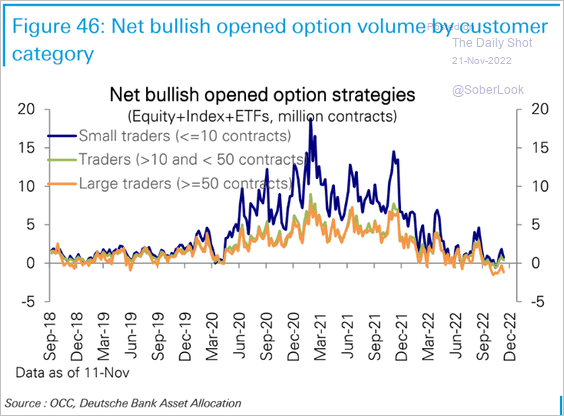 Source: Deutsche Bank Research
——————–
7. Semiconductor shares have been outperforming.
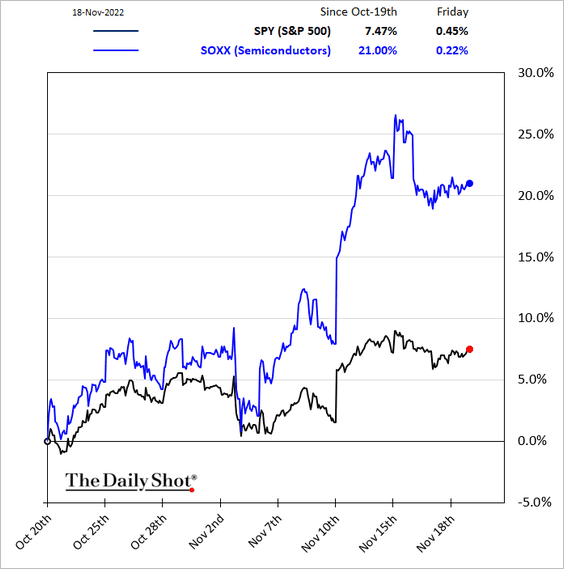
 Source: @technology, @jwittenstein Read full article
——————–
8. The utilities sector is holding support relative to the S&P 500, although upside has weakened over the past few months.
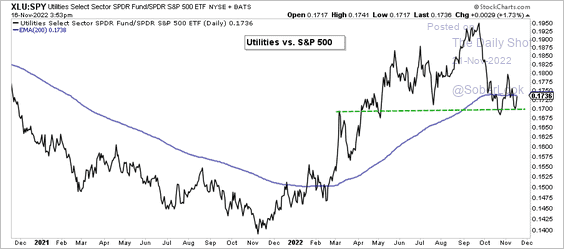 Source: Aazan Habib, Paradigm Capital
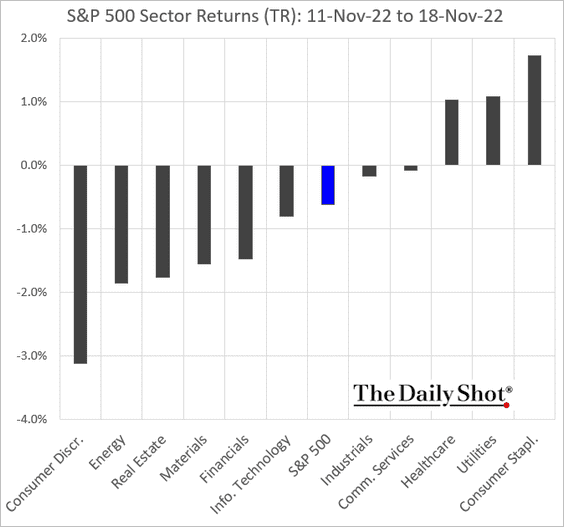
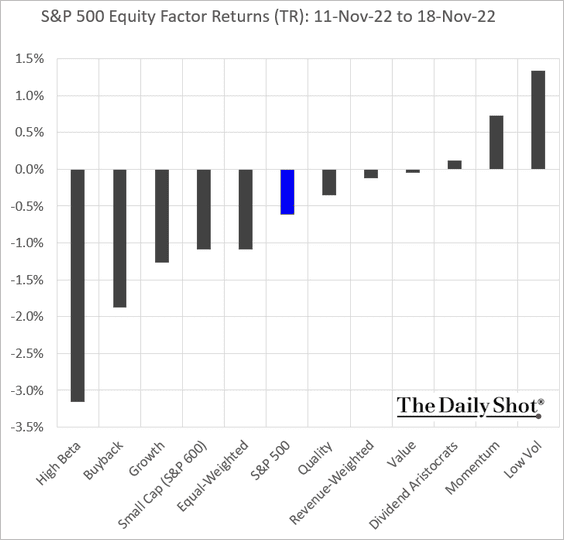
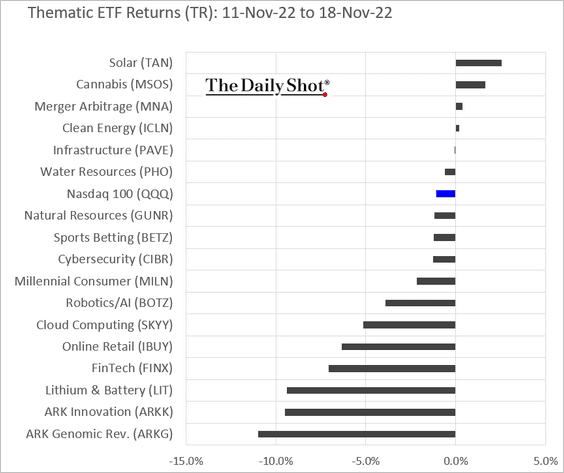
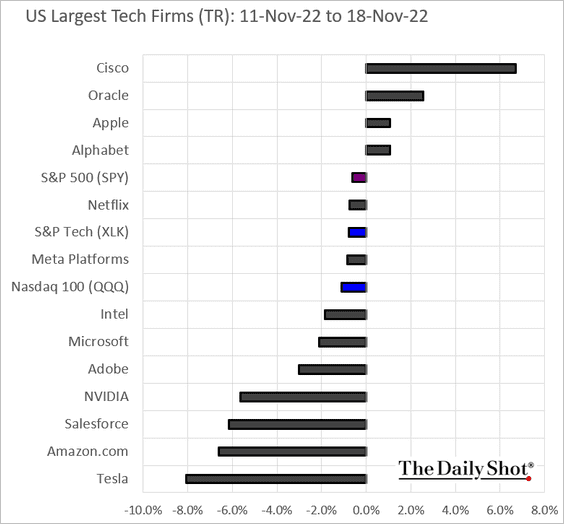
9. Next we have some performance data from last week.
• Sectors:
• Factors:
• Thematic ETFs:
• Largest tech firms:
Back to Index
Credit
1. Credit Managers’ Index (based on commercial transactions) signals slowing credit growth.
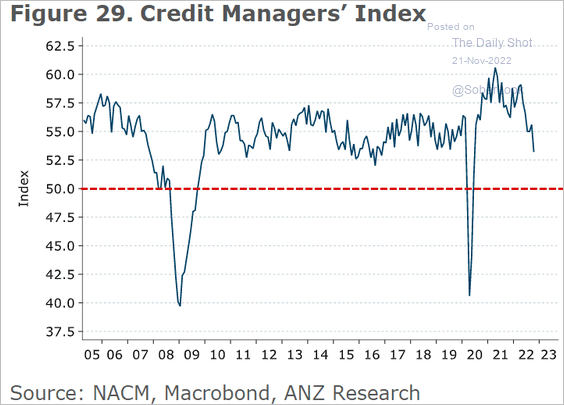 Source: @ANZ_Research
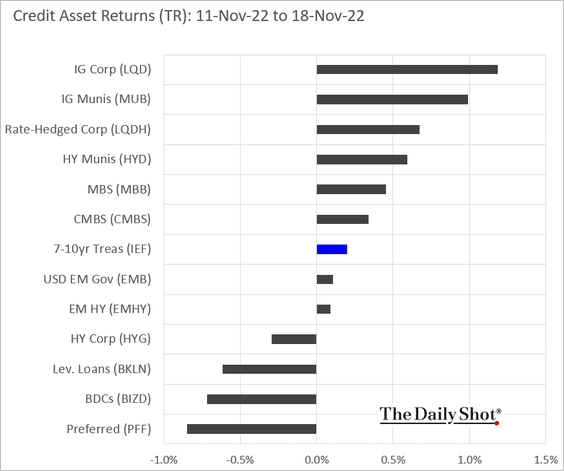
2. Here is last week’s performance by asset class.
Back to Index
Rates
1. Banks now have substantial unrealized losses on their bond holdings.
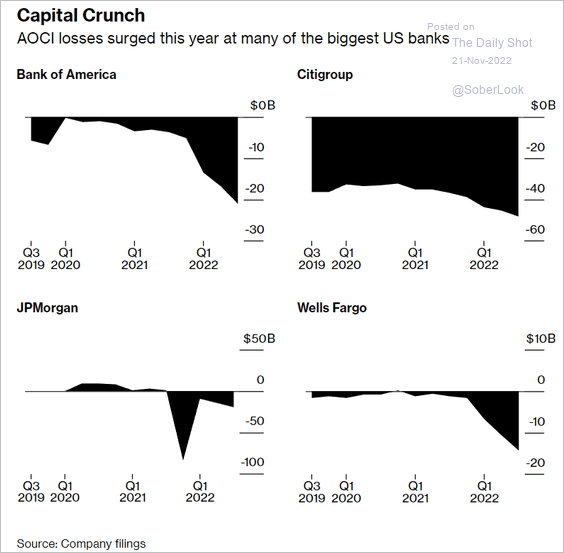 Source: @wealth, @jennysurane, @hannahlevitt Read full article
2. The Fed’s balance sheet is now down roughly $340 billion from the peak …
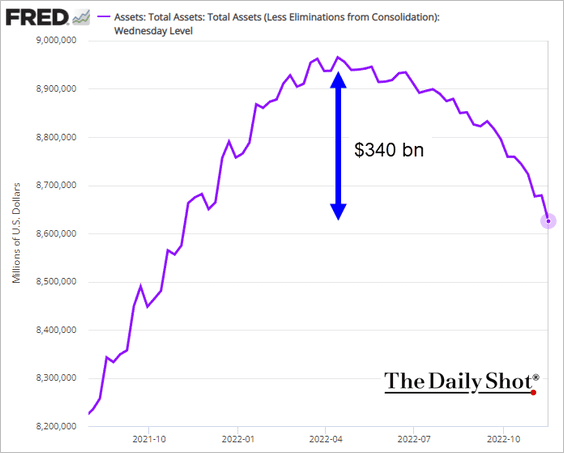
… driven mostly by the reduction in Treasury holdings.

Back to Index
Global Developments
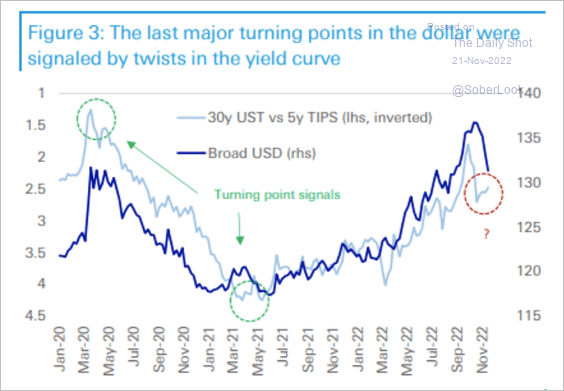
1. The dollar tends to do well when the Treasury yield curve is flattening. (2 charts)
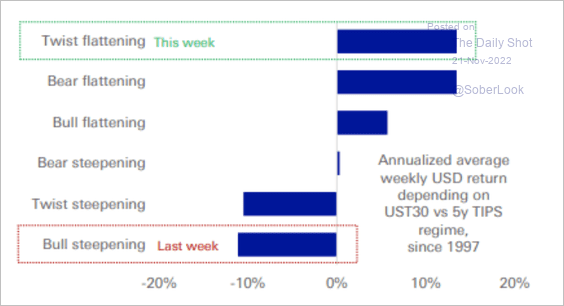 Source: Deutsche Bank Research
 Source: Deutsche Bank Research
Tight liquidity is also a tailwind for the dollar.
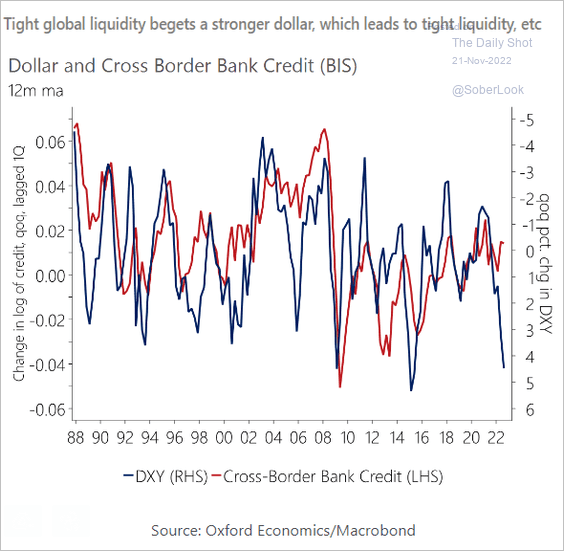 Source: Oxford Economics
——————–
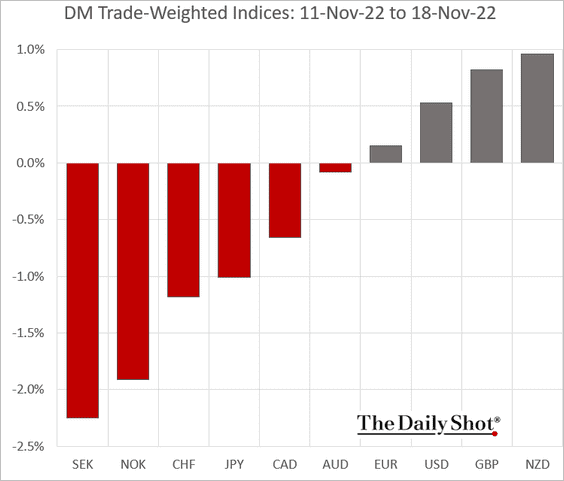
2. Next, we have some performance data from last week.
• Trade-weighted currency indices:
• Bond yields:

——————–
Food for Thought
1. Heart disease deaths among US males aged 18-39:
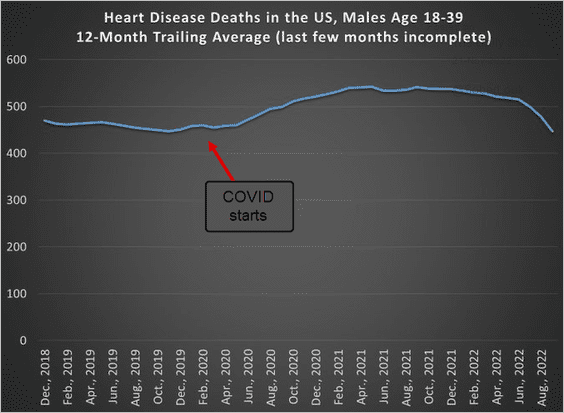 Source: @jmhorp
2. Global mental health survey:
 Source: Ipsos Read full article
3. US Latino population growth:
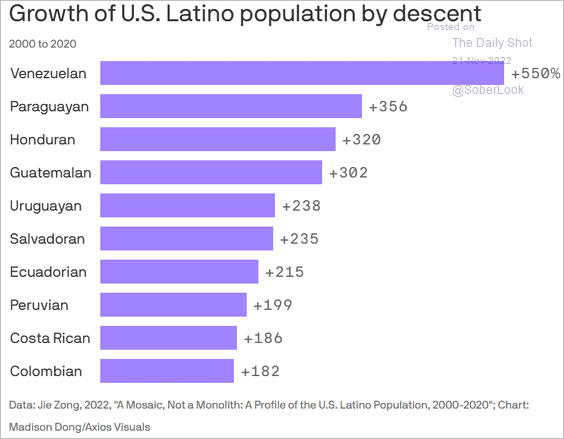 Source: @axios Read full article
4. Emissions trajectories:
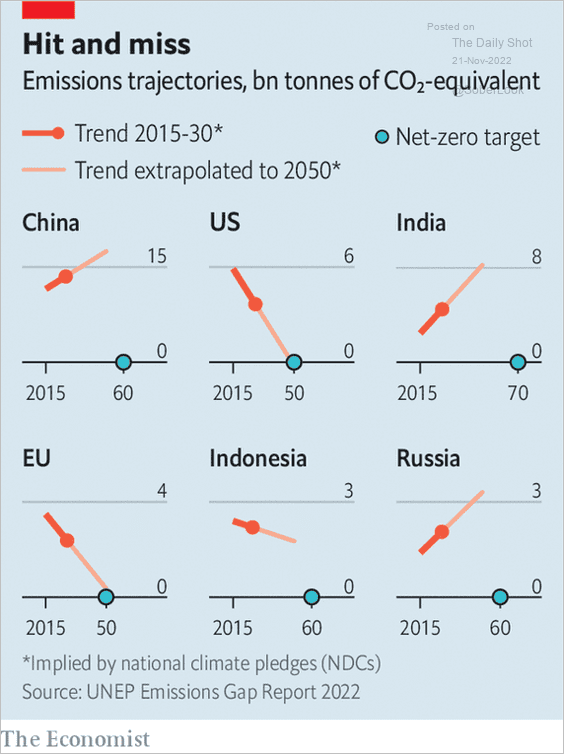 Source: The Economist Read full article
5. Credit card rates in the US:
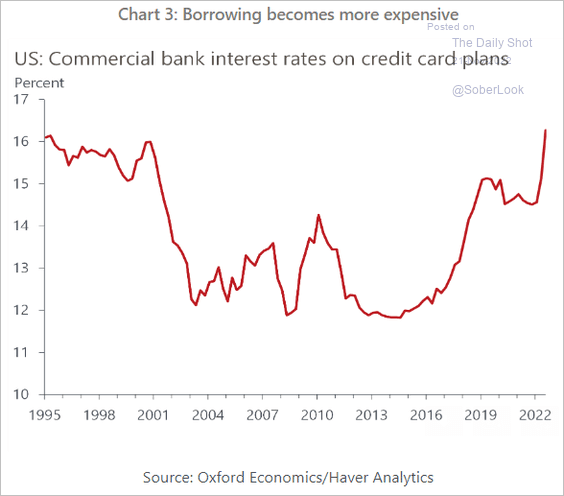 Source: Oxford Economics
6. Gasoline prices globally:
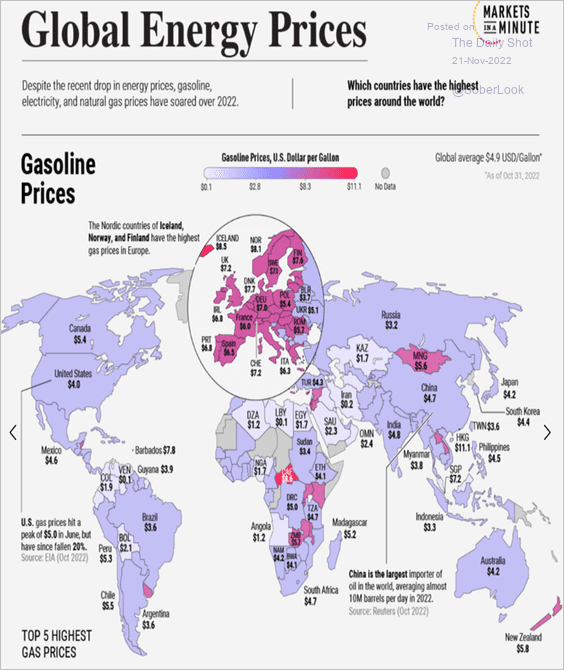 Source: Visual Capitalist Read full article
7. Past World Cup winners:
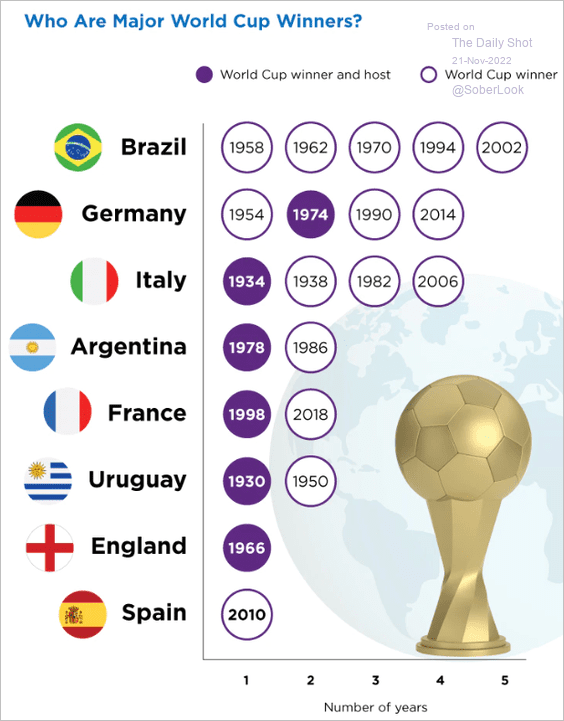 Source: The Census Bureau Read full article
——————–
Back to Index