
The Daily Shot: 28-Nov-22
• China
• Asia – Pacific
• Japan
• The Eurozone
• Europe
• The United Kingdom
• Canada
• The United States
• Emerging Markets
• Commodities
• Energy
• Equities
• Credit
• Rates
• Global Developments
• Food for Thought
China
1. New COVID cases reached record levels in recent days.
 Source: Reuters Read full article
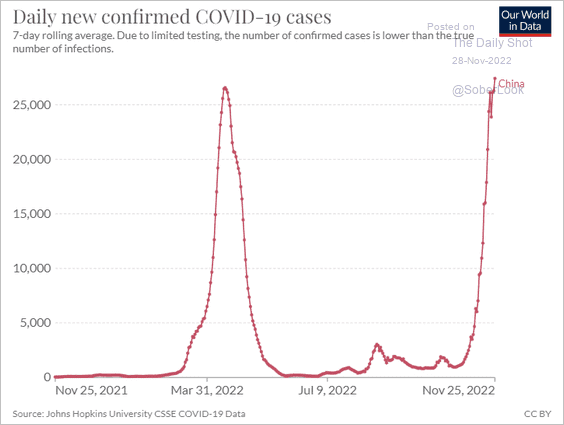 Source: Our World in Data
And this time around, China’s population appears to be rejecting Beijing’s strict lockdown policies.
 Source: @WSJ Read full article
• Cities facing COVID restrictions represent almost 60% of China’s GDP, setting the stage for risk-off sentiment globally.
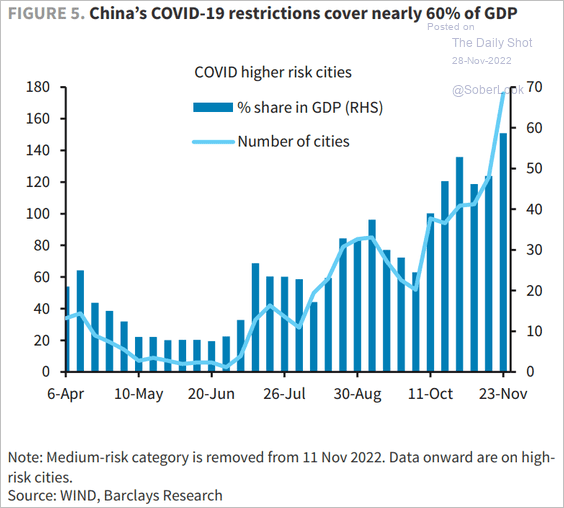 Source: Barclays Research
• Mobility has deteriorated.
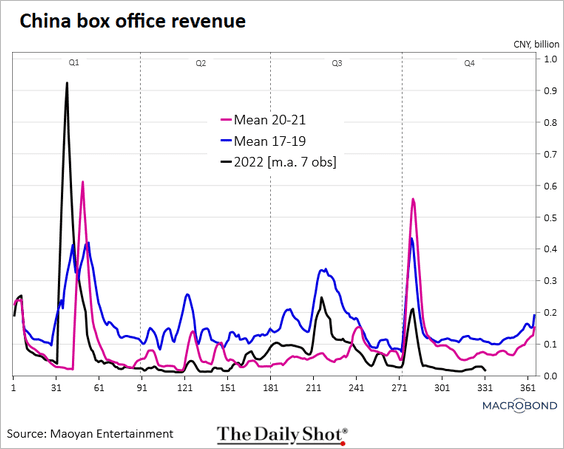 Source: Chart and data provided by Macrobond
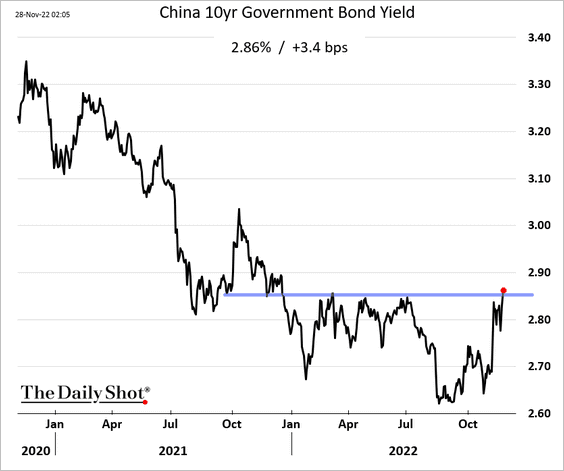
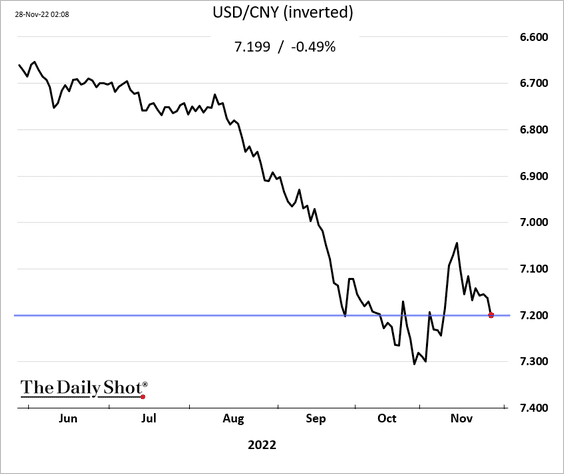
• China’s stocks and bonds are lower.
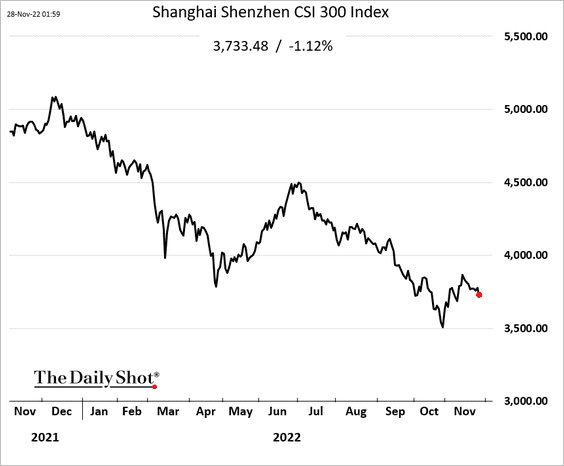
The renminbi’s rebound has faded.
——————–
2. Faced with lockdowns and property market rout, China’s central bank eased policy again.
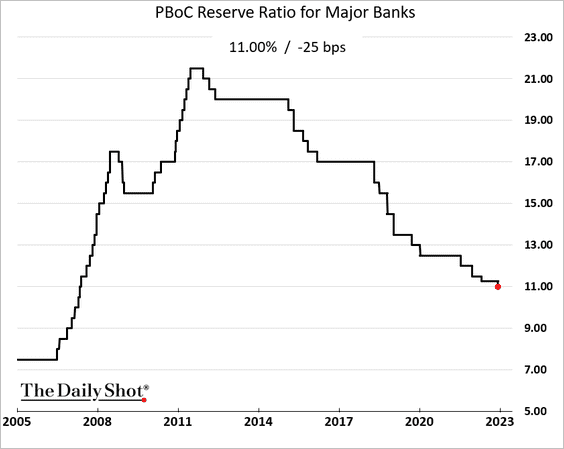
 Source: South China Morning Post Read full article
——————–
3. The nation continues to face capital outflows.
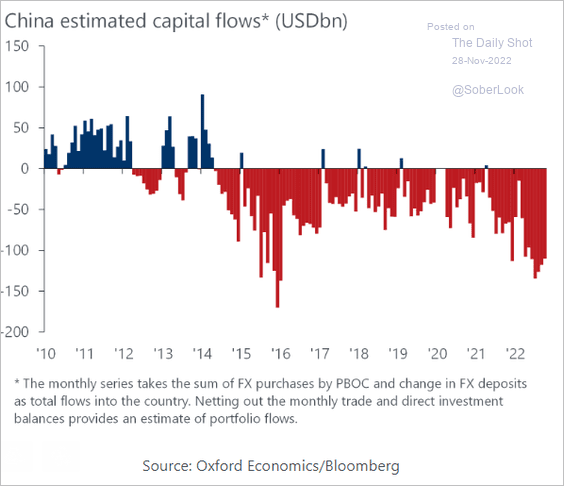 Source: Oxford Economics
4. China relies heavily on chip imports.
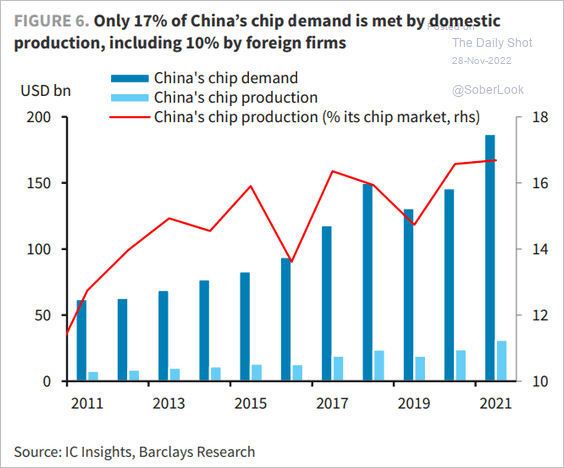 Source: Barclays Research
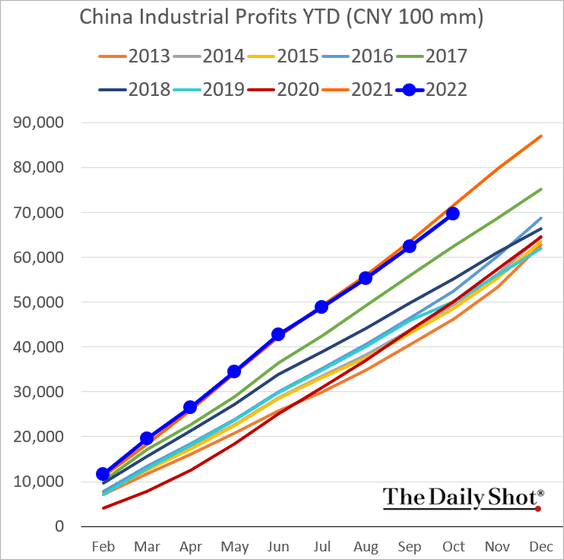
5. Industrial profits are now running below last year’s levels.
Back to Index
Asia – Pacific
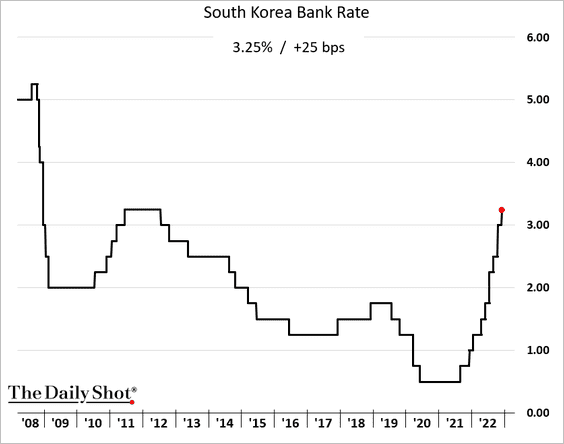
1. South Korea’s central bank hiked rates again.
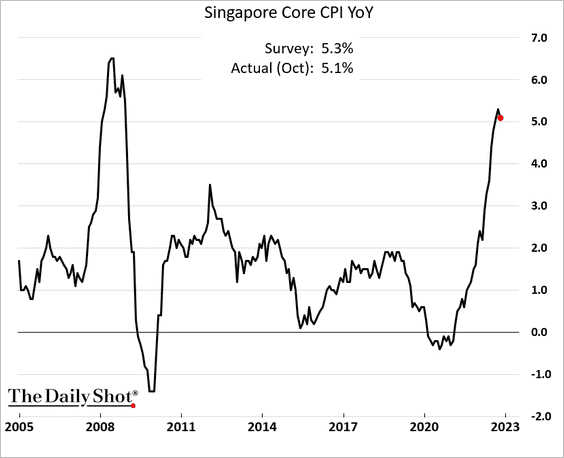
2. Singapore’s industrial production remains robust.
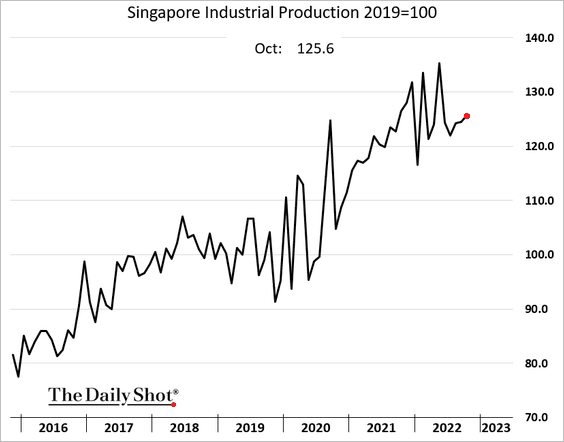
Inflation appears to be peaking.
——————–
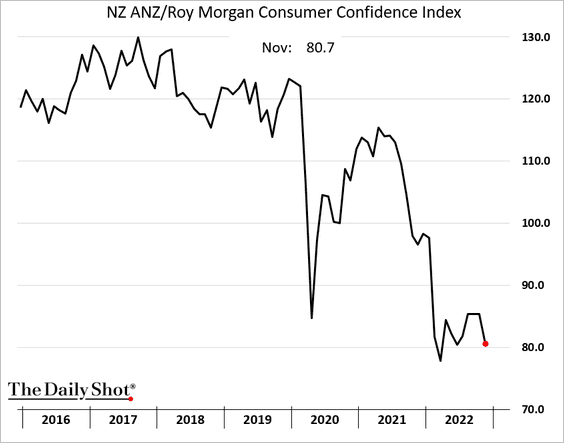
3. New Zealand’s consumer confidence is back near the lows.
Back to Index
Japan
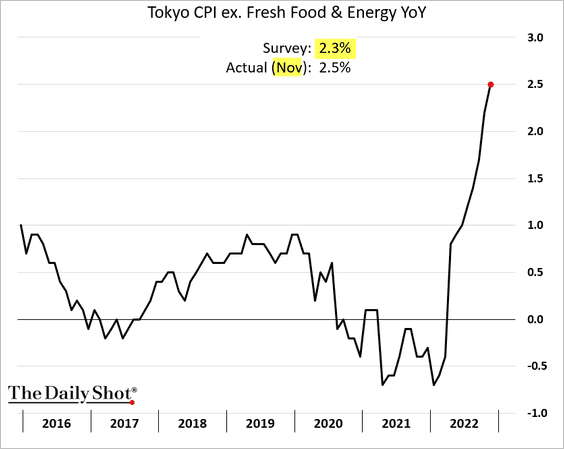
1. Inflation continues to surprise to the upside.
 Source: Reuters Read full article
——————–
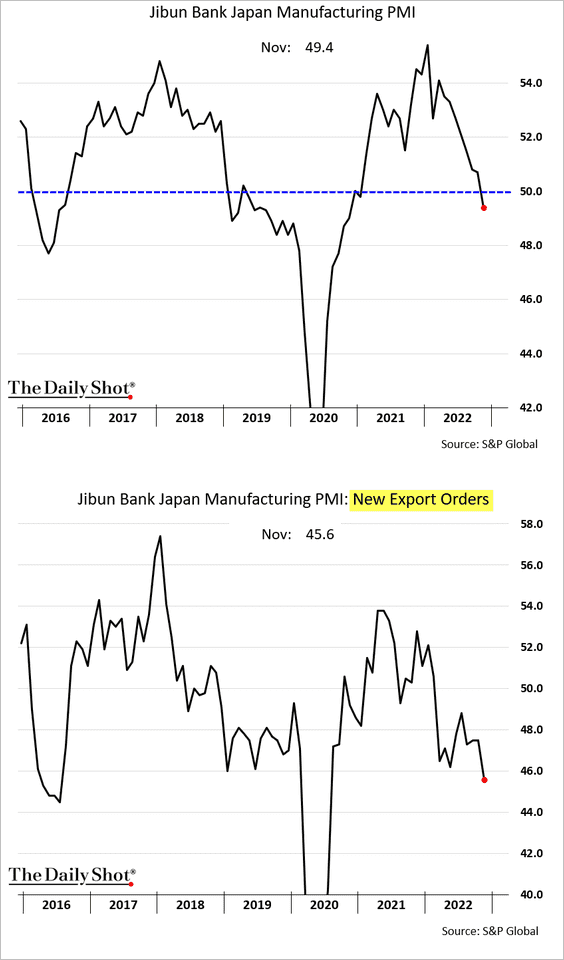
2. Manufacturing activity contracted this month.
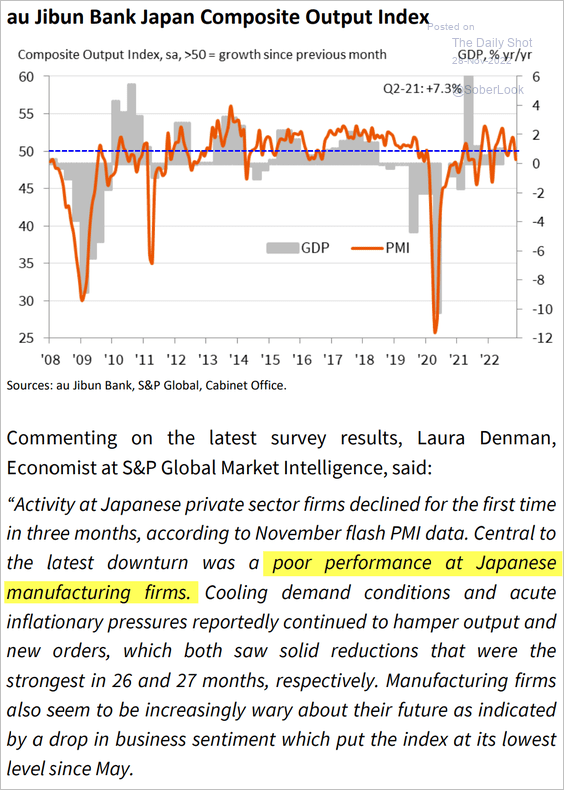 Source: S&P Global PMI
And the ratio of new orders to inventories (PMI indices) points to further weakness ahead.
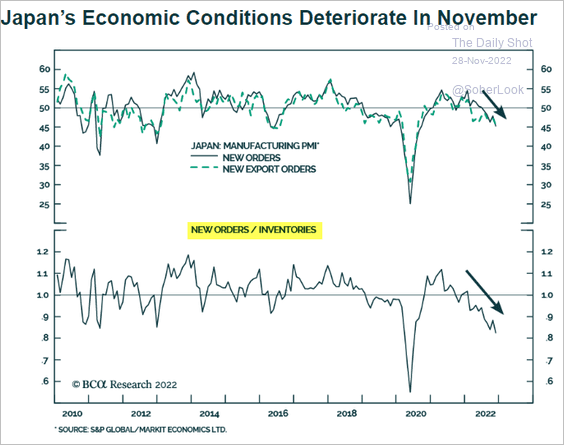 Source: BCA Research
——————–
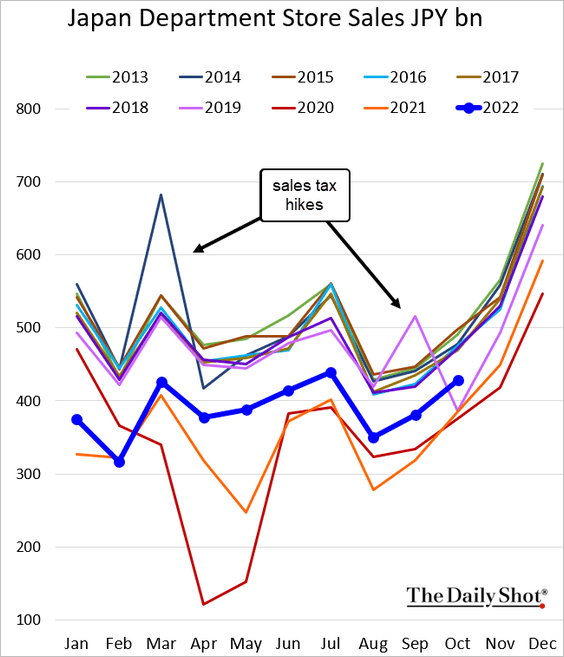
3. Department store sales are holding above last year’s levels.
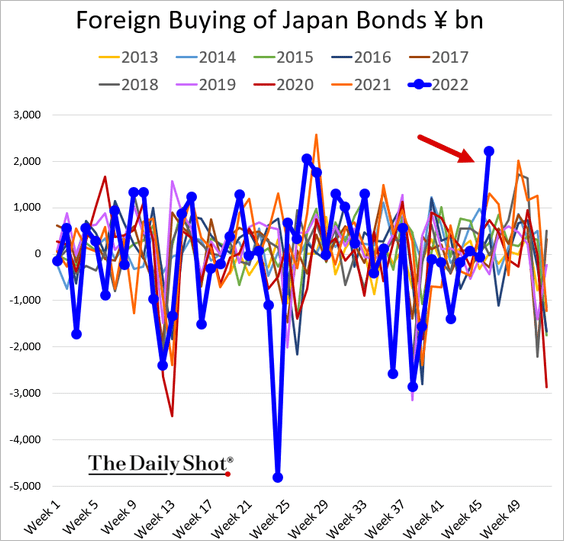
4. Foreigners have been buying some JGBs.
Back to Index
The Eurozone
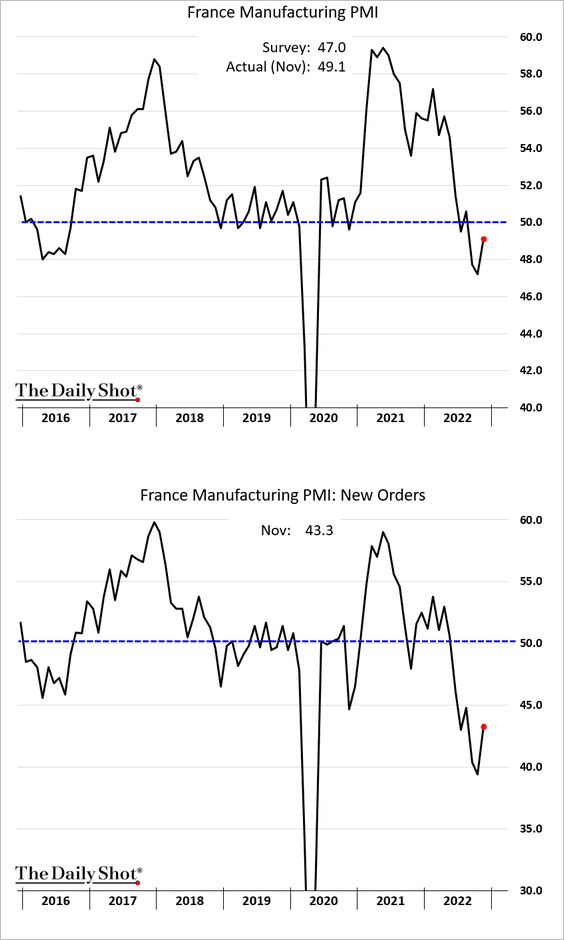
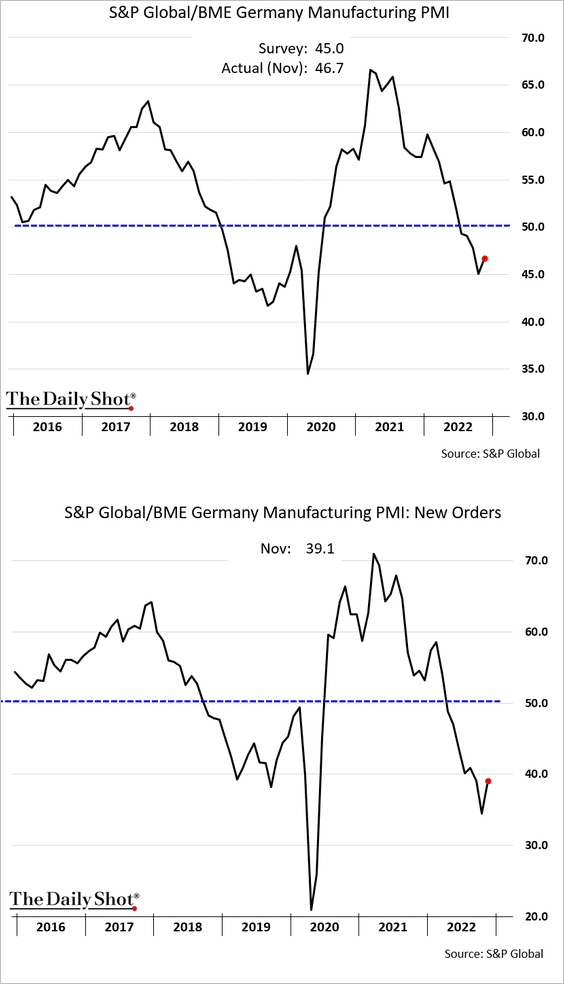
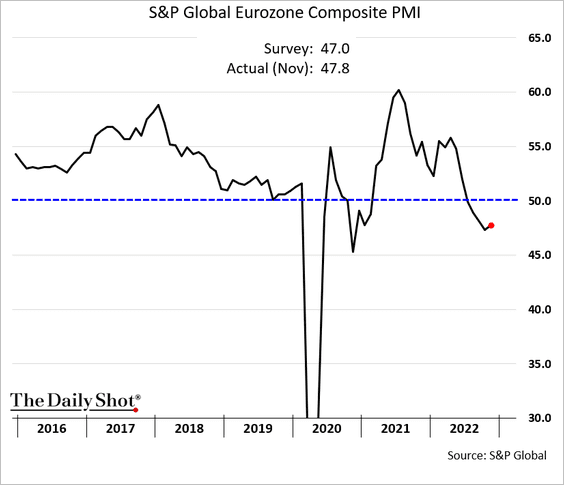
1. The November manufacturing PMI report was better than expected. But activity remains in contraction territory.
– France:
– Germany:
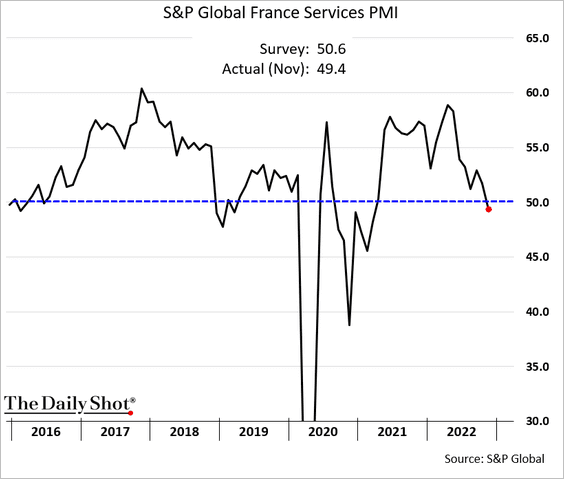
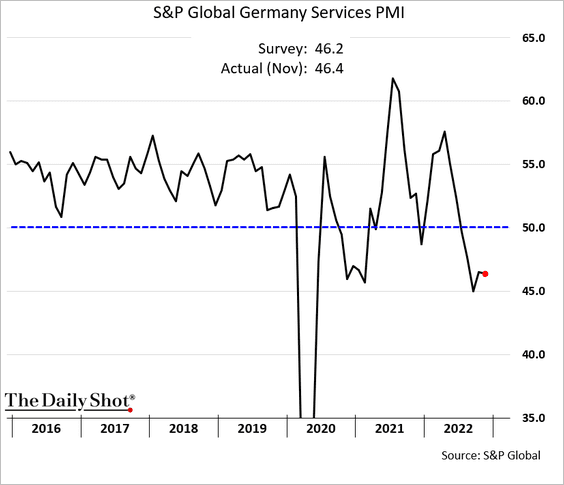
• Service companies also face declining activity.
– France:
– Germany:
• Here is the composite PMI.
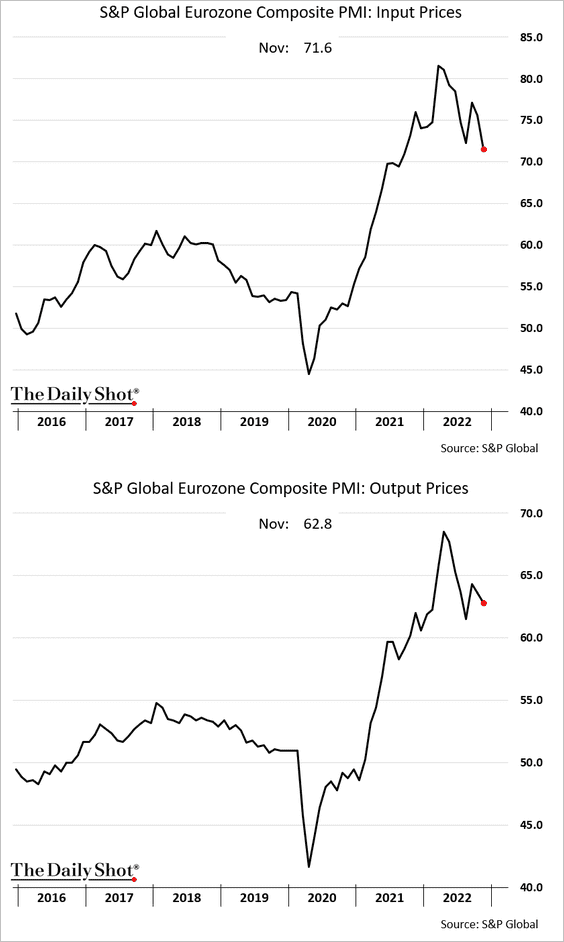
• Price pressures persist.
——————–
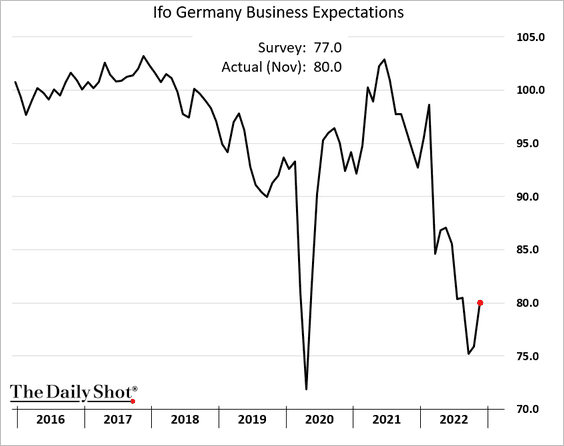
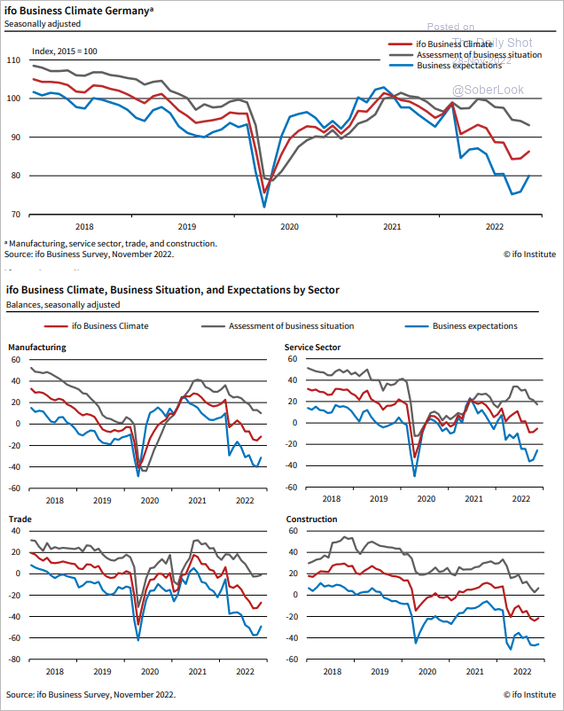
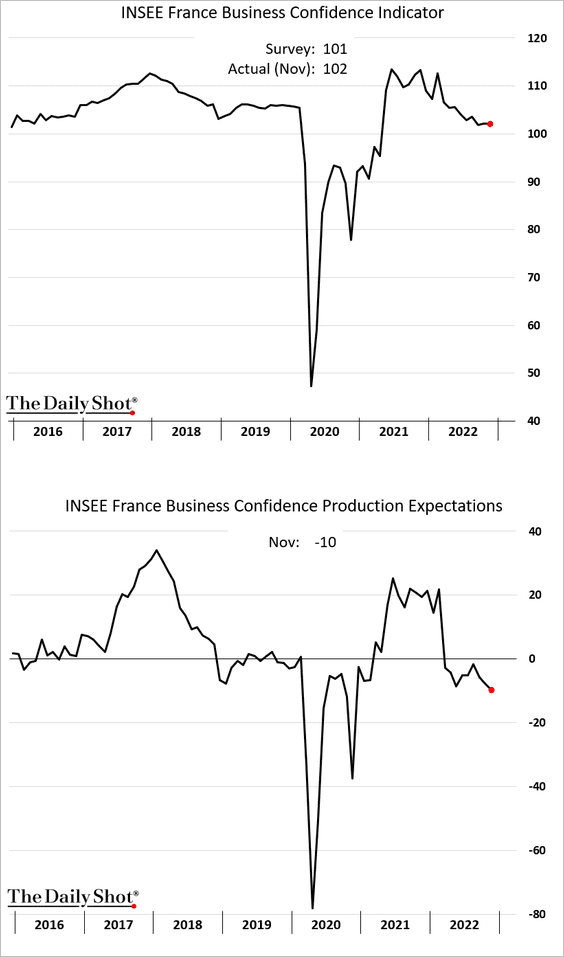
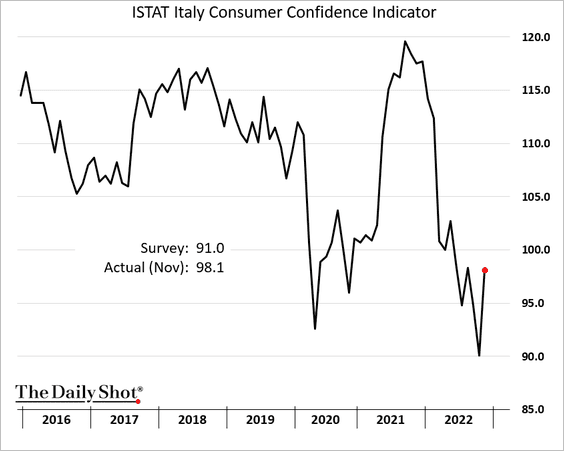
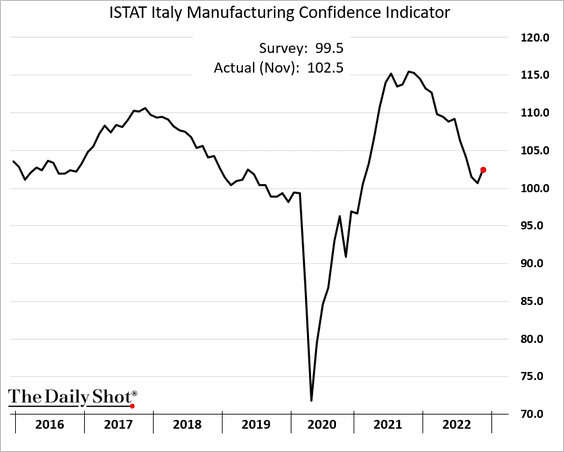
2. Sentiment indicators were better than expected this month, but they remain depressed.
• Germany’s Ifo expectations:
 Source: ifo Institute
• French business confidence:
• Italian consumer and manufacturing sentiment:
——————–
3. Goldman expects the ECB to hike rates four more times in this cycle (50, 50, 25, 25 bps).
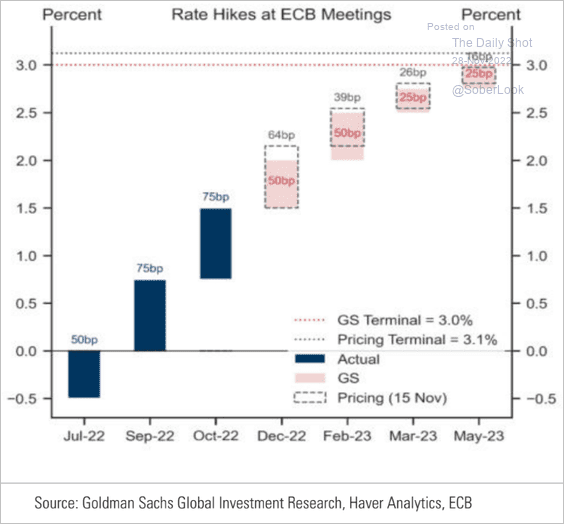 Source: Goldman Sachs
4. Here are the sources of fiscal stimulus.
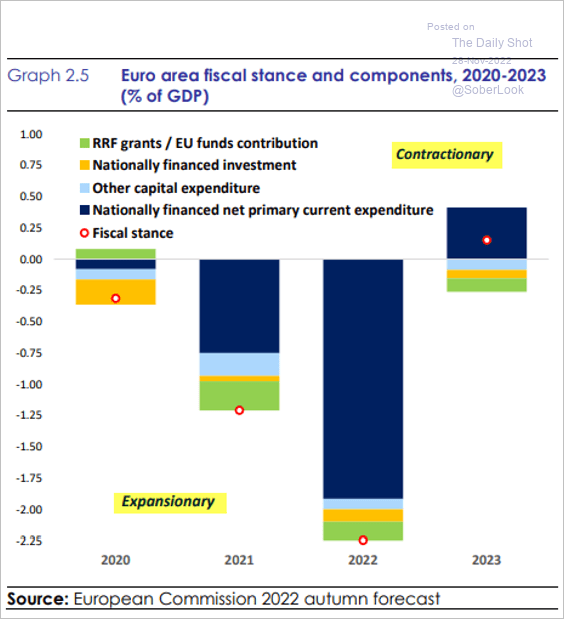 Source: EC Read full article
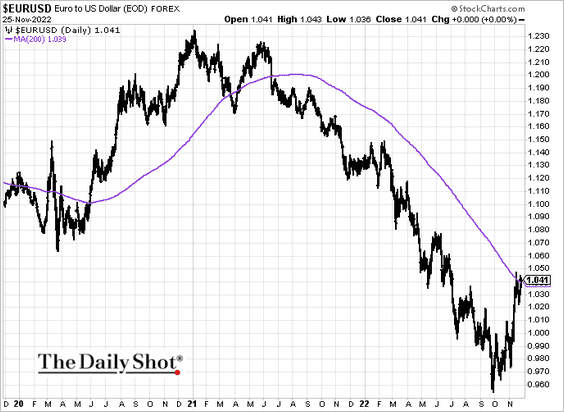
5. The euro’s rebound was halted at the 200-day moving average.
Back to Index
Europe
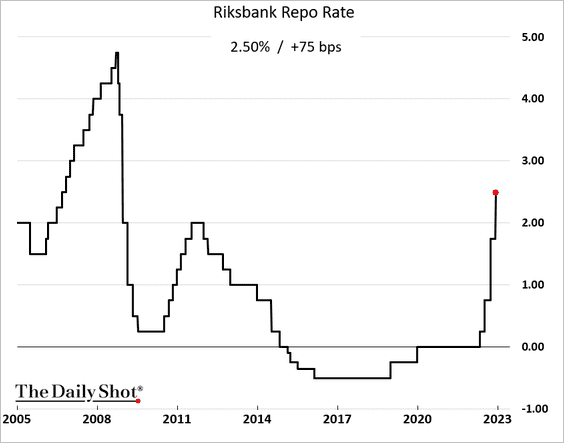
1. Sweden’s Riksbank delivered another jumbo rate hike.
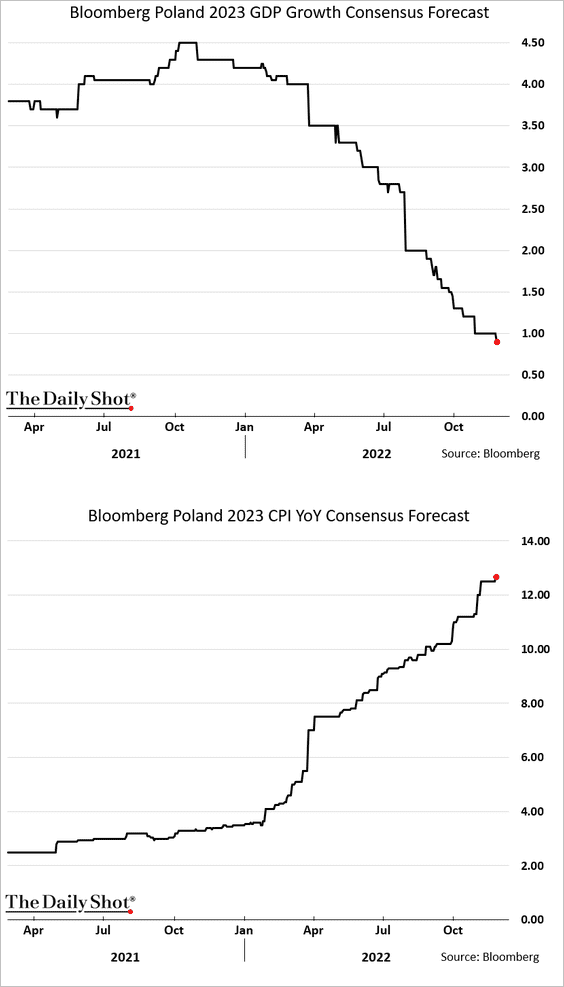
2. Poland risks stagflation next year.
3. This chart shows EV charging infrastructure investment requirements.
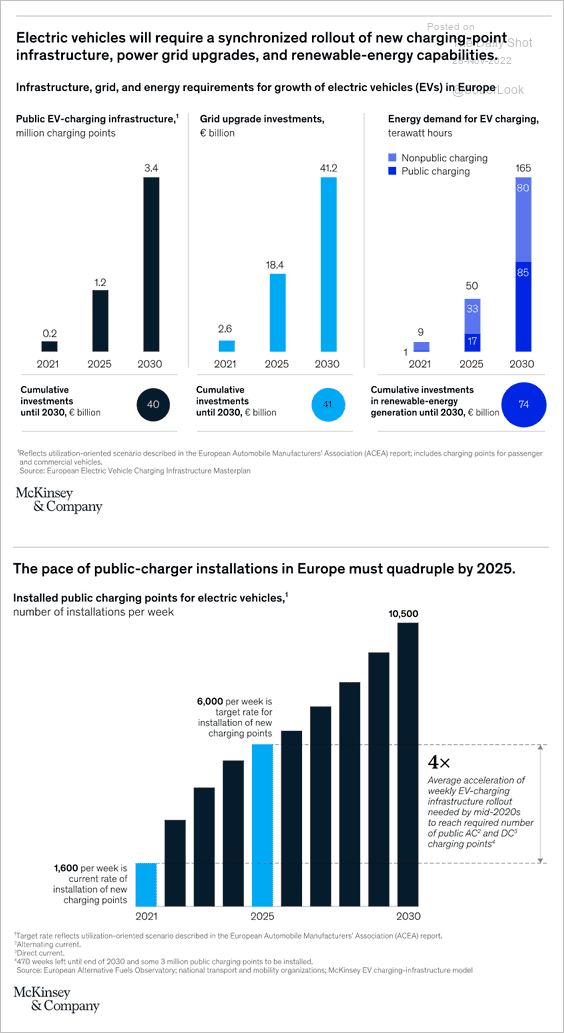 Source: McKinsey & Company
Back to Index
The United Kingdom
1. The PMI report was a bit better than expected, but business activity continues to contract.
• Manufacturing:
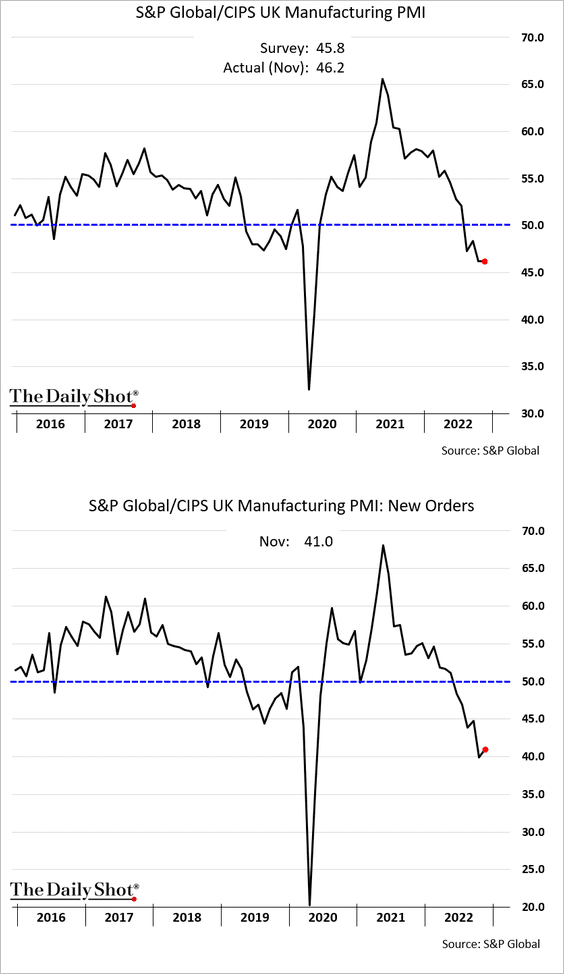
• Services:
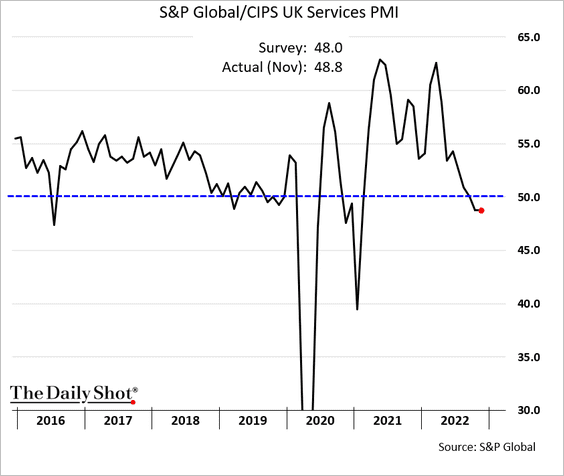
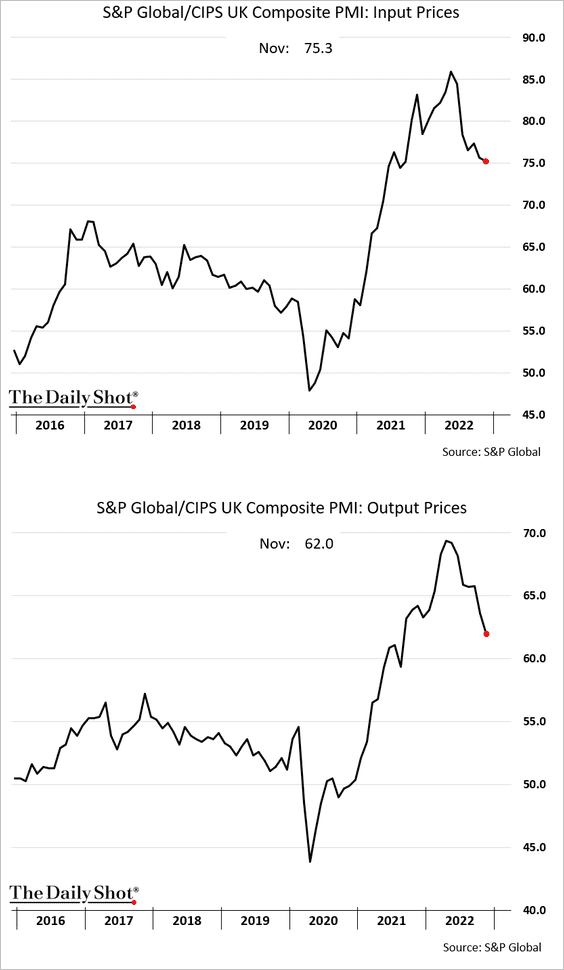
Companies still face price pressures.
——————–
2. Credit conditions have been tightening.
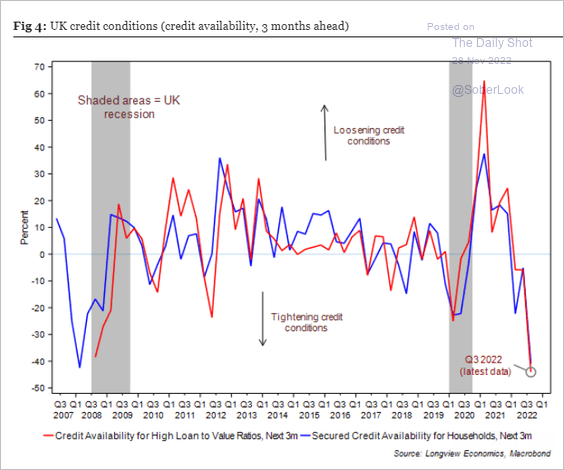 Source: Longview Economics
3. Goldman now expects a deeper recession next year.
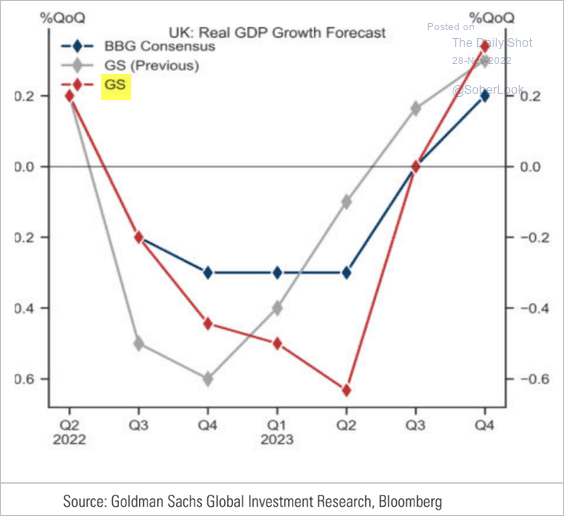 Source: Goldman Sachs
4. UK and Irish GDP growth trends have diverged sharply after the Brexit vote.
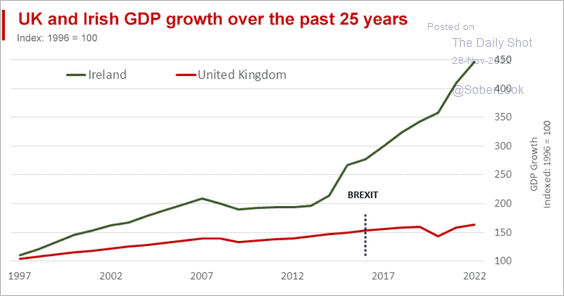 Source: World Economics Read full article
Back to Index
Canada
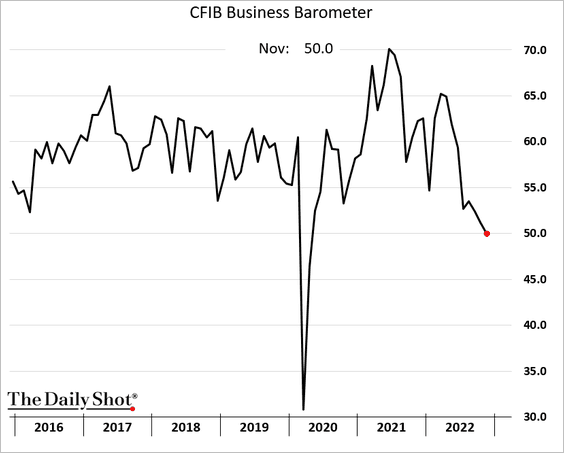
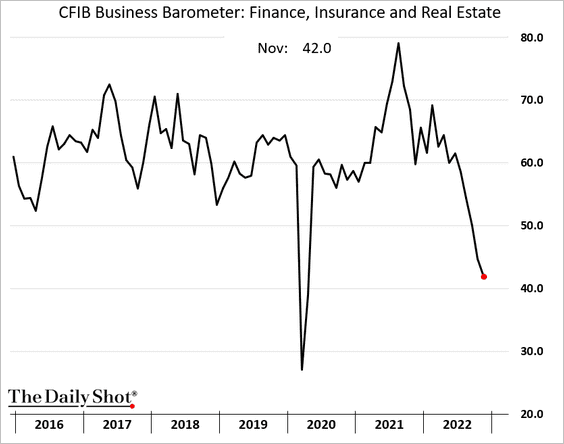
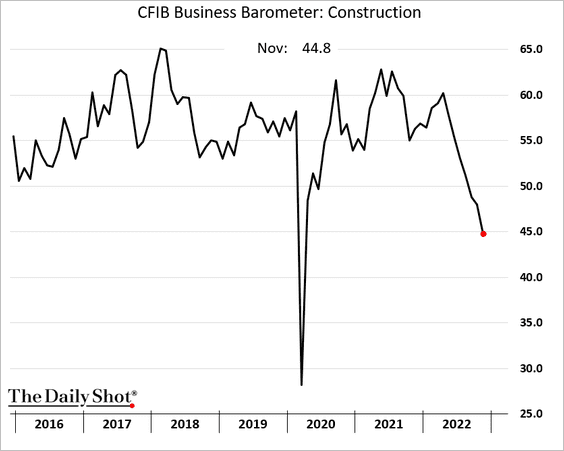
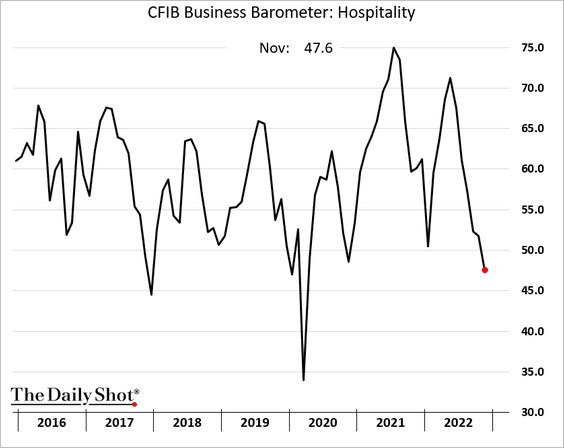
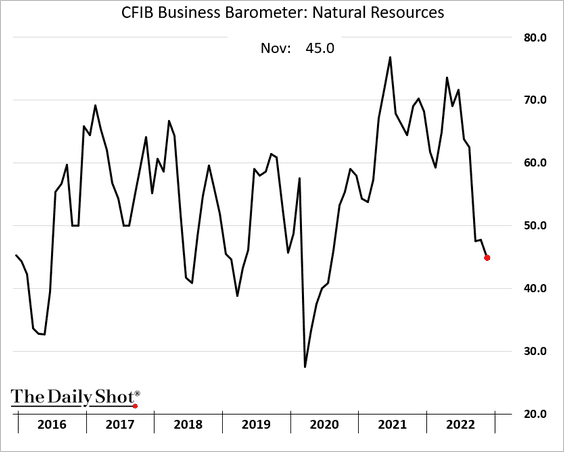
1. The CFIB small business indicator declined again this month.
Sectors sensitive to the housing market are under pressure (2 charts).
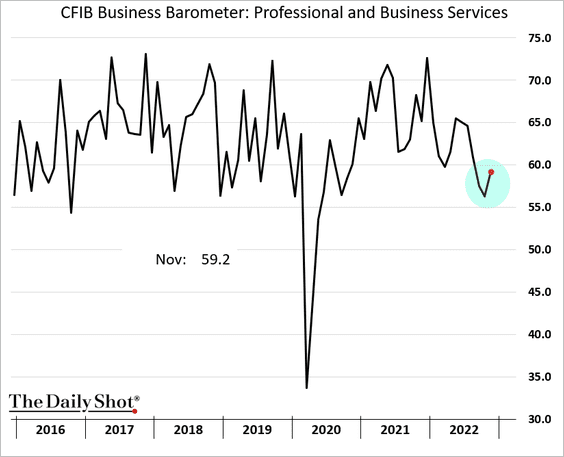
Here are some additional trends from the CFIB report.
• Professional and business services:
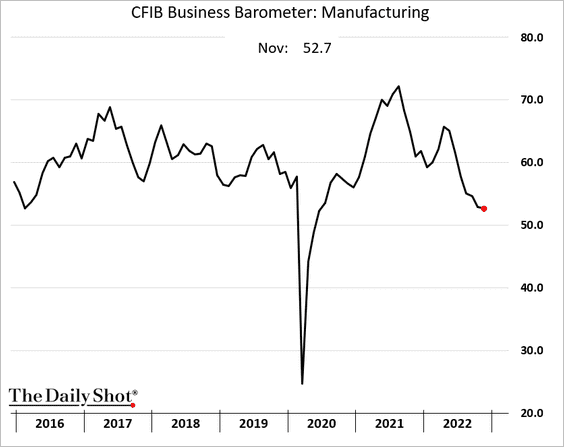
• Manufacturing:
• Hospitality:
• Natural resources:
The CFIB price index points to some moderation in Canada’s consumer inflation.
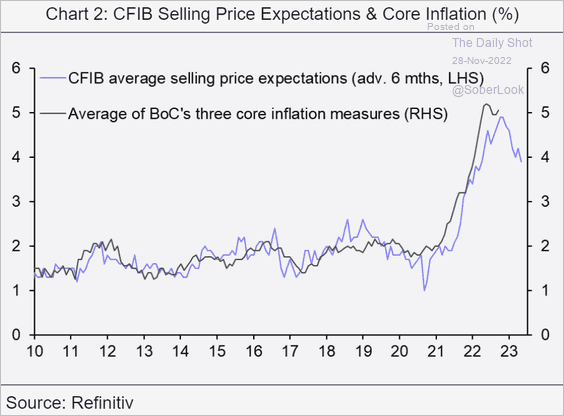 Source: Capital Economics
——————–
2. Canada’s economy has significant exposure to the housing market (British Columbia is most vulnerable).
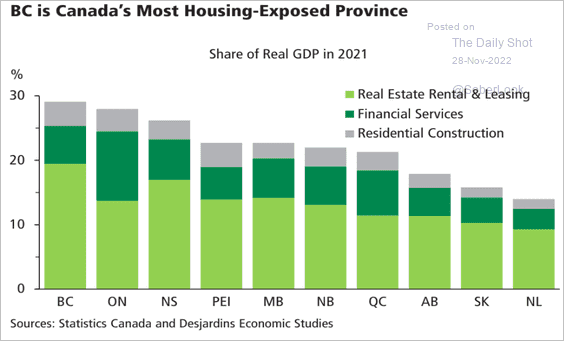 Source: Desjardins
3. New home sales point to a sharp decline in residential construction.
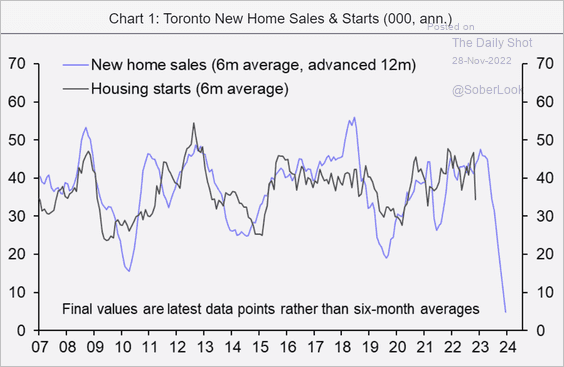 Source: Capital Economics
4. This chart shows banks’ net interest margins.
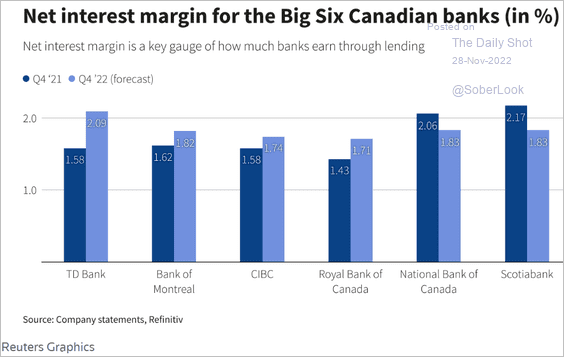 Source: Reuters Read full article
Back to Index
The United States
1. The S&P Global US PMI report showed a faster pace of contraction in business activity this month.
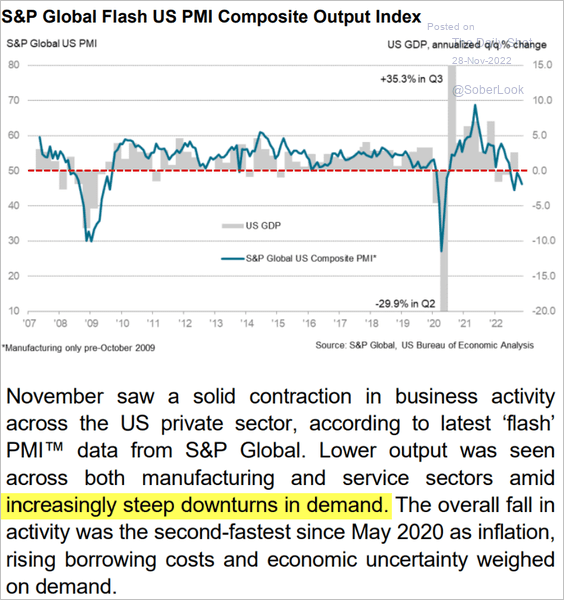 Source: S&P Global PMI
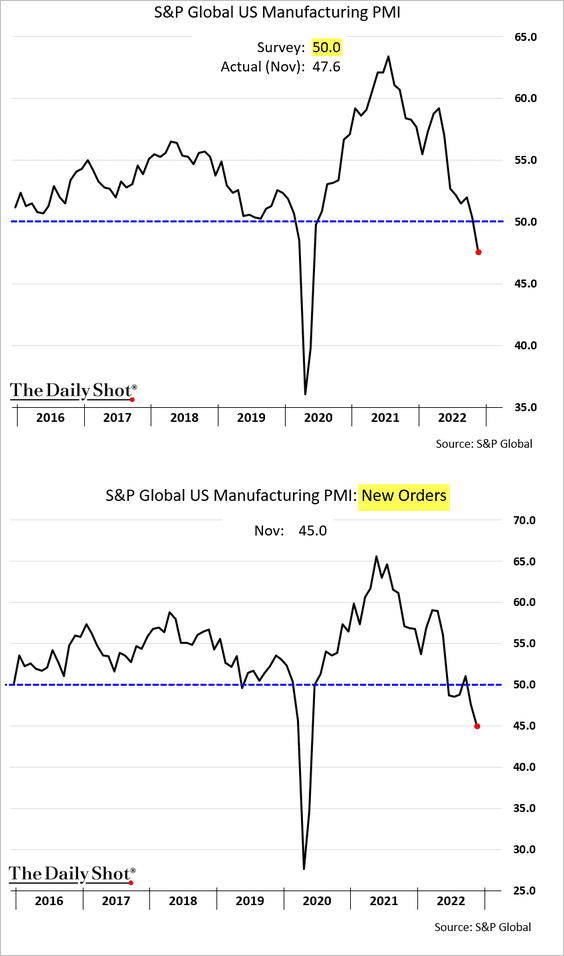
• Manufacturing:
• Services:
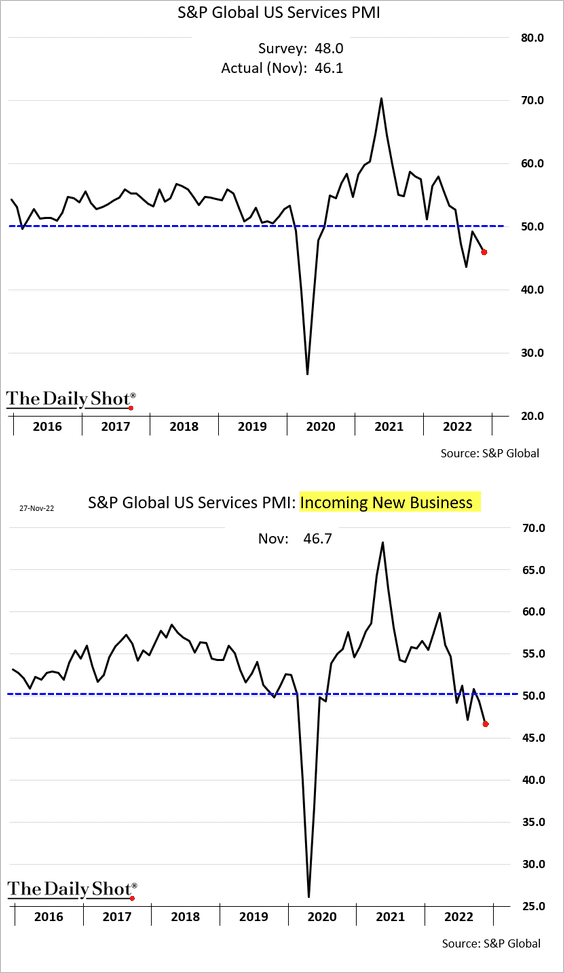
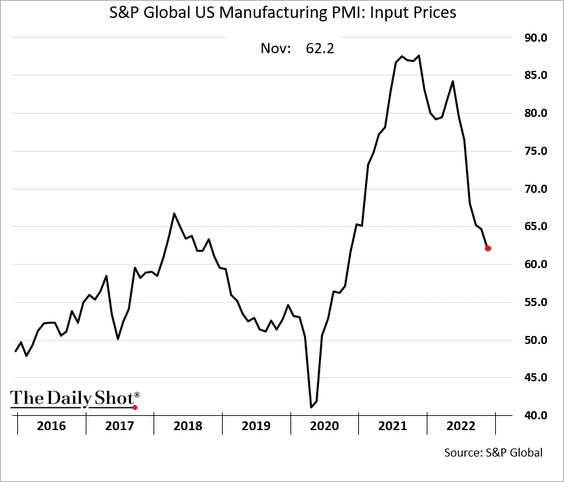
Manufacturing price pressures are moderating.
——————–
2. Regional Fed manufacturing indices signal deteriorating demand at the national level.
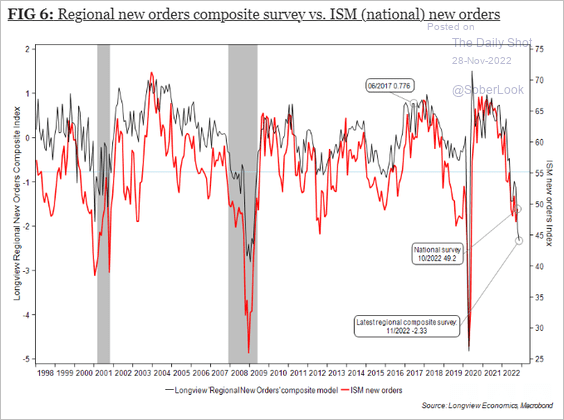 Source: Longview Economics
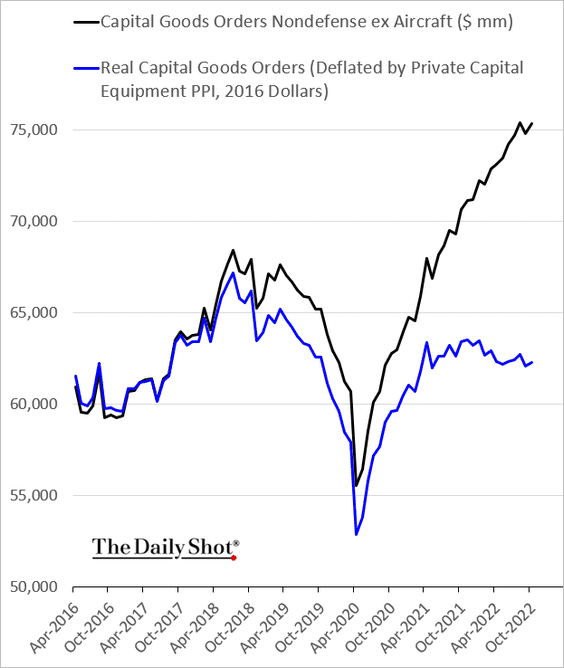
3. October durable goods orders surprised to the upside.
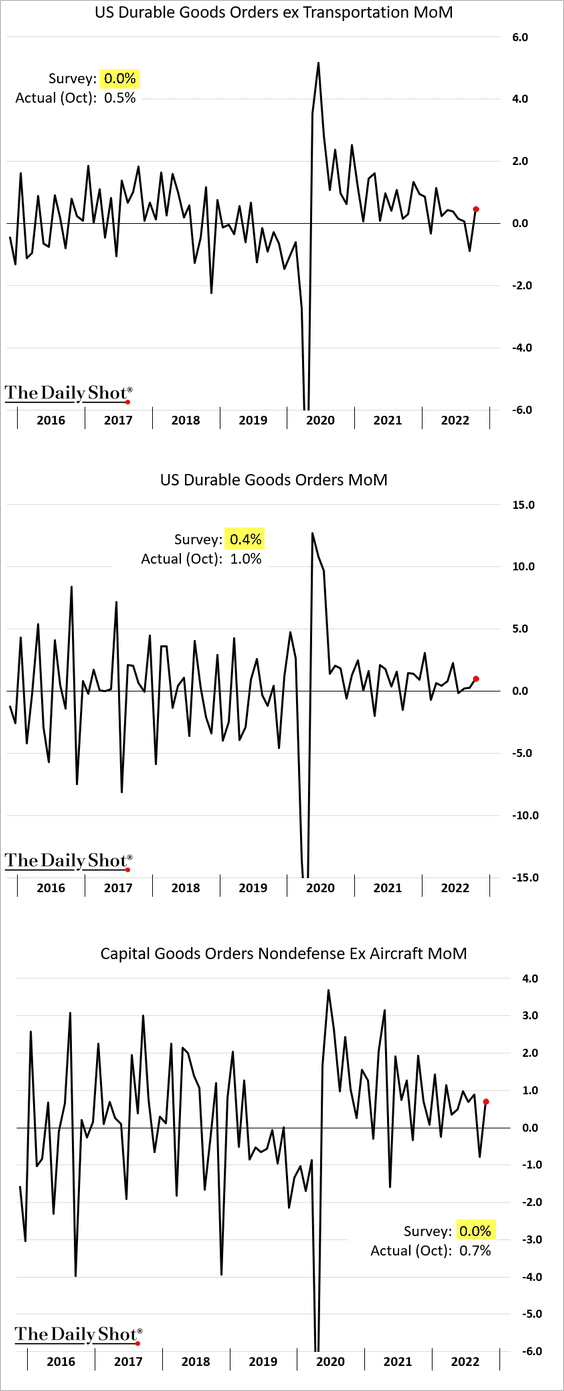
This chart shows the level of US capital goods orders (nominal and real).
——————–
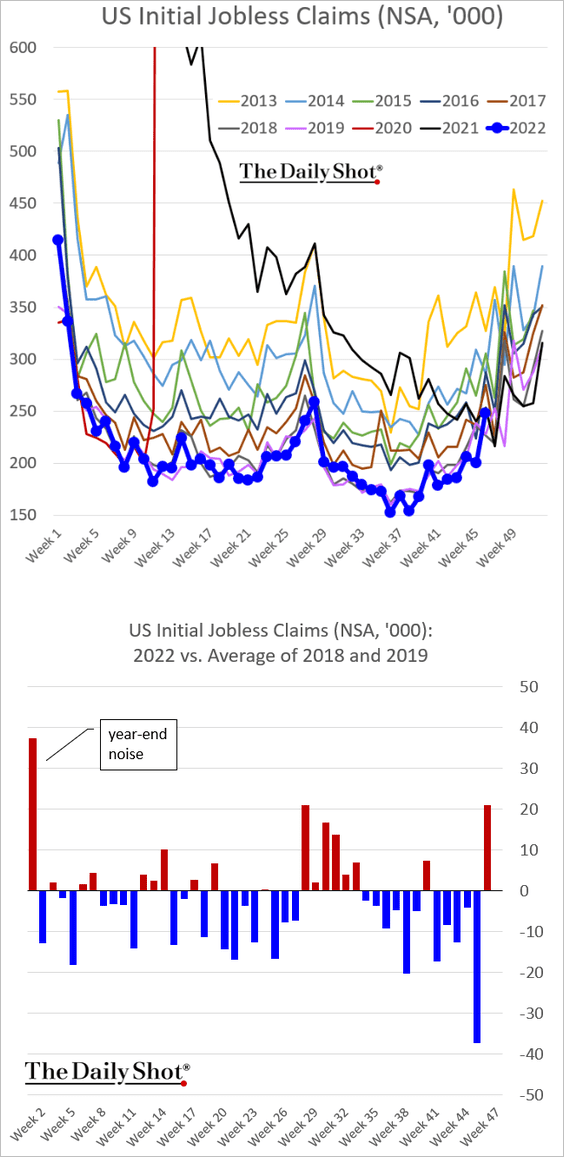
4. Last week’s initial jobless claims report showed a sharp increase. Will November payrolls surprise to the downside?
This chart shows the breadth of state jobless claims.
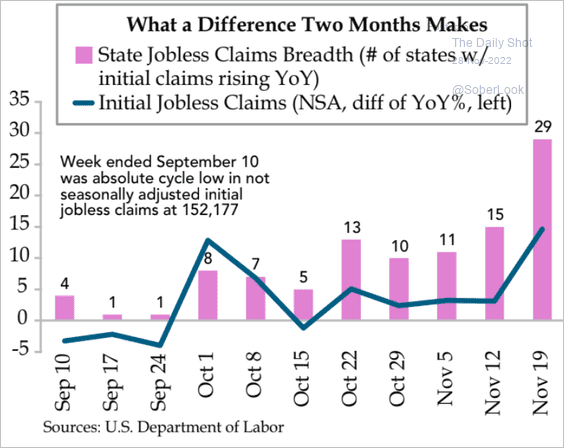 Source: Quill Intelligence
——————–
5. Nominal holiday spending is expected to hit a record (real spending will probably show a decline).
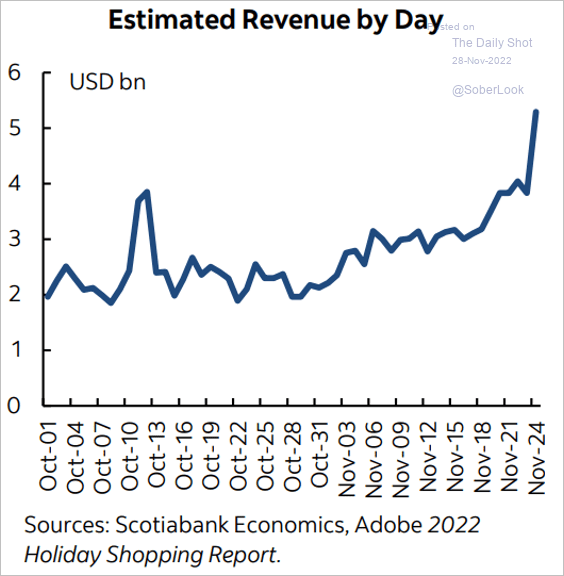 Source: Scotiabank Economics
6. The yield curve inversion continues to deepen, …
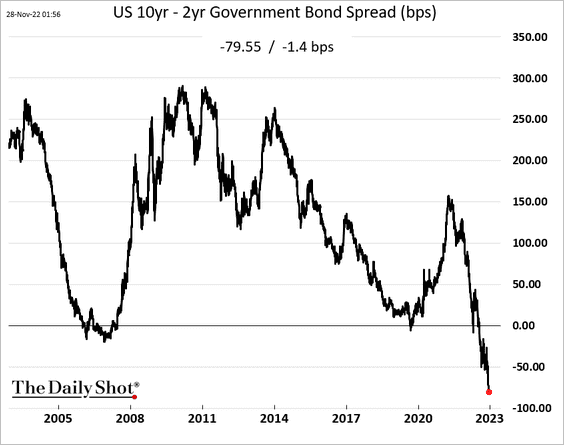
… signaling a recession.
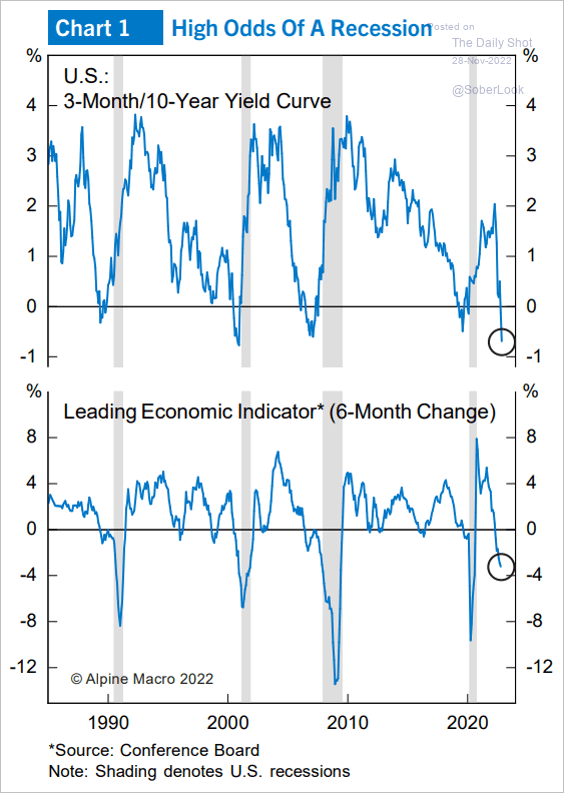 Source: Alpine Macro
But Goldman still does not expect a recession next year.
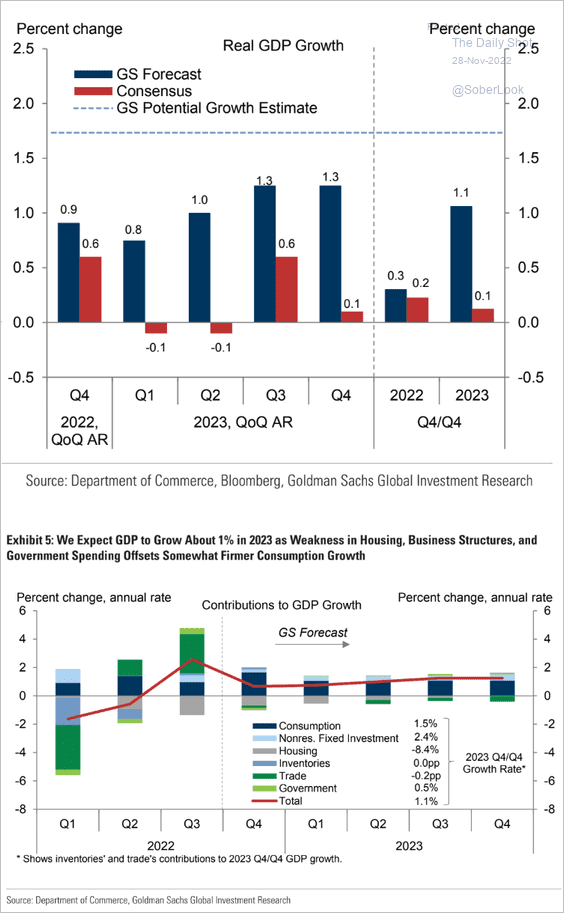 Source: Goldman Sachs
Back to Index
Emerging Markets
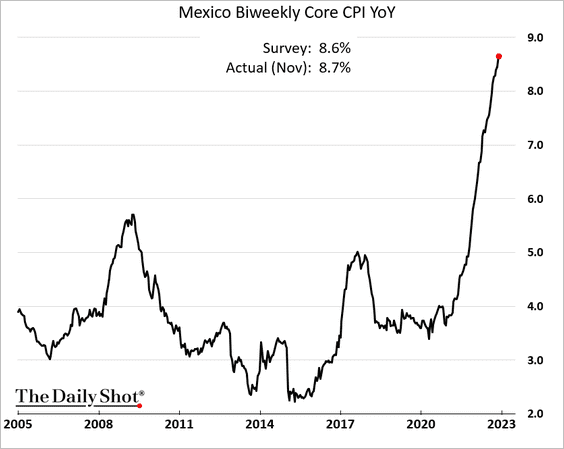
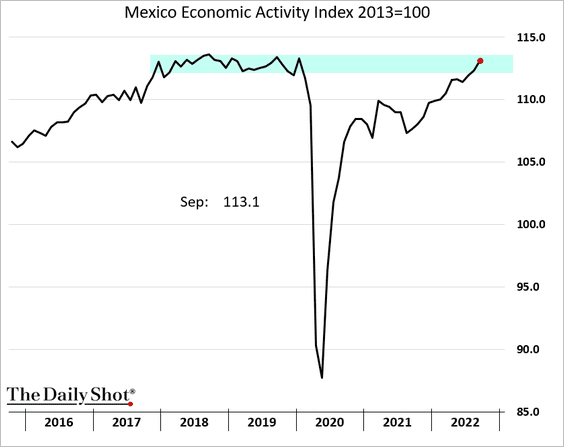
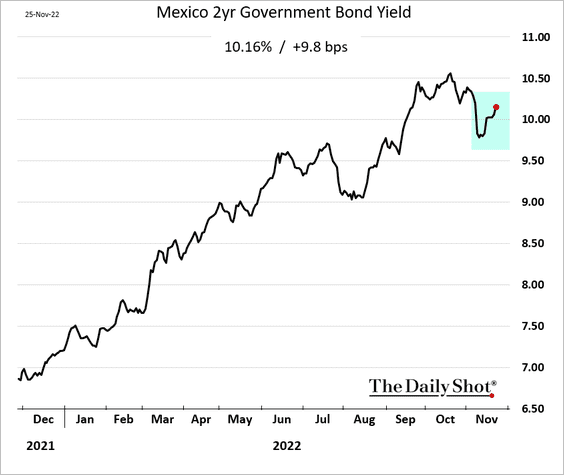
1. Mexico’s inflation continues to surge.
• Economic activity is back at pre-COVID levels.
• Bond yields are rising again.
——————–
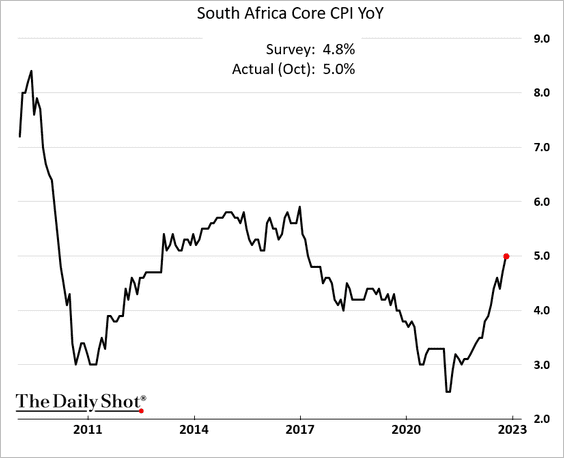
2. South Africa’s central bank hiked rates again, …
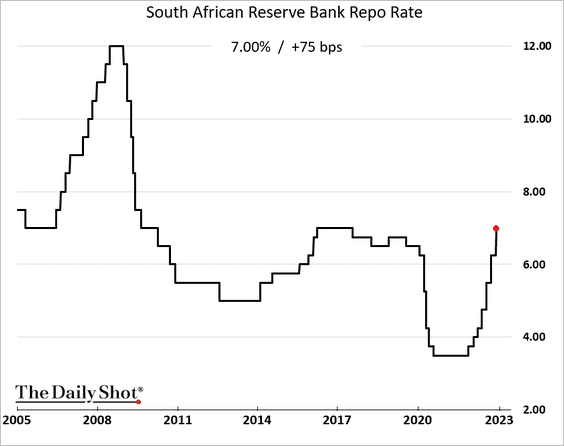
… as inflation climbs.
——————–
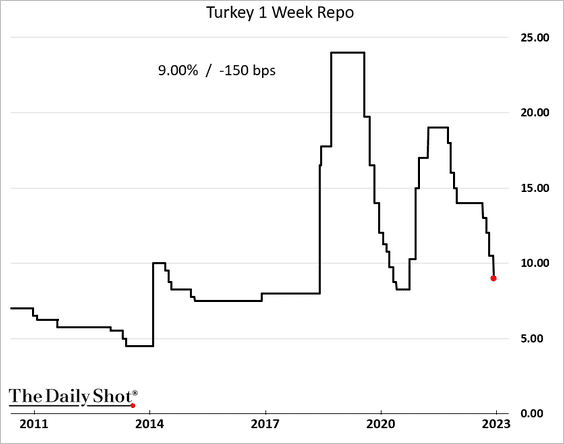
3. Turkey’s central bank cut rates by 150 bps. The core CPI is above 70%.
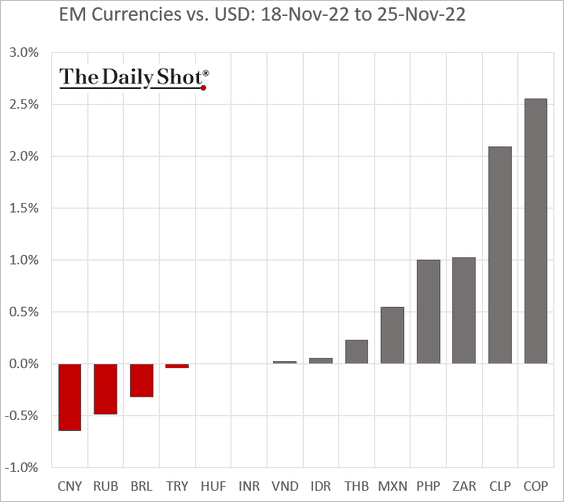
4. Next, we have some performance data from last week.
• Currencies:
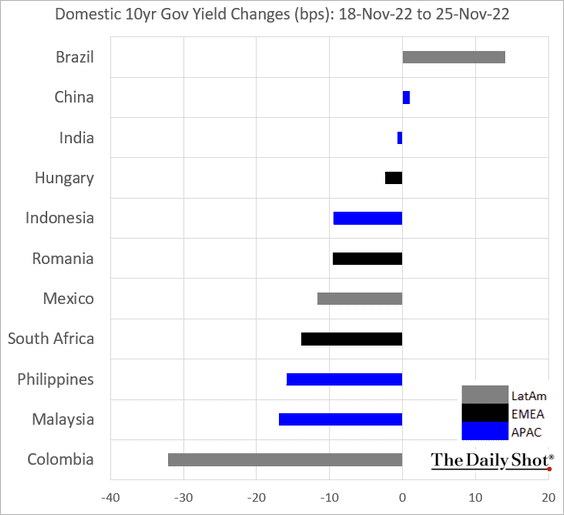
• Yields (local-currency bonds):
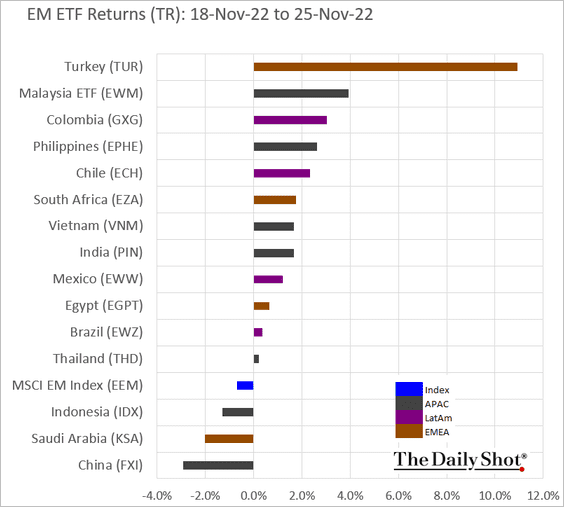
• Equity ETFs:
Back to Index
Commodities
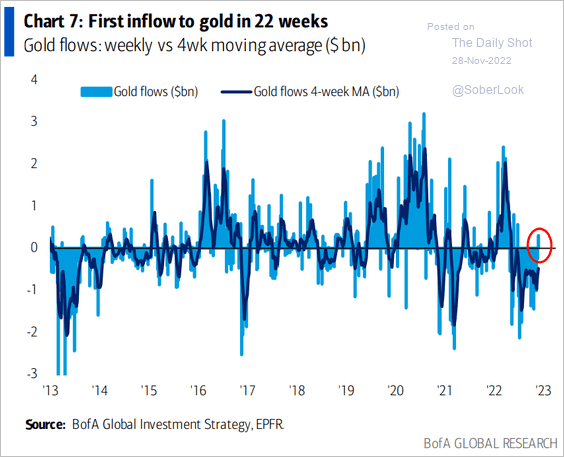
1. Let’s begin with some updates on gold.
• Gold funds saw their first inflows in 22 weeks.
 Source: BofA Global Research
• Gold mining stocks are starting to outperform, similar to the silver/gold price ratio.
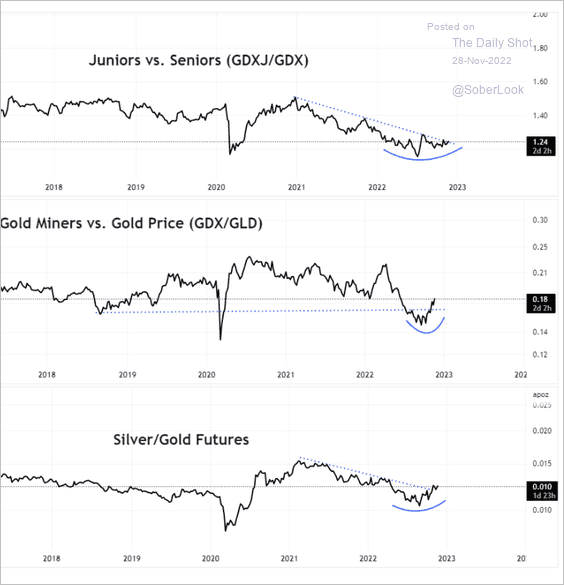 Source: Aazan Habib, Paradigm Capital
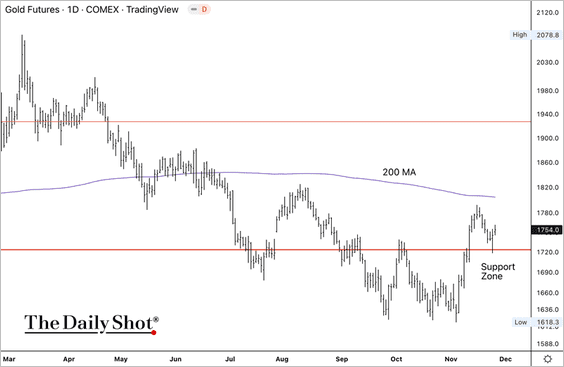
• Gold futures faced a minor setback at the 200-day moving average.
• The rising dollar and high real rates explained most of gold’s losses this year.
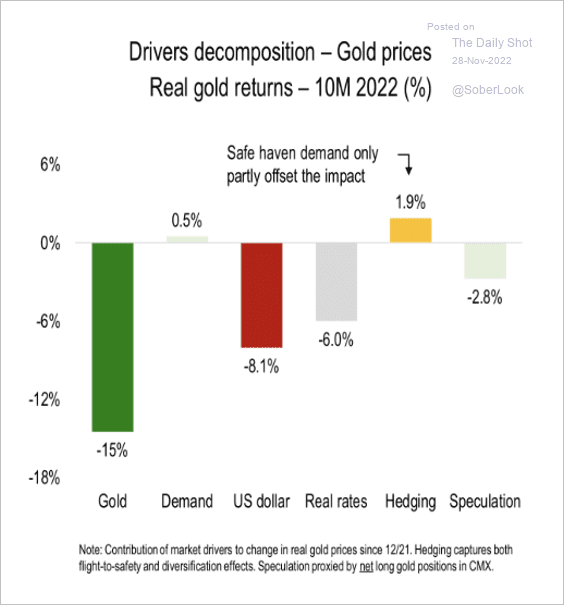 Source: Numera Analytics
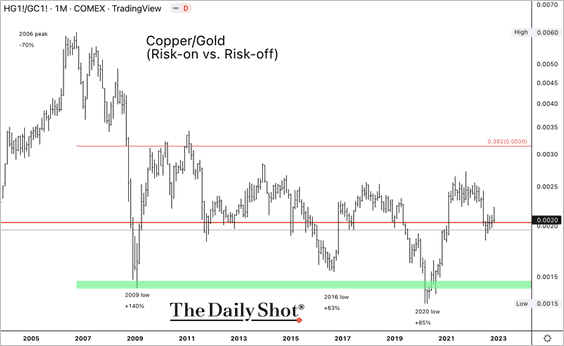
• The copper/gold price ratio is holding minor support but does not indicate an immediate return to risk-on conditions.
——————–
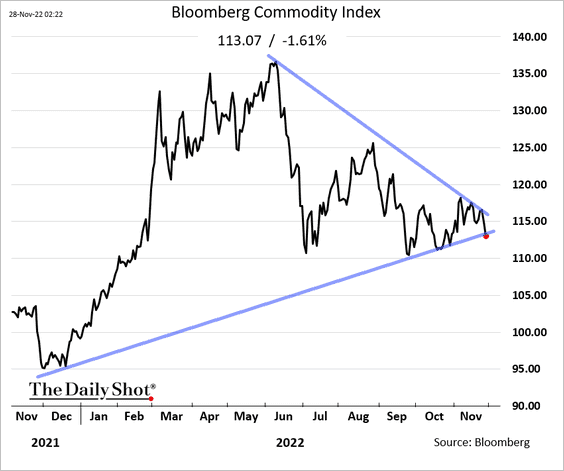
2. Bloomberg’s broad commodity index is lower on China’s COVID situation.
3. Commodities have given up some of their outperformance over the past few months as global growth softened.
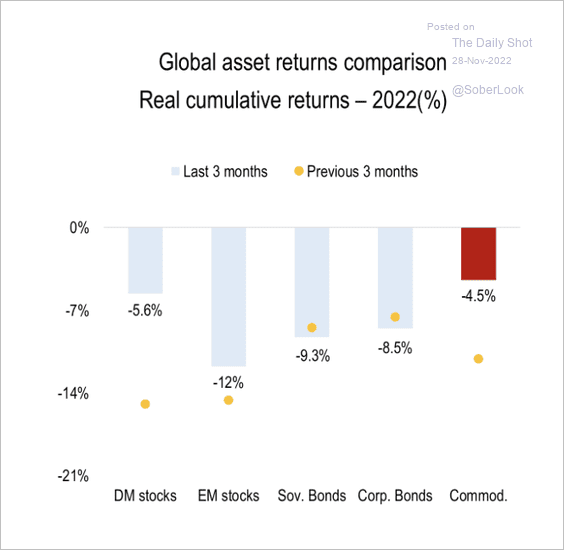 Source: Numera Analytics
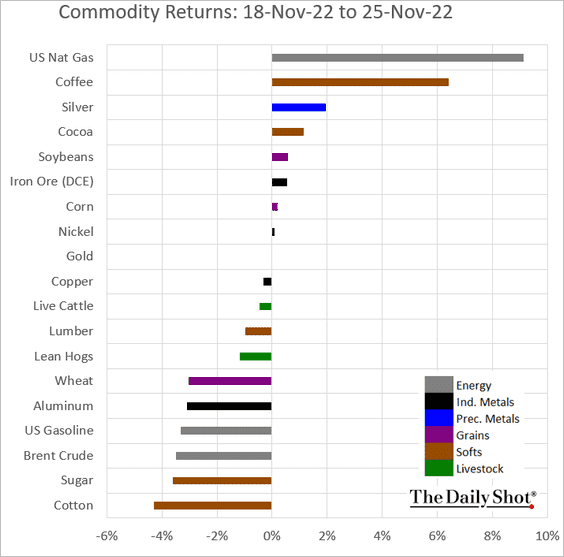
4. Here is last week’s performance across key commodity markets.
Back to Index
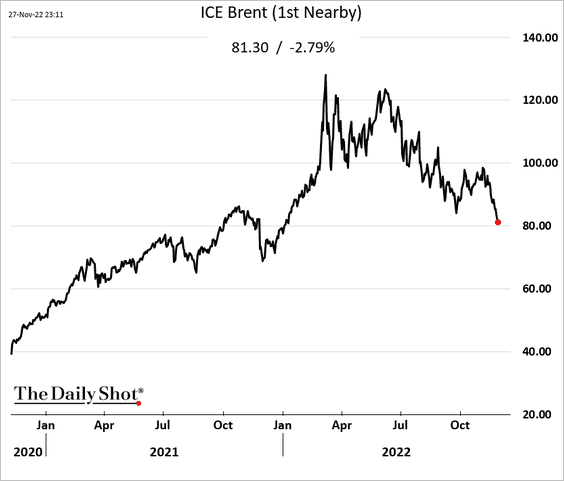
Energy
1. Crude oil remains under pressure amid concerns about weak demand from China.
2. The dollar’s rally explained about 60% of the oil price drop since June.
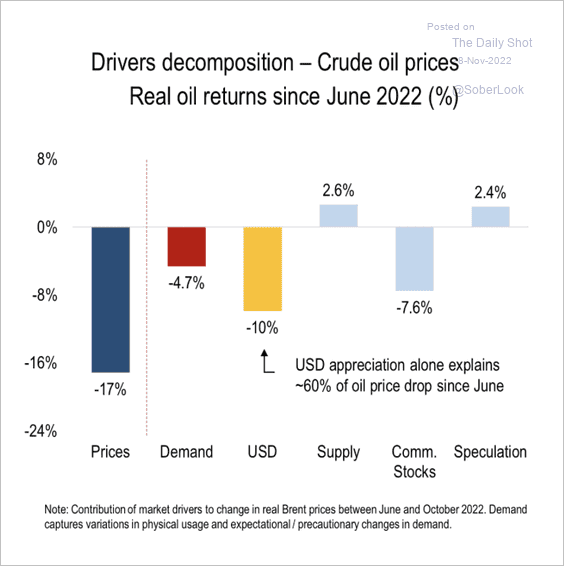 Source: Numera Analytics
3. Goldman expects European natural gas prices to rise next year.
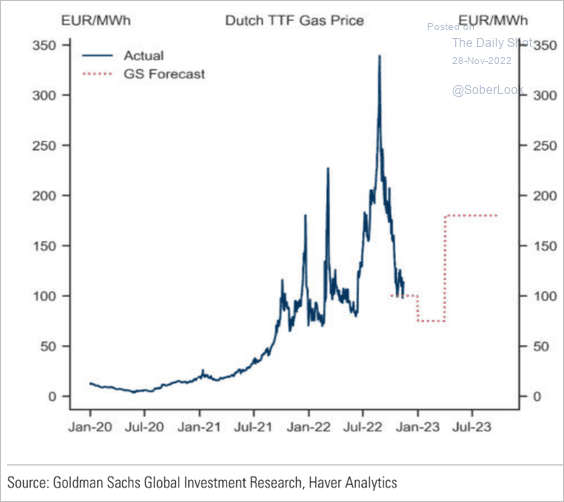 Source: Goldman Sachs
4. Uranium prices remain elevated.
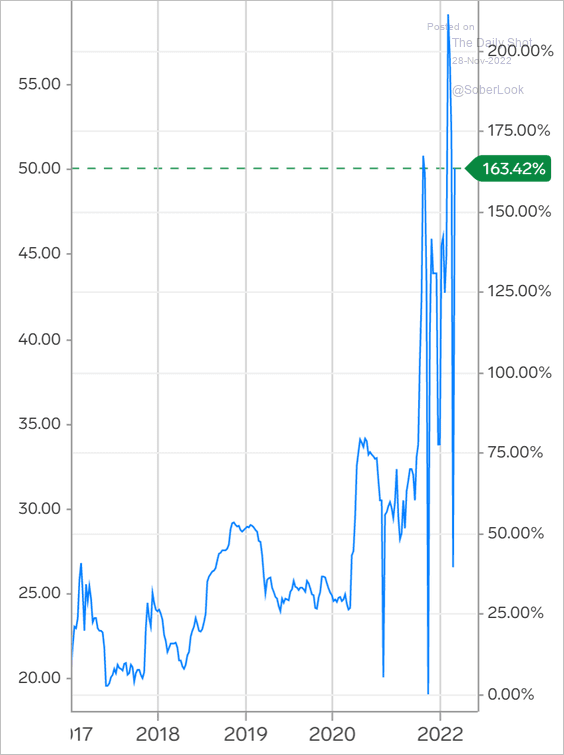 Source: Markets Insider
Here is US uranium production over time.
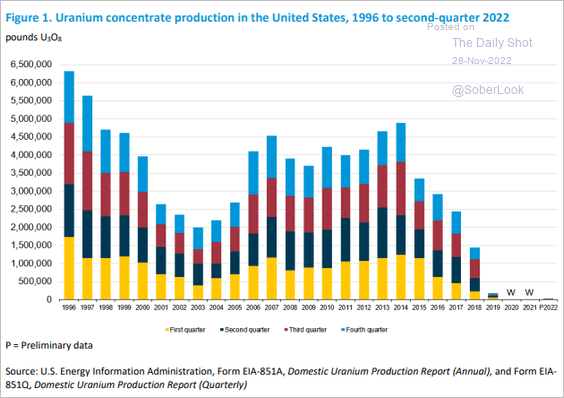 Source: @EIAgov
Back to Index
Equities
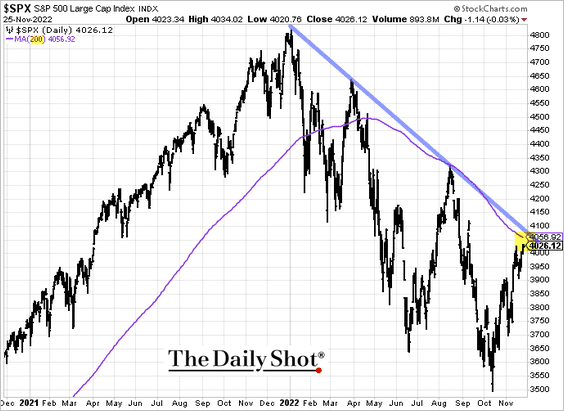
1. The S&P 500 is at resistance.
2. Stocks are expensive according to the Longview Economics’ valuation indicator.
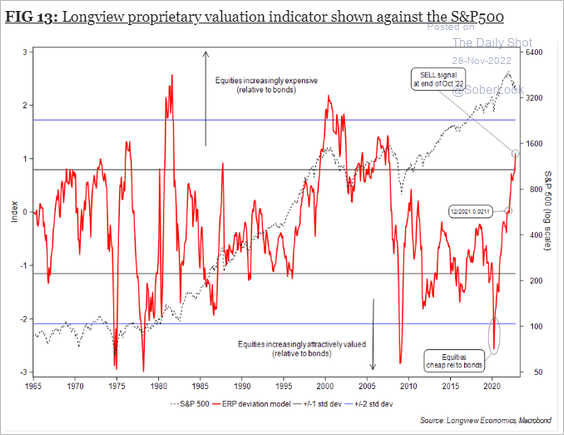 Source: Longview Economics
3. Foreigners have been selling US equities and buying Treasuries.
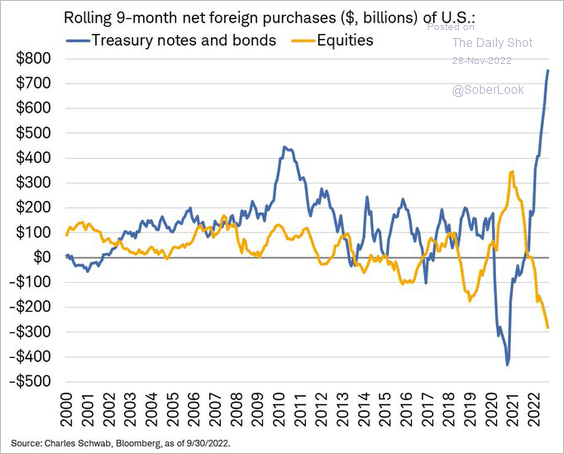 Source: @LizAnnSonders
4. Margin debt declined sharply this year
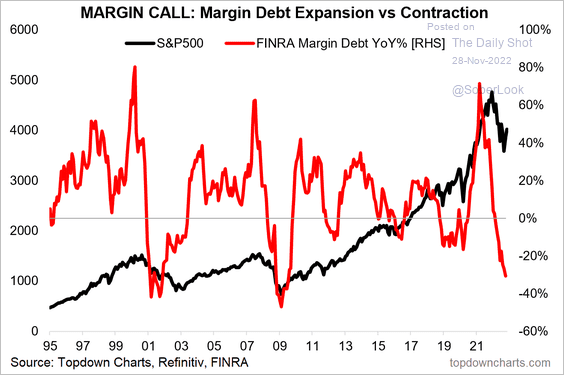 Source: @topdowncharts
5. The US profit cycle is decelerating, which could lead to further earnings downgrades in the months ahead.
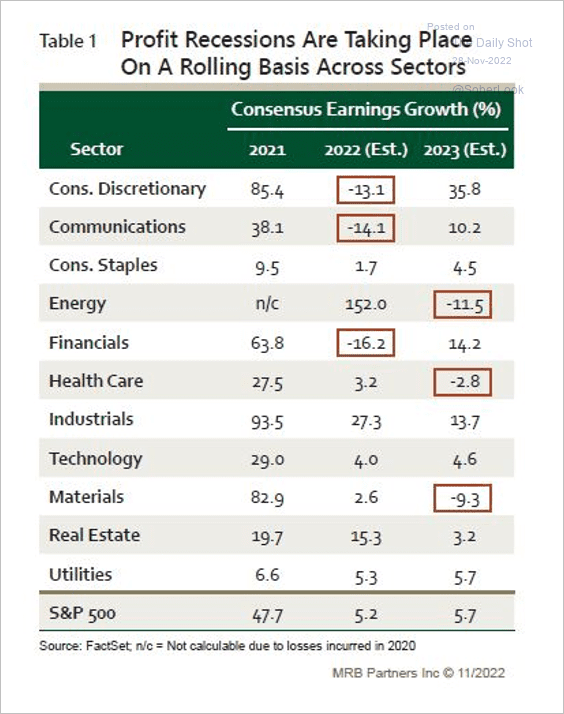 Source: MRB Partners
6. The latest market bounce has benefitted cyclical value stocks versus cyclical growth stocks.
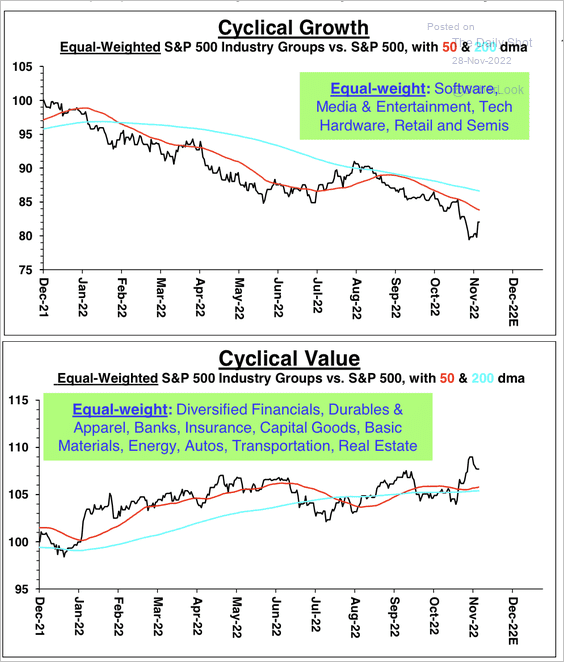 Source: Stifel
7. Investors are paying a premium for companies with strong balance sheets and high margins.
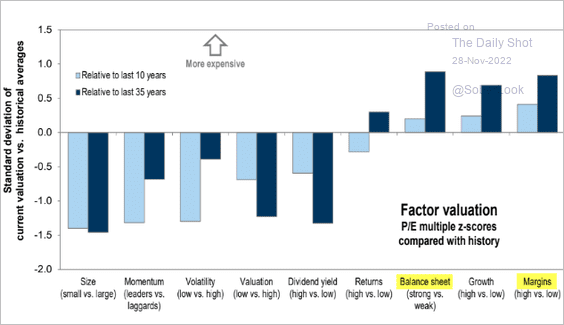 Source: Goldman Sachs; @MikeZaccardi Read full article
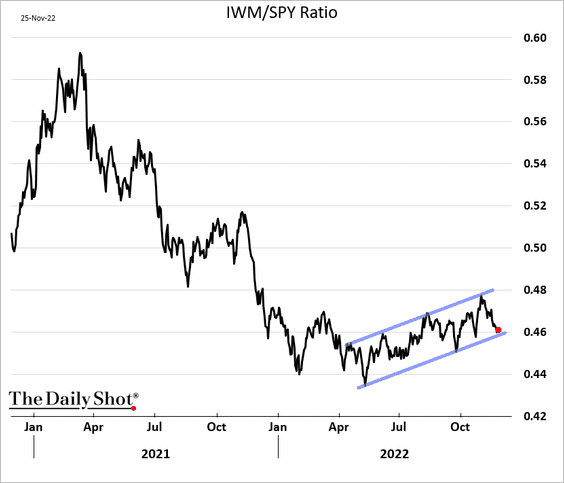
8. Small caps are at the lower end of the uptrend channel.
9. Next, let’s take a look at some additional equity factor trends.
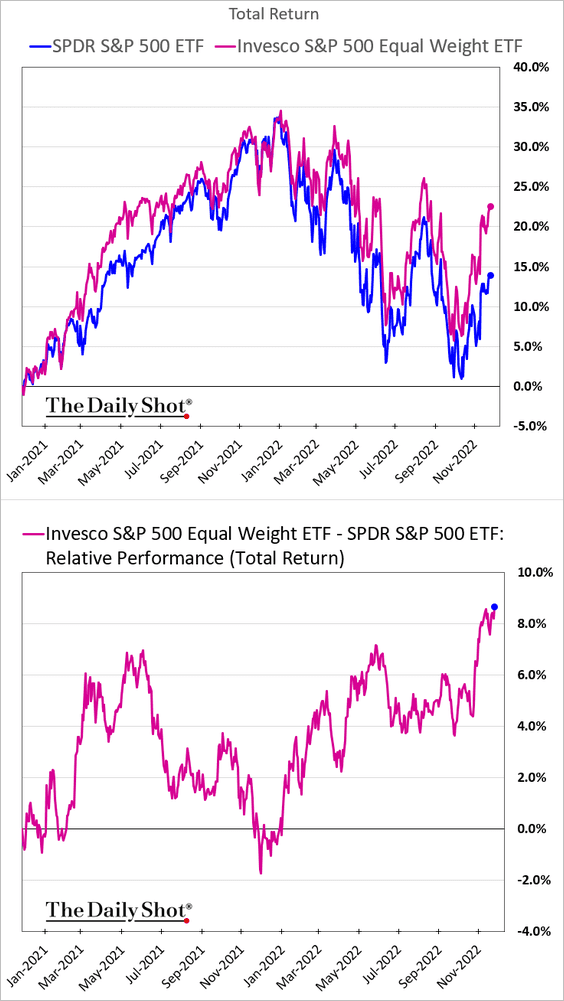
• Equal-weight S&P 500:
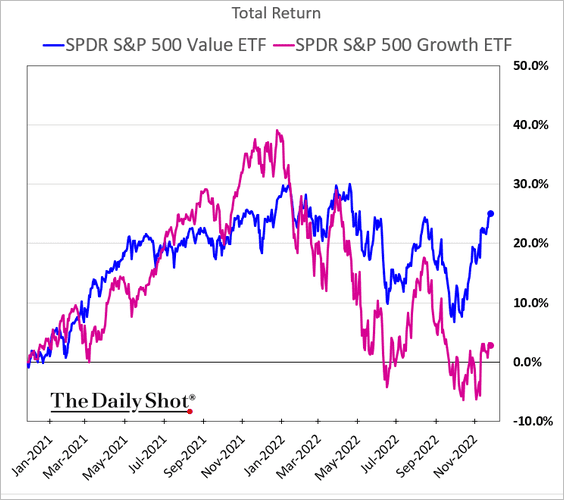
• Growth vs. value:
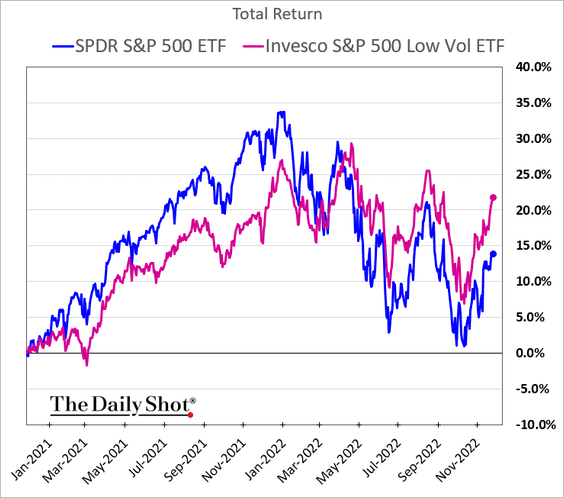
• Low vol:
• Dividend growers:
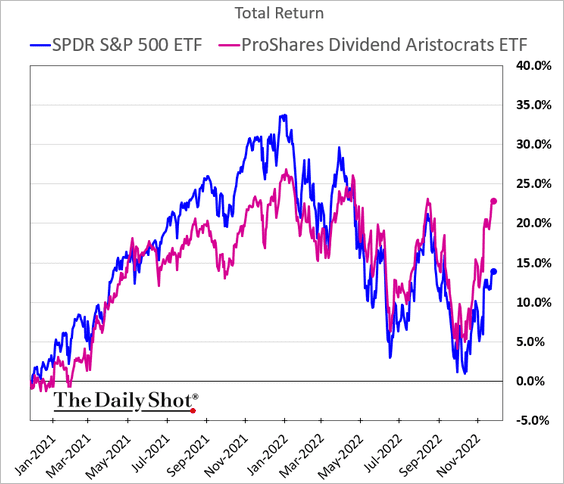
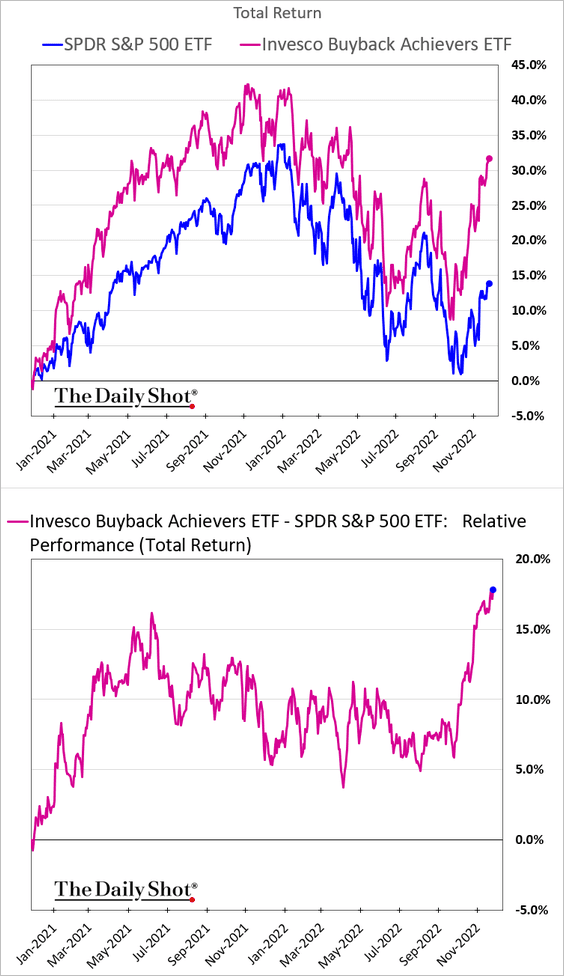
• Companies known for share buybacks:
——————–
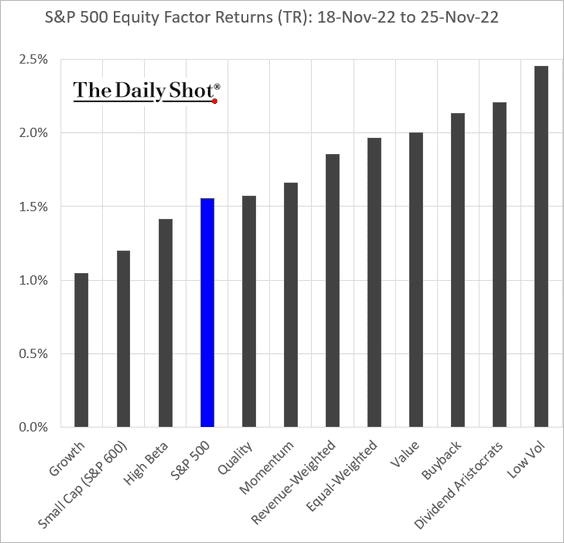
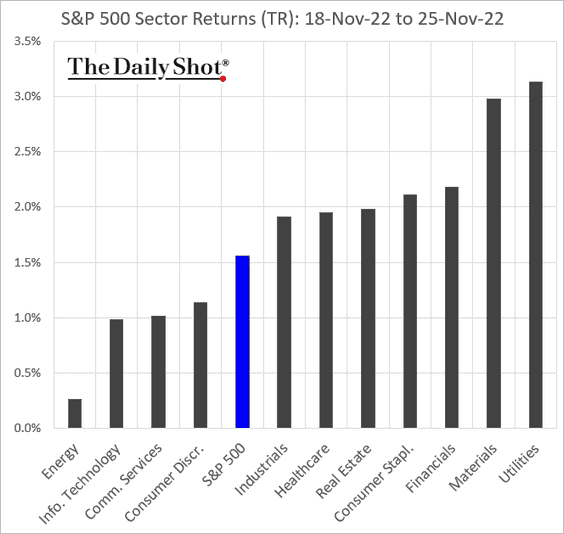
10. Finally, we have last week’s performance data.
• Equity factors:
• Sectors:
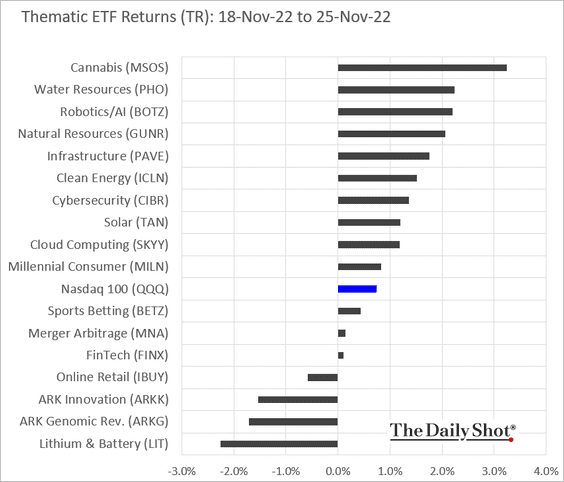
• Thematic ETFs:
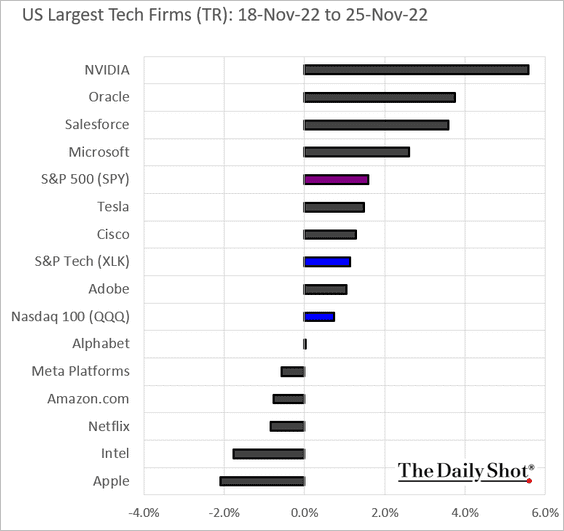
• Largest US tech firms:
Back to Index
Credit
1. Corporate credit funds continue to see inflows.
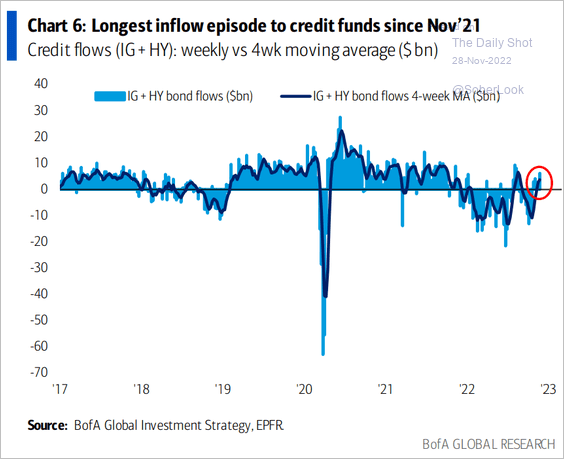 Source: BofA Global Research
2. Real global debt issuance has been slowing.
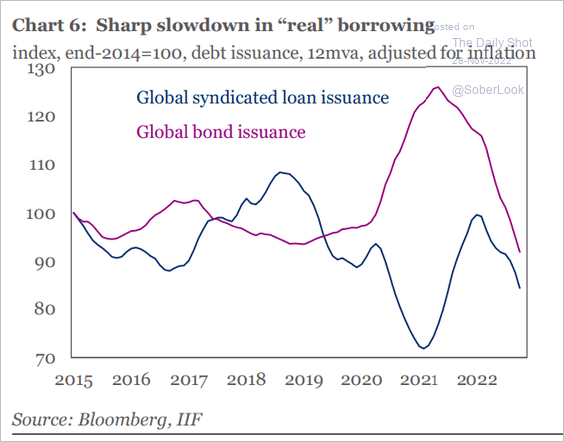 Source: IIF
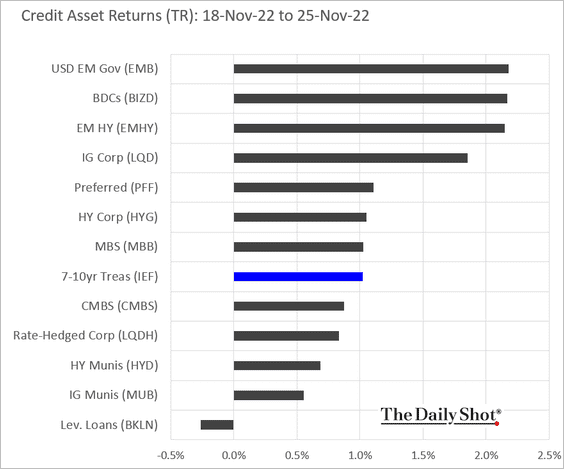
3. Here is last week’s performance by asset class.
Back to Index
Rates
1. The 30-year TIPS yield (real rate) is at support.
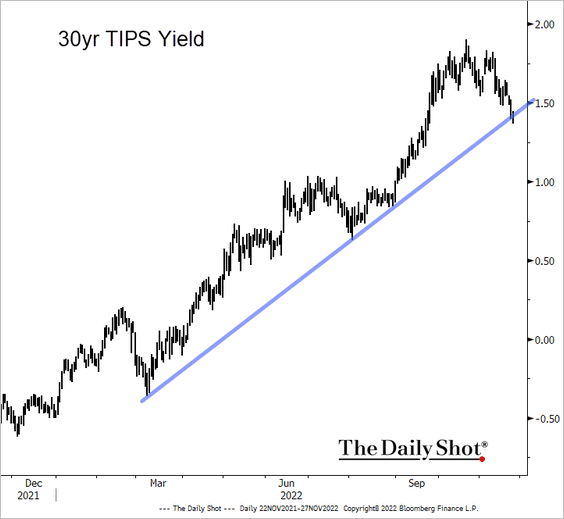 Source: @TheTerminal, Bloomberg Finance L.P.
2. As the Fed hikes rates, its rate-paying liabilities are becoming costly.
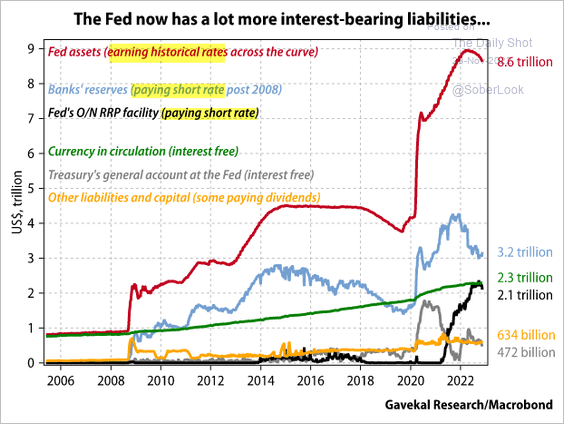 Source: Gavekal Research
Back to Index
Global Developments
1. Easing supply pressures point to slower inflation ahead.
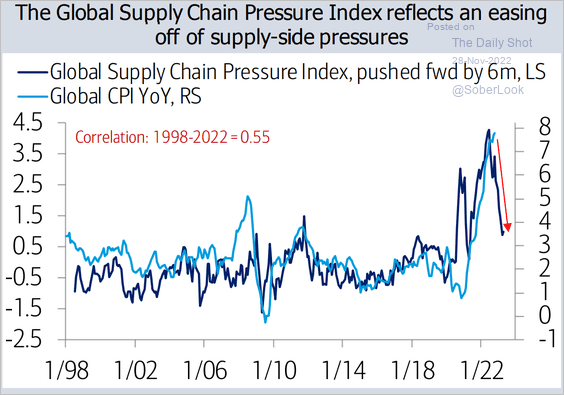 Source: BofA Global Research
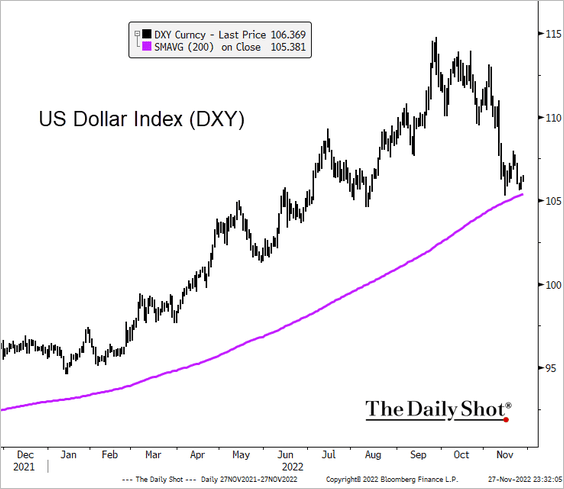
2. The dollar index held its long-term resistance, …
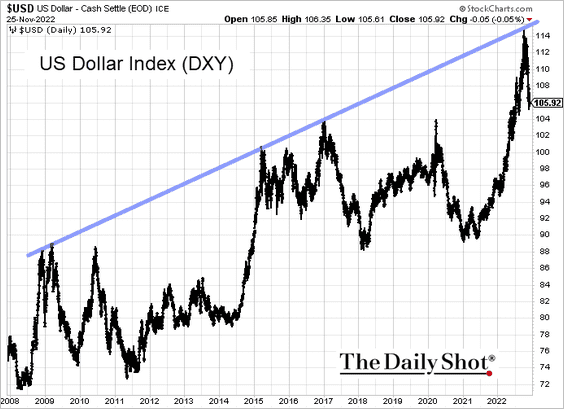
… and is now testing support at the 200-day moving average.
 Source: @TheTerminal, Bloomberg Finance L.P.
——————–
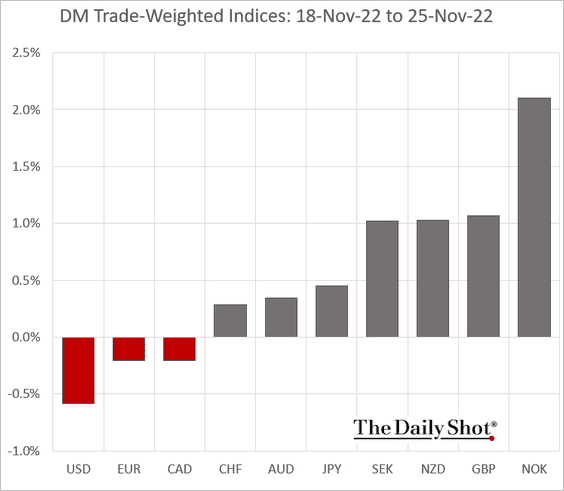
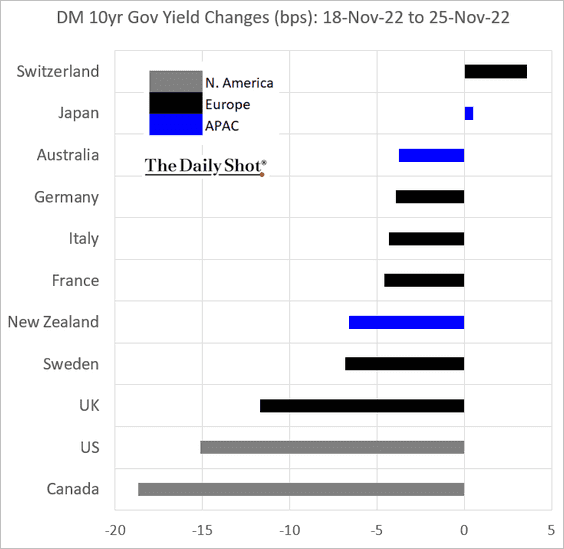
3. Next, we have some performance data from last week.
• Trade-weighted currency indices:
• Bond yields:
——————–
Food for Thought
1. Estimated US retailers’ revenues:
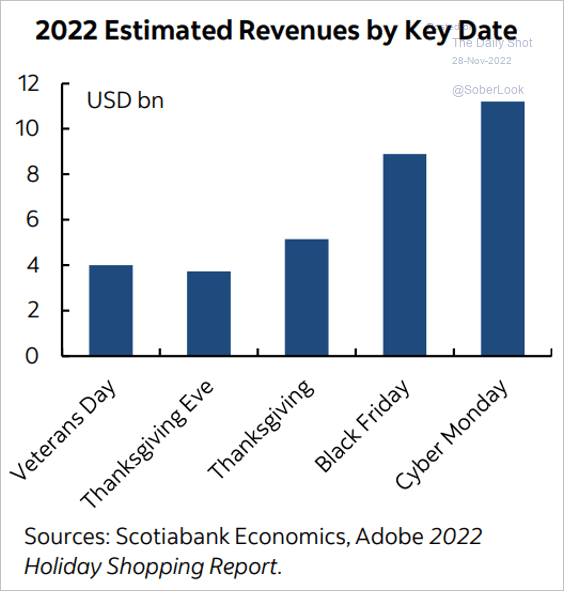 Source: Scotiabank Economics
2. Used car loan rates:
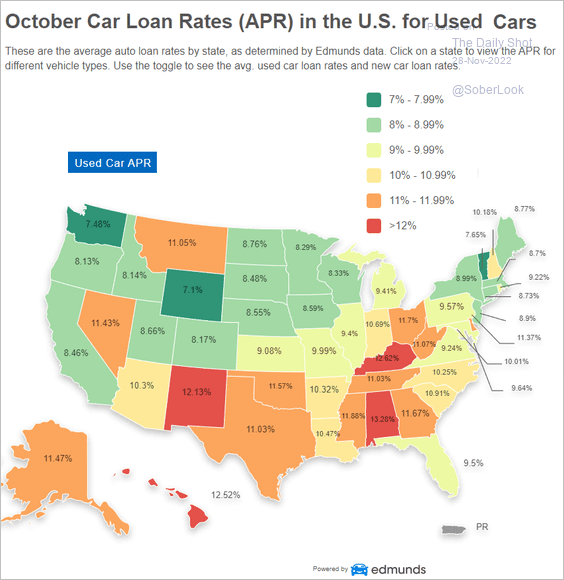 Source: Edmunds
3. Household debt per capita by state:
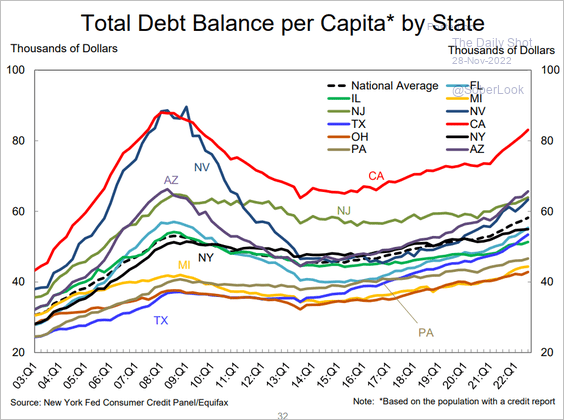 Source: Federal Reserve Bank of New York
4. War-induced price gains:
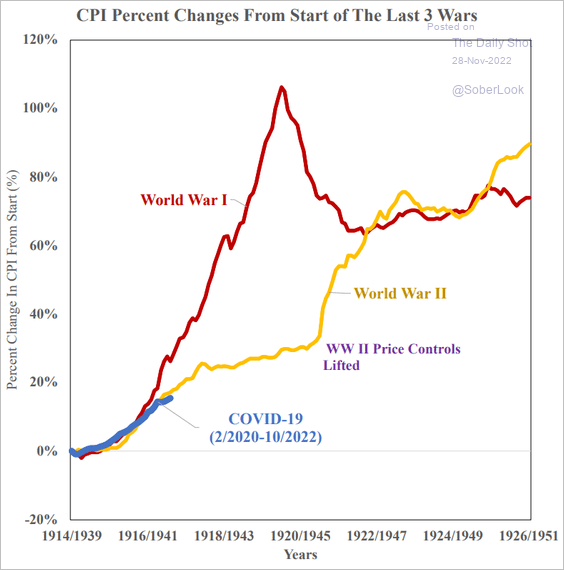 Source: SOM Macro Strategies
5. Outpatient visits to healthcare providers for influenza-like illness:
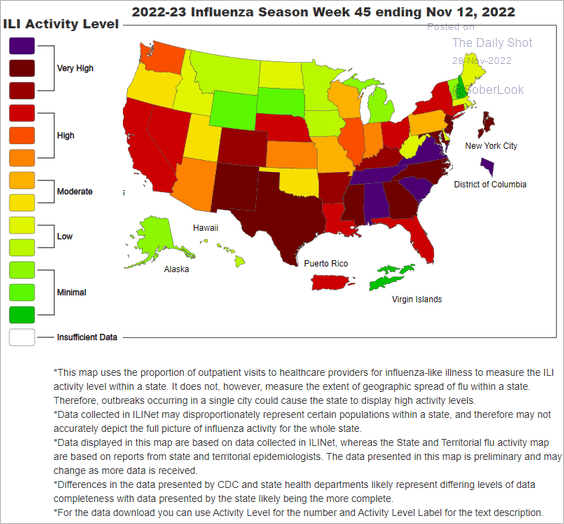 Source: CDC
6. Water supply concerns:
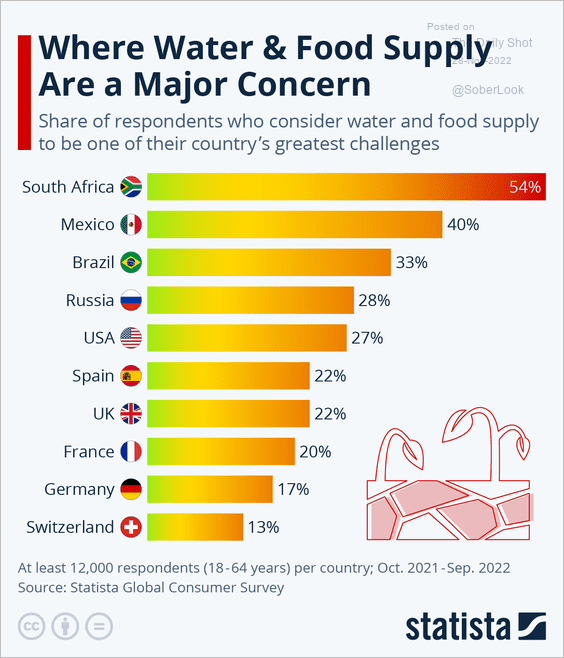 Source: Statista
7. Broadway attendance:
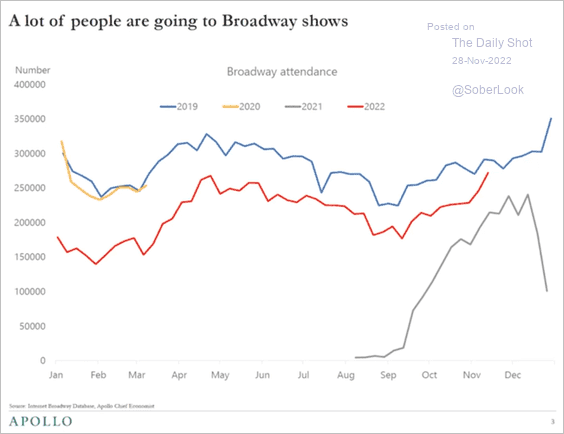 Source: Torsten Slok, Apollo
——————–
Back to Index