
The Daily Shot: 01-Dec-22
• The United States
• The United Kingdom
• The Eurozone
• Asia – Pacific
• China
• Emerging Markets
• Commodities
• Energy
• Equities
• Credit
• Rates
• Global Developments
• Food for Thought
The United States
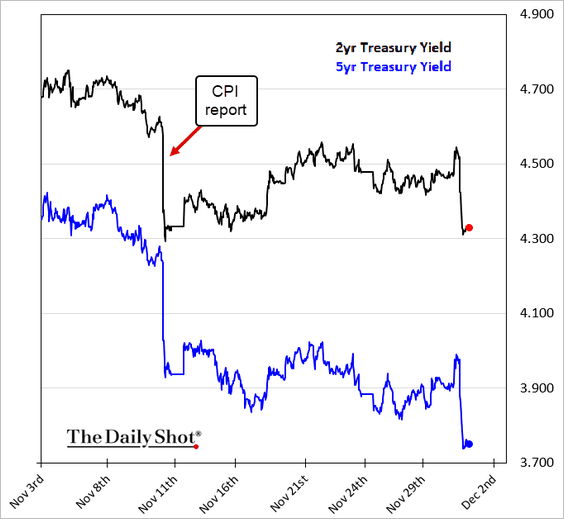
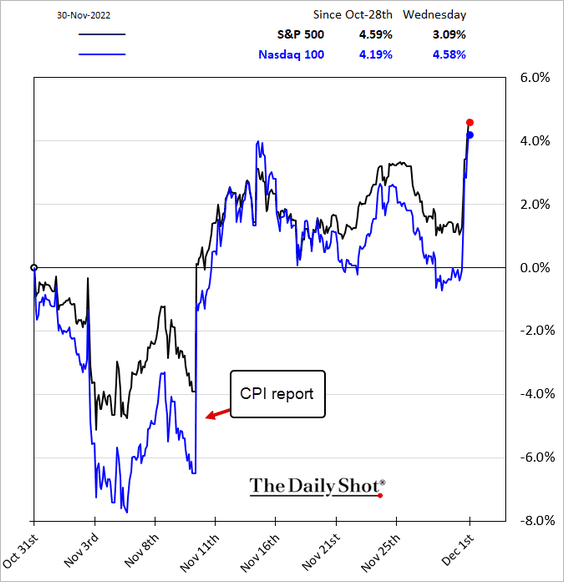
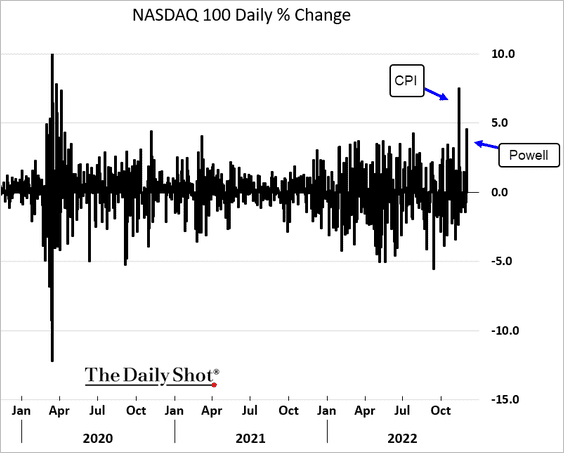
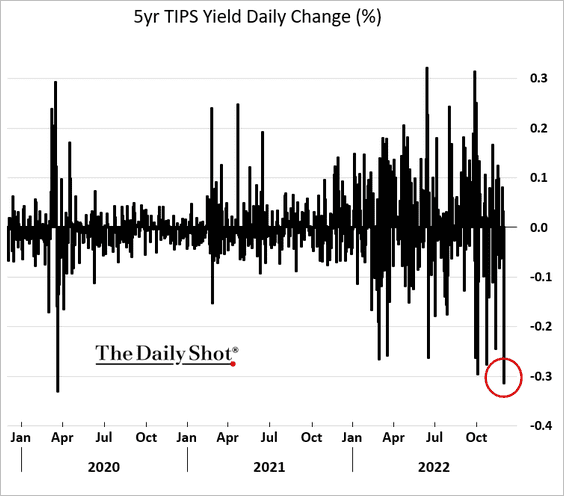
1. Markets interpreted Chair Powell’s comments as being on the dovish side.
 Source: CNBC Read full article
• Treasury yields tumbled.
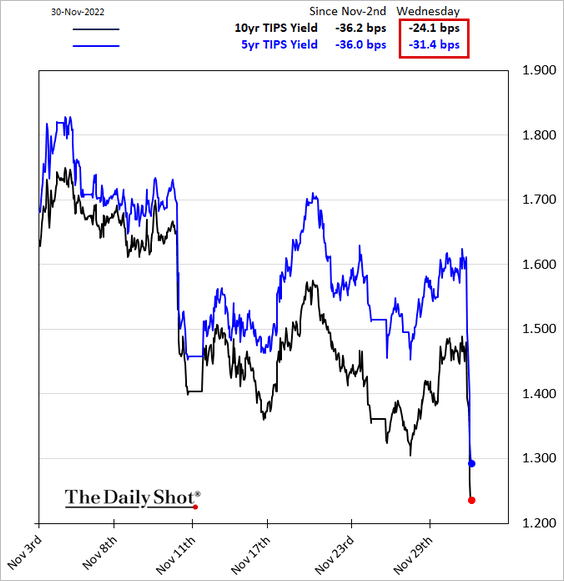
• The decline in Treasury inflation-protected bond yields (real yields) was particularly sharp.
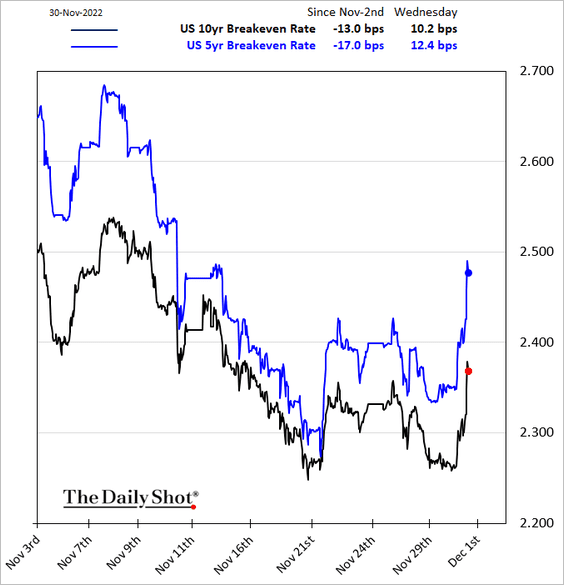
• Inflation expectations jumped.
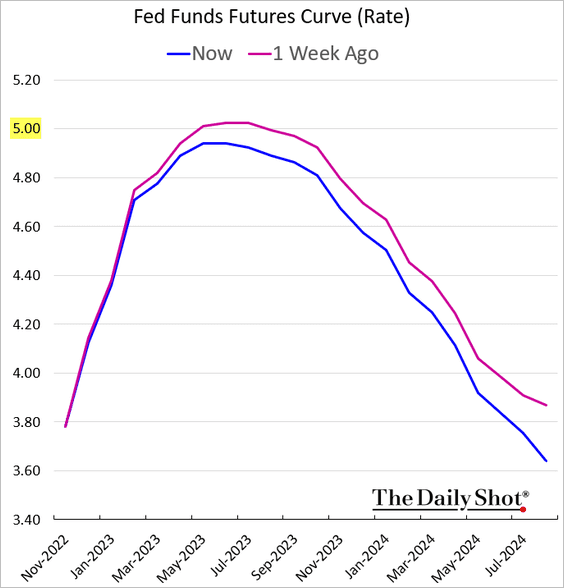
• The terminal rate dipped below 5%. Here is the market-expected fed funds rate trajectory.
• Stocks surged.
——————–
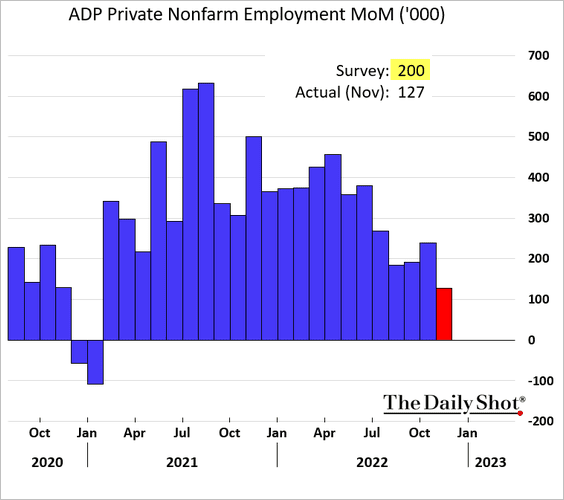
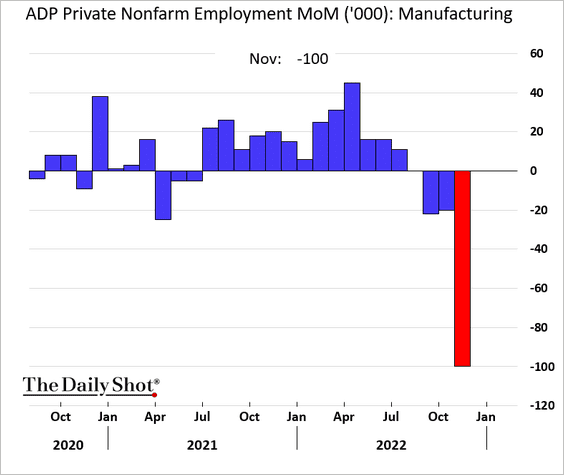
2. Stocks and bonds also got a boost from a softer-than-expected November ADP private payrolls report. Hiring appears to be slowing rapidly.
 Source: CNBC Read full article
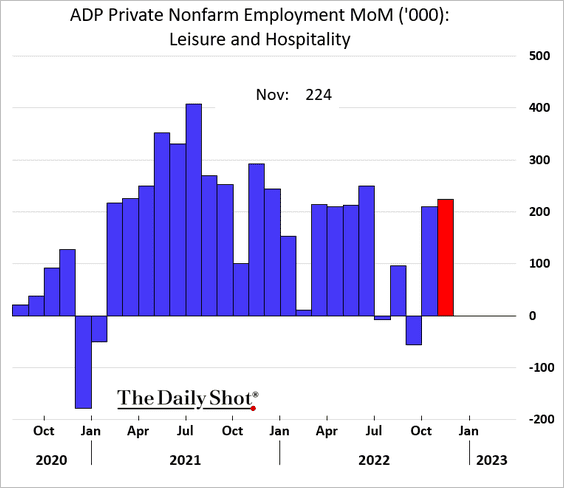
Job growth has been held up by demand from leisure and hospitality firms.
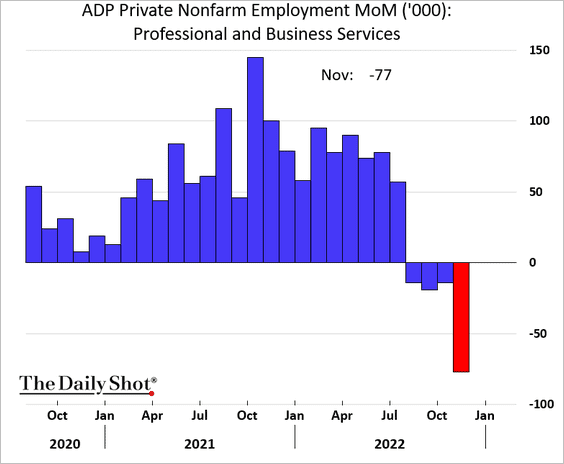
But other areas are showing some weakness.
• Professional and business services
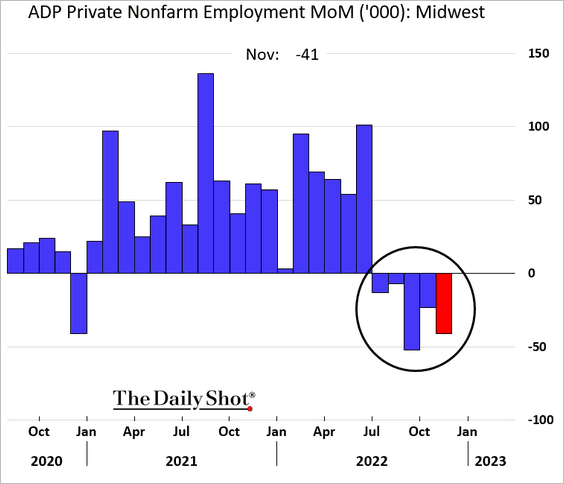
• Manufacturing:
The Midwest region has been shedding jobs for five months in a row, according to ADP.
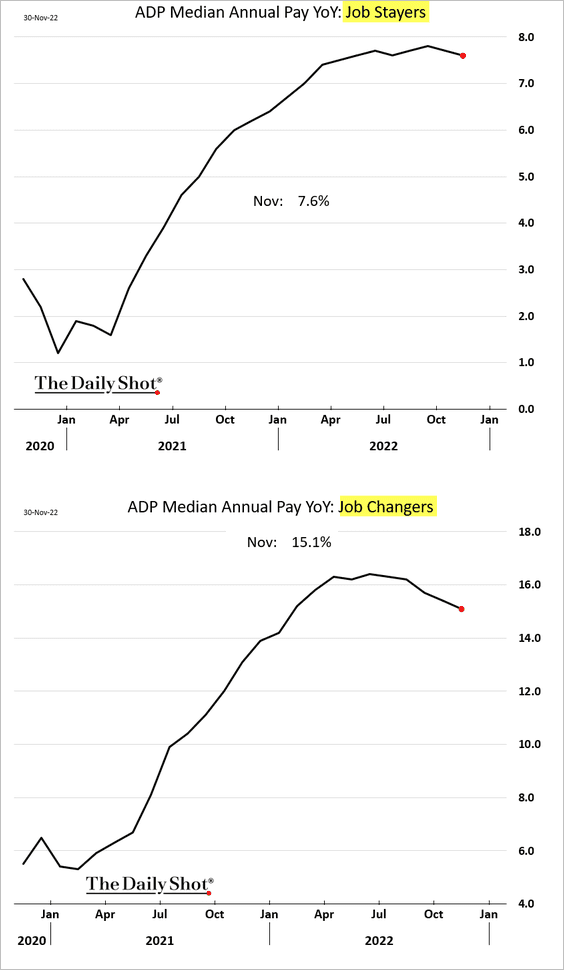
The ADP report also showed some moderation in wage growth.
Here is Morgan Stanley’s estimate for the official payrolls report on Friday.
• Payrolls:
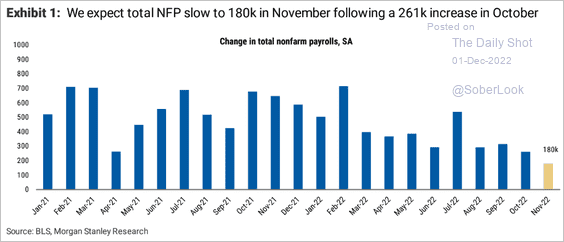 Source: Morgan Stanley Research
• The unemployment rate:
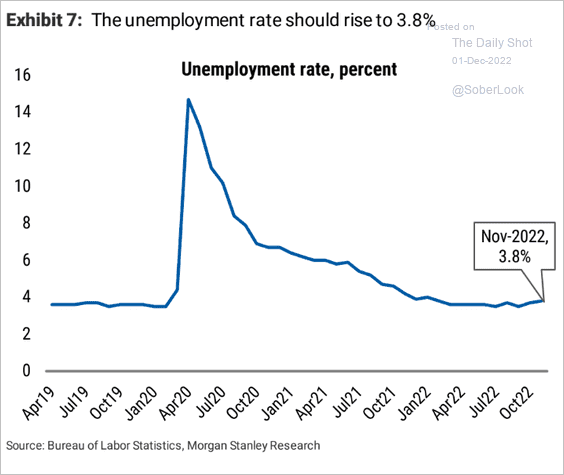 Source: Morgan Stanley Research
——————–
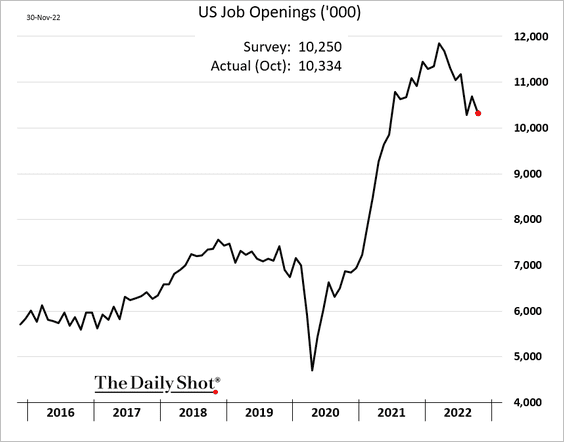
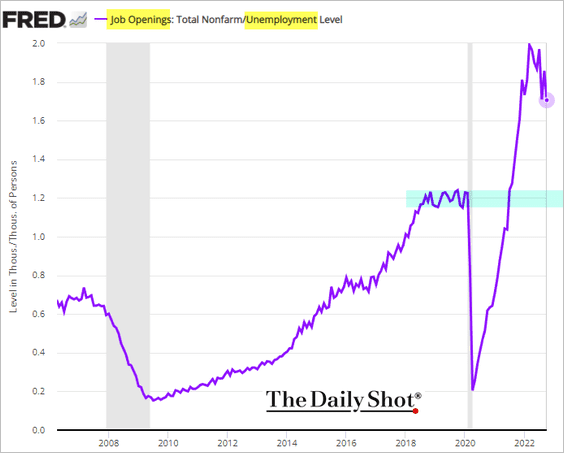
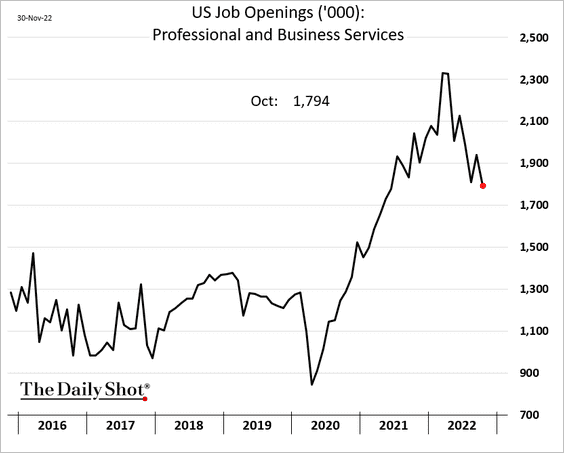
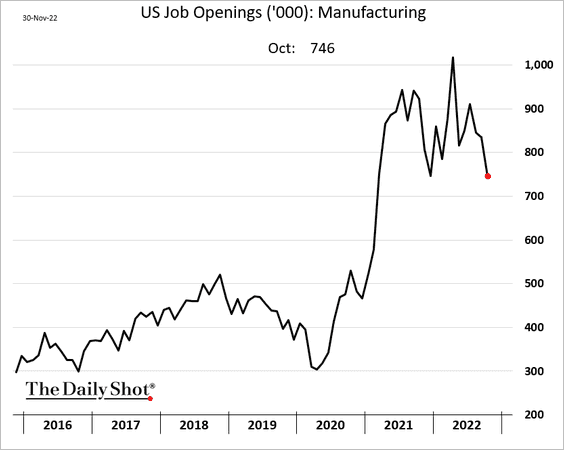
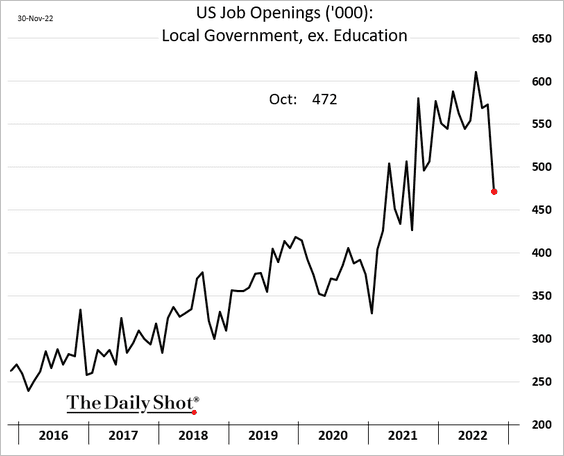
3. Job openings declined in October.
But the labor market imbalance remains acute: 1.7 job openings for every unemployed American.
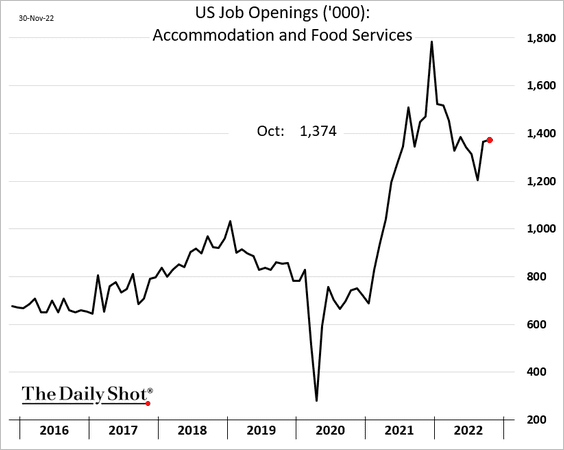
Here are some trends from the job openings report.
– Hotels, restaurants, and bars:
– Professional and business services:
– Manufacturing:
– Local government:
• This chart shows job openings by firm size.
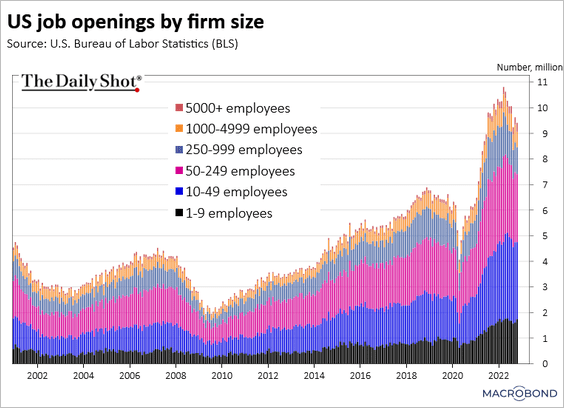 Source: Chart and data provided by Macrobond
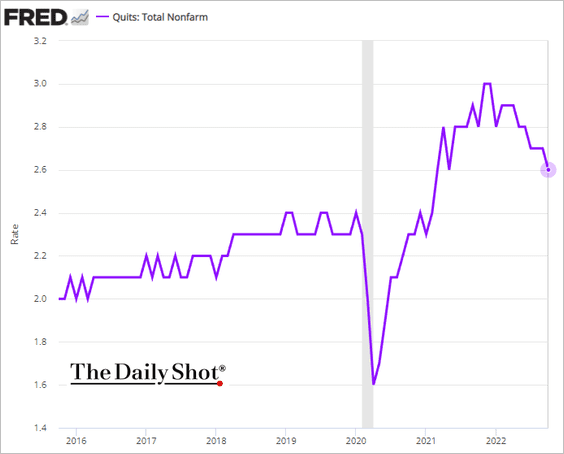
• The quits rate is moderating as the Great Resignation slows.
——————–
4. Layoffs are increasingly dominated by the tech industry.
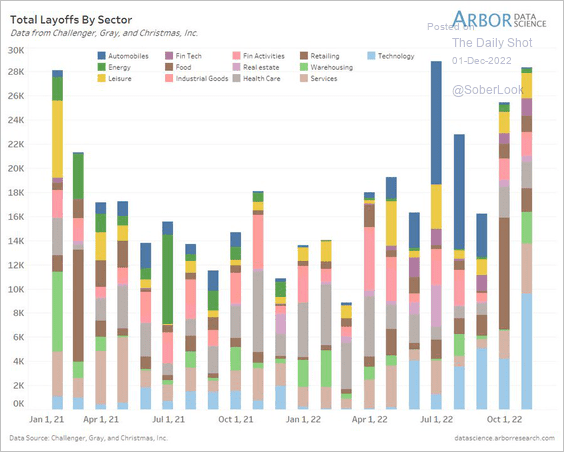 Source: @LizAnnSonders, @ChallengerGray, @DataArbor
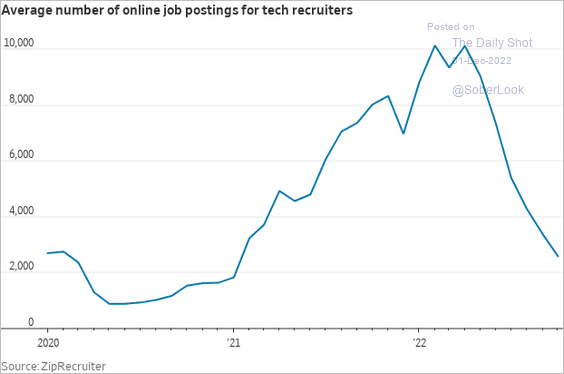
Tech recruiters are posting fewer jobs.
 Source: @WSJ Read full article
——————–
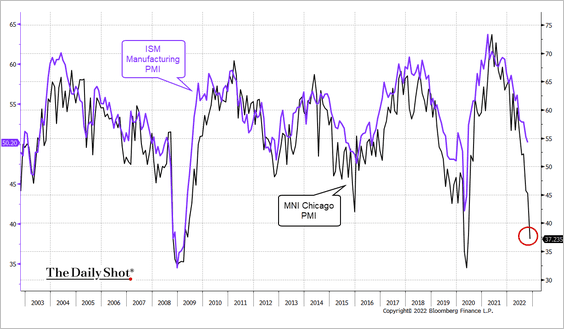
5. Chicago-area manufacturing activity is plunging, …
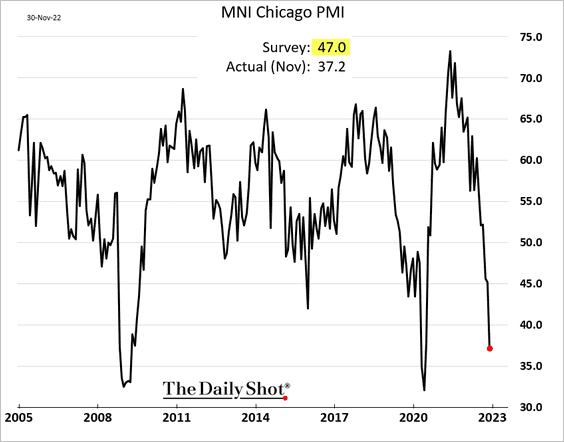
 Source: MarketWatch Read full article
… signaling a significant slowdown at the national level.
——————–
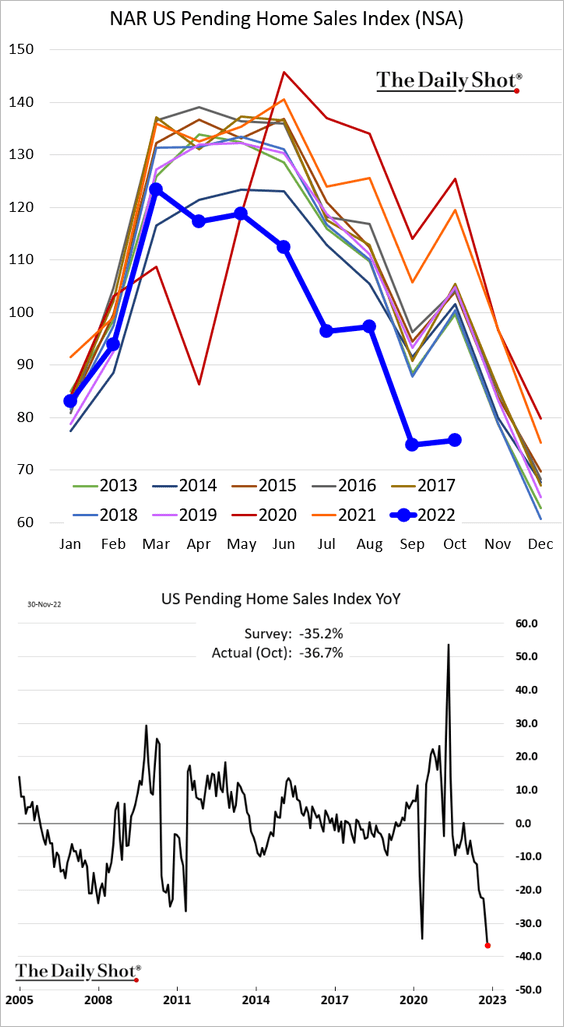
6. Pending home sales are down almost 37% from a year ago.
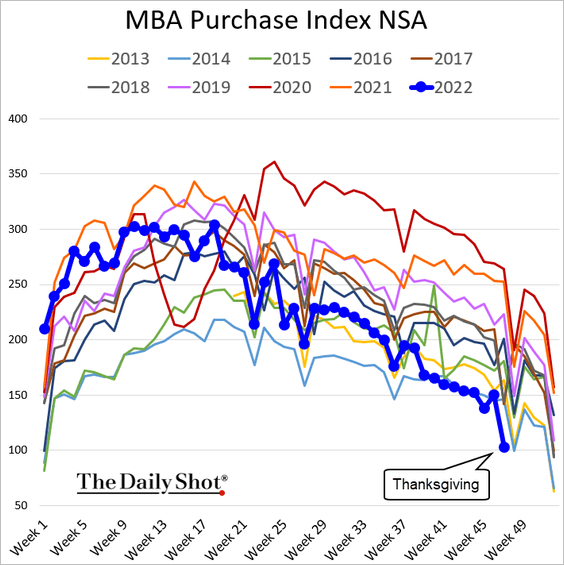
Mortgage applications remain soft.
——————–
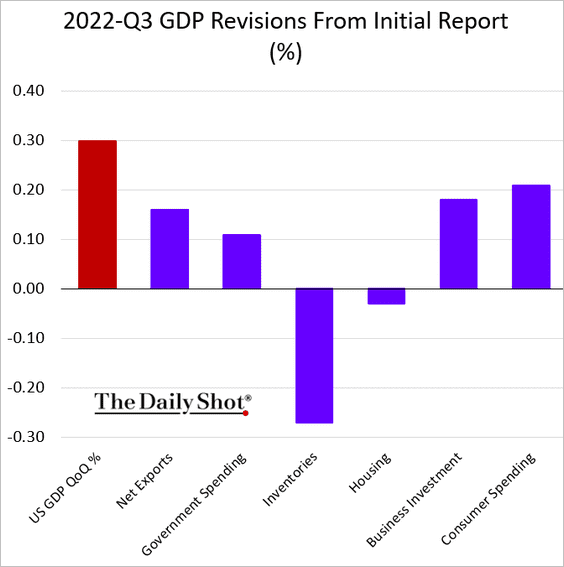
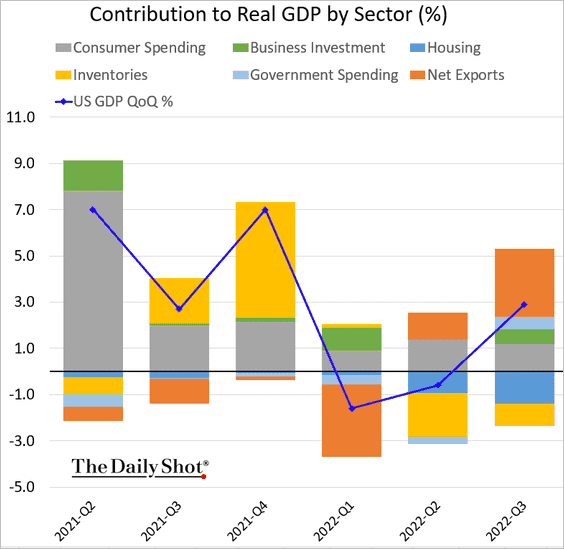
7. The Q3 GDP growth has been adjusted higher from the first report.
——————–
8. The Fed’s Beige Book showed a more cloudy outlook for the economy. Here is the Beige Book sentiment index.
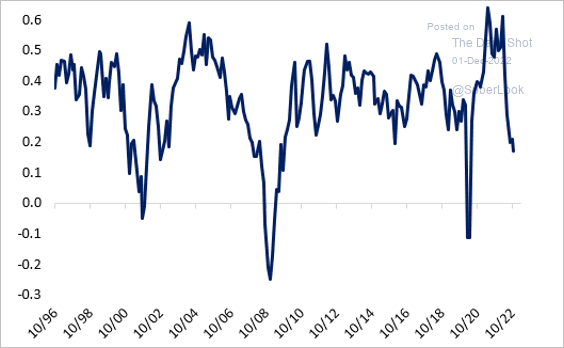 Source: @pearkes
There is less concern about supply stress.
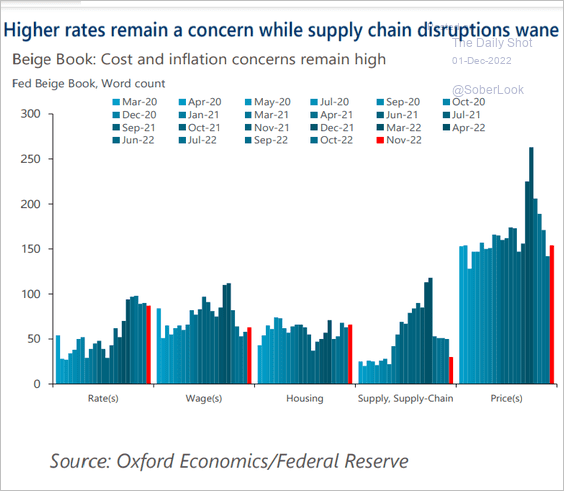 Source: Oxford Economics
Back to Index
The United Kingdom
1. Business investment in the UK has been soft relative to other economies.
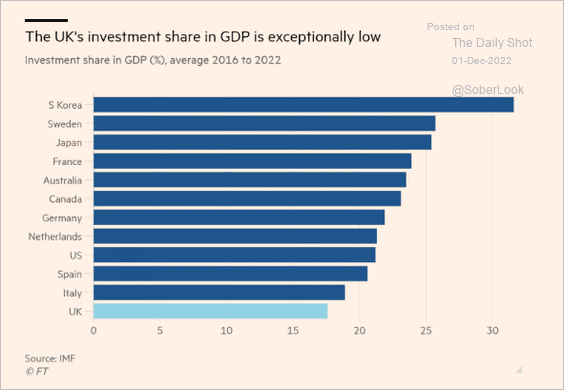 Source: @financialtimes Read full article
2. It will take three years for the economy to get back to pre-COVID levels after the current downturn, according to Deutsche Bank.
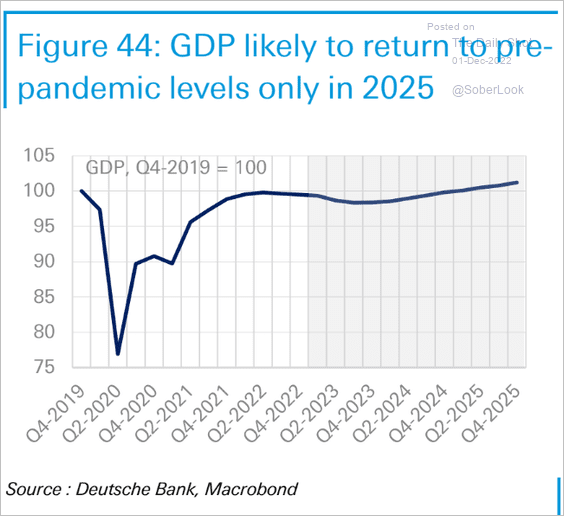 Source: Deutsche Bank Research
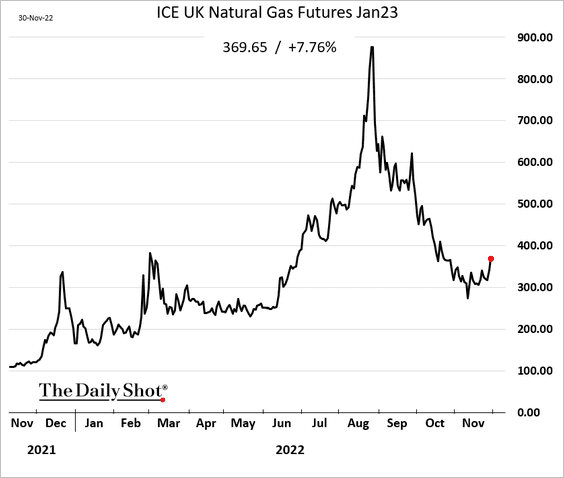
3. Natural gas prices are rising again.
4. Hospital treatment delays continue to worsen.
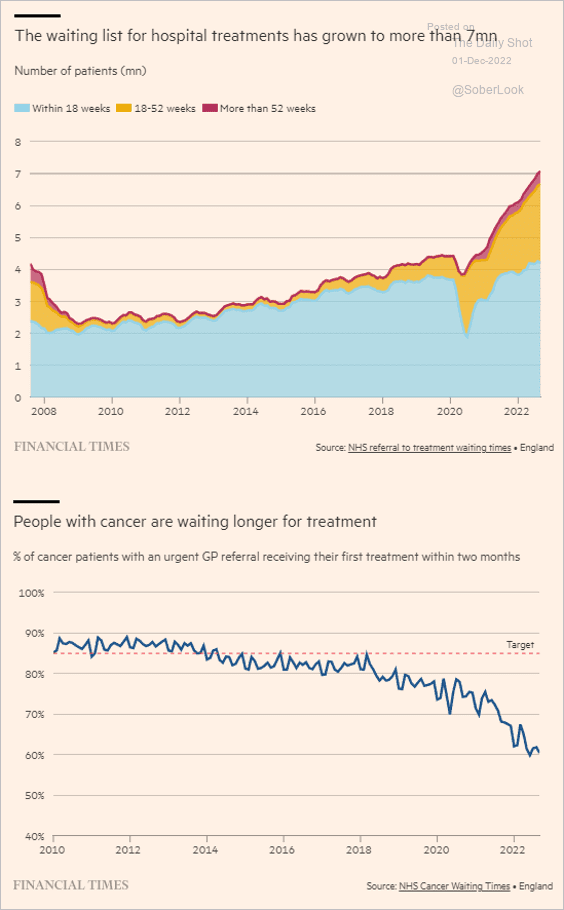 Source: @financialtimes Read full article
Back to Index
The Eurozone
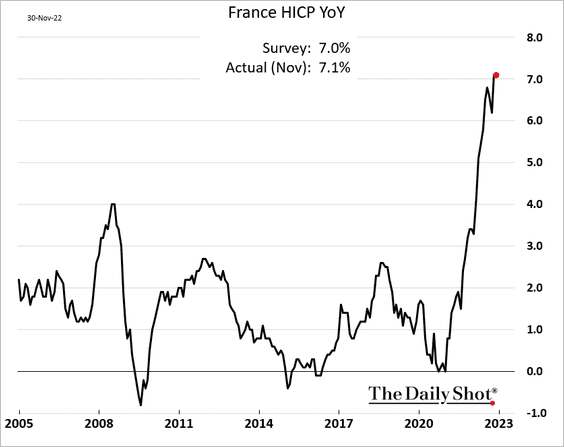
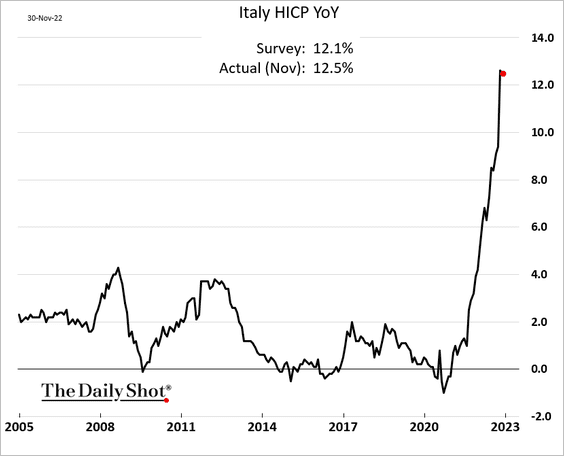
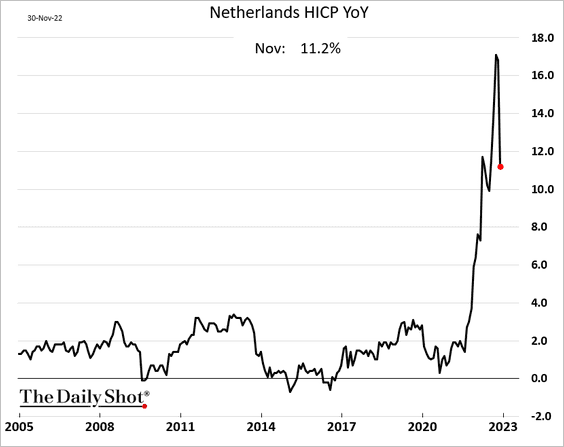
1. As we saw yesterday, the headline euro-area CPI ticked lower in November. Here are some additional updates on inflation.
• France (not budging yet):
• Italy (a minuscule decline):
• The Netherlands (a large drop):
Here is the contribution of energy to the headline CPI forecast (from Goldman).
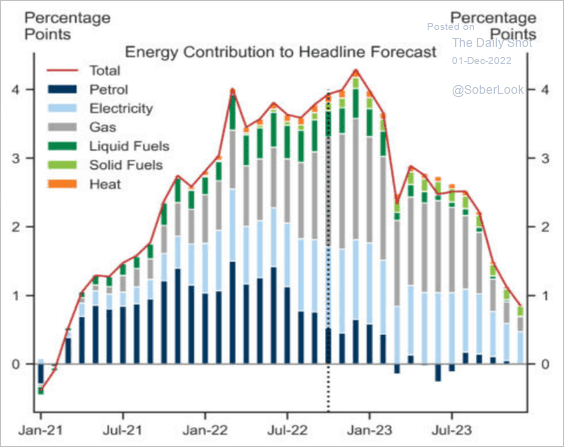 Source: Goldman Sachs
——————–
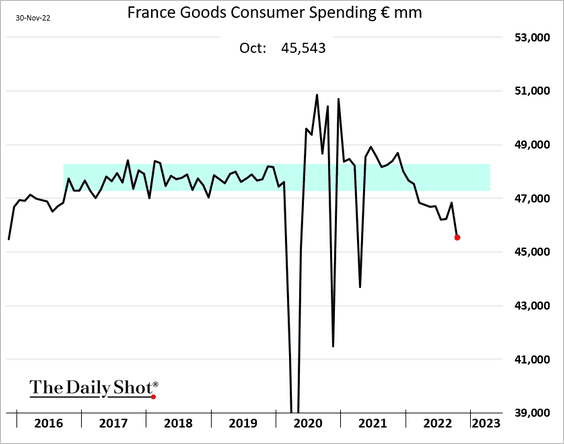
2. French consumer spending on goods has been deteriorating.
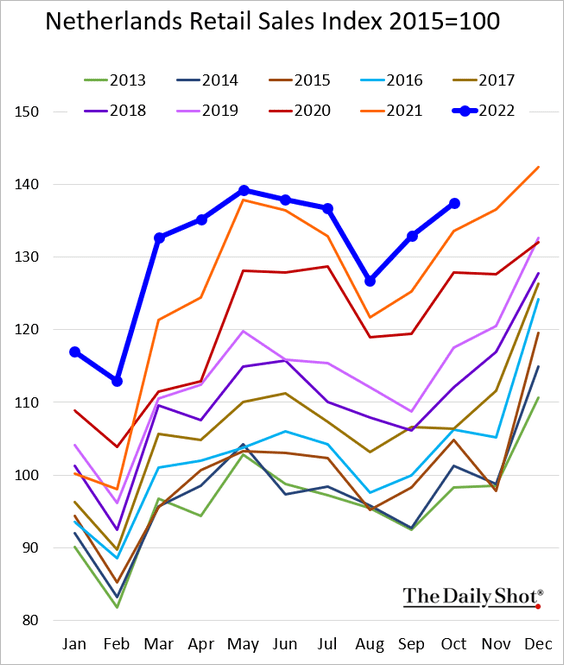
3. Dutch retail sales have been holding up.
4. Spain’s tourism is back to pre-COVID levels.
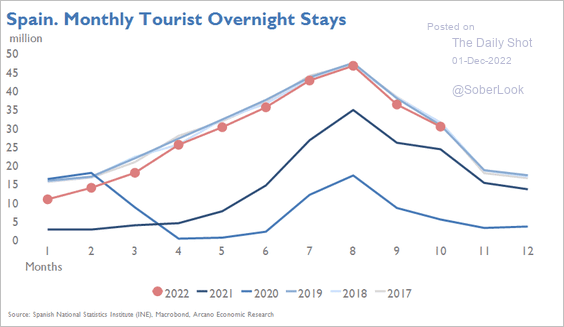 Source: Arcano Economics
5. Sweden’s PMI data is signaling more manufacturing weakness in the Eurozone.
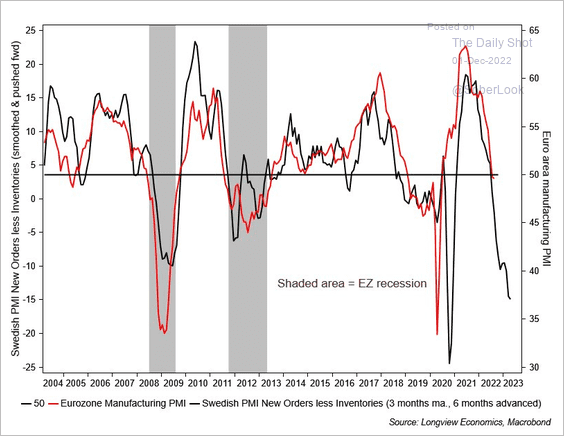 Source: Longview Economics
6. The Eurozone is heavily exposed to China’s economy.
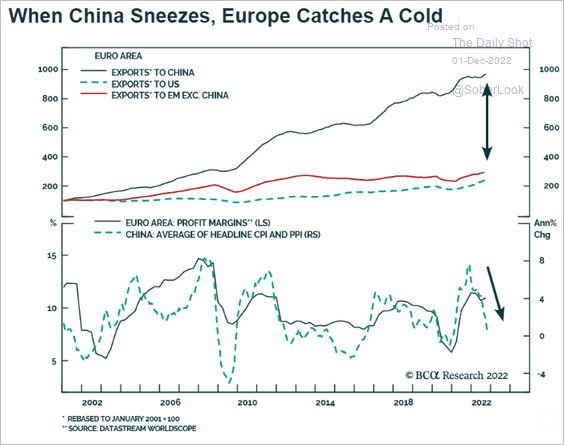 Source: BCA Research
Back to Index
Asia – Pacific
1. South Korea’s factory activity declined at a slower pace in November.
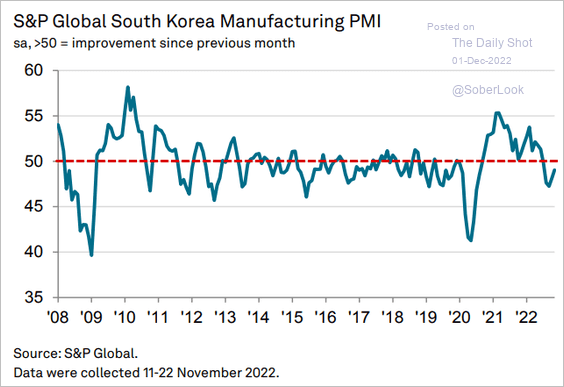 Source: S&P Global PMI
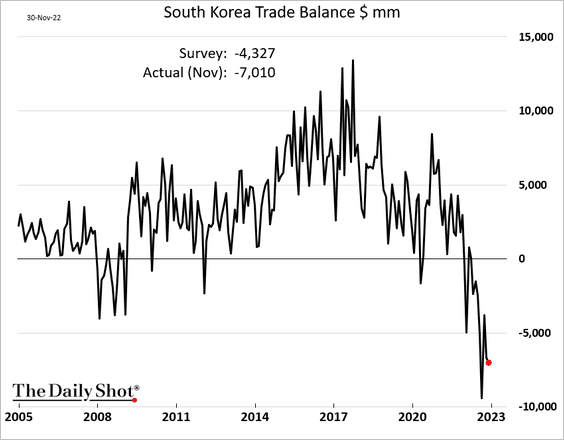
The trade deficit remains near record.
——————–
2. Taiwan’s factory activity is shrinking rapidly.
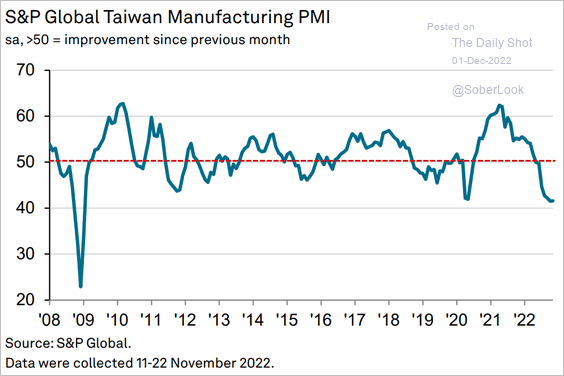 Source: S&P Global PMI
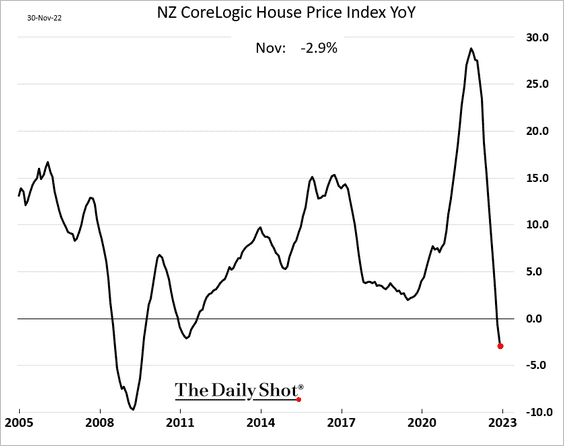
3. New Zealand’s home price declines are accelerating.
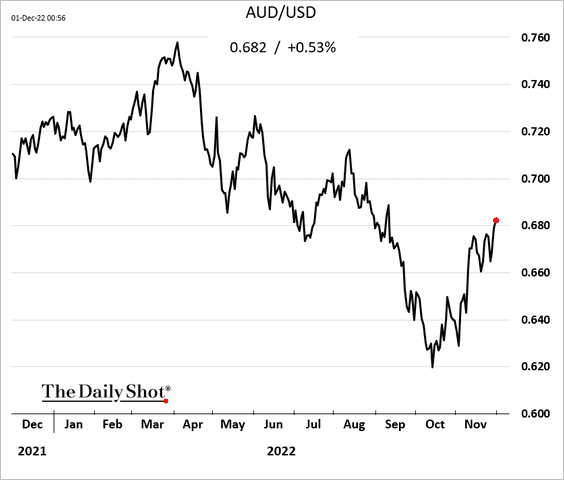
4. The Aussie dollar is rebounding as risk appetite improves globally.
Back to Index
China
1. S&P Global’s manufacturing index showed a less severe contraction than what we saw in the official PMI report.
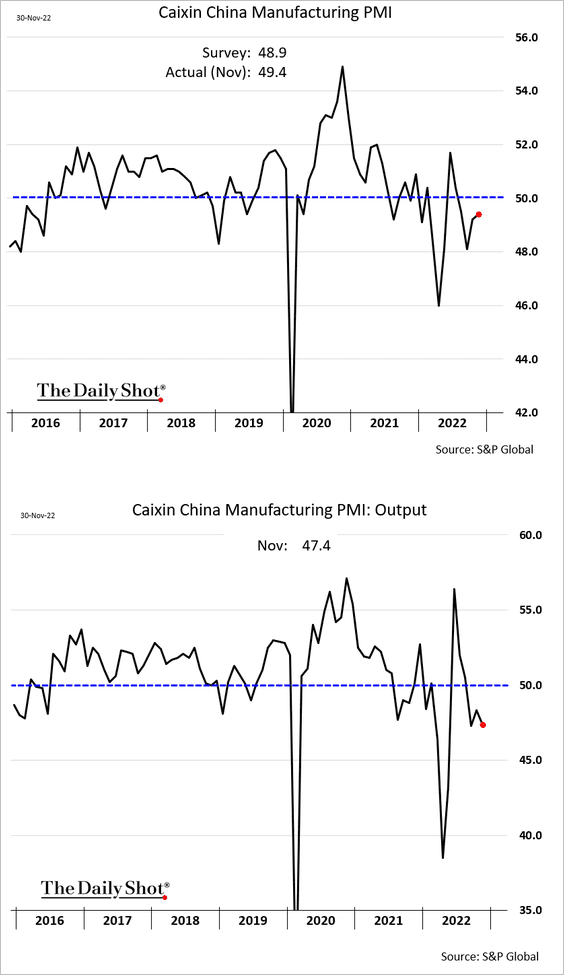
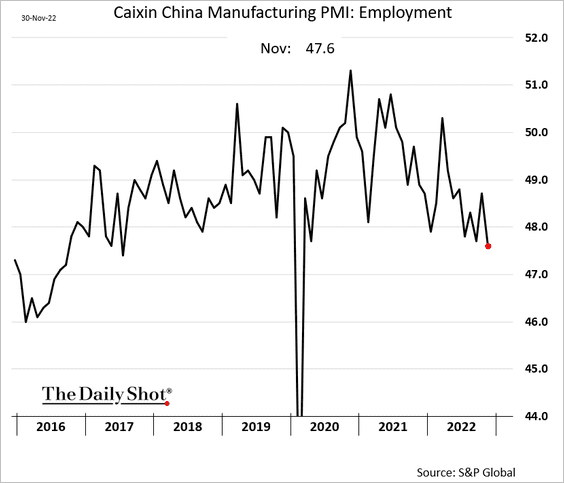
Factory employment appears to be shrinking.
——————–
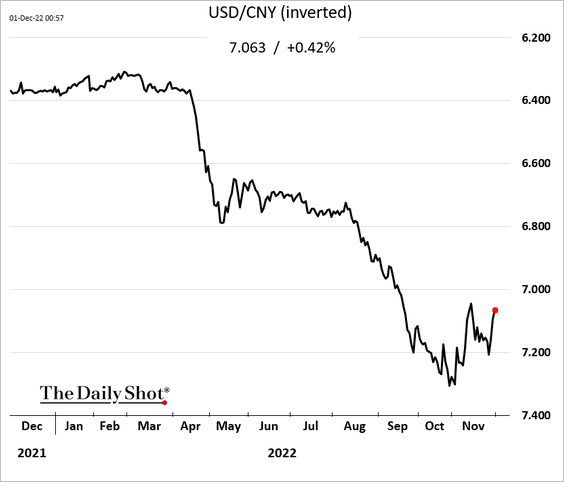
2. The renminbi is making another rebound attempt.
3. Greater China’s direct investment in the US has faced new restrictions amid political tensions.
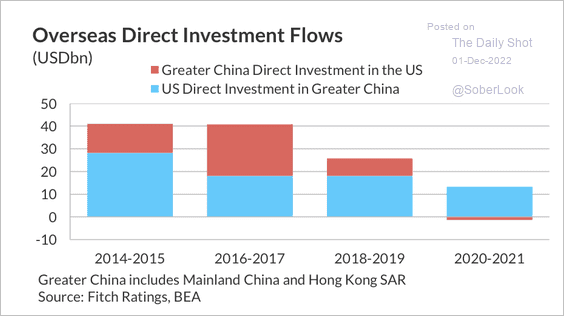 Source: Fitch Ratings
US overseas direct investment into greater China has slowed but is on track to partially recover this year. There are also signs of disinvestment from Hong Kong.
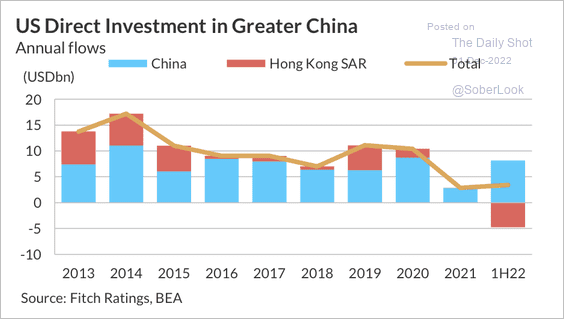 Source: Fitch Ratings
Back to Index
Emerging Markets
1. ASEAN manufacturing growth is stalling. Here are some PMI trends.
• ASEAN:
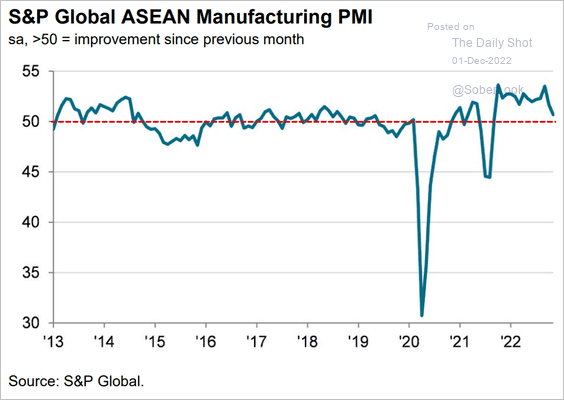 Source: S&P Global PMI
• Indonesia:
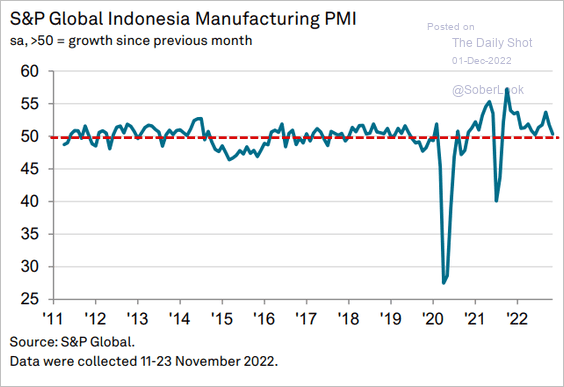 Source: S&P Global PMI
• Malaysia (faster contraction):
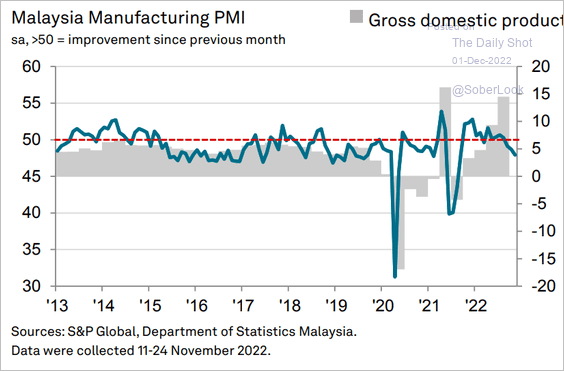 Source: S&P Global PMI
• The Philippines (still growing):
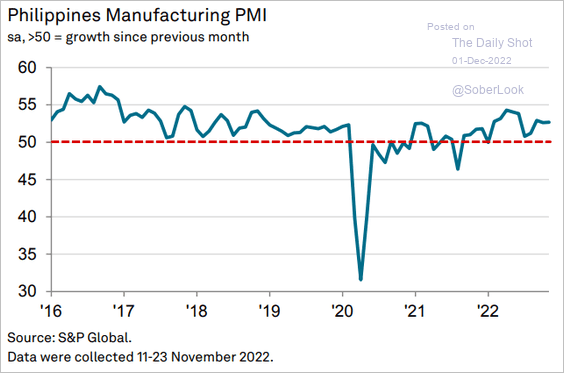 Source: S&P Global PMI
• Thailand:
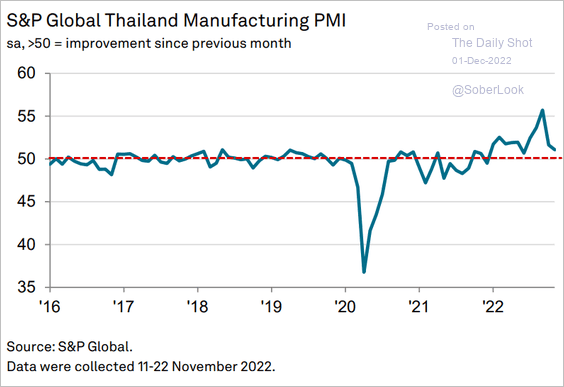 Source: S&P Global PMI
• Vietnam (contracting):
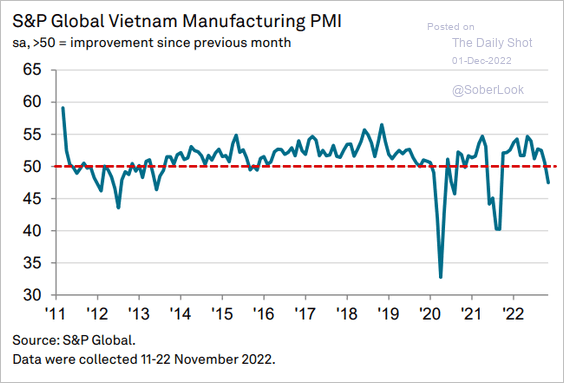 Source: S&P Global PMI
——————–
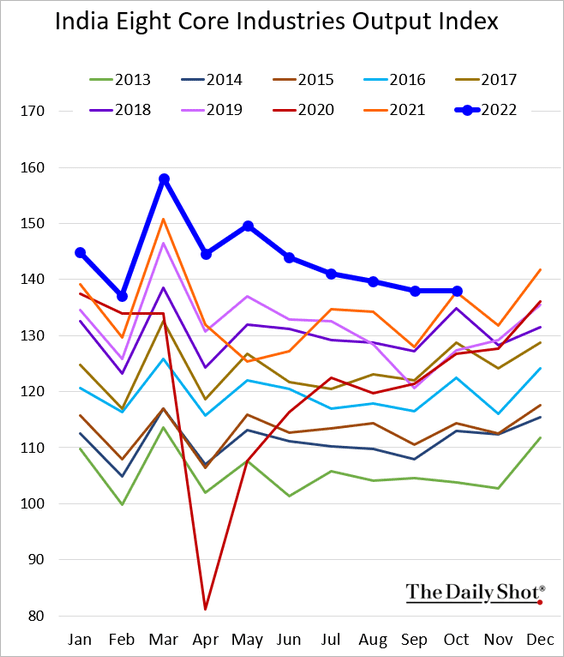
2. Here are some updates on India.
• Industrial output is slowing.
• The PMI report shows robust growth in manufacturing activity.
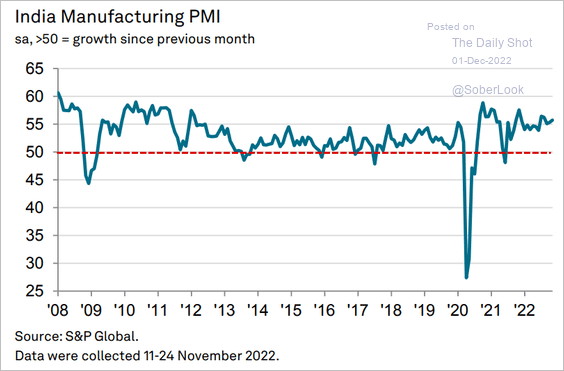 Source: S&P Global PMI
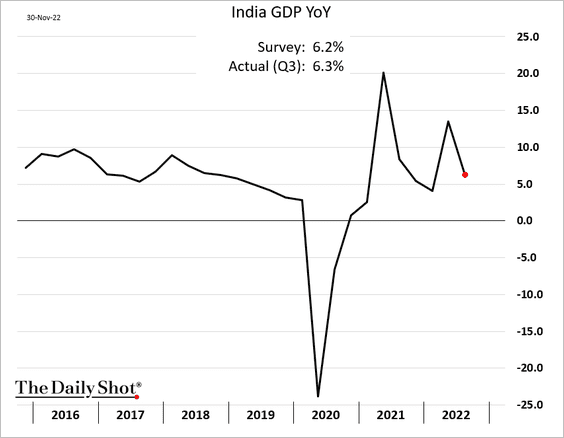
• The Q3 GDP growth was roughly in line with expectations.
Here is the breakdown by sector.
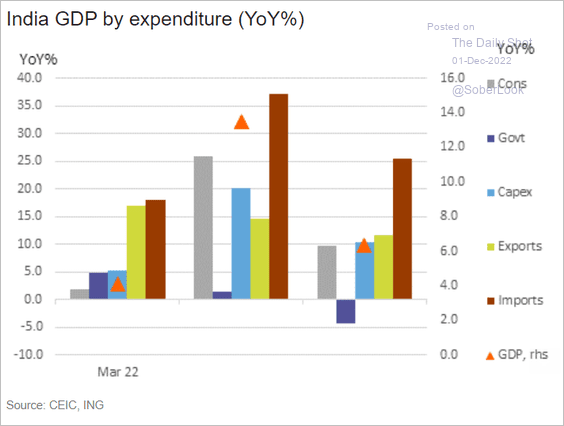 Source: ING
——————–
3. There is political trouble in South Africa.
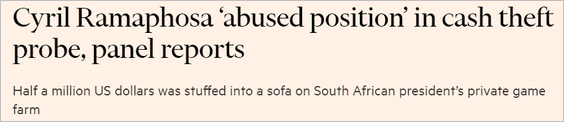 Source: @financialtimes Read full article
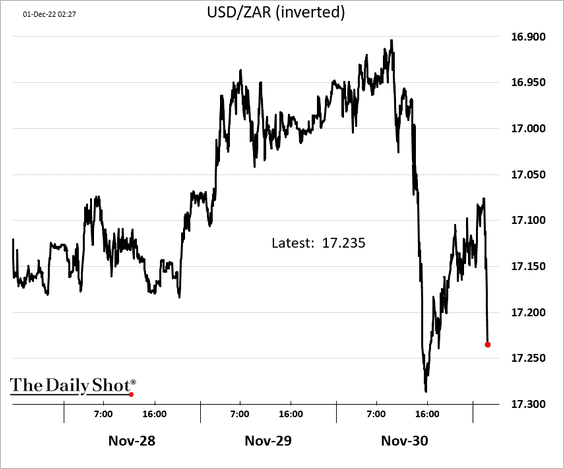
The rand declined.
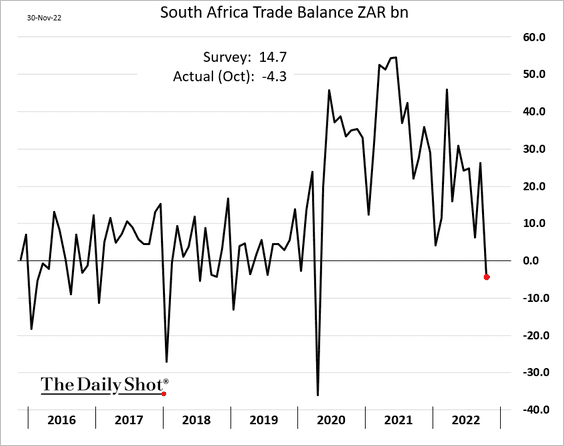
Separately, South Africa’s trade balance unexpectedly swung into deficit in October.
——————–
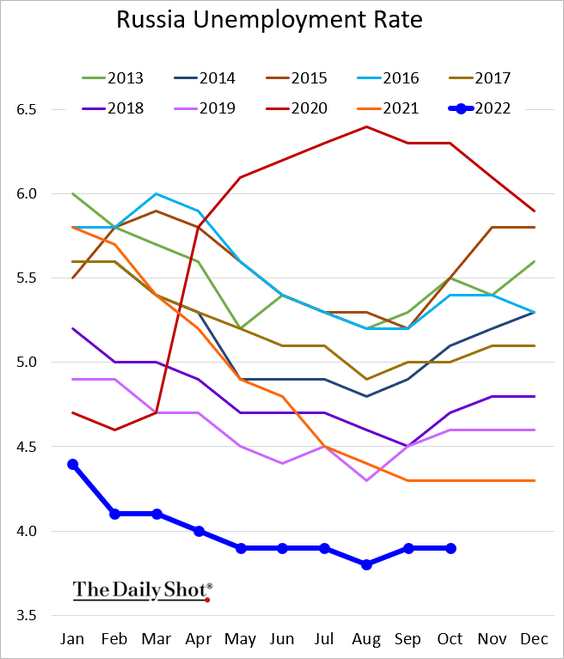
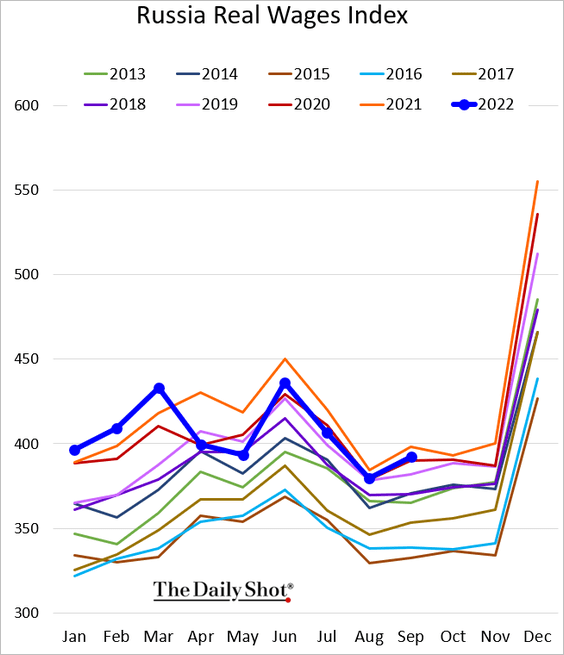
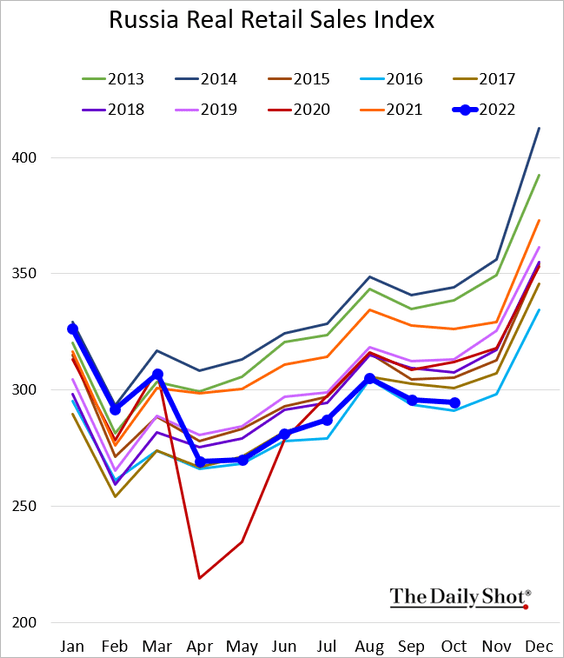
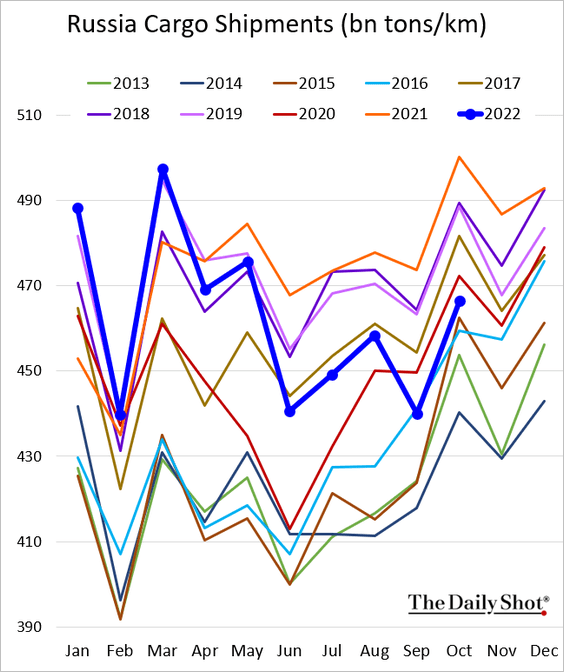
4. Next, we have some updates on Russia.
• The PMI report shows robust factory activity.
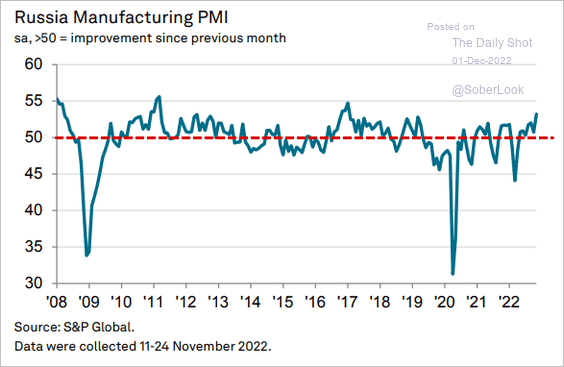 Source: S&P Global PMI
• Here are some trends reported by the government.
– The unemployment rate:
– Wages:
– Retail sales:
– Cargo shipments:
——————–
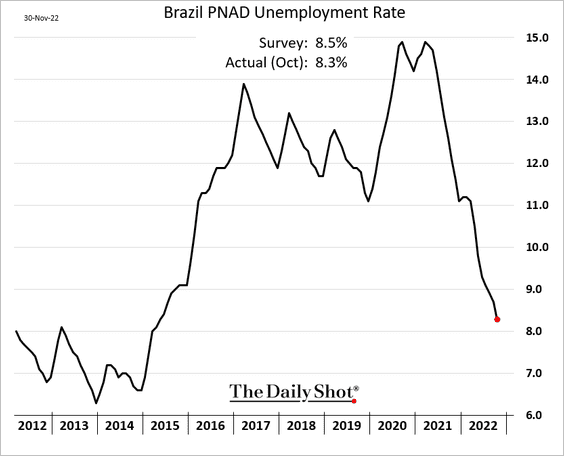
5. Brazil’s unemployment continues to decline.
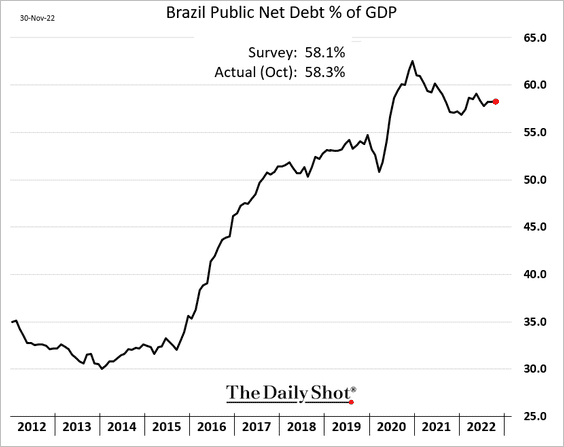
Here is Brazil’s debt-to-GDP ratio.
——————–
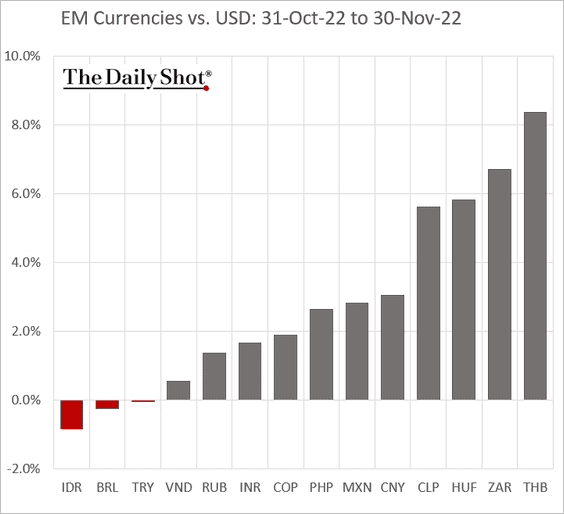
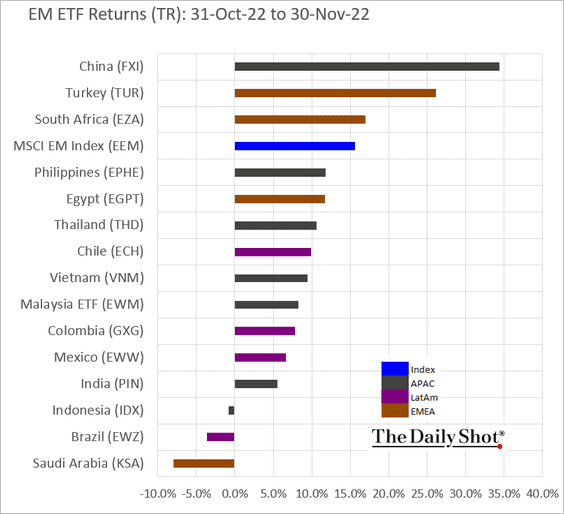
6. Finally, we have some performance data for November.
• Currencies:
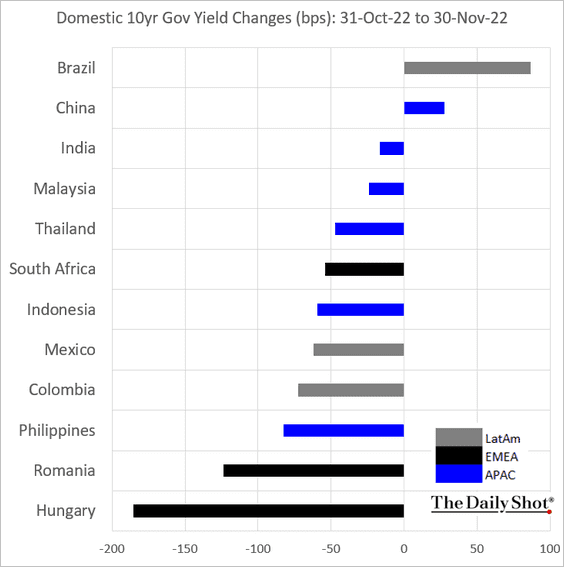
• Bond yields:
• Equity ETFs:
Back to Index
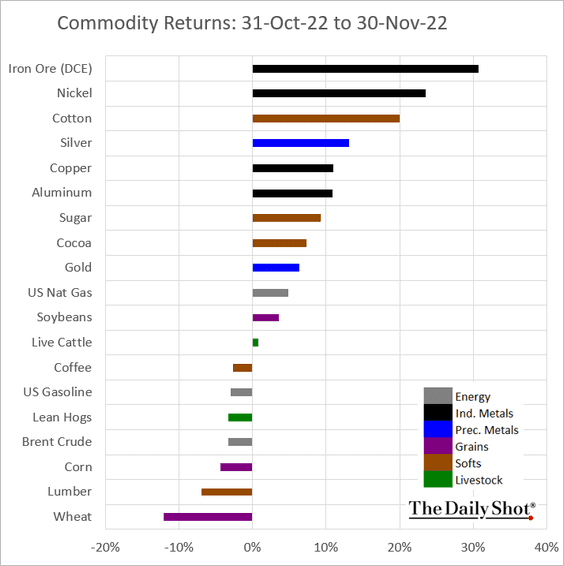
Commodities
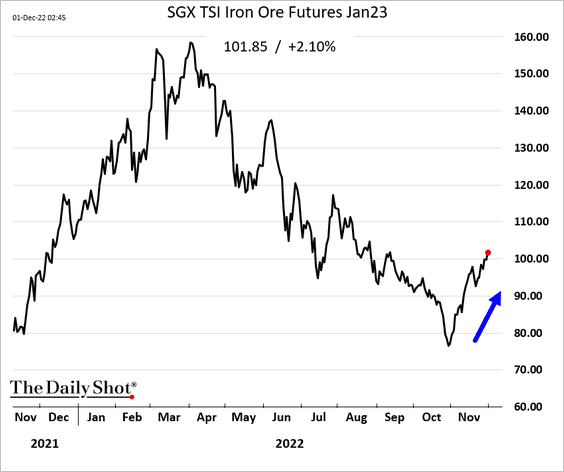
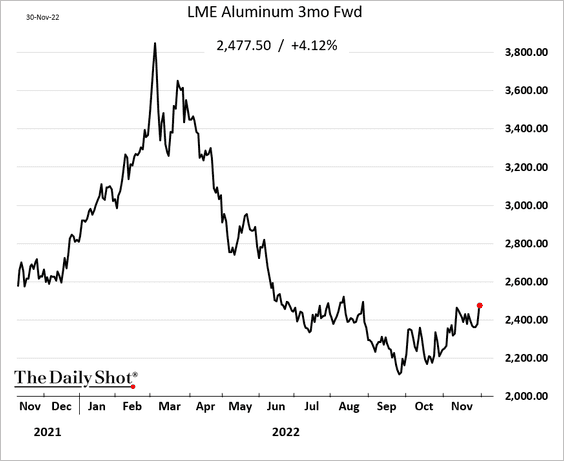
1. Industrial commodities are waking up amid hopes for China’s reopening.
• Iron ore:
• Aluminum:
——————–
2. This chart shows gold bar and coin investments globally.
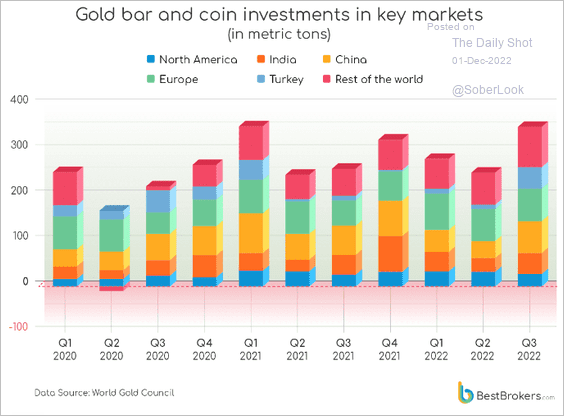 Source: Best Brokers Read full article
3. Next, we have November performance data across key commodity markets.
Back to Index
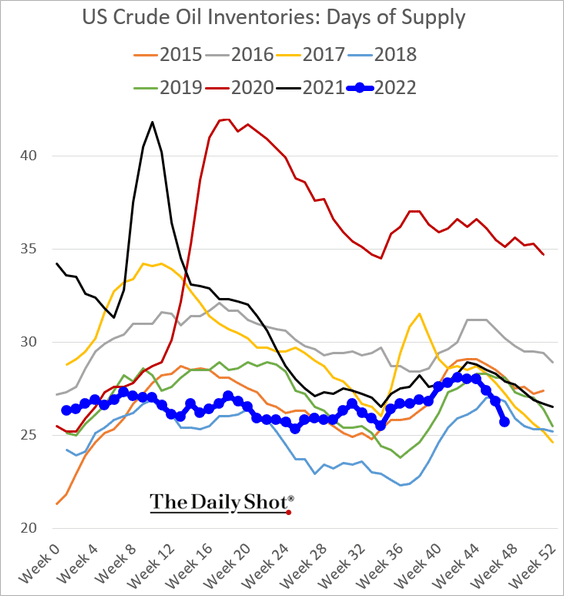
Energy
1. US oil inventories are back at multi-year lows (and this does not include SPR).
– Days of supply:
– Barrels:
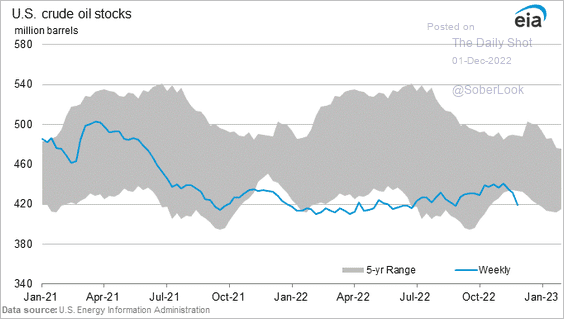 Source: @EIAgov
– “Excess” inventories:
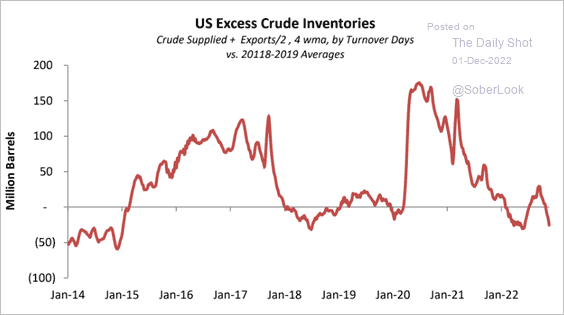 Source: Princeton Energy Advisors
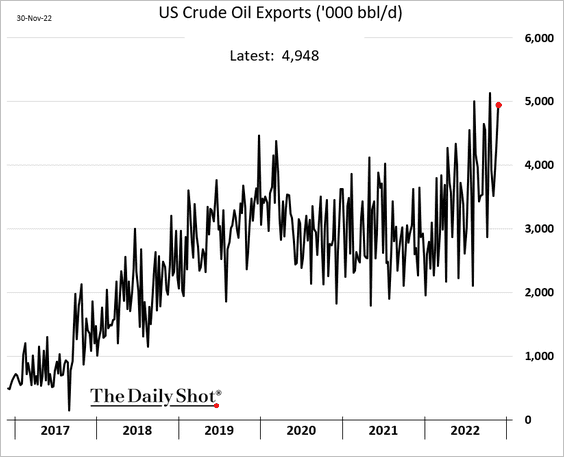
• Robust crude exports are one reason for the drawdown in US oil stocks.
This chart shows US net imports.
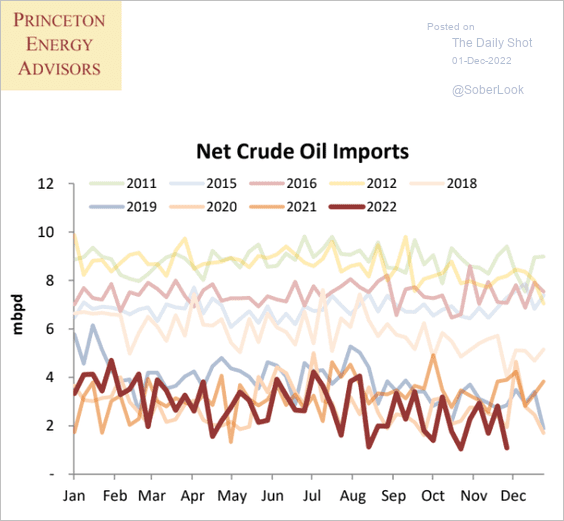 Source: Princeton Energy Advisors
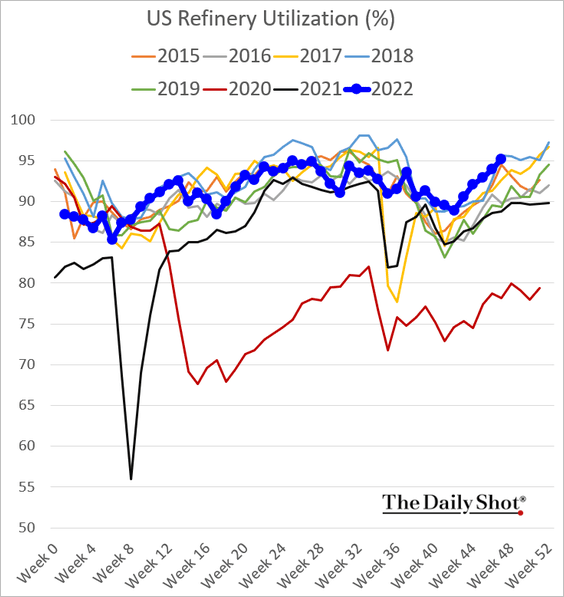
• Elevated refinery utilization has also been pulling oil inventories lower.
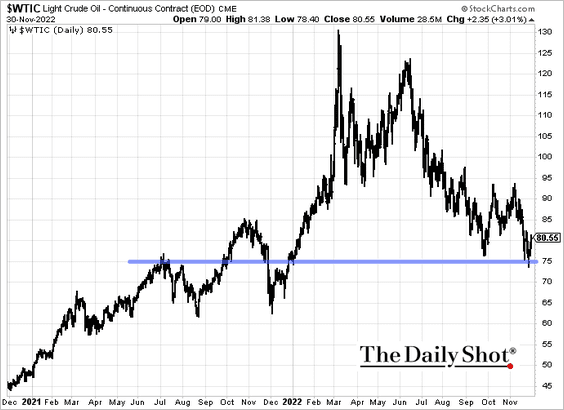
• Crude prices bounced from recent lows.
——————–
2. US gasoline inventories are rebounding …
– Barrels:
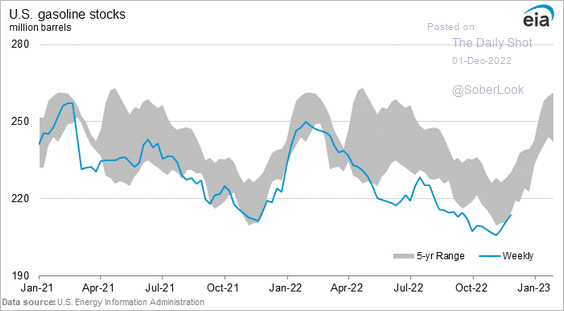 Source: @EIAgov
– Days of supply:
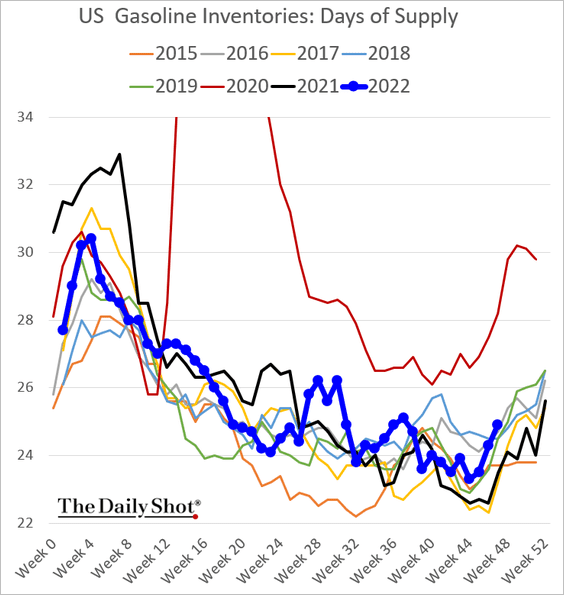
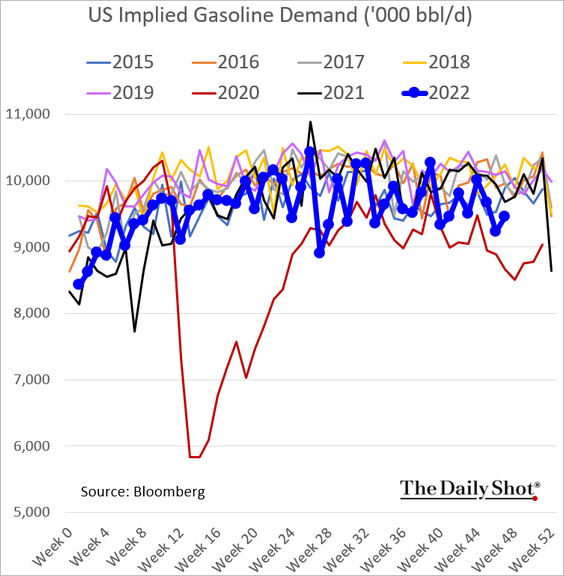
… amid relatively soft demand.
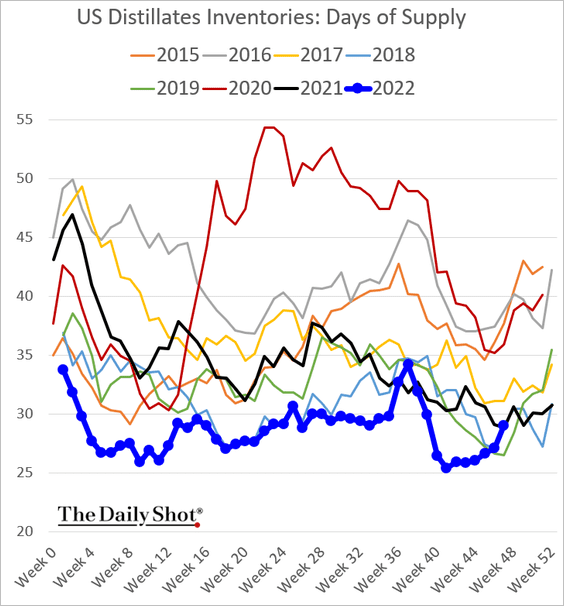
3. Distillates inventories also appear to be recovering.
– Barrels:
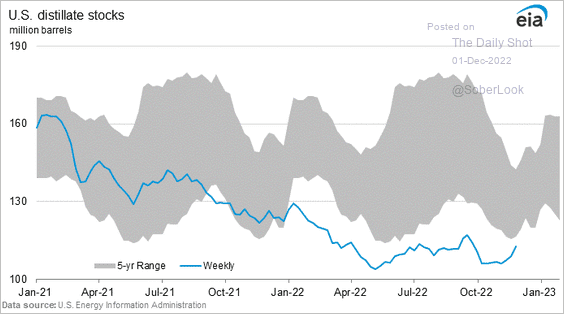 Source: @EIAgov
– Days of supply:
Jet fuel inventories are still at multi-year lows.
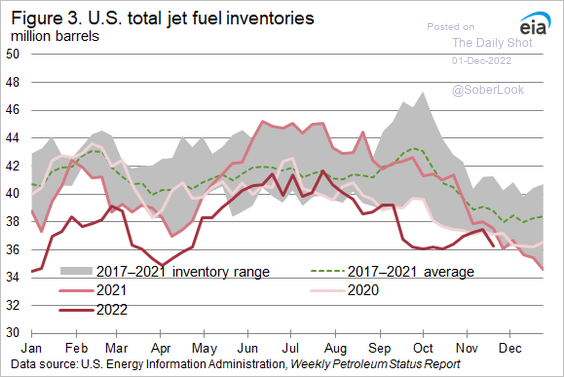 Source: @EIAgov
——————–
4. US propane inventories are near five-year highs, which should help with heating bills in some rural areas.
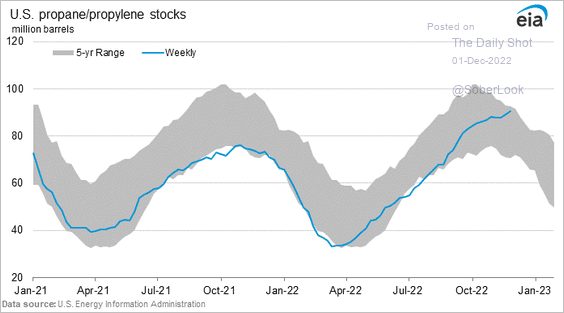 Source: @EIAgov
5. This chart shows OPEC crude oil production cut scenarios from Longview Economics.
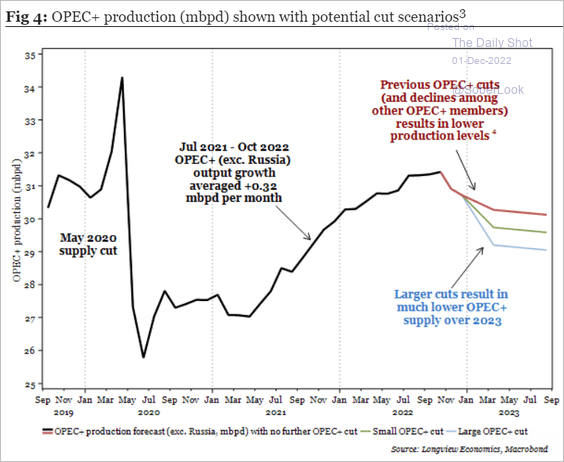 Source: Longview Economics
How will these cuts impact the market balance next year?
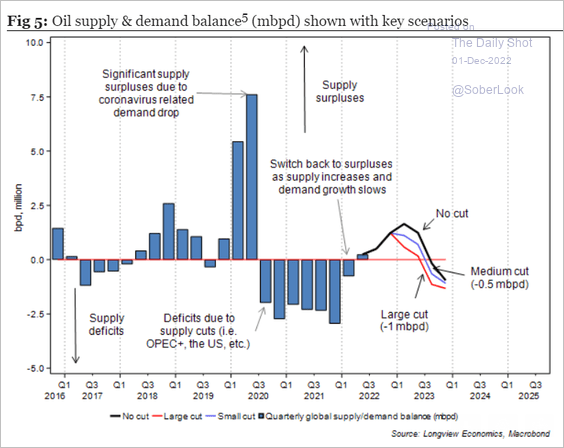 Source: Longview Economics
——————–
6. Who are the biggest LNG exporters?
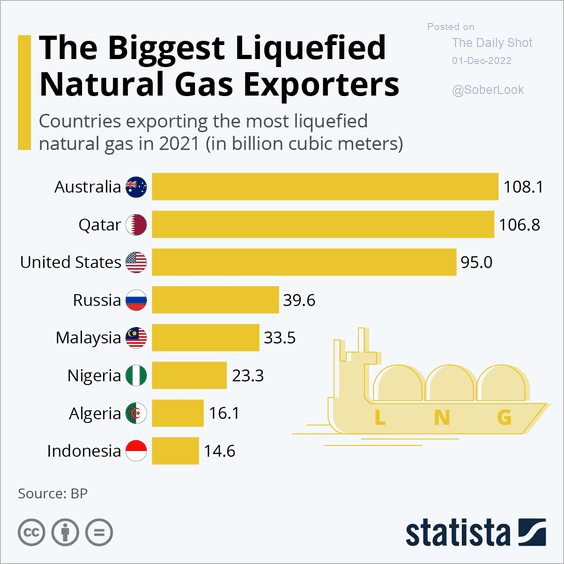 Source: Statista
Back to Index
Equities
1. Stocks surged in response to Chair Powell’s comments. Too much enthusiasm?
Growth stocks got a boost from a sharp decline in real yields.
——————–
2. The S&P 500 closed above the 200-day moving average and is now at the downtrend resistance.
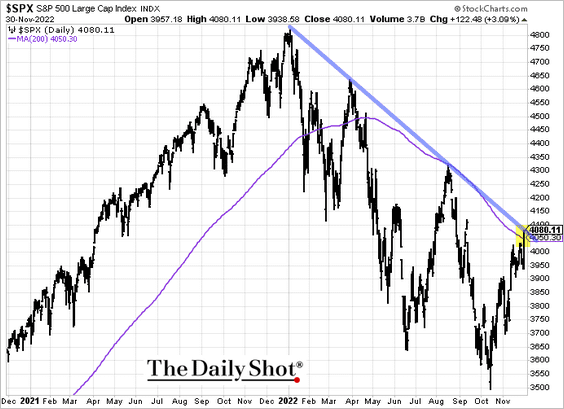
The S&P 500 is holding long-term support with improving breadth and momentum.
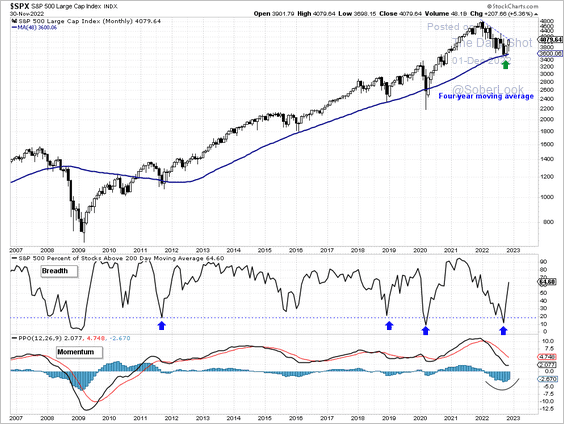 Source: Aazan Habib, Paradigm Capital
——————–
3. The Fear & Greed index is nearing “extreme greed” territory.
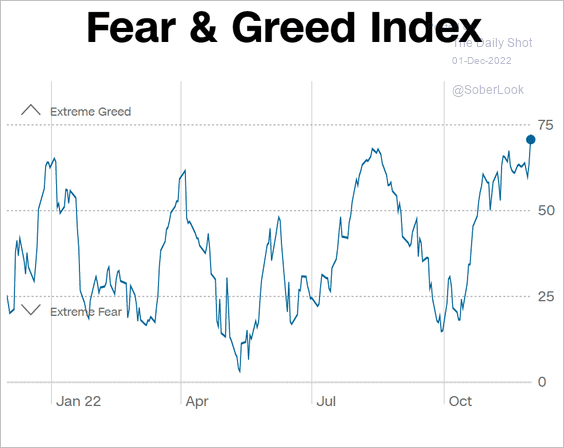 Source: CNN Business
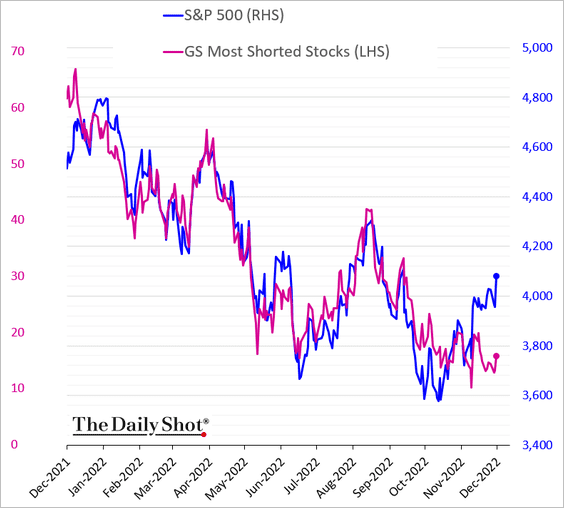
4. Most-shorted stocks are not participating in the latest rally.
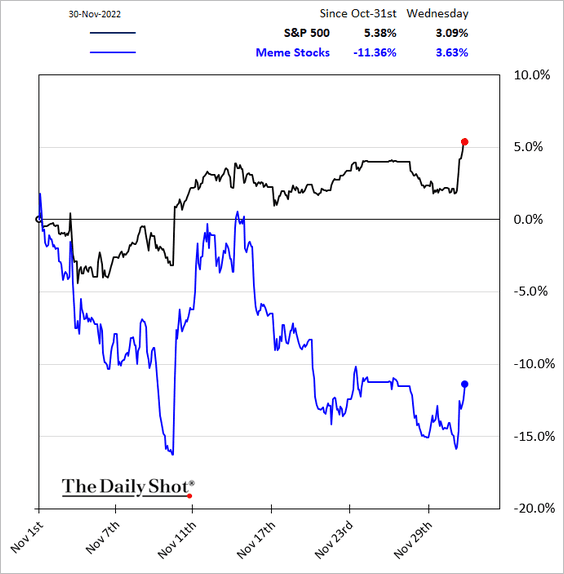
5. The Reddit crowd isn’t chasing meme stocks these days.
6. Profit margins have room to fall, especially if there is a recession.
 Further reading
7. The S&P 500’s valuation has compressed as the pace of monetary easing slowed.
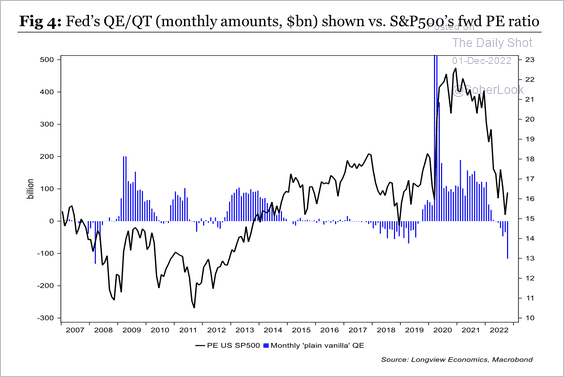 Source: Longview Economics
Tech valuations have normalized. A pullback in interest rates could benefit tech, although Citi expects a challenging earnings backdrop to offset a modest re-rating toward higher multiples next year.
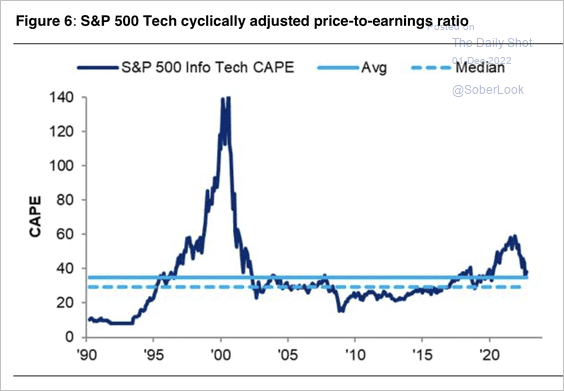 Source: Citi Private Bank
Unprofitable tech stocks have been crushed over the past year as investors favored quality leaders.
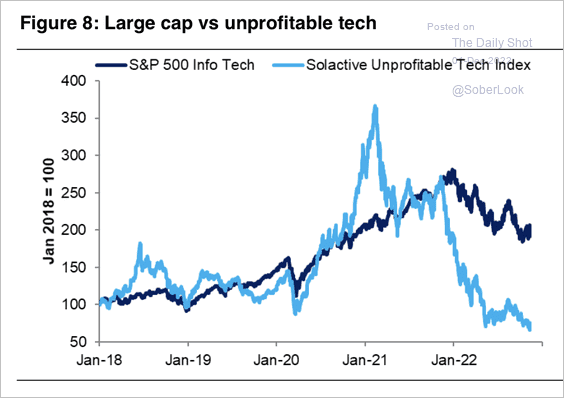 Source: Citi Private Bank
——————–
8. Hedge funds are very underweight tech.
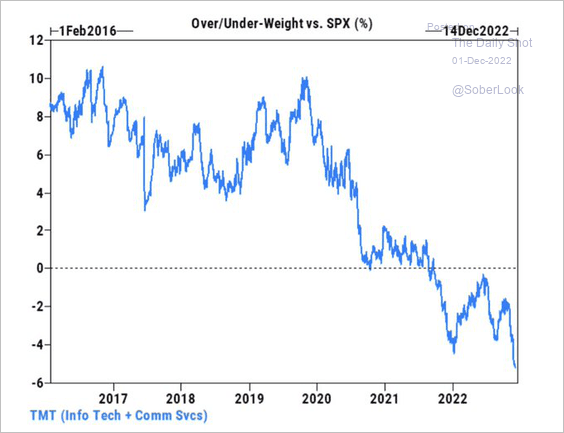 Source: Goldman Sachs; @carlquintanilla
9. The UBS directional risk model is signaling a drawdown ahead for stocks.
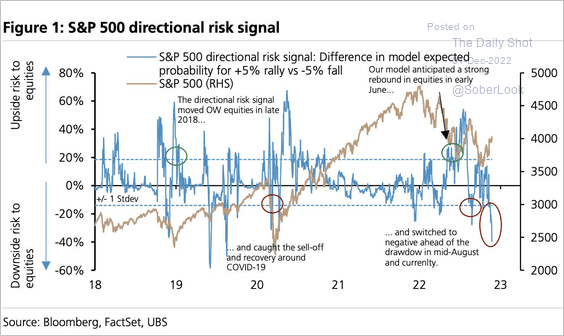 Source: UBS Research; @SamRo, h/t @dailychartbook
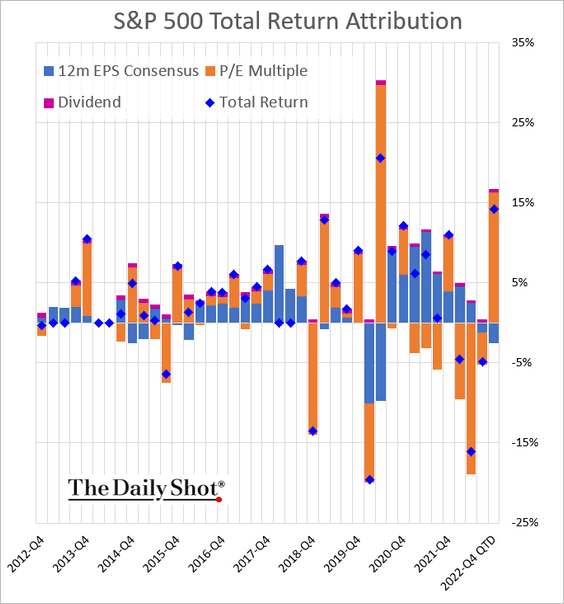
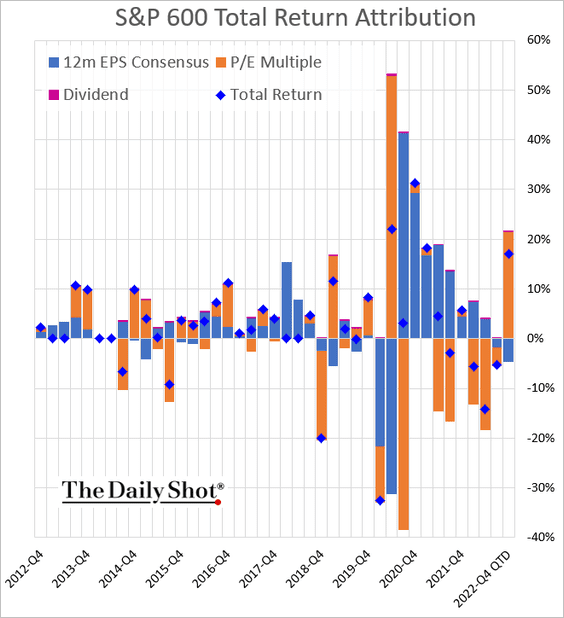
10. Next, we have the quarter-to-date performance attribution.
• S&P 500 (up 14% this quarter):
• S&P 600 (small caps):
——————–
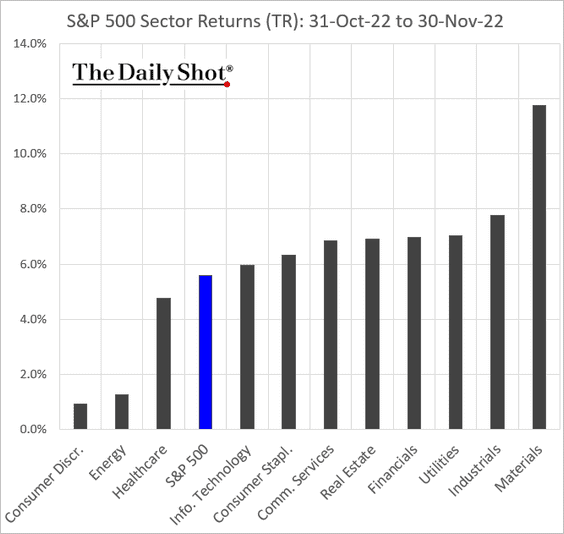
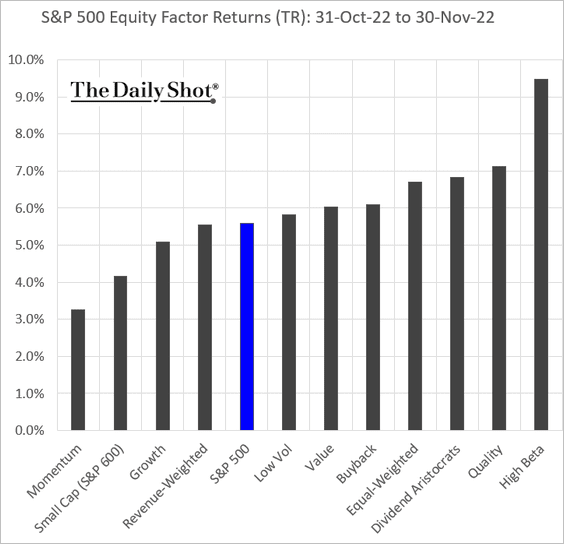
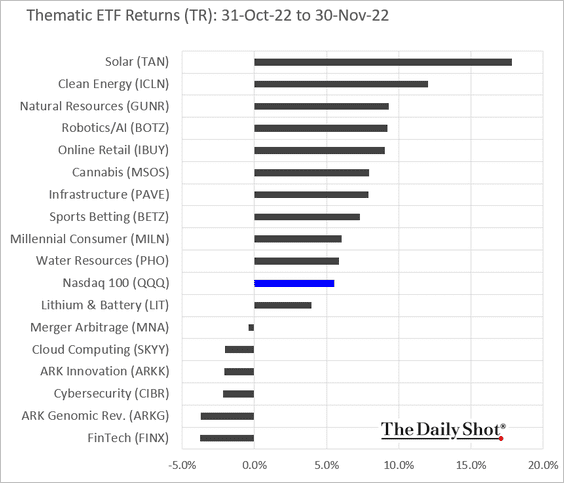
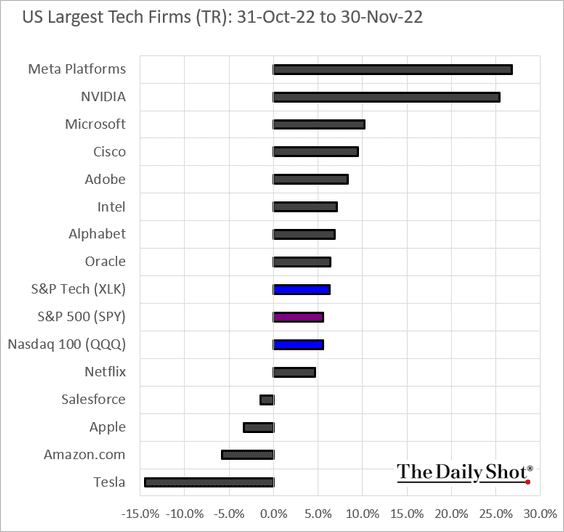
11. Finally, let’s take a look at the November performance metrics.
• Sectors:
• Equity factors:
• Thematic ETFs:
• Largest US tech firms:
Back to Index
Credit
1. Here is the US nominal and real corporate credit growth.
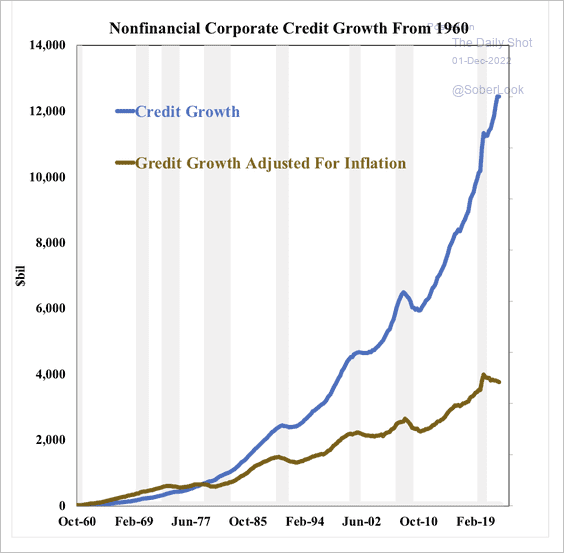 Source: SOM Macro Strategies
2. Next, let’s take a look at potential fallen angels.
• By sector:
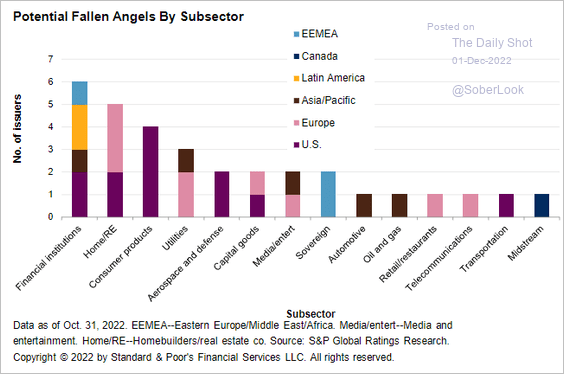 Source: S&P Global Ratings
• Over time:
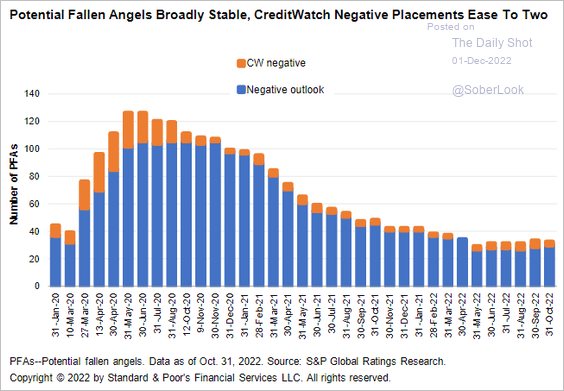 Source: S&P Global Ratings
And here are potential rising stars by sector:
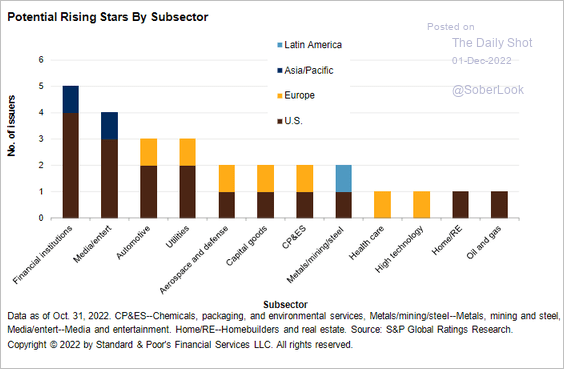 Source: S&P Global Ratings
——————–
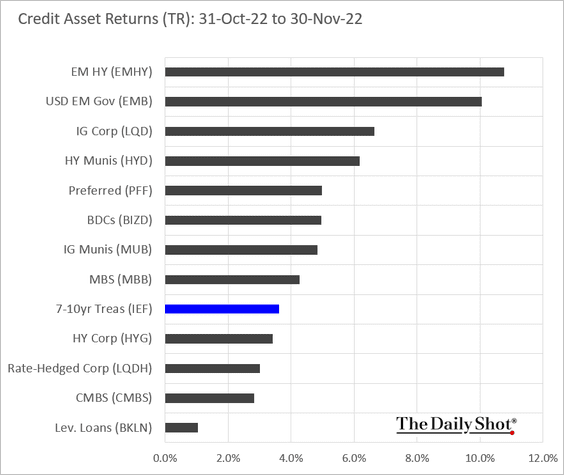
3. Finally, here is the performance by asset class in November.
Back to Index
Rates
1. The market expects much sharper rate cuts from the Fed than the ECB after reaching the terminal rate.
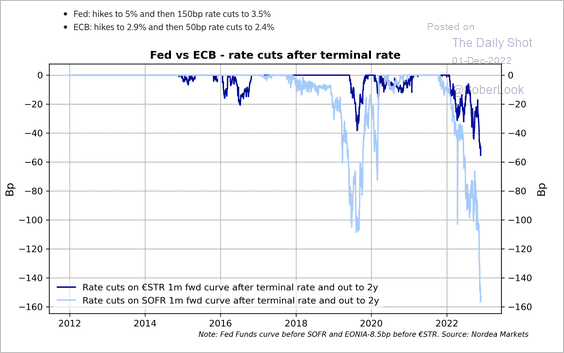 Source: Nordea Markets
2. The implied volatility gap between rates and equities remains elevated.
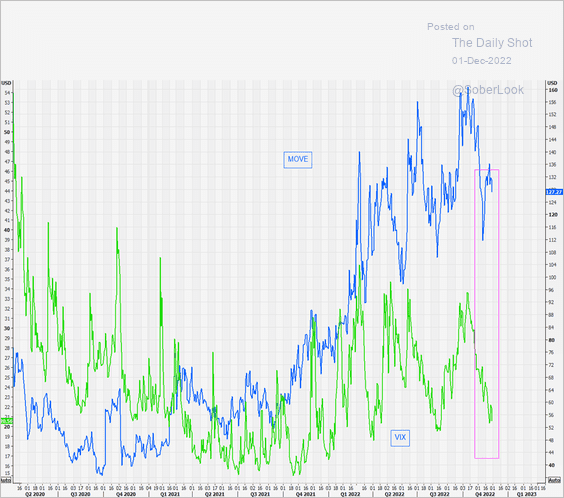 Source: @themarketear
3. The Taylor Rule suggests the Fed needs to raise rates substantially higher to bring inflation down to 2%.
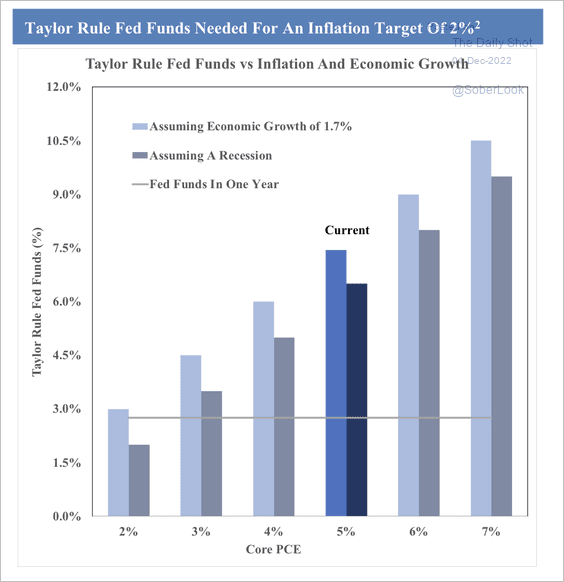 Source: SOM Macro Strategies
4. So far, the current Fed rate hike cycle is the fifth largest in magnitude and the fifth shortest in duration.
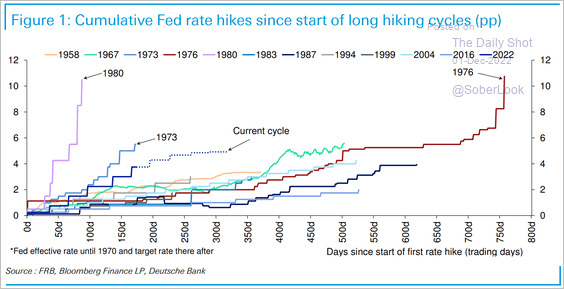 Source: Deutsche Bank Research
5. Alpine Macro expects markets to front-run a Fed pivot, triggering a reversal in yields. Is this the end of “monetary overkill?”
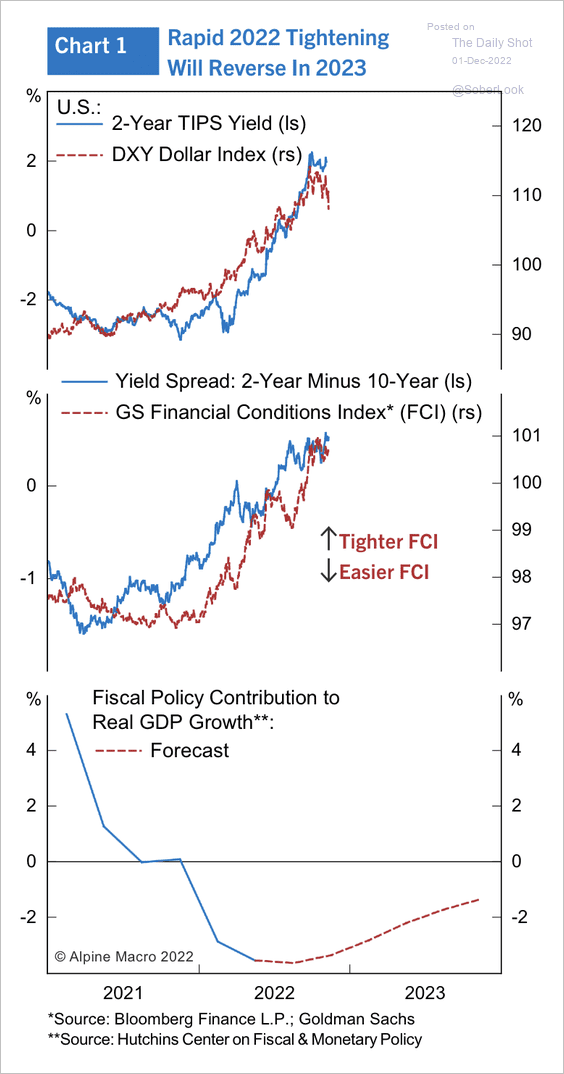 Source: Alpine Macro
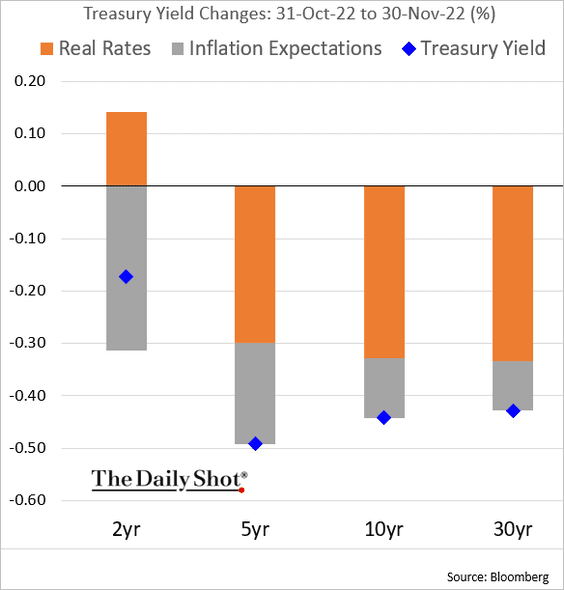
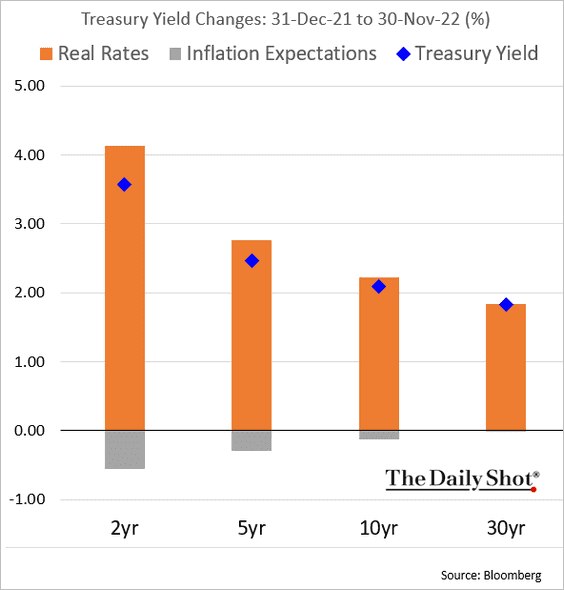
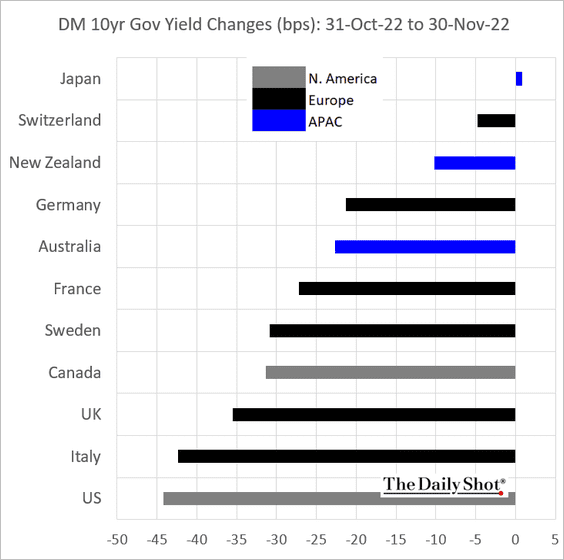
6. Finally, we have some attribution data for Treasury yield changes.
• November:
• Year-to-date:
Back to Index
Global Developments
1. Here is a look at inflation rates around the world.
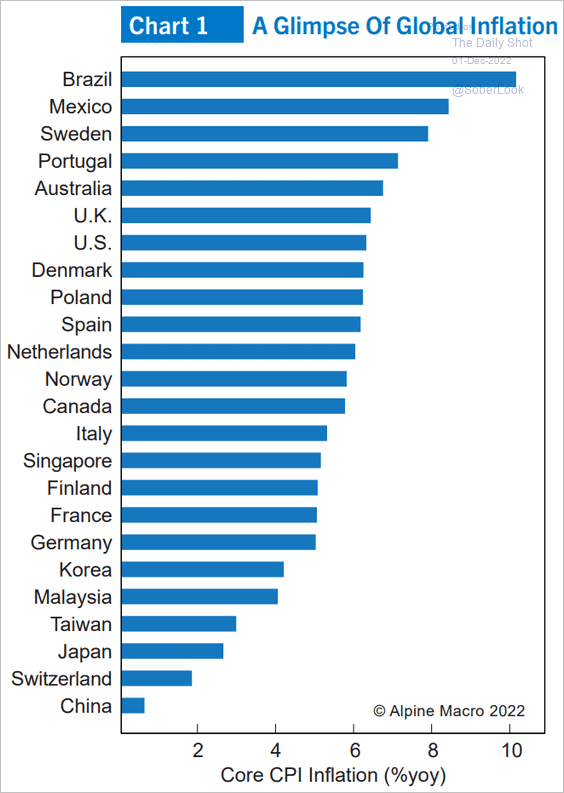 Source: Alpine Macro
2. Global productivity has been declining.
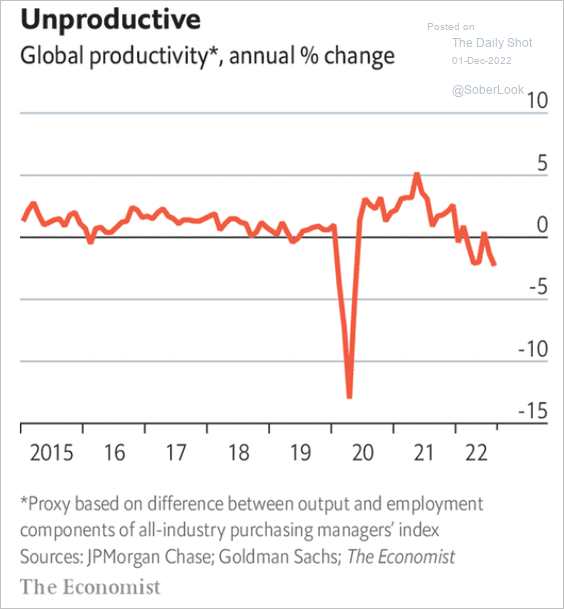 Source: The Economist Read full article
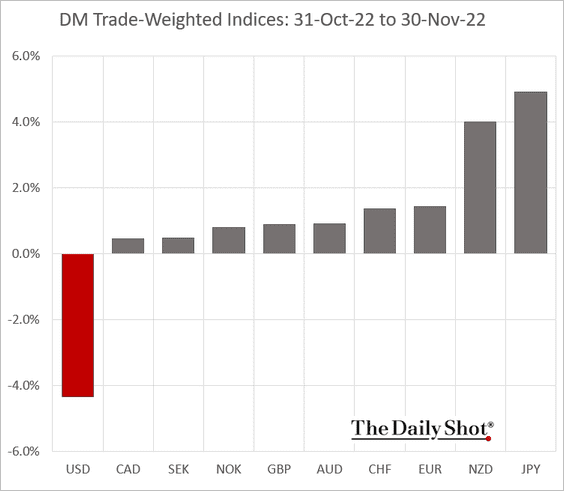
3. Next, we have some performance data for the month of November.
• Bond yields:
• Currencies:
——————–
Food for Thought
1. Employees represented by US rail unions:
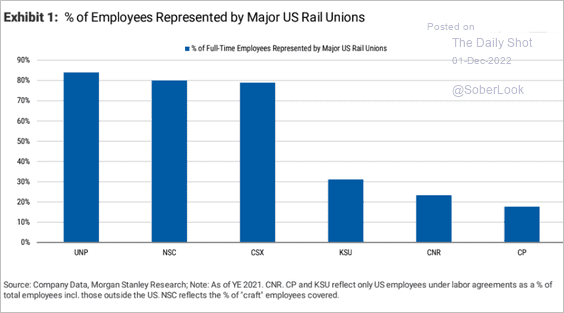 Source: Morgan Stanley Research
2. Labor force participation among Americans in their early 20s:
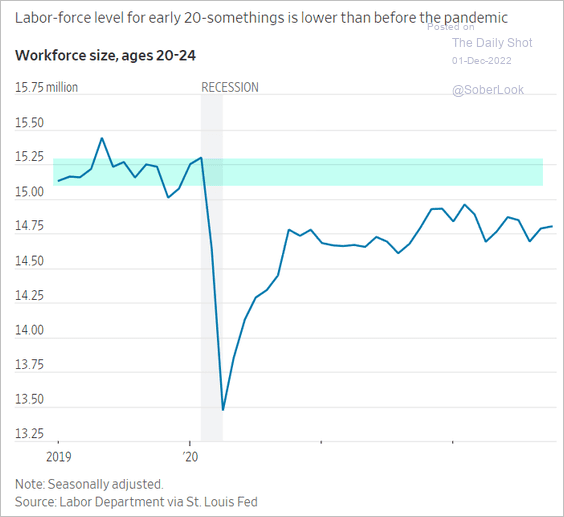 Source: @WSJ Read full article
3. Enrollment in teacher preparation programs:
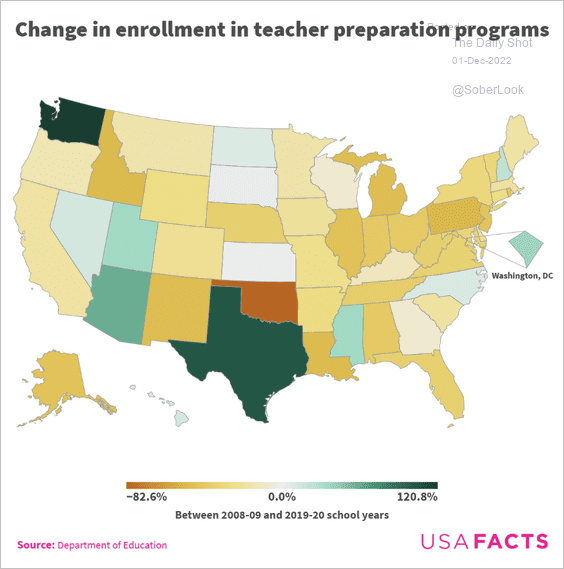 Source: USAFacts
4. Growth in nursing jobs:
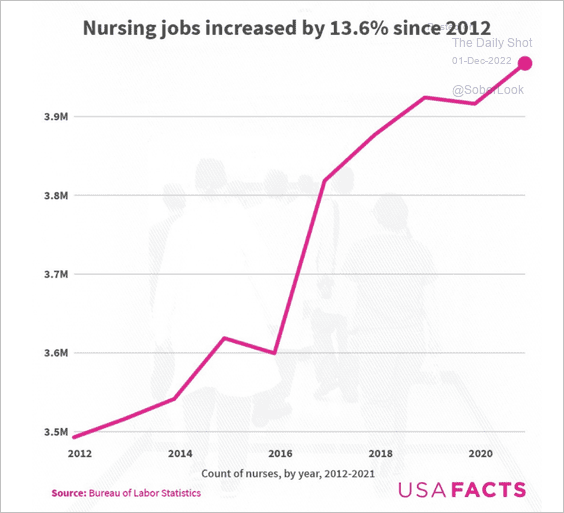 Source: USAFacts
5. Youth sports participation:
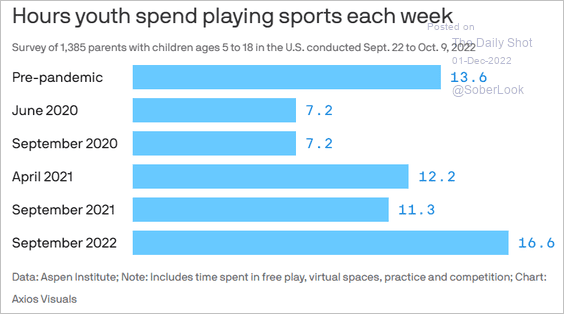 Source: @axios Read full article
6. STDs among older men in England:
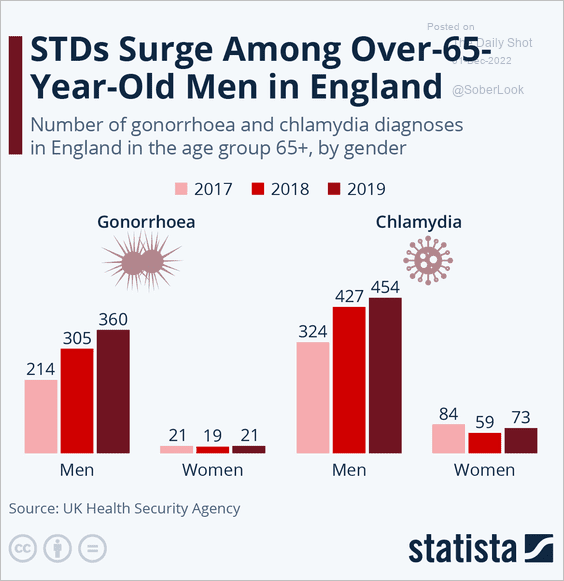 Source: Statista
7. Bacon consumption in Europe:
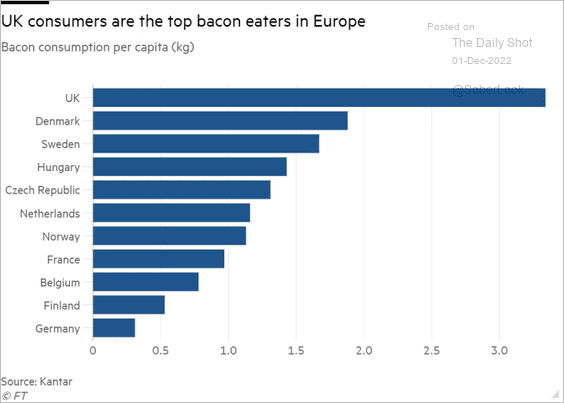 Source: @financialtimes, h/t Walter Read full article
• Largest importers and exporters of bacon:
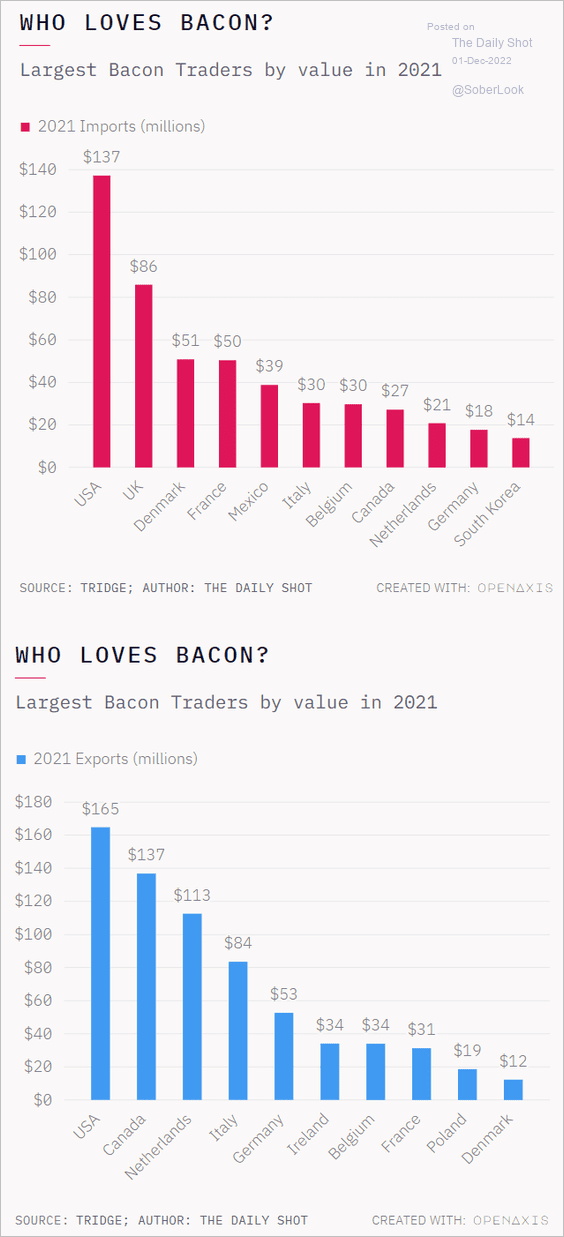 Source: @OpenAxisHQ Further reading
——————–
Back to Index