
The Daily Shot: 06-Dec-22
• The United States
• The United Kingdom
• The Eurozone
• Japan
• China
• Emerging Markets
• Commodities
• Energy
• Equities
• Credit
• Rates
• Global Developments
• Food for Thought
The United States
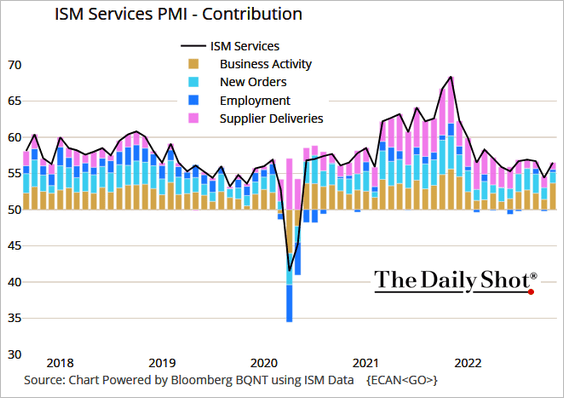
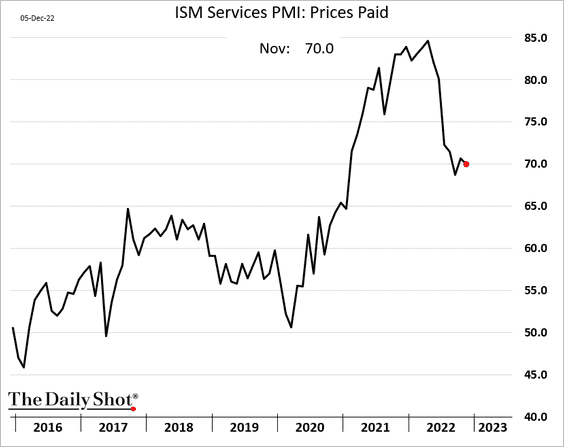
1. The ISM Services PMI report was remarkably strong, suggesting that the service sector remains resilient in the face of rising rates. Service companies have been benefiting from robust consumer spending.
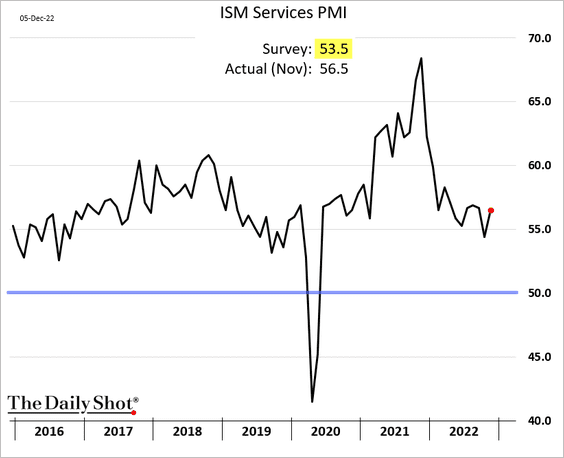
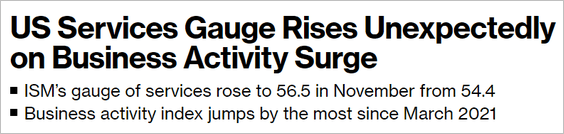 Source: @gutavsaraiva, @markets Read full article
• The ISM index was well above expectations.
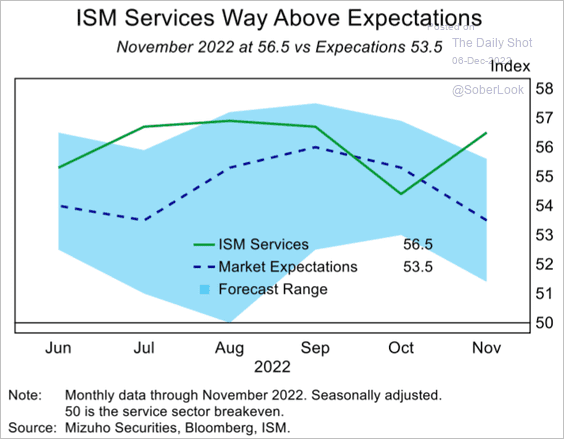 Source: Mizuho Securities USA
• Business activity accelerated.
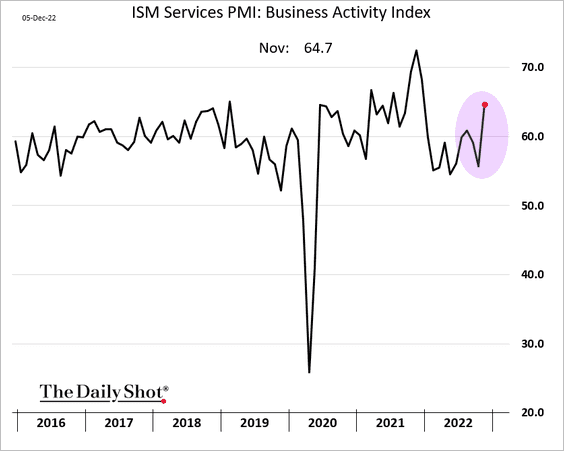
 Source: @TheTerminal, Bloomberg Finance L.P.
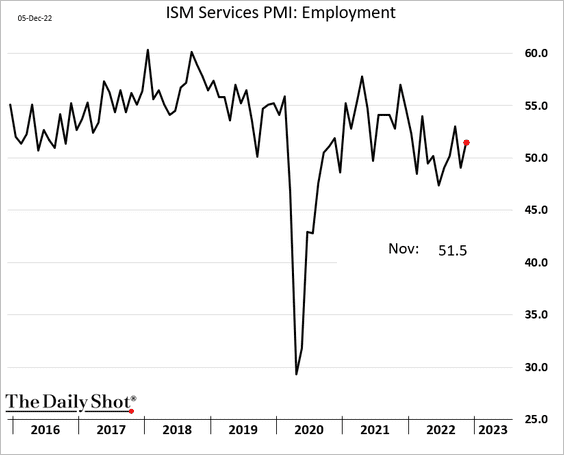
• And hiring improved.
• Supply bottlenecks continue to ease, …
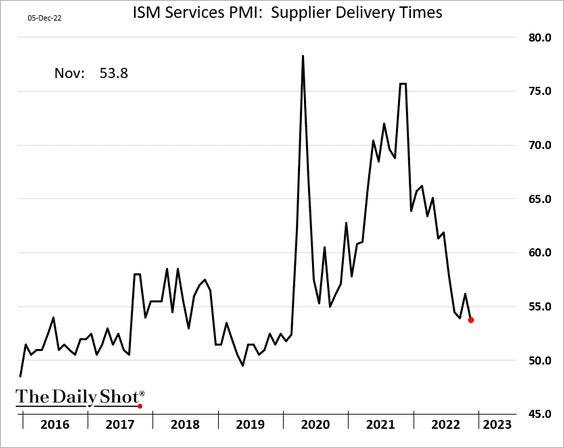
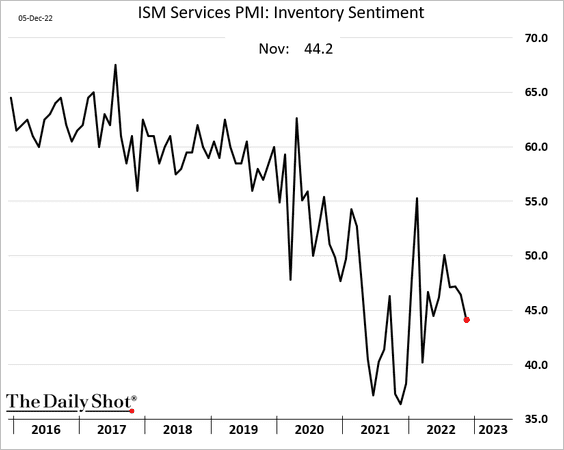
… although inventories are still tight.
• Price pressures persist.
• The stock market, which ended up taking Friday’s strong jobs report in stride, turned sharply lower on Monday in response to the ISM Services data.
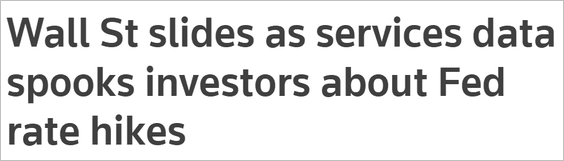 Source: Reuters Read full article
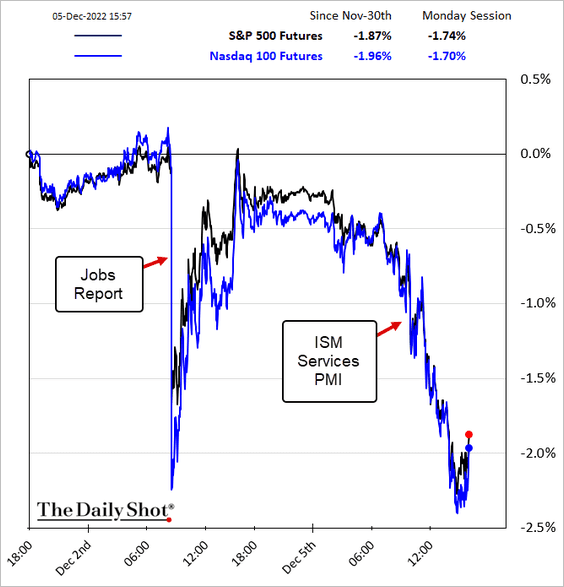
Bond yields climbed.
2. Despite the strong ISM Services report, there are clouds on the horizon.
• Tumbling residential investment will be a drag on the ISM services index.
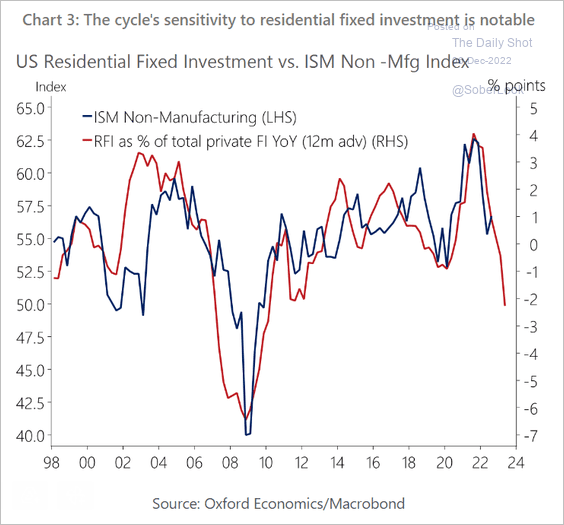 Source: Oxford Economics
• An alternative measure of US services growth (from S&P Global) was not nearly as upbeat.
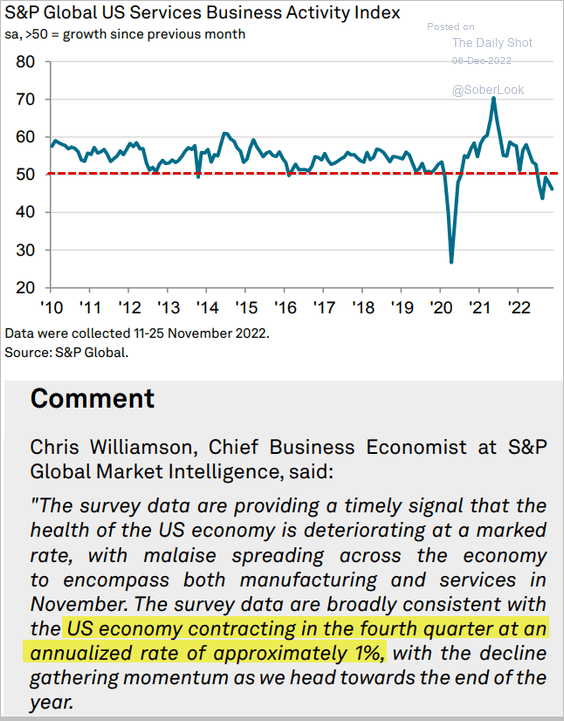 Source: S&P Global PMI
Here is the comparison of the S&P Global and ISM indices.
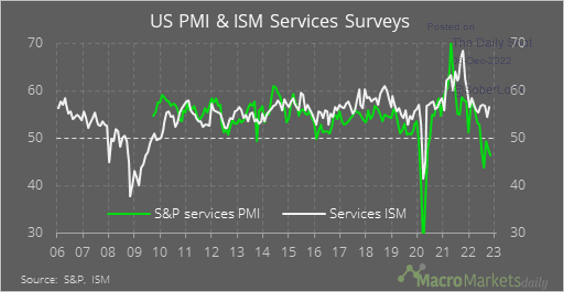 Source: @macro_daily
——————–
3. Business investment is expected to slow sharply.
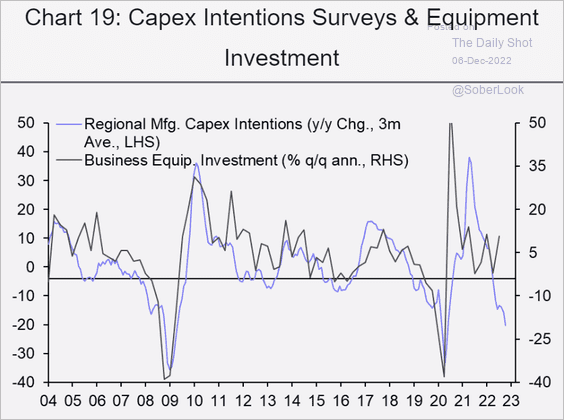 Source: Capital Economics
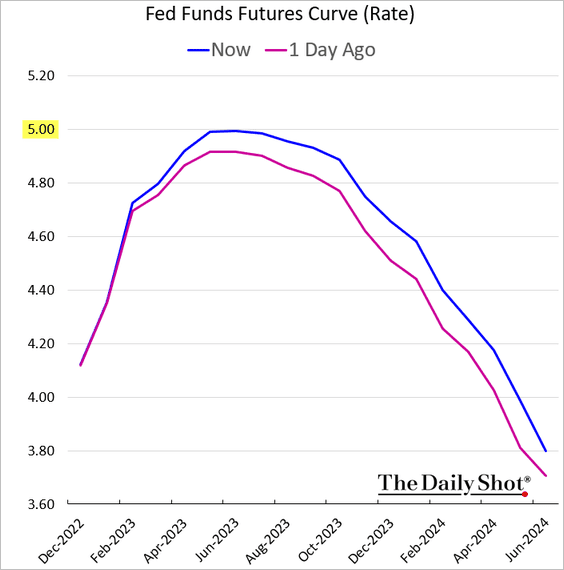
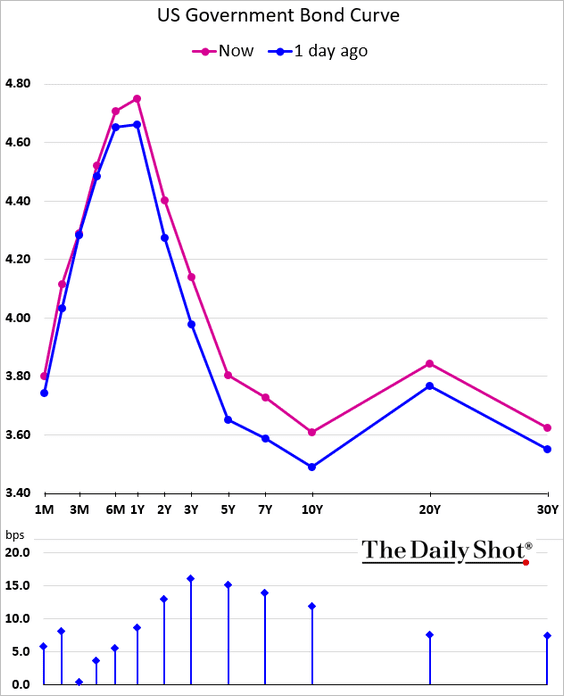
4. The terminal rate moved back up to 5% in response to the ISM Services print. Below is the market pricing for the fed funds rate trajectory.
• Here is a forecast from Wells Fargo.
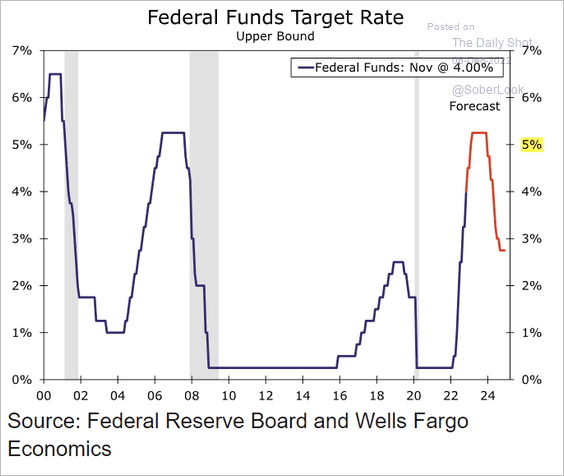 Source: Wells Fargo Securities
• This is the most aggressive Fed tightening in 40 years.
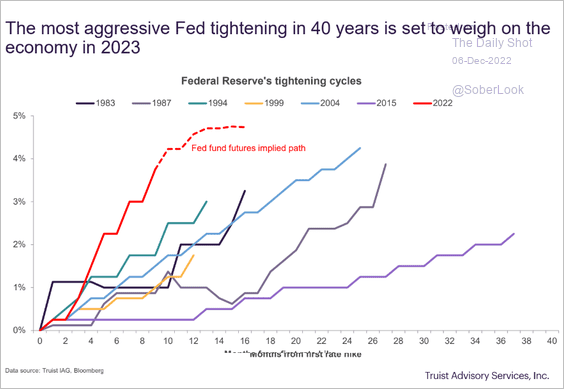 Source: Truist Advisory Services
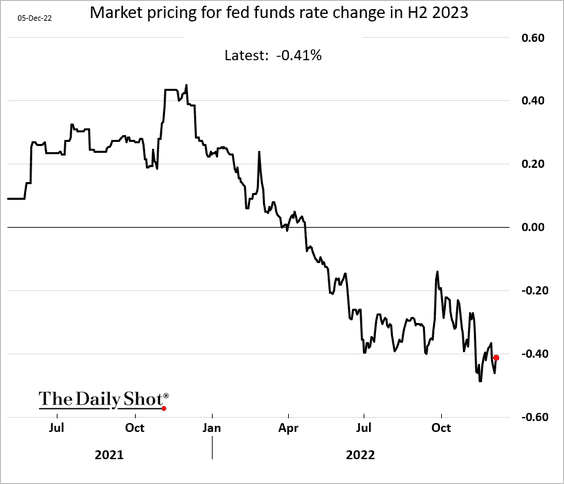
• The market is still pricing rate cuts in the second half of 2023.
——————–
5. The yield curve inversion continues to hit multi-decade extremes …
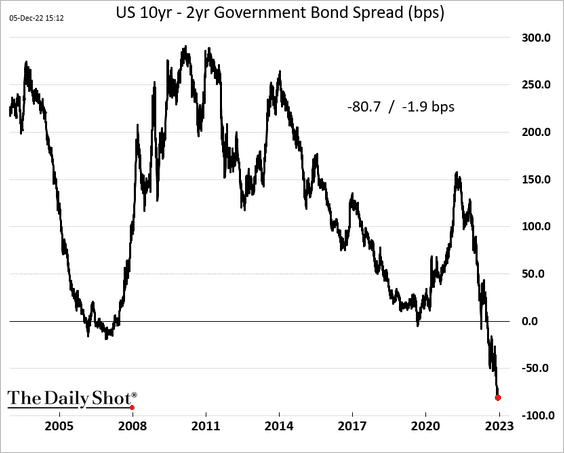
… which points to massive rate cuts ahead, …
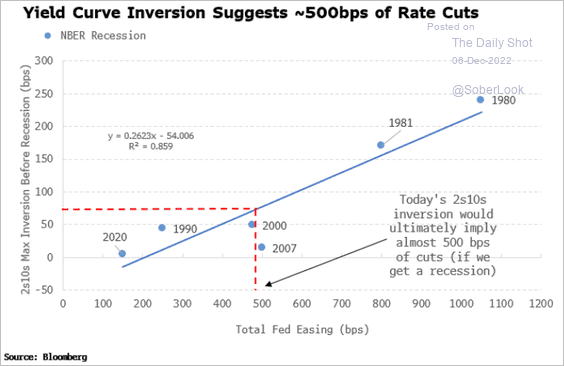 Source: Simon White, Bloomberg Markets Live Blog
… as recession sets in.
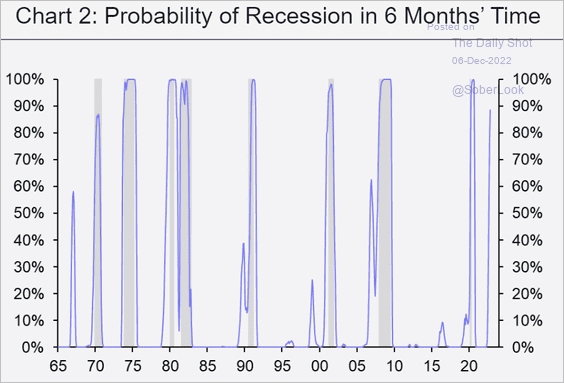 Source: Capital Economics
Back to Index
The United Kingdom
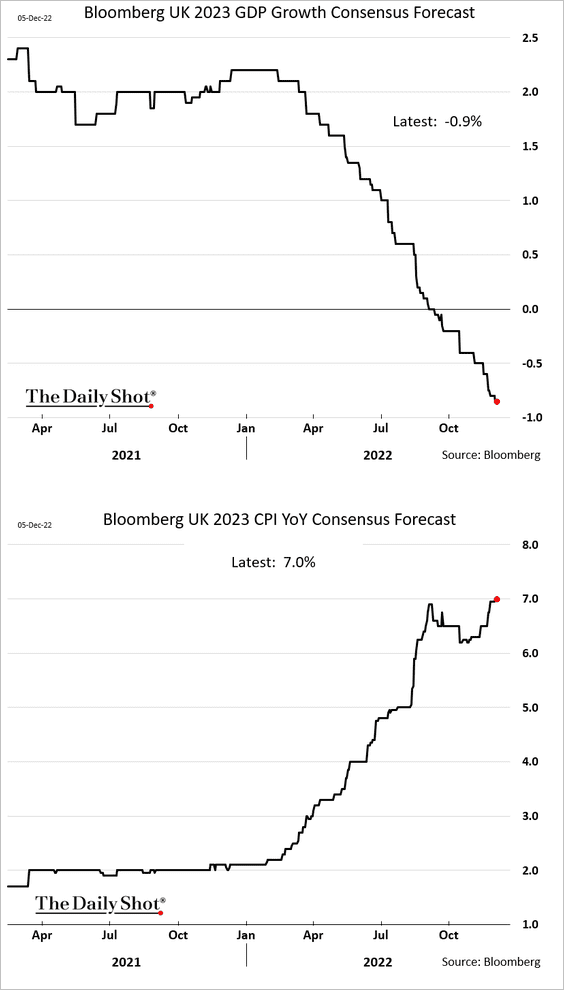
1. Economists increasingly see a punishing stagflation next year.
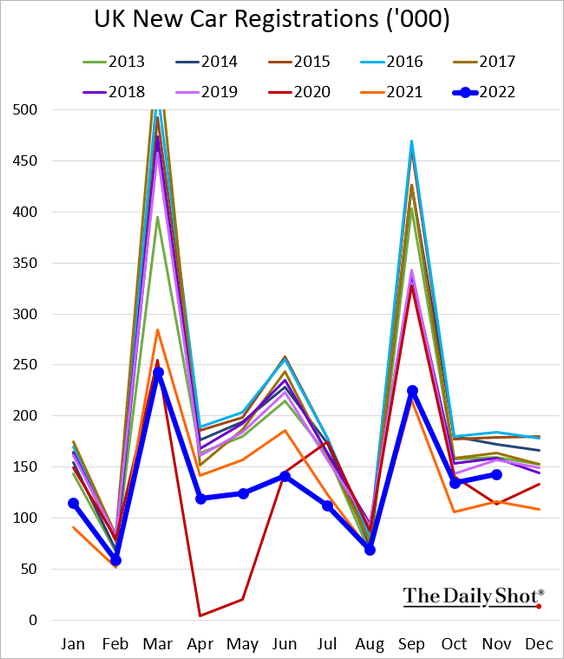
2. New car registrations remain soft.
3. The UK is planning to boost its nuclear power capacity. But it will take a couple of decades.
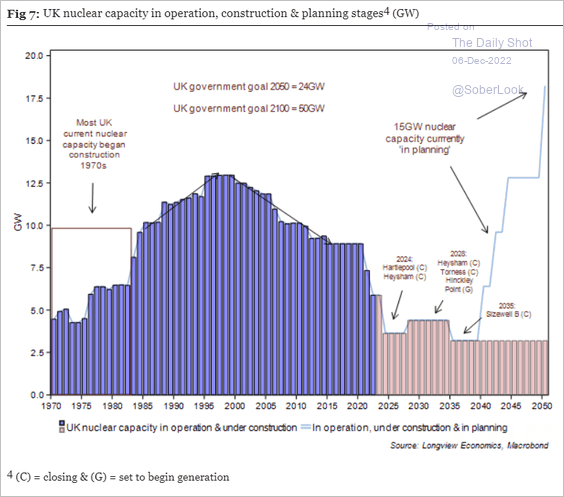 Source: Longview Economics
Back to Index
The Eurozone
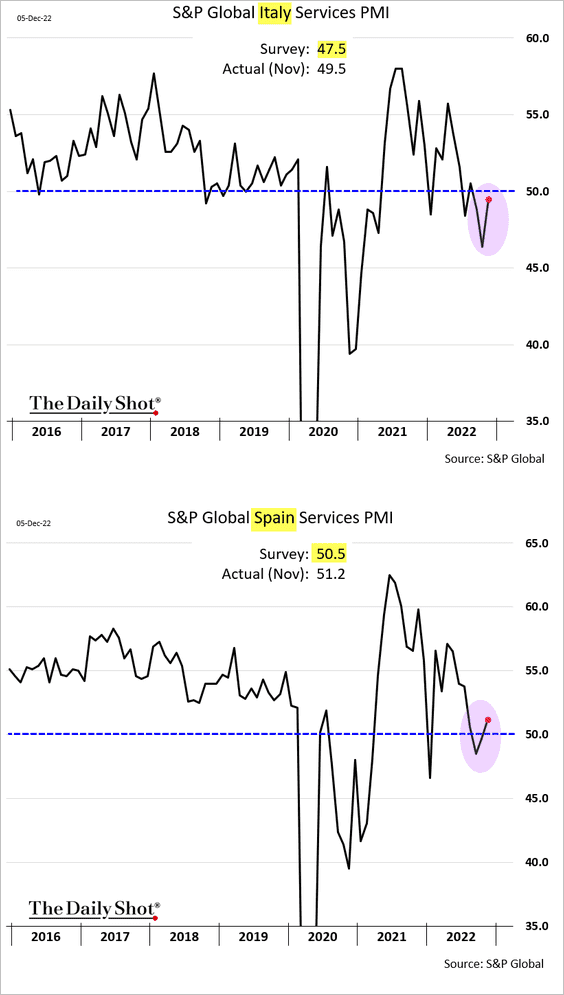
1. As we saw a couple of weeks back, euro-area service-sector PMIs topped expectations. Here are the trends for Italy and Spain.
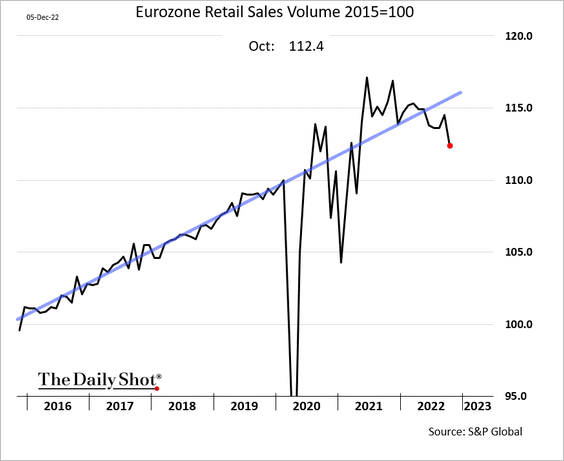
2. Eurozone retail sales took a hit in October.
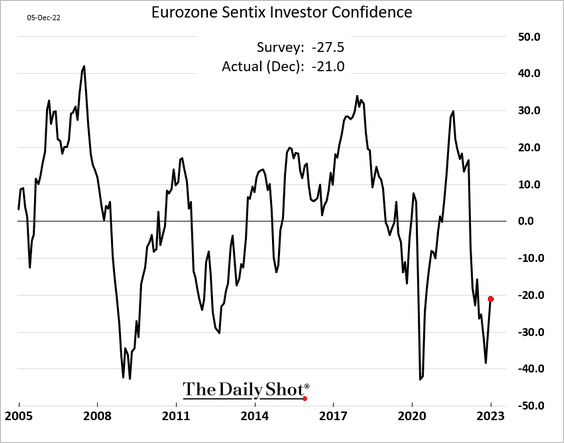
3. The Sentix investor confidence surprised to the upside.
4. The expected ECB terminal rate may be too low to tame red-hot inflation.
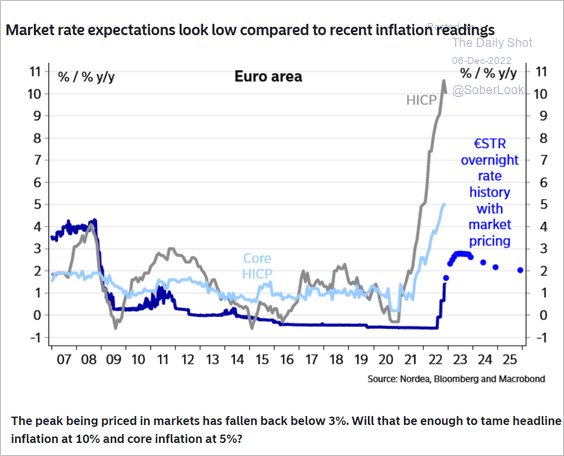 Source: Nordea Markets
And the central bank’s hawkish outlook seems to be losing momentum.
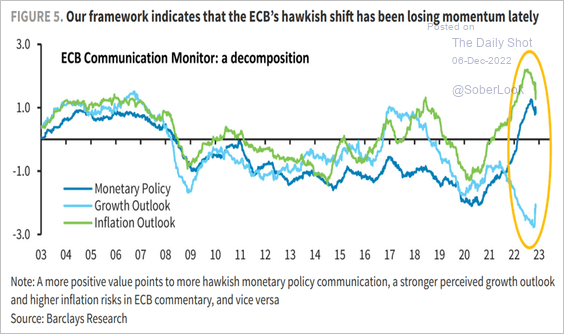 Source: Barclays Research
——————–
5. The spread between the euro-area and US inflation expectations has tightened to multi-year lows.
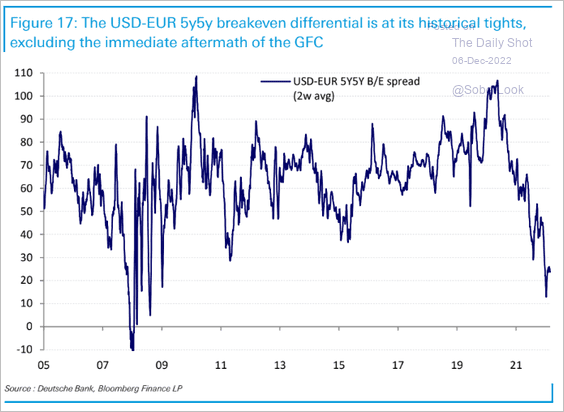 Source: Deutsche Bank Research
Back to Index
Japan
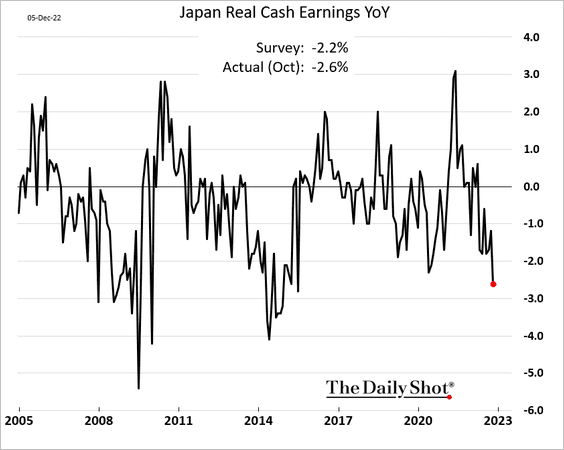
1. Japan’s real earnings are down sharply as inflation takes a toll.
2. Dollar-yen has been correlated to Treasury yields.
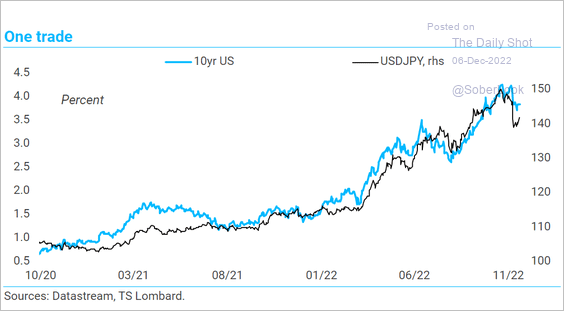 Source: TS Lombard
Back to Index
China
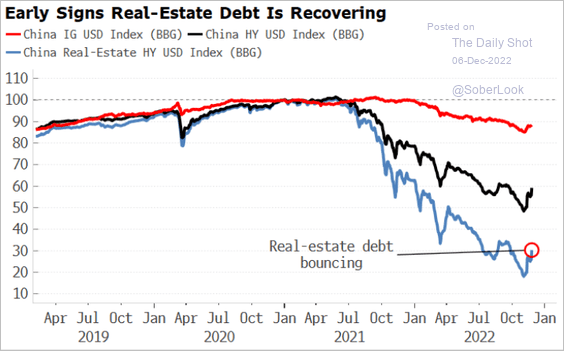
1. Property developers have halted a significant number of projects due to the financing squeeze and lower demand.
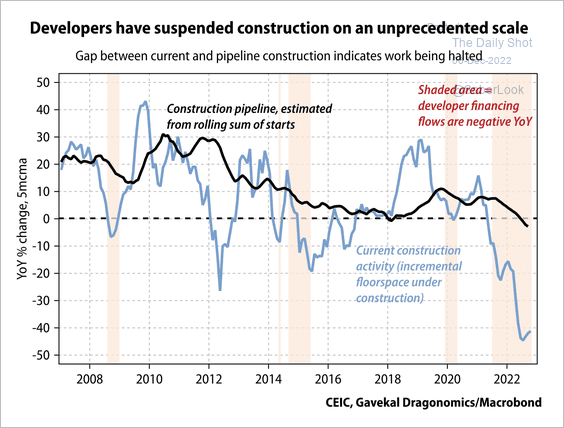 Source: Gavekal Research
2. Real-estate debt prices appear to have bottomed.
 Source: Simon White, Bloomberg Markets Live Blog
Back to Index
Emerging Markets
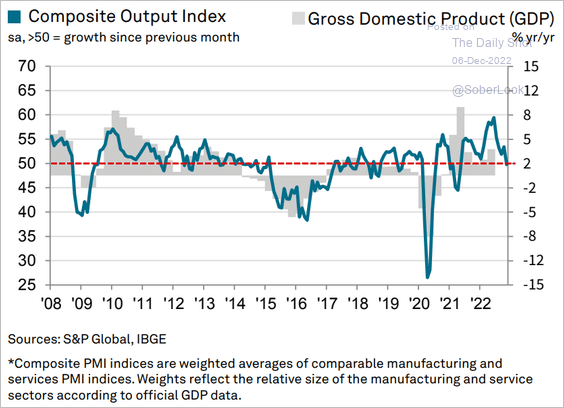
1. Brazil’s service-sector growth is slowing.
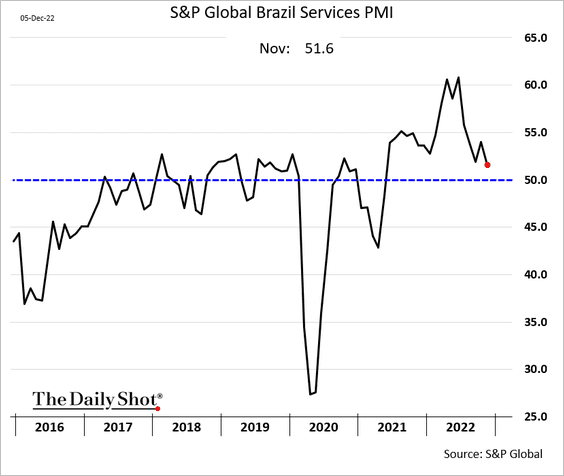
The composite PMI (services and manufacturing) shows business growth stalling.
 Source: S&P Global PMI
——————–
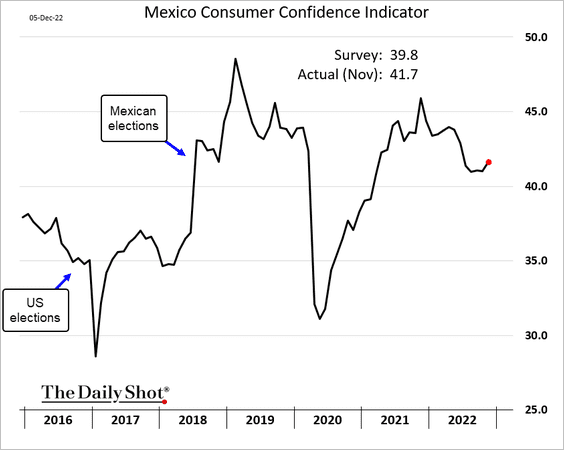
2. Mexico’s consumer confidence remains resilient.
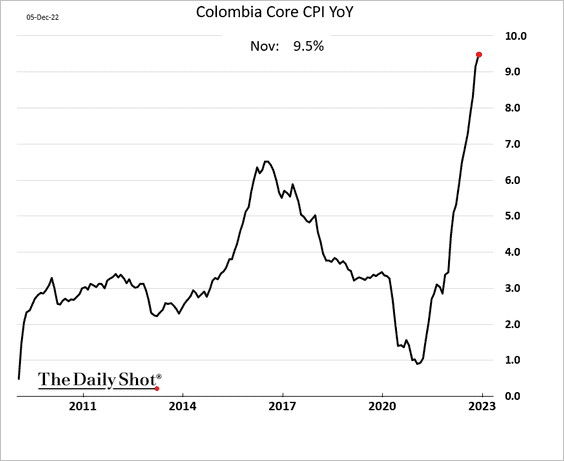
3. Colombia’s inflation keeps rising.
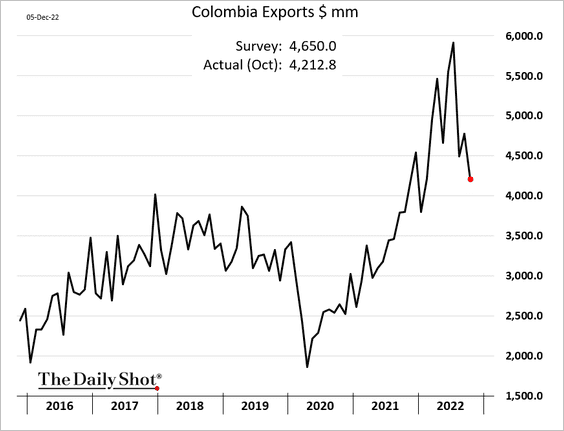
Exports are lower amid declines in oil prices.
——————–
4. This chart shows LatAm foreign direct investment by sector.
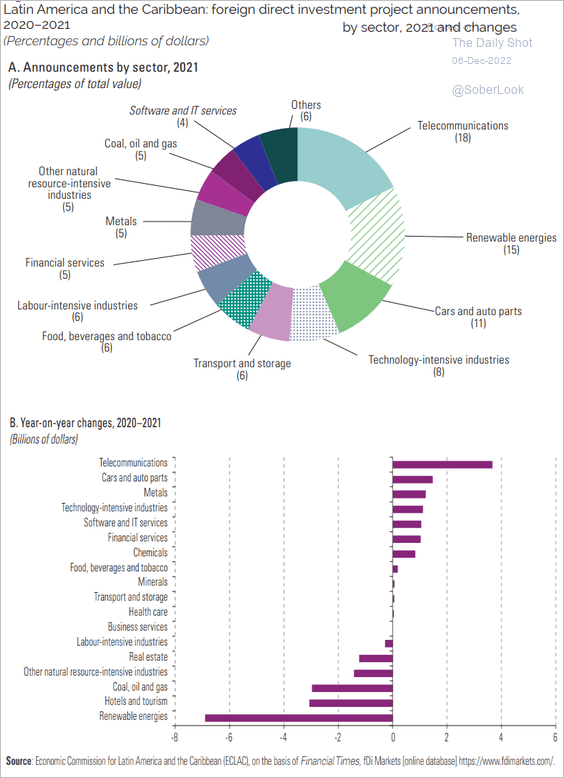 Source: UN Read full article
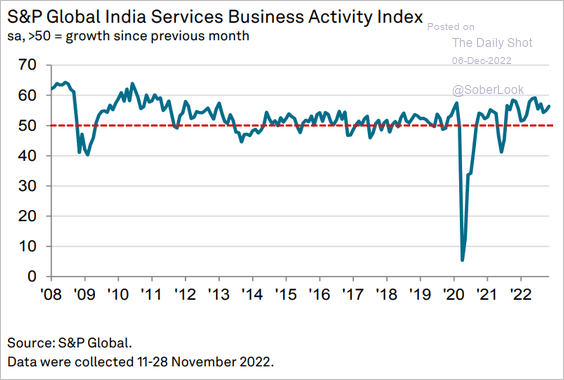
5. India’s service sector growth remains strong.
 Source: S&P Global PMI
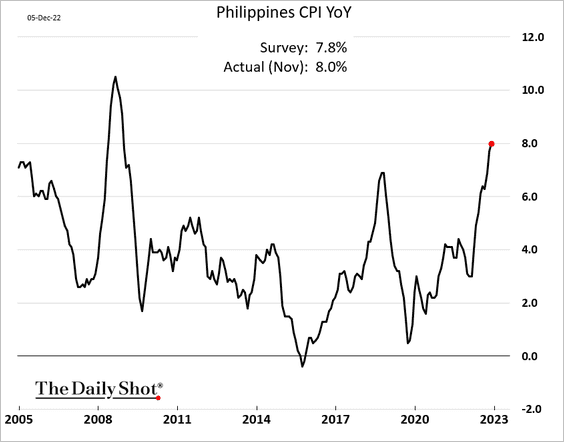
6. The Philippine CPI reached 8% last month.
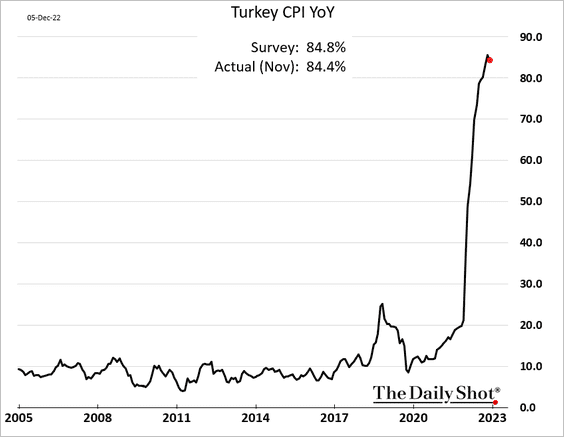
7. Turkey’s CPI appears to have finally peaked – above 80%.
Back to Index
Commodities
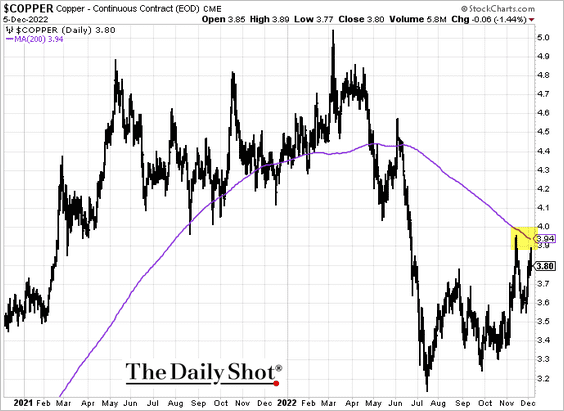
1. Copper has been testing resistance at the 200-day moving average.
2. Longview’s tactical model turned bearish on gold.
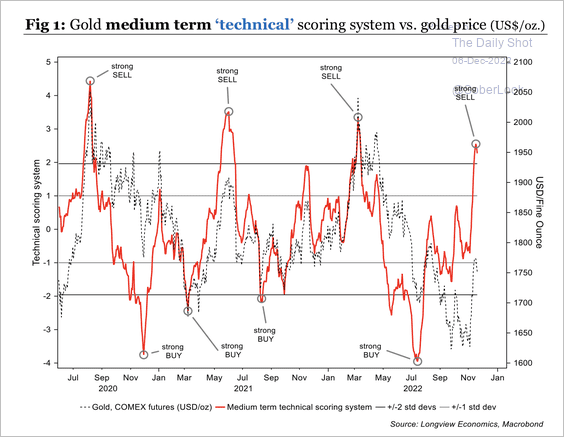 Source: Longview Economics
The recent bounce in gold prices triggered an uptick in speculative long positioning, albeit well below 2019 levels.
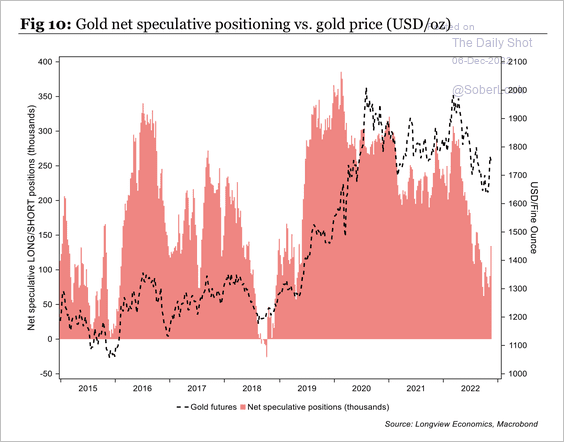 Source: Longview Economics
——————–
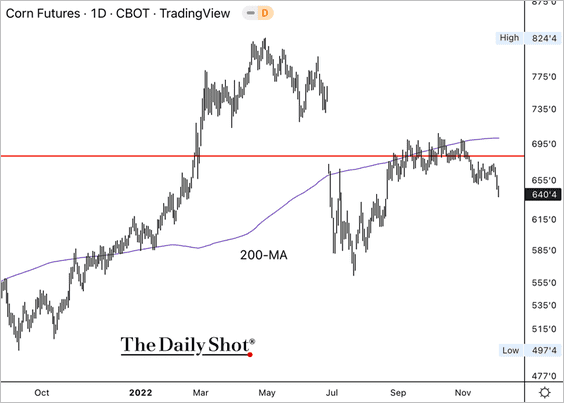
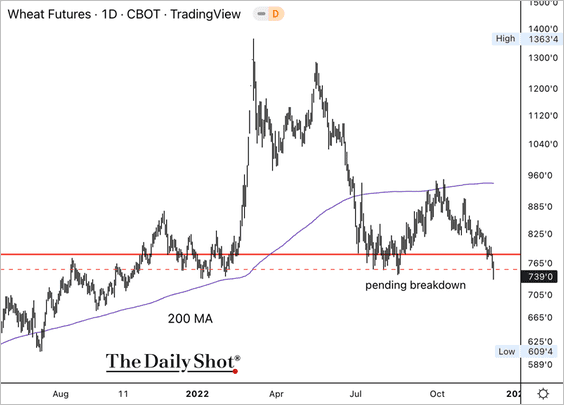
3. Corn and wheat futures are firmly below their 200-day moving averages. (2 charts)
——————–
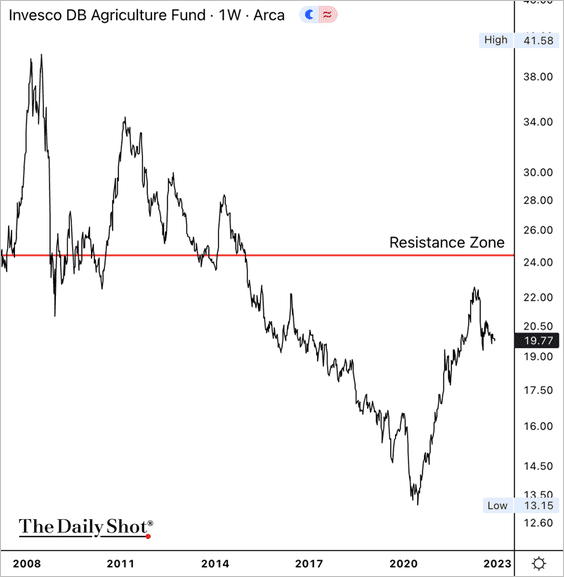
4. The Invesco Agriculture ETF’s (DBA) rally stalled at long-term resistance.
5. Global wheat inventories have been shrinking in recent years.
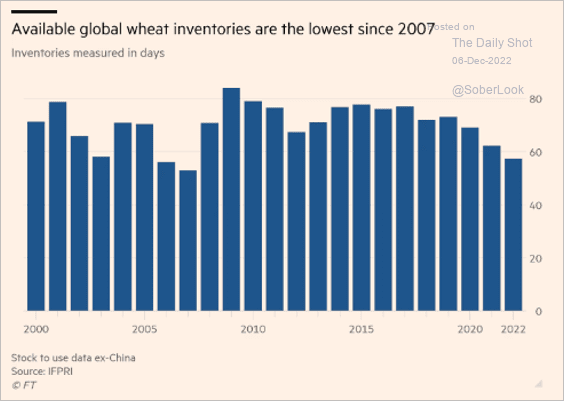 Source: @financialtimes Read full article
6. Argentina’s soybean crop is facing drought conditions.
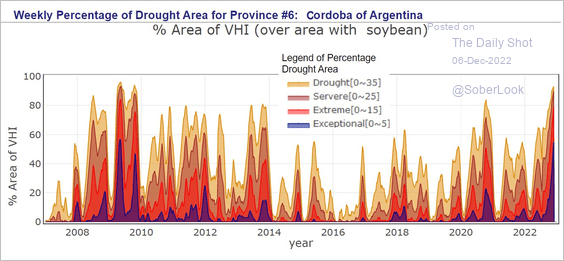 Source: @kannbwx
7. Commodities are vulnerable to sharp sell-offs when demand falters.
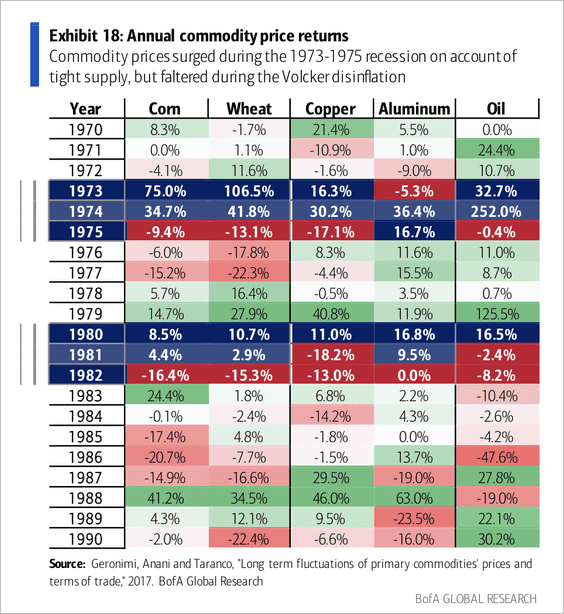 Source: BofA Global Research
Back to Index
Energy
1. Global O&G CapEx remains well below pre-COVID levels.
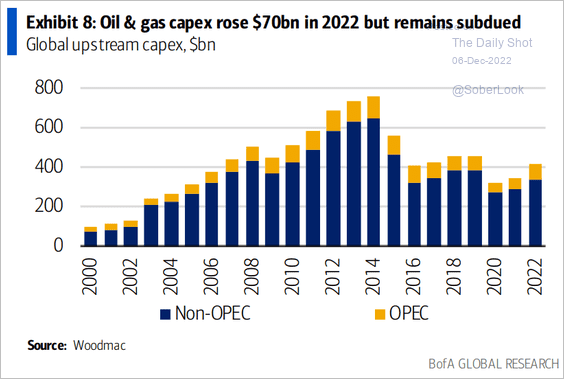 Source: BofA Global Research
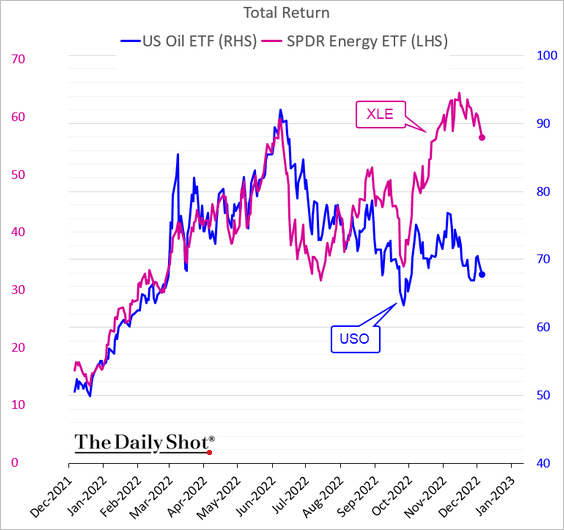
2. The performance gap between energy shares and oil prices has blown out. Something has to give here. Are oil prices too low or equity prices too high?
Back to Index
Equities
1. Too much enthusiasm in the market?
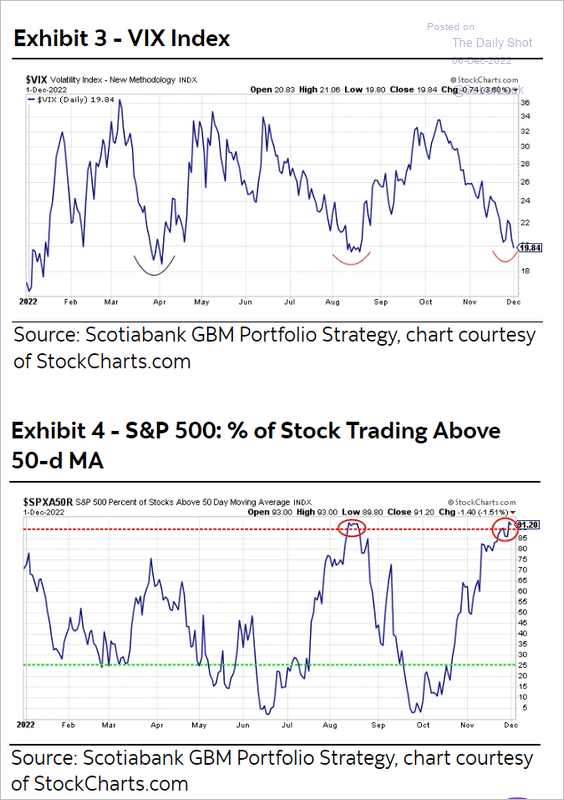 Source: Hugo Ste-Marie, Portfolio & Quantitative Strategy Global Equity Research, Scotia Capital
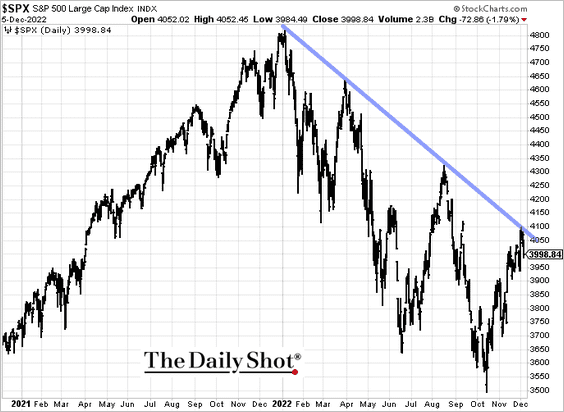
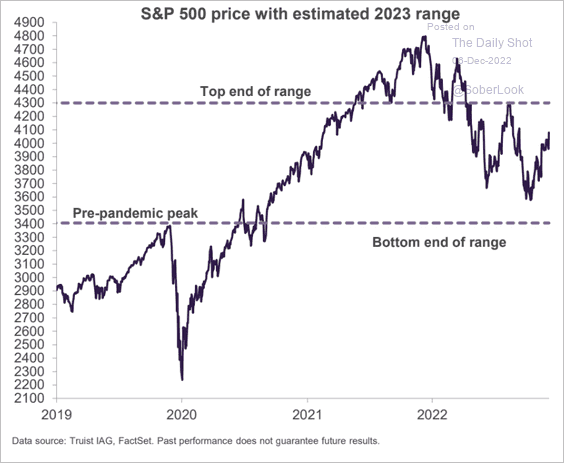
2. The S&P 500 resistance continues to hold.
3. Earnings forecasts for 2023 have leveled off. Here are the consensus estimates.
– By year:
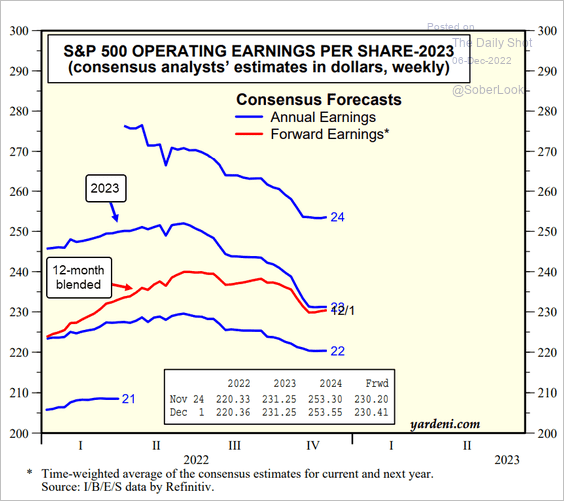 Source: Yardeni Research
– By quarter:
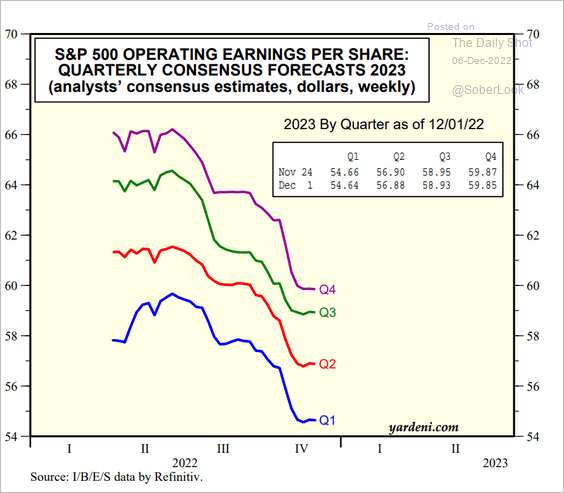 Source: Yardeni Research
• Deutsche Bank’s 2023 forecast is well below consensus.
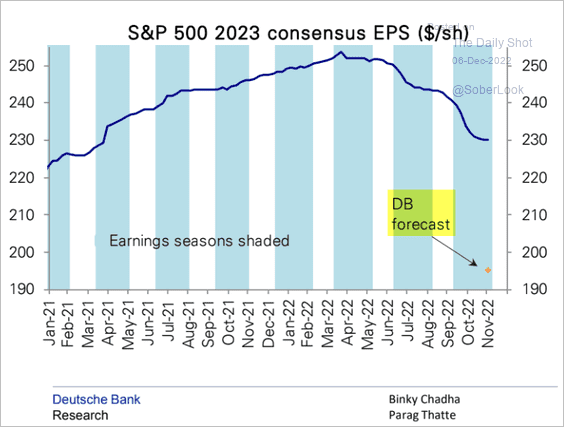 Source: Deutsche Bank Research
• BofA expects earnings to be down 15% (year-over-year) by mid-2023.
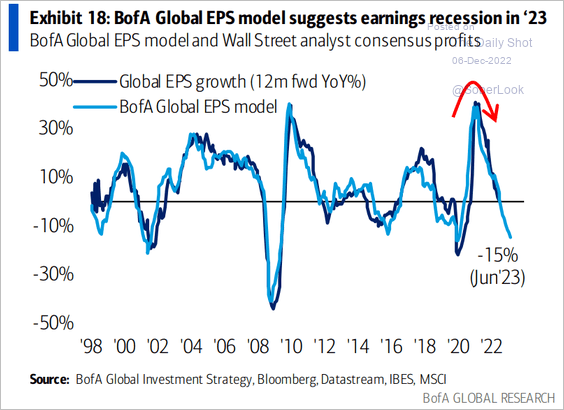 Source: BofA Global Research
• Of course, much will depend on the economic outcome. Here are some scenarios from Scotia Capital.
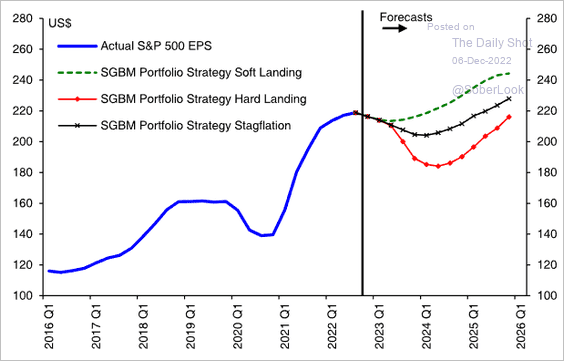 Source: Hugo Ste-Marie, Portfolio & Quantitative Strategy Global Equity Research, Scotia Capital
• This chart shows earnings forecasts at the beginning of the year vs. the actual figures.
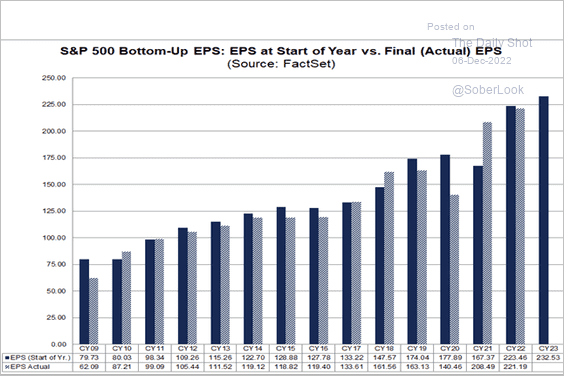 Source: @FactSet
——————–
4. Equity risk premium has diverged from fundamentals.
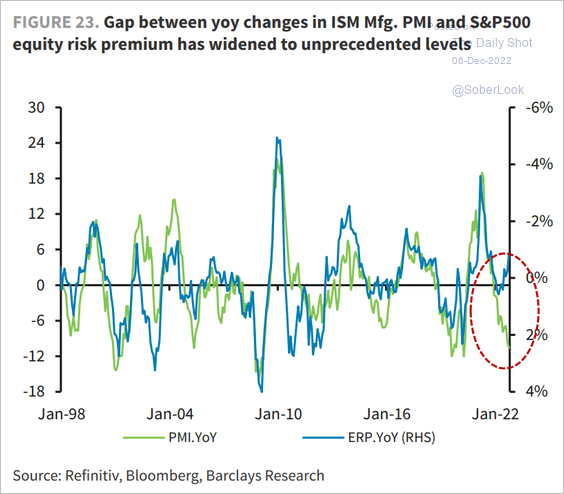 Source: Barclays Research
5. How does the S&P 500 perform after rate hikes stop?
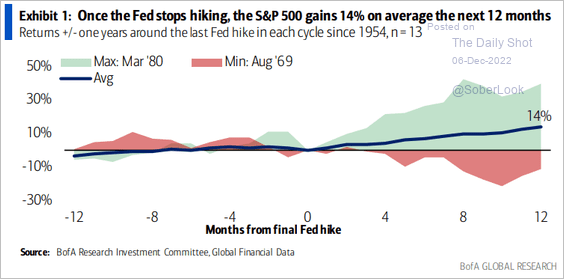 Source: BofA Global Research
6. Bearish sentiment has persisted for a while.
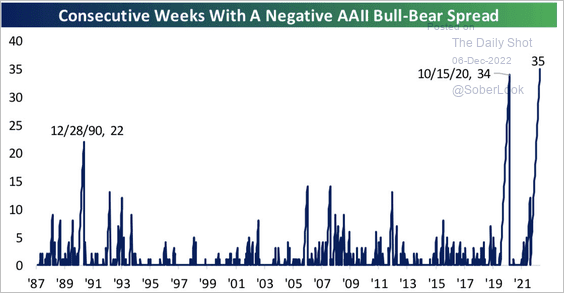 Source: @bespokeinvest, @AAIISentiment
Goldman’s sentiment indicator has deteriorated again.
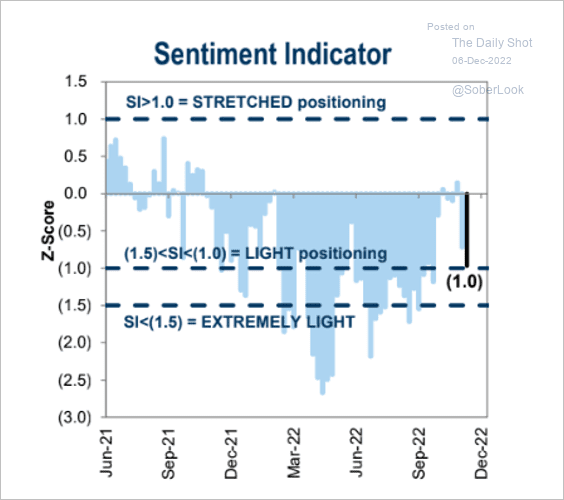 Source: Goldman Sachs; @MikeZaccardi
——————–
7. Here is short interest by sector (from S&P Global).
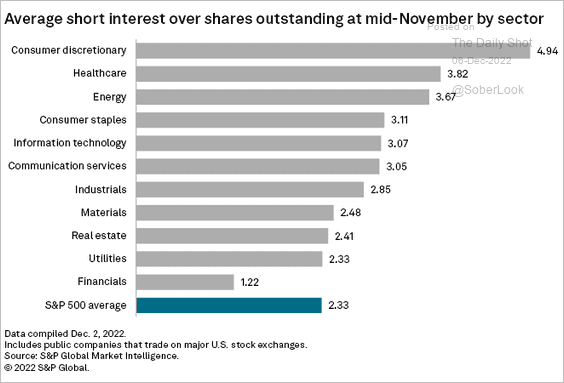 Source: S&P Global Market Intelligence
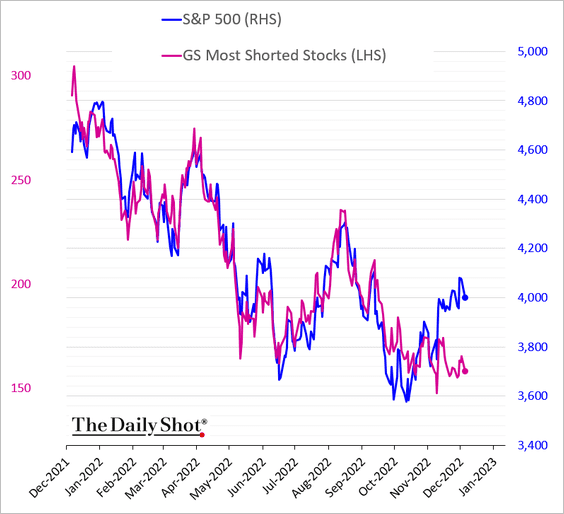
The latest rebound didn’t see much short-covering.
——————–
8. The current bear market hasn’t lasted very long relative to historical trends.
 Source: @LizAnnSonders
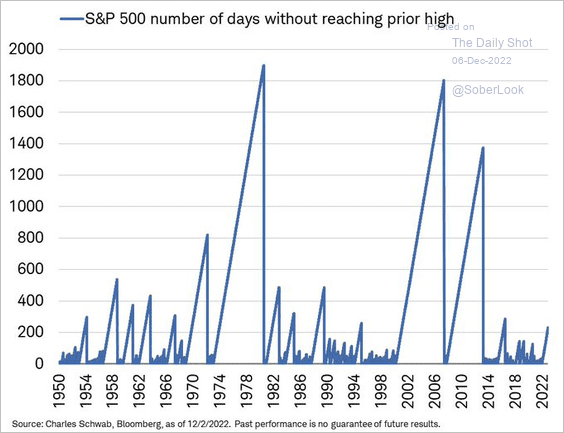
Getting back to the previous highs may take a while.
 Source: Truist Advisory Services
Back to Index
Credit
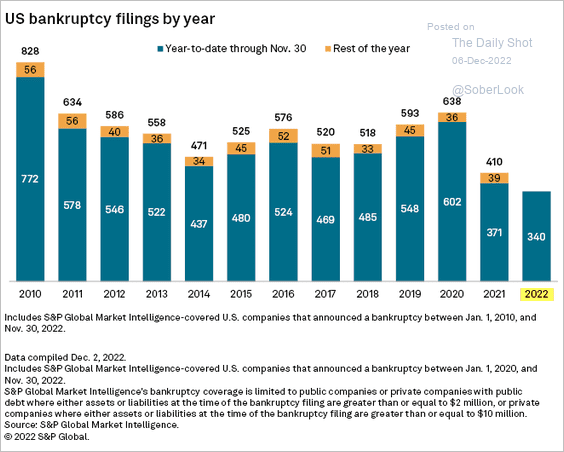
1. The number of bankruptcy filings has been relatively low this year.
 Source: S&P Global Market Intelligence
2. The slowdown in US investment-grade issuance means there is less debt outstanding that would mature in the next year.
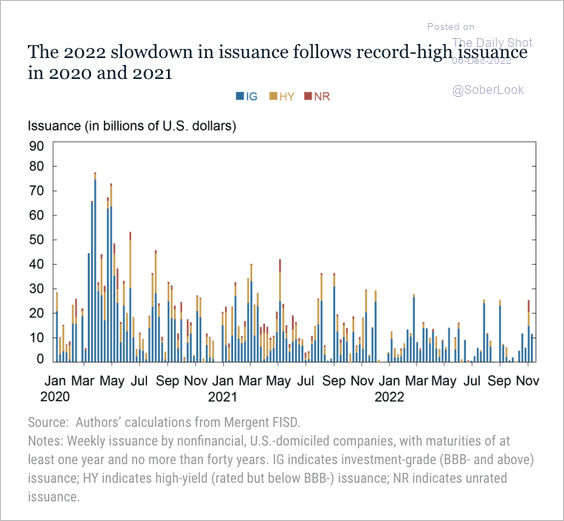 Source: Liberty Street Economics Read full article
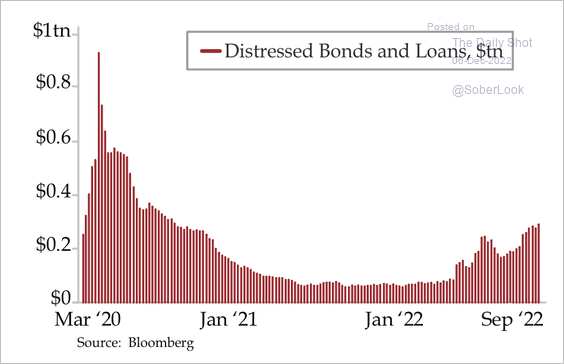
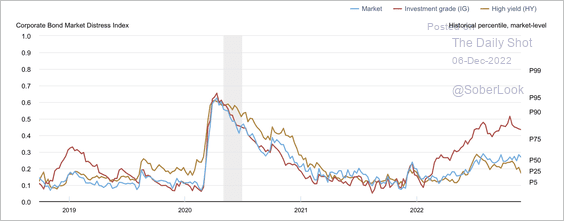
3. The amount of US distressed bonds and loans is rising, although well below 2020 levels.
 Source: Quill Intelligence
The NY Fed’s Corporate Bond Market Distress Index’s (CDMI) rise has been modest despite aggressive rate hikes. The CDMI is also below its starting point at the beginning of the 2015 hiking cycle.
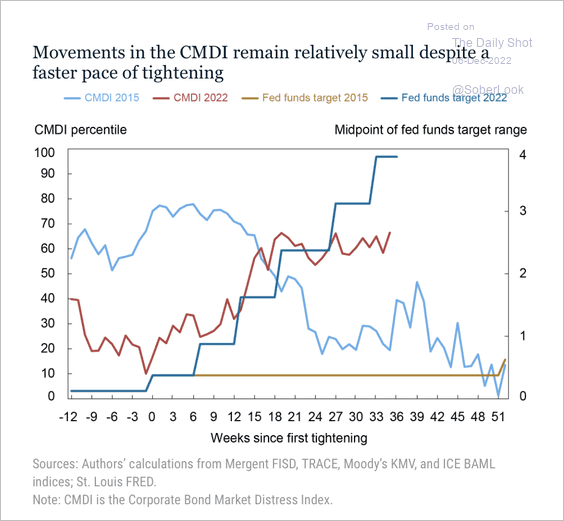 Source: Liberty Street Economics Read full article
However, the investment-grade CDMI increased rapidly earlier this year, and remained elevated relative to 2015 levels. The average maturity for IG bonds is longer than high-yield bonds, so it is less sensitive to changes in monetary policy, according to the NY Fed. That means geopolitical uncertainty probably weighed on the IG market. (2 charts)
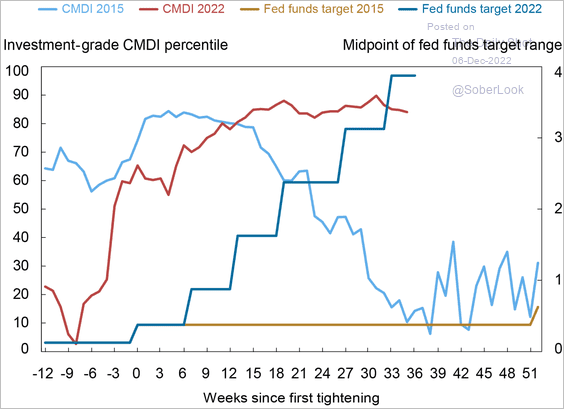 Source: Liberty Street Economics Read full article
 Source: Liberty Street Economics Read full article
——————–
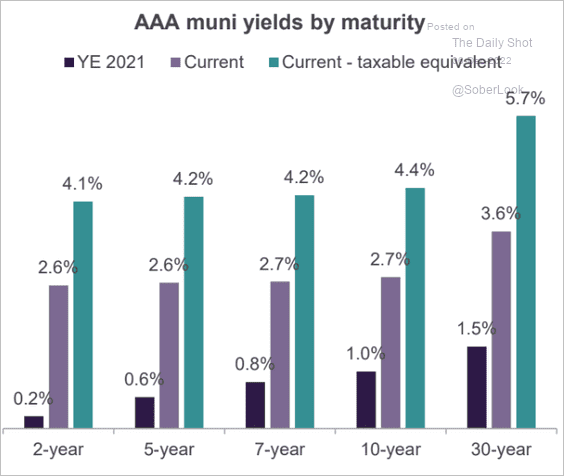
4. AAA munis are not cheap relative to Treasuries, based on the averages over the past decade.
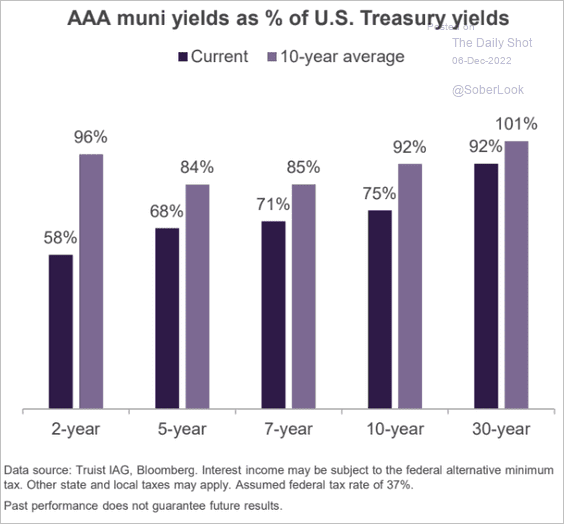 Source: Truist Advisory Services
But muni taxable-equivalent yields have risen sharply.
 Source: Truist Advisory Services
Back to Index
Rates
1. Central banks outside of the US have offloaded Treasuries as FX reserves declined.
 Source: Deutsche Bank Research
2. How do Treasuries perform after the Fed’s last rate hike?
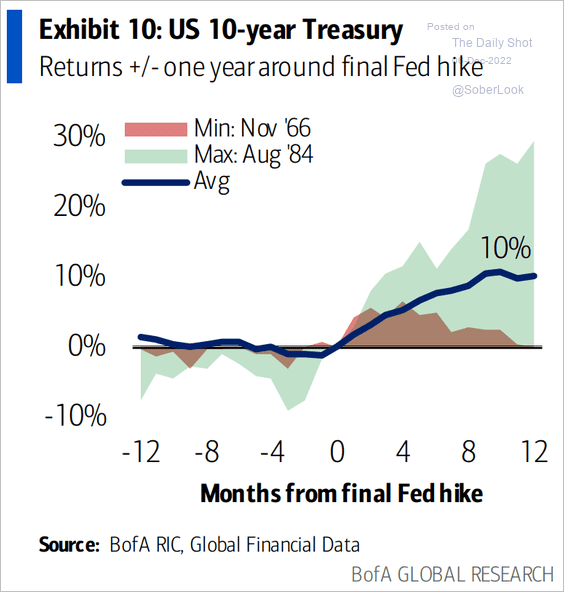 Source: BofA Global Research
3. Rate markets’ implied volatility remains well above the equities’ equivalent.
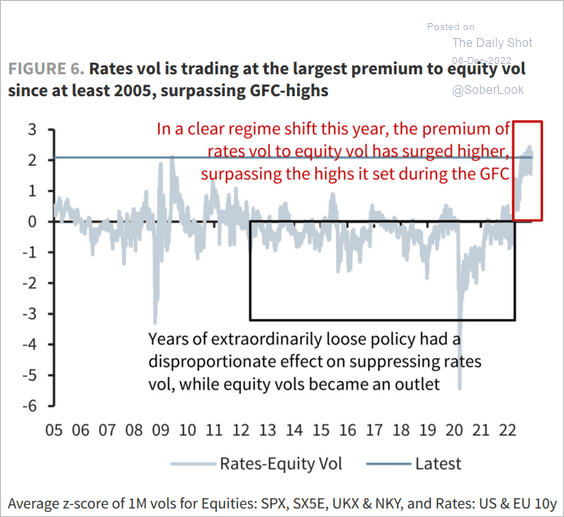 Source: Barclays Research
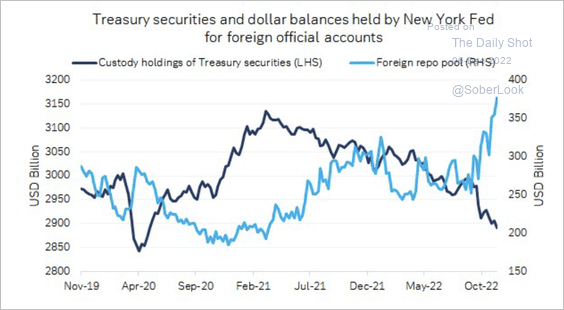
4. The foreign repo pool is an attractive place to park dollars.
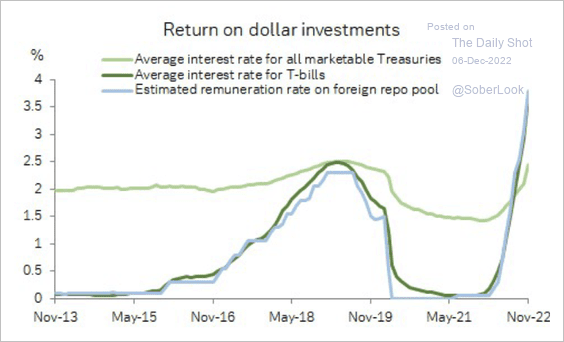 Source: Deutsche Bank Research
Back to Index
Global Developments
1. Global business activity increasingly looks recessionary (manufacturing and services).
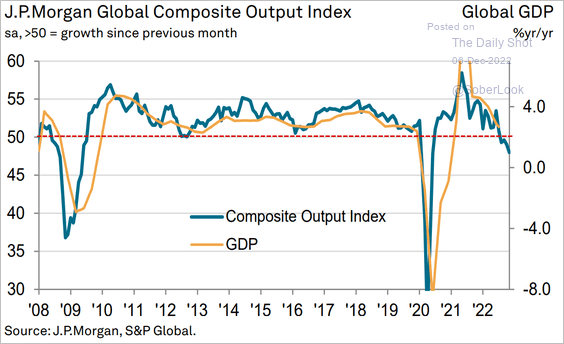 Source: S&P Global PMI
2. This chart shows global direct investment in the semiconductor sector.
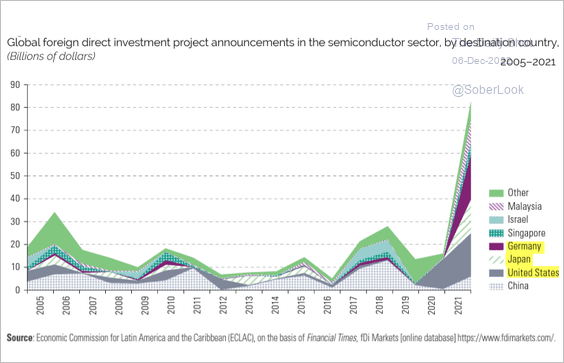 Source: UN Read full article
——————–
Food for Thought
1. Holiday purchases by category:
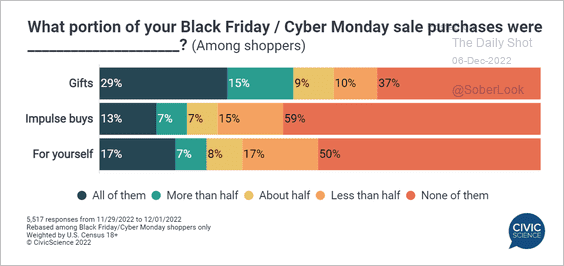 Source: @CivicScience
2. Who is finished with holiday shopping?
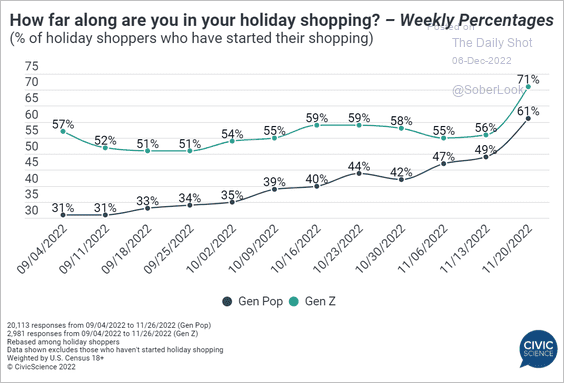 Source: @CivicScience
3. Aquaculture:
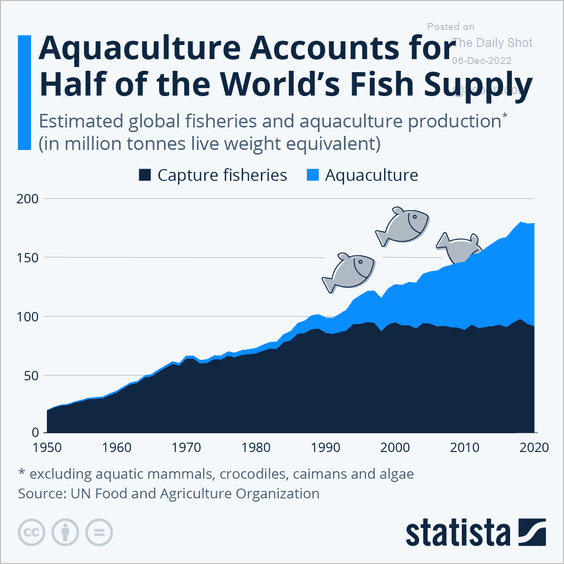 Source: Statista
4. Support for rationing and price controls amid the post-WW-II inflation spike (1947):
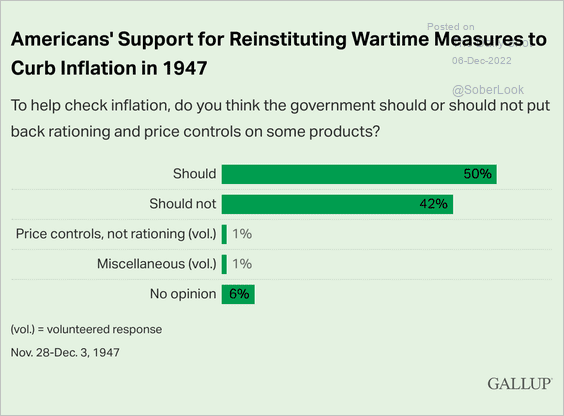 Source: Gallup Read full article
5. World population growth (2 charts):
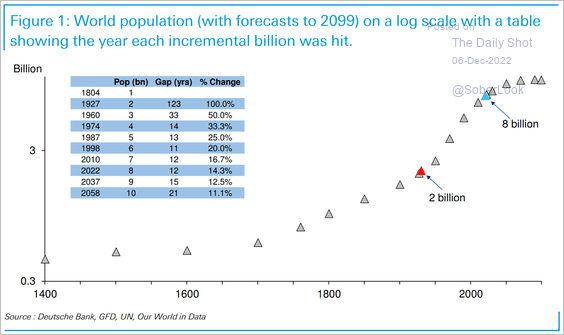 Source: Deutsche Bank Research
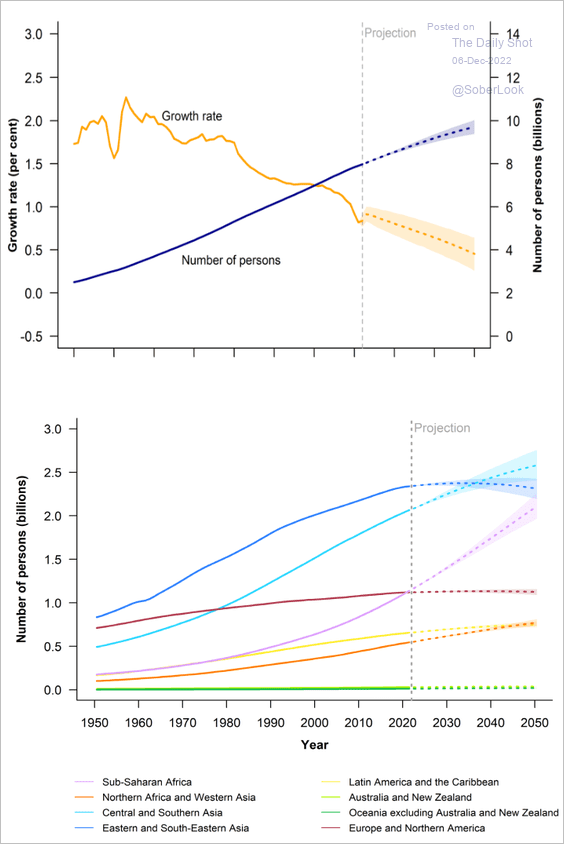 Source: UN Read full article
——————–
6. Autocratic and democratic hosts of international sporting events:
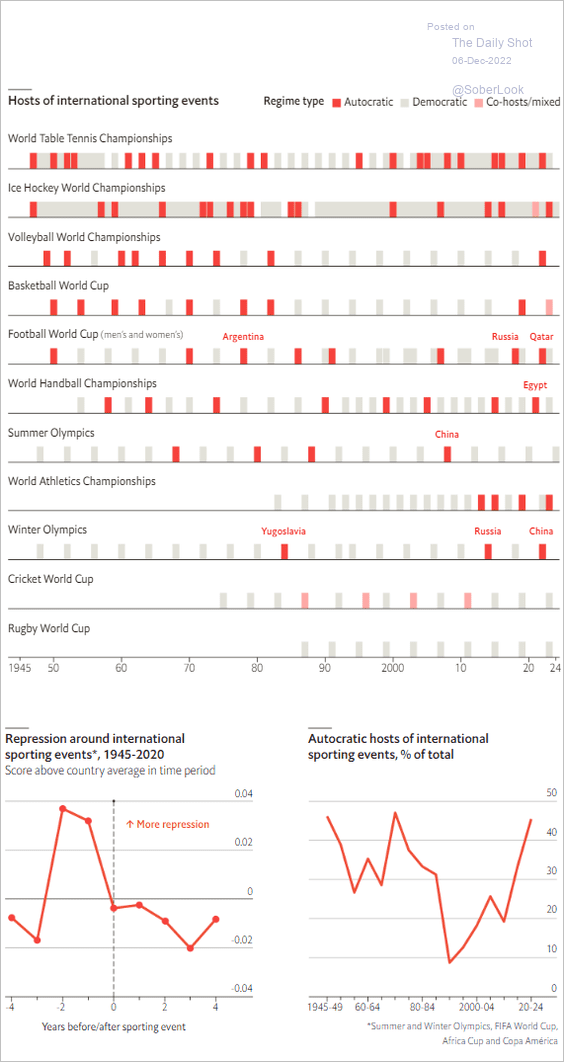 Source: The Economist Read full article
7. US beer preferences:
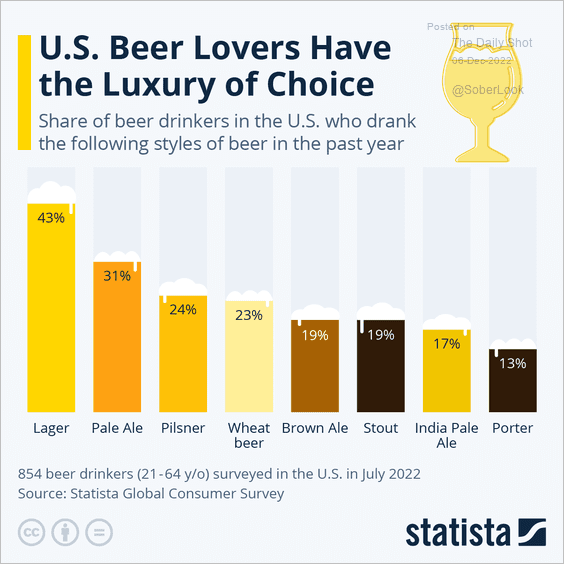 Source: Statista
——————–
Back to Index