
The Daily Shot: 08-Dec-22
• The United States
• Canada
• The United Kingdom
• The Eurozone
• Europe
• Asia – Pacific
• China
• Emerging Markets
• Commodities
• Energy
• Equities
• Alternatives
• Credit
• Rates
• Global Developments
• Food for Thought
The United States
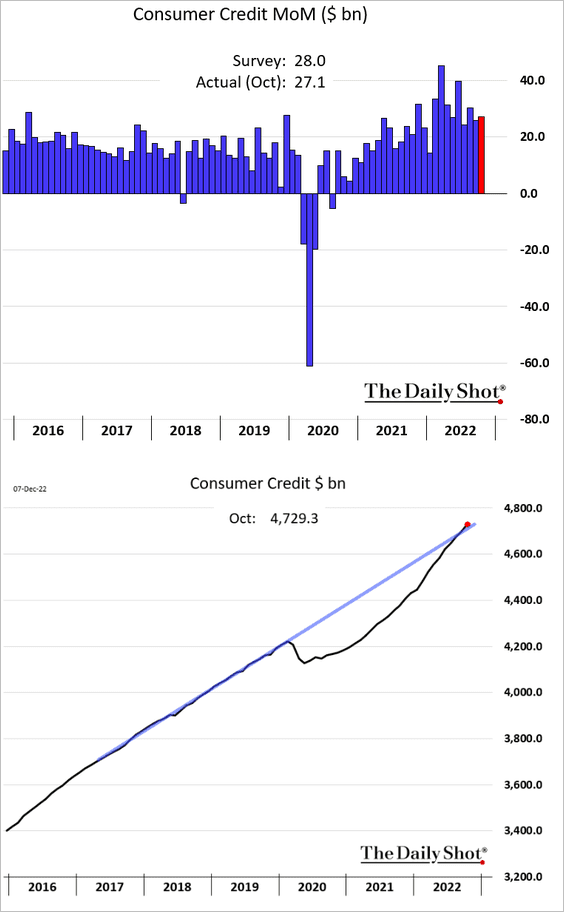
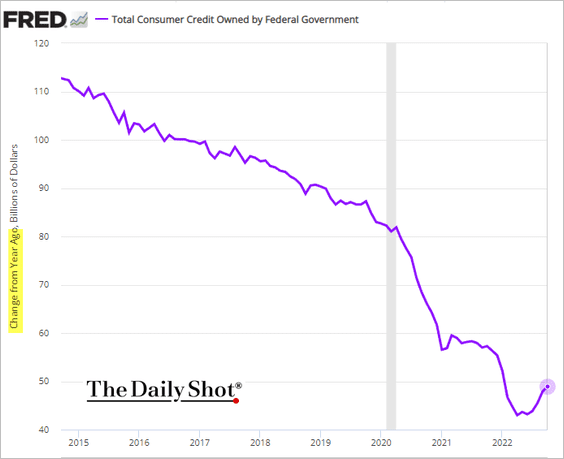
1. Consumer credit growth remains elevated.
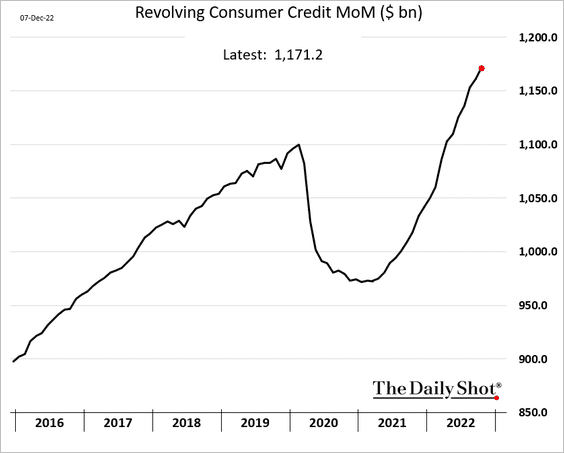
• Credit card debt surged this year.
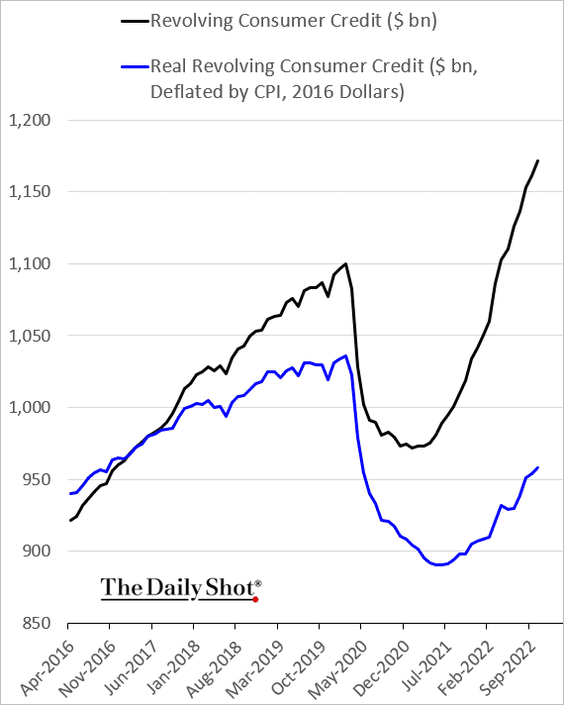
That debt buys a lot less these days.
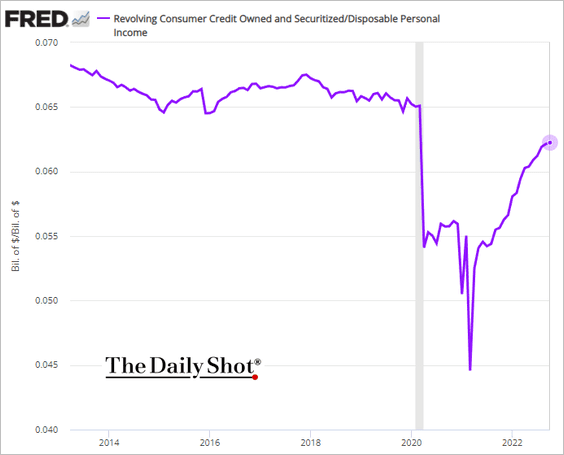
Credit card debt remains below pre-COVID levels as a share of disposable income.
• Credit card rates have been surging.
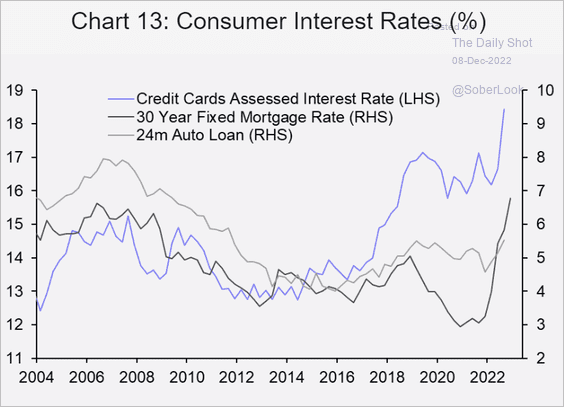 Source: Capital Economics
• Growth in student debt is starting to recover.
——————–
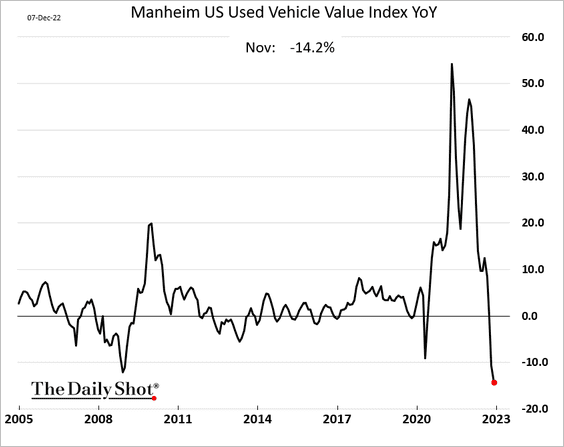
2. Wholesale used-car prices are down 14% vs. 12 months ago.
 Source: CNBC Read full article
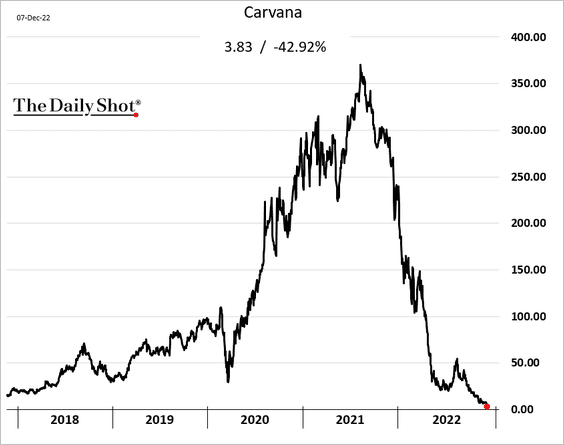
By the way, Carvana’s share price has collapsed as the used car market faces some headwinds.
 Source: CNBC Read full article
——————–
3. Next, we have some updates on the housing market.
• Mortgage applications remain soft.
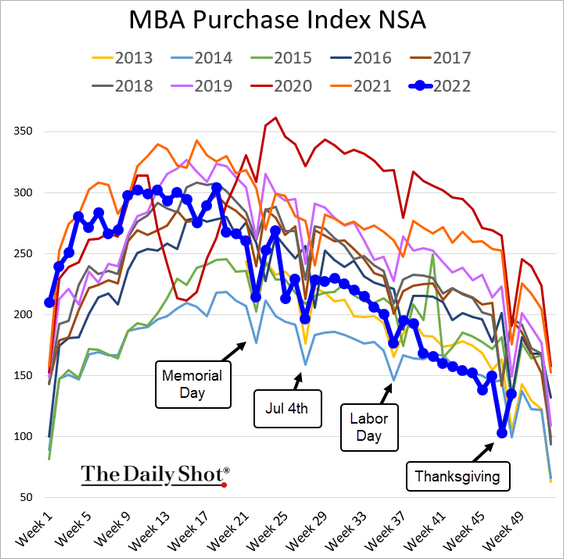
This chart shows mortgage rate locks.
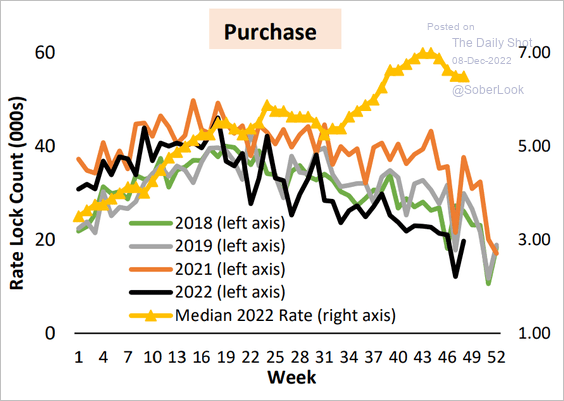 Source: AEI Housing Center
• CoreLogic still expects year-over-year home price changes to remain in positive territory next year.
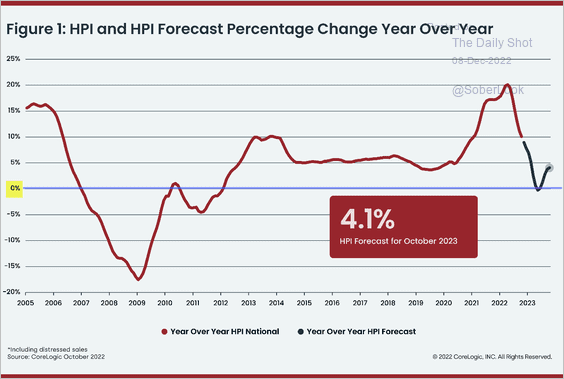 Source: CoreLogic
The AEI Housing Center expects a very different outcome.
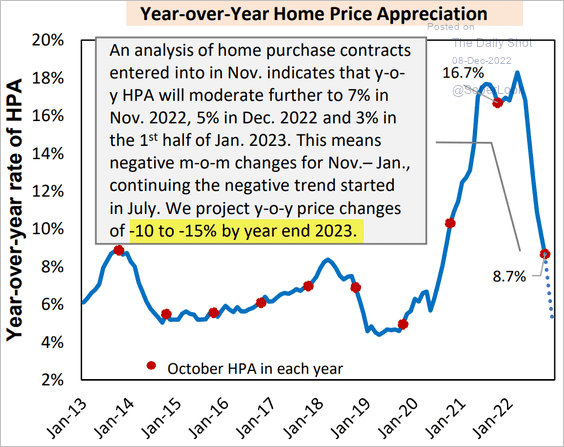 Source: AEI Housing Center
• US homes remain overvalued.
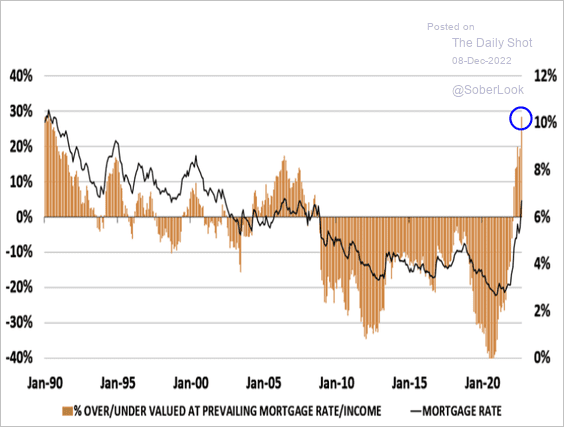 Source: Andrew Reading, BI, @TheTerminal, Bloomberg Finance L.P.
• Here is a comment from Goldman on the housing market.
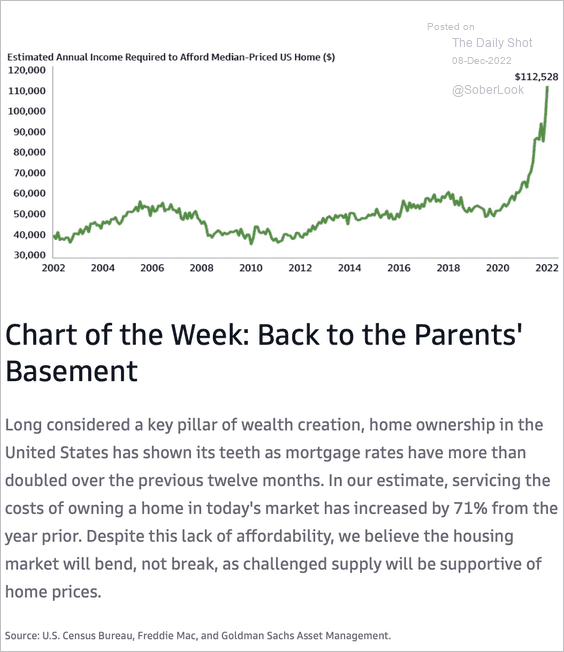 Source: Goldman Sachs; @GratkeWealth
• The current housing market reflects a similar demand/supply imbalance as the 1970s. (2 charts)
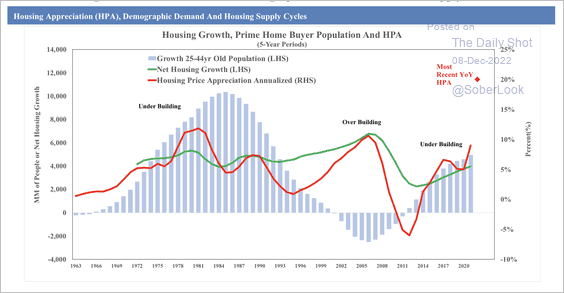 Source: SOM Macro Strategies
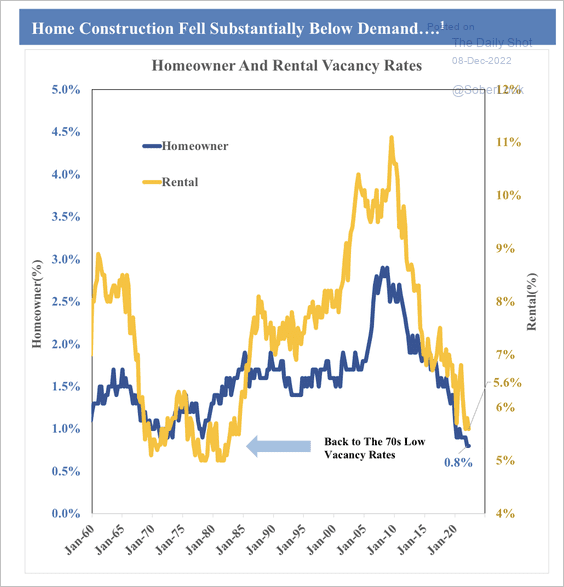 Source: SOM Macro Strategies
• Mortgage delinquency rates remain low.
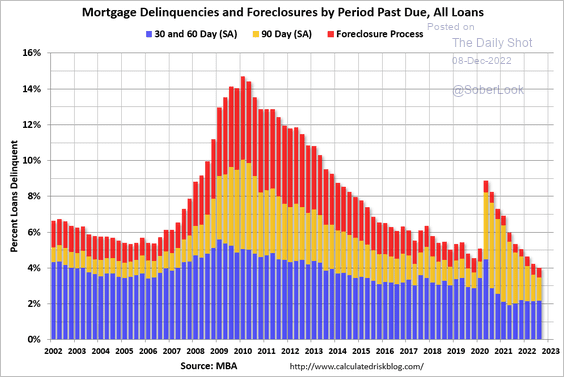 Source: Calculated Risk
• This chart shows new home sales during Fed rate hike cycles.
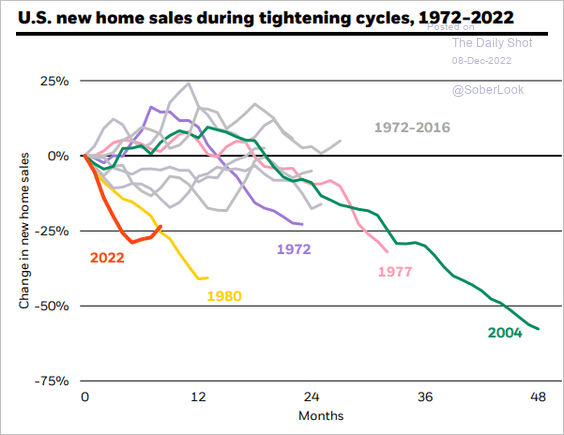 Source: BlackRock Investment Institute
• Adjustable-rate mortgages remain a small portion of total mortgage balances.
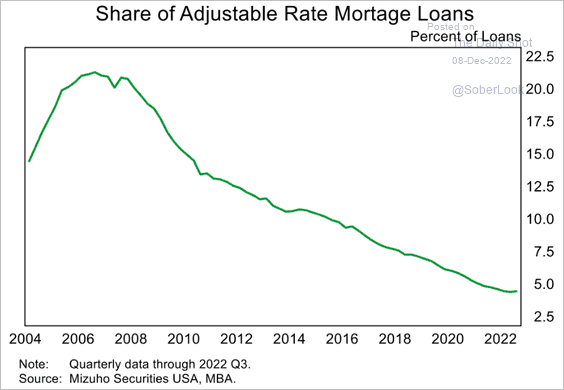 Source: Mizuho Securities USA
Back to Index
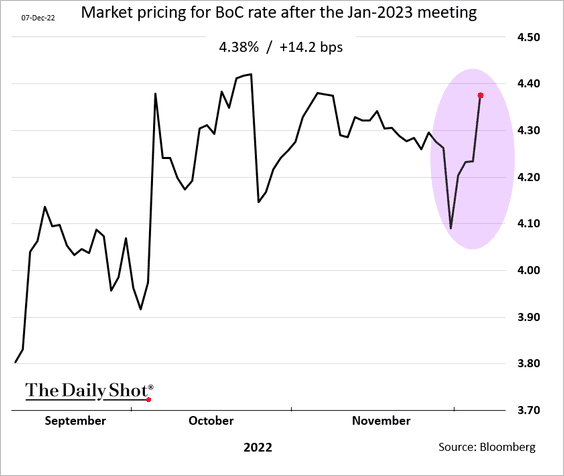
Canada
The BoC hiked by 50 bps.
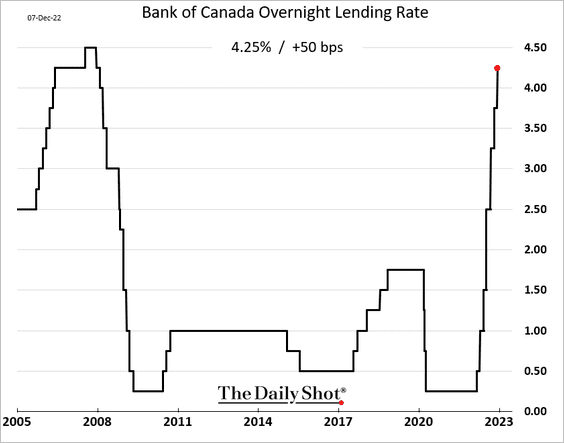
Markets saw the BoC’s comments as being on the hawkish side. Rate expectations climbed, with 50 bps now fully priced in for January.
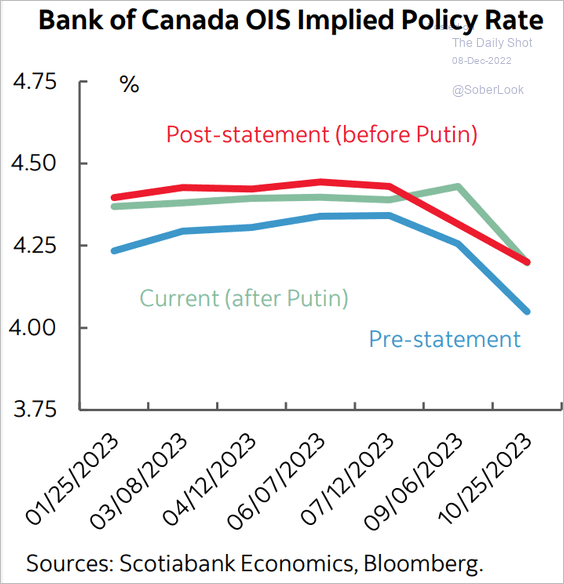 Source: Scotiabank Economics
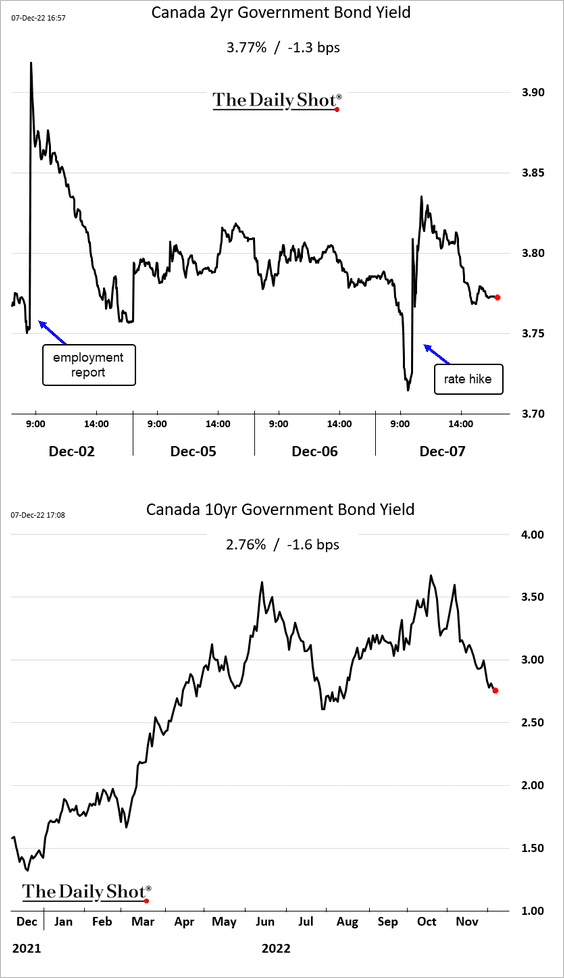
Here are the changes in bond yields.
Back to Index
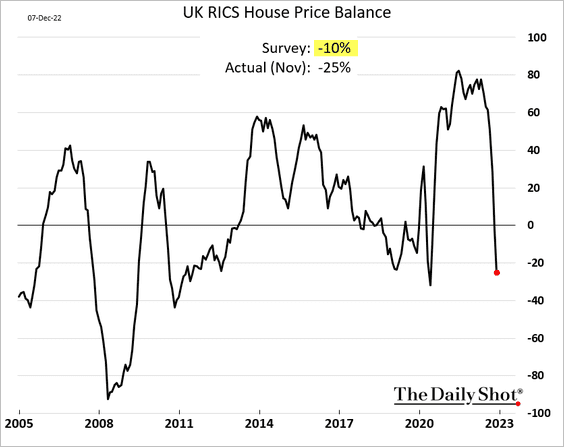
The United Kingdom
1. The RICS report signaled trouble for the housing market.
 Source: Reuters Read full article
Here is what it means for the official home price index.
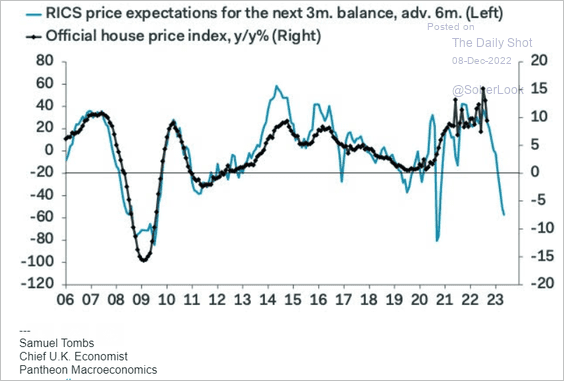 Source: Pantheon Macroeconomics
An alternative measure of home prices showed a sharp decline last month.
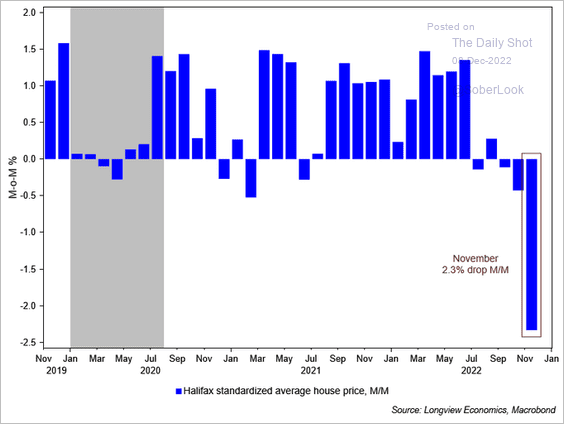 Source: @Lvieweconomics
——————–
2. Labor activity is on the rise.
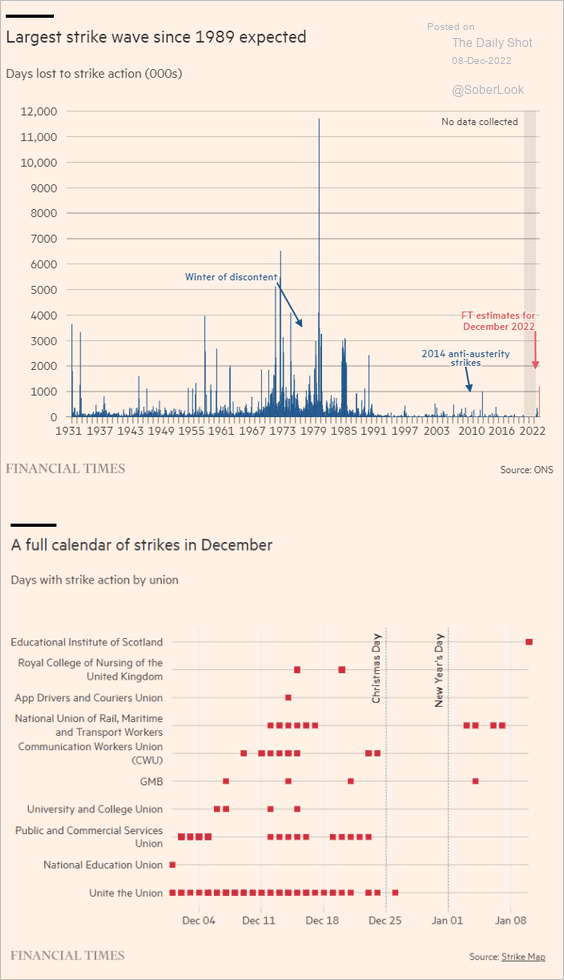 Source: @financialtimes Read full article
Back to Index
The Eurozone
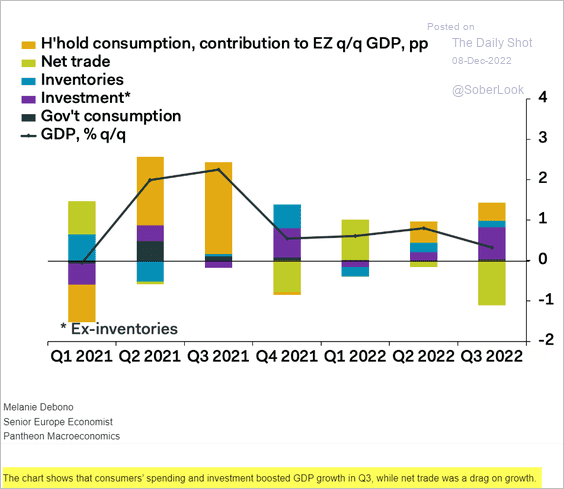
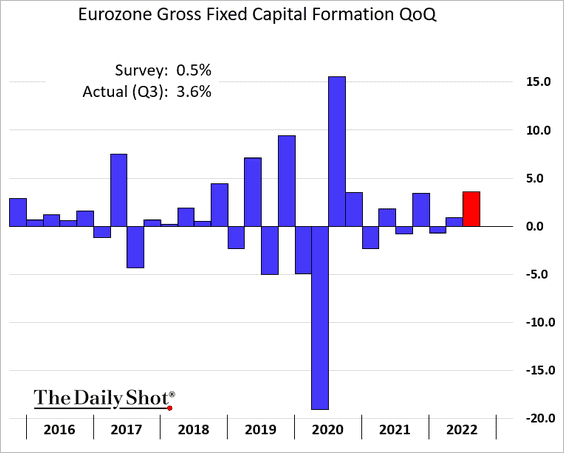
1. Investment boosted the Q3 GDP growth (2 charts).
 Source: Pantheon Macroeconomics
——————–
2. Wage growth is driving services inflation.
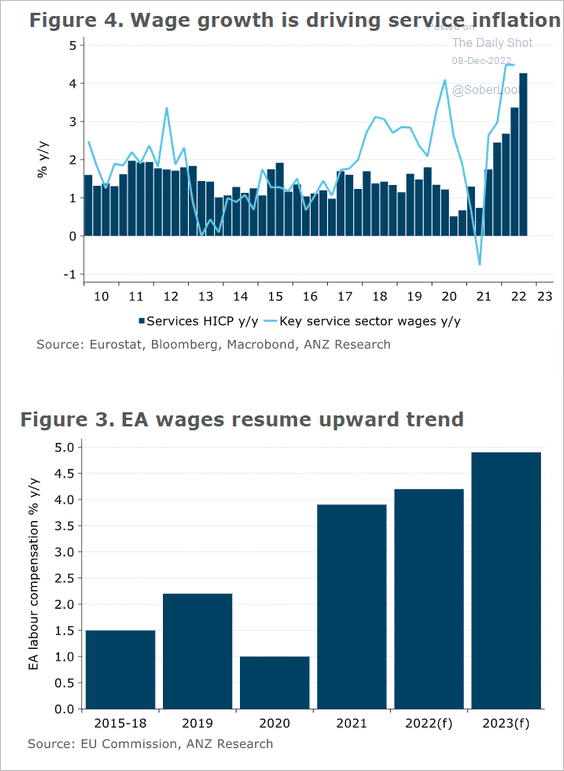 Source: @ANZ_Research
3. The ECB partially unwound the support it gave to Eurozone “periphery” bonds in the summer.
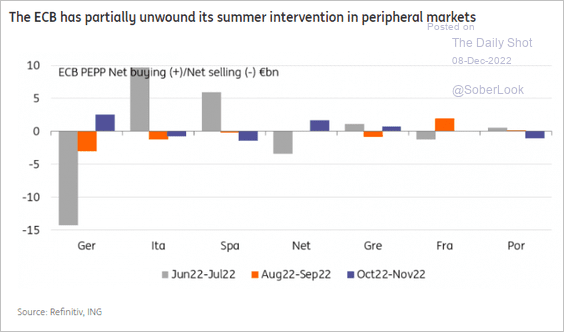 Source: ING
3. Spain’s housing prices are massively lagging behind other advanced economies.
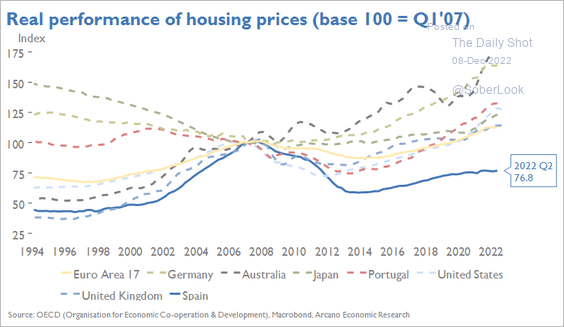 Source: Arcano Economics
4. European stocks have been outperforming the US (2 charts).
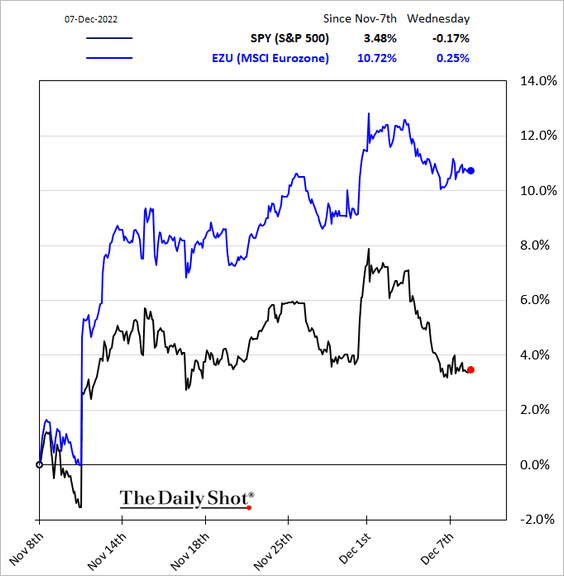
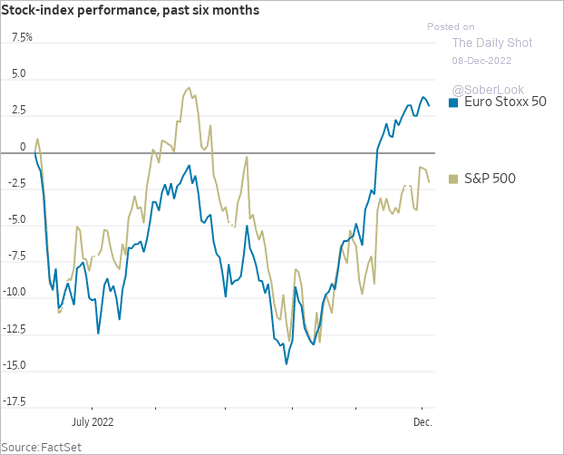 Source: @WSJ Read full article
• ETF flows have picked up.
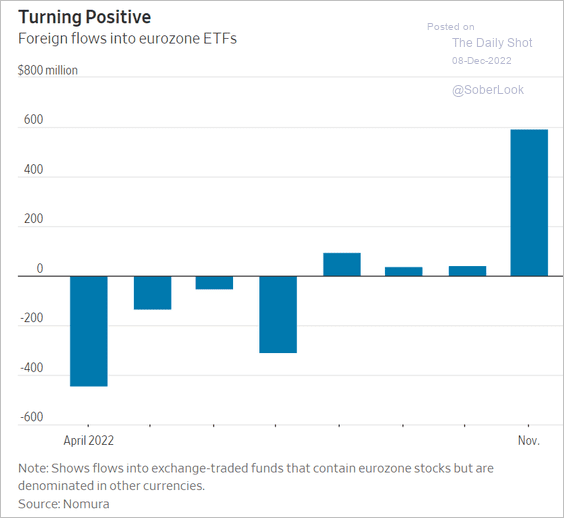 Source: @WSJ Read full article
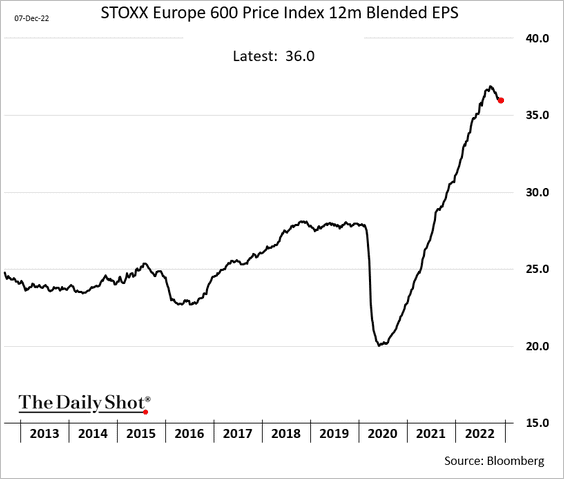
• Earnings expectations remain upbeat.
• Valuations are attractive relative to the US.
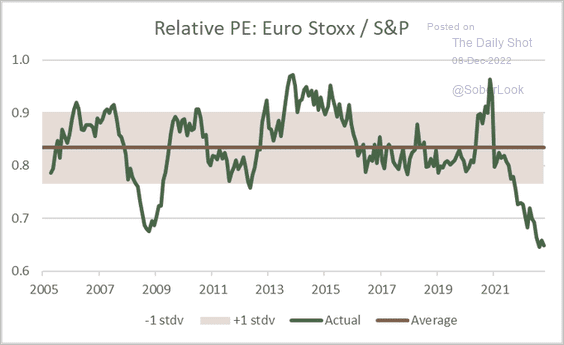 Source: @StephaneDeo, h/t @topdowncharts
Back to Index
Europe
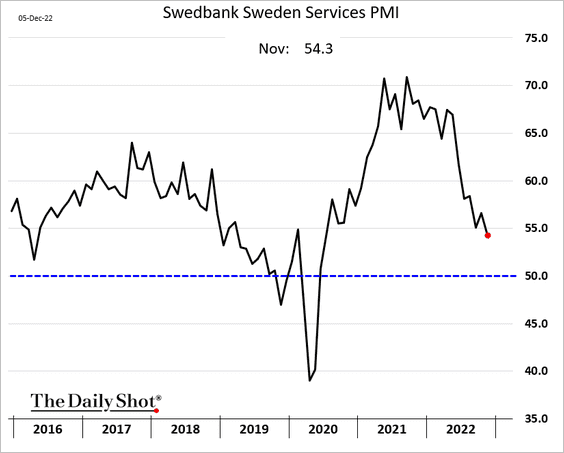
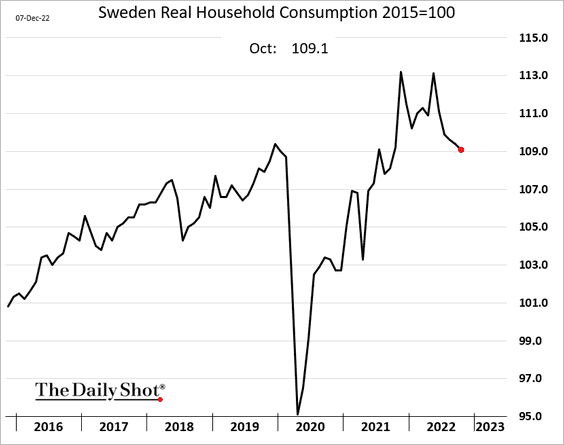
1. Let’s begin with Sweden.
• Services growth is slowing.
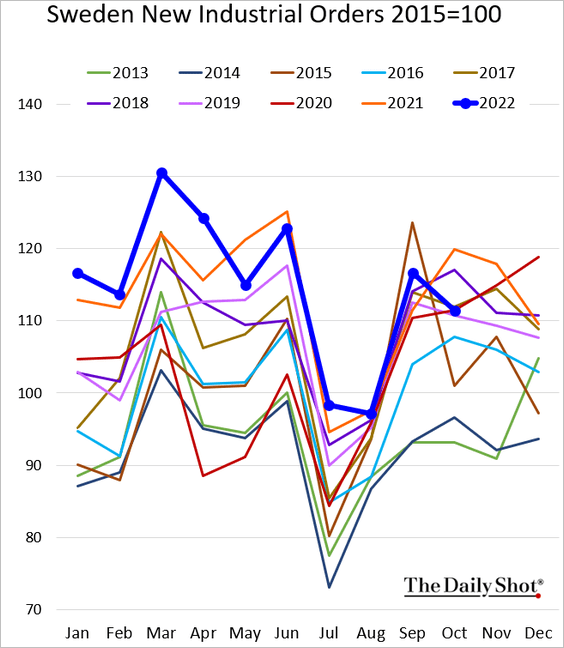
• Private sector output continued to climb in October.
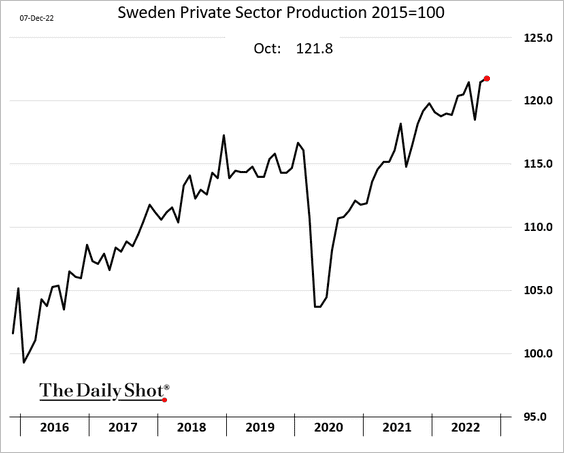
But industrial orders were softer.
• Household consumption is back at pre-COVID levels.
——————–
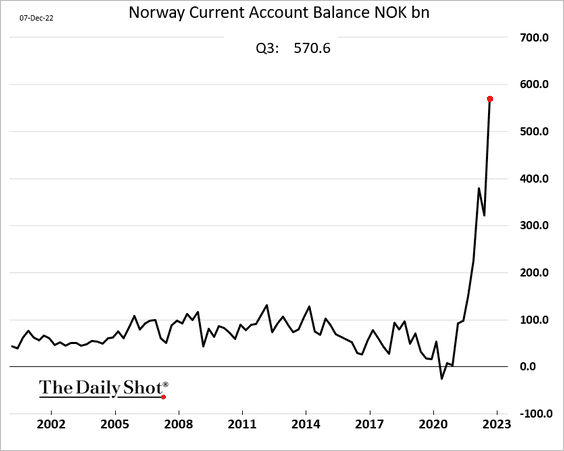
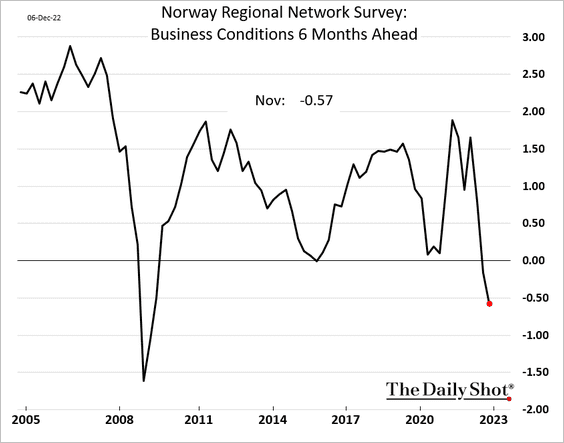
2. Next, we have some updates on Norway.
• The current account surplus exploded this year as energy prices and deliveries surged.
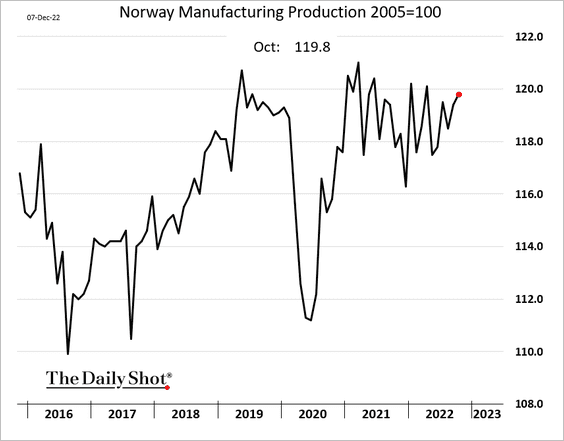
• Manufacturing output remains robust.
• The output gap is narrowing.
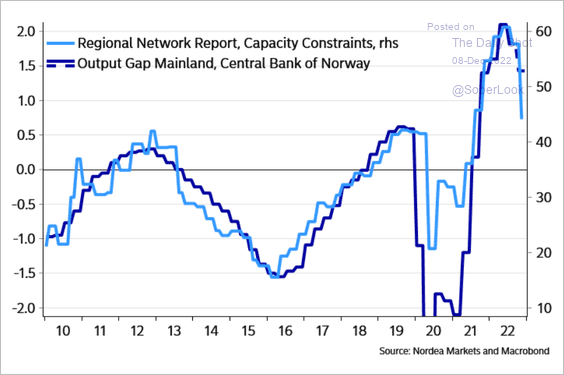 Source: Nordea Markets
• Expected business conditions have deteriorated.
——————–
3. Swiss FX reserves continue to fall as the SNB lightens the load.
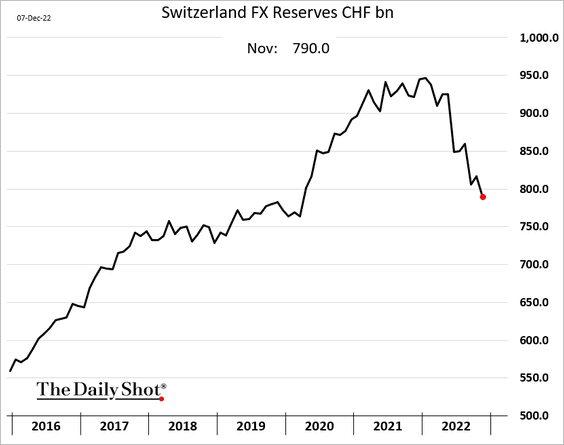
The SNB’s profit tumbled as stocks, bonds, and the euro (in SNB’s portfolio) took a hit in 2022.
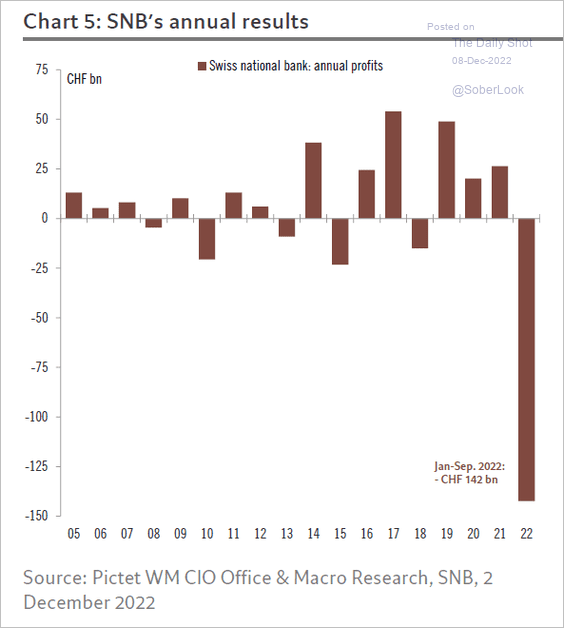 Source: Pictet Wealth Management
Back to Index
Asia – Pacific
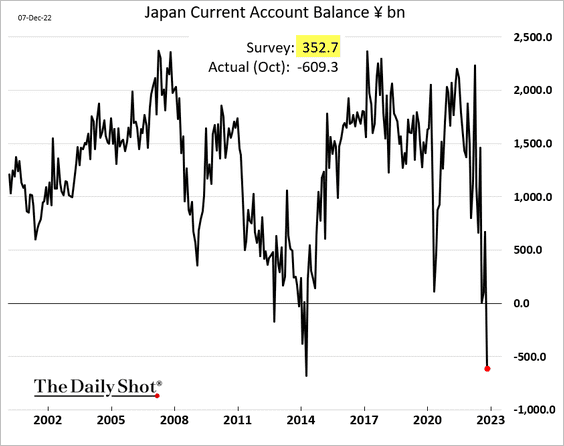
1. Japan’s trade gap remains wide.
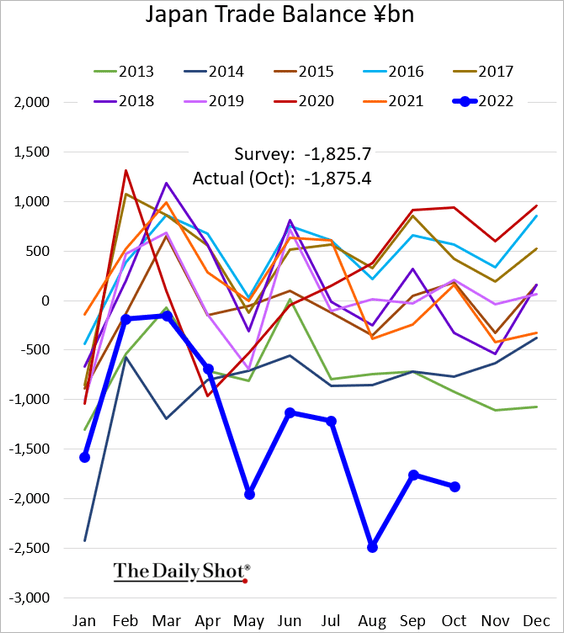
The current account swung into deficit for the first time since 2014.
——————–
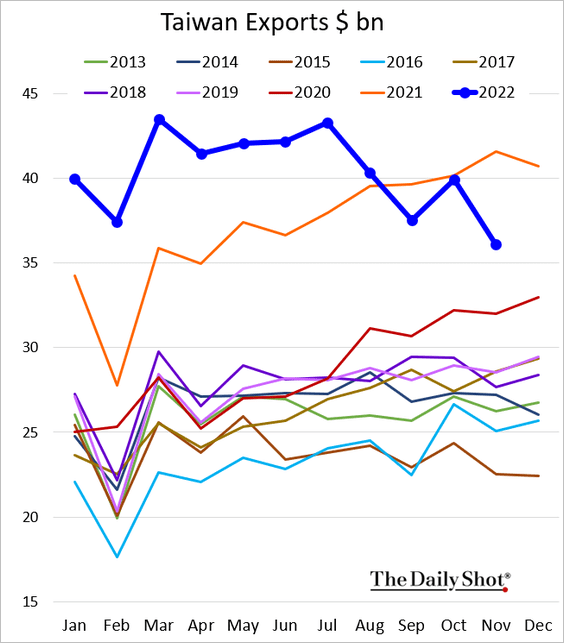
2. Taiwan’s exports deteriorated last month.
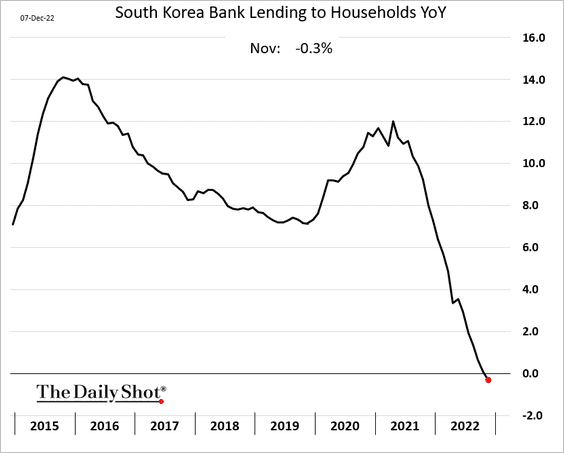
3. South Korea’s household credit growth is now negative on a year-over-year basis.
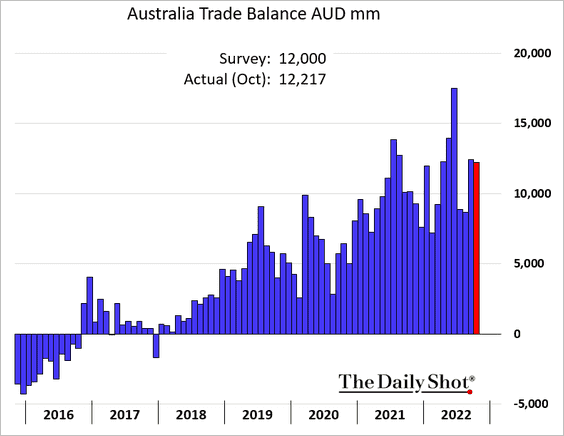
4. Australia’s trade surplus remains elevated.
Back to Index
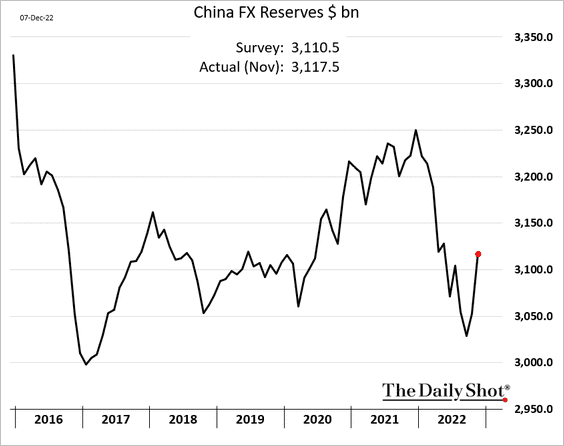
China
1. FX reserves are rebounding.
2. The RMB trading volume continues to climb, with more institutions participating. Volatility has risen.
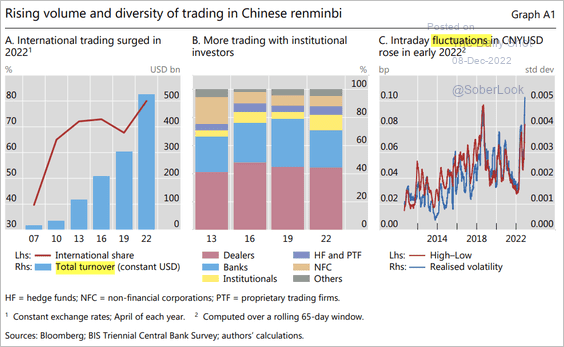 Source: BIS Read full article
3. It’s been a while since we saw year-over-year declines in exports.
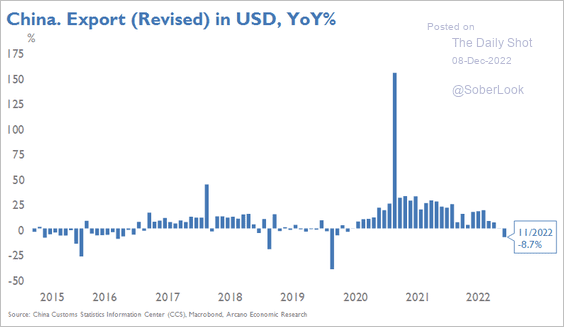 Source: Arcano Economics
4. Corporate bond spreads have been widening.
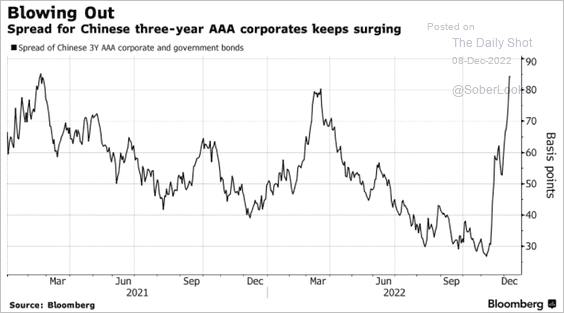 Source: @KevinKingsbury, @TheTerminal, Bloomberg Finance L.P.
5. Stock valuations are rising from low levels, although still below the broader EM basket.
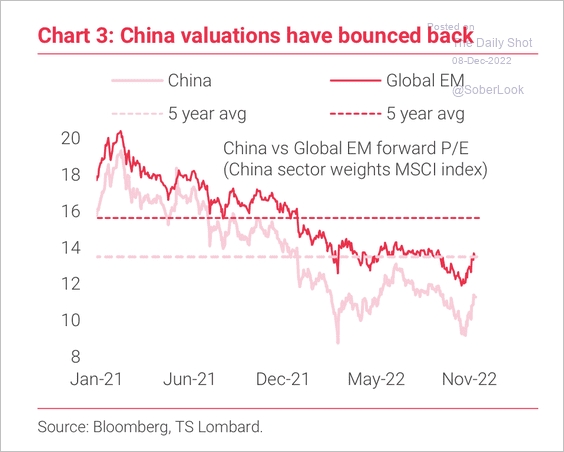 Source: TS Lombard
6. US retail investors got burned betting against Chinese shares.
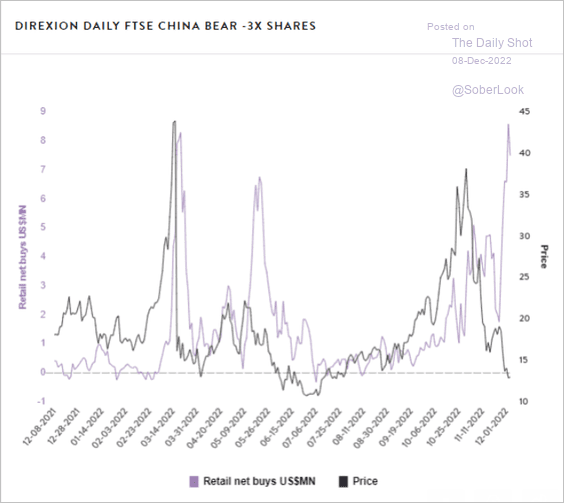 Source: Vanda Research
Back to Index
Emerging Markets
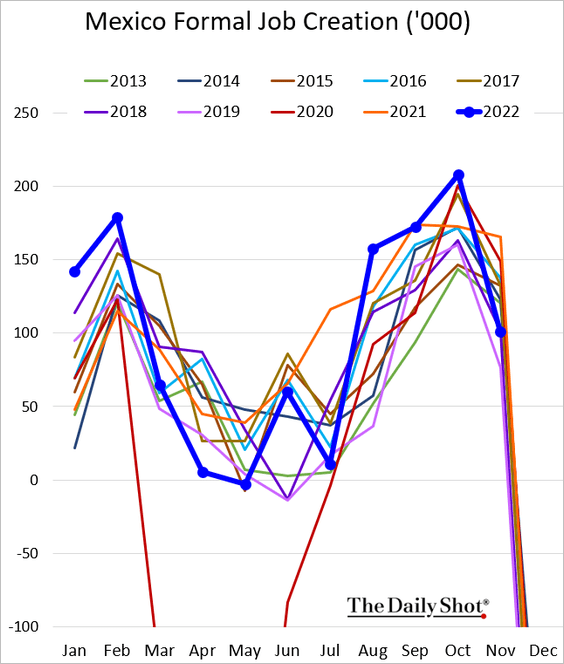
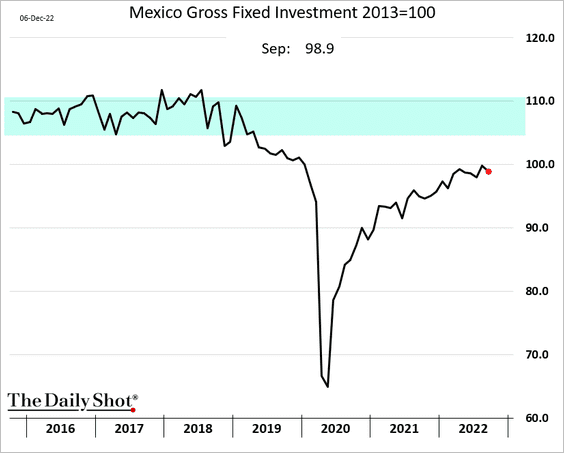
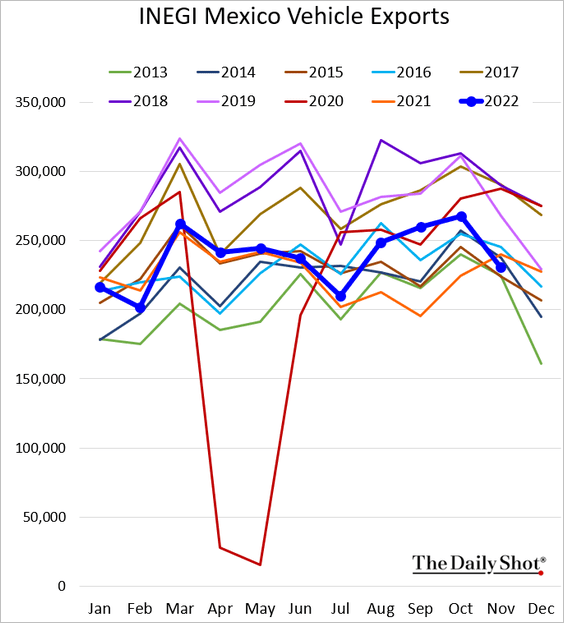
1. Let’s begin with Mexico.
• Formal job creation (well below last year’s level):
• Investment:
• Vehicle exports:
——————–
2. Peru’s president lost his job.
 Source: @axios Read full article
The Peruvian sol declined.
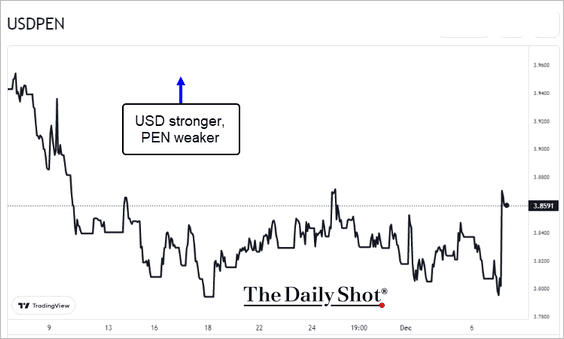
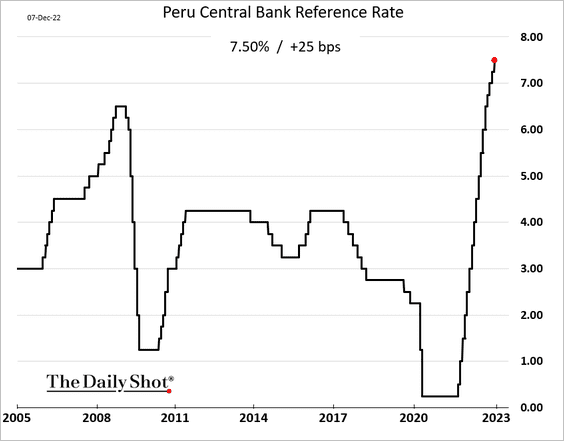
The central bank hiked rates again.
——————–
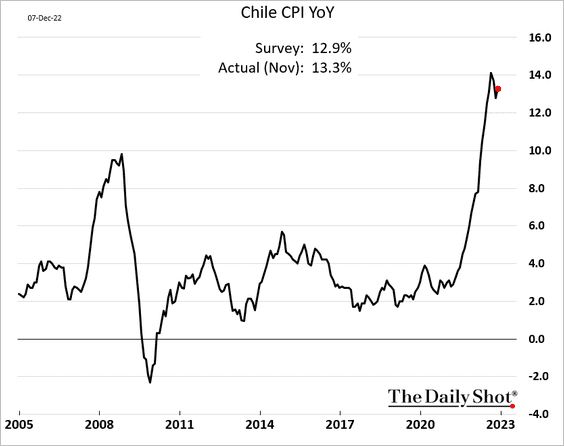
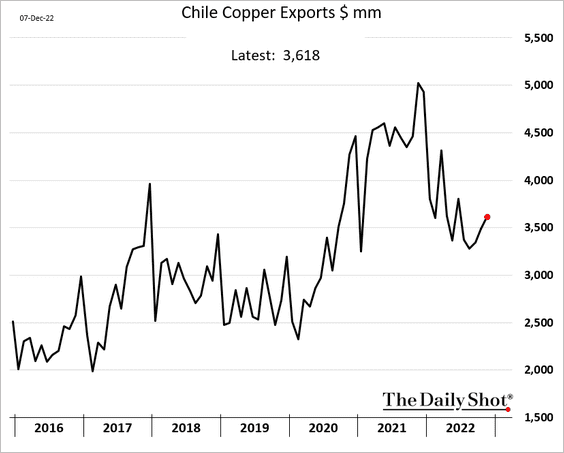
3. Chile’s CPI topped expectations.
The trade balance was in surplus.
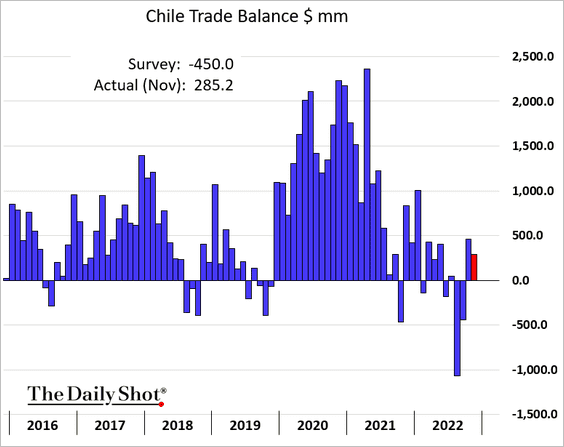
Copper exports increased (in dollar terms).
——————–
4. EM inflation has surprised to the downside.
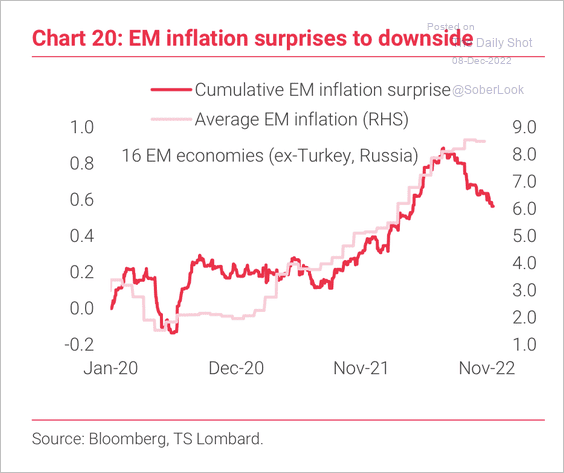 Source: TS Lombard
Back to Index
Commodities
1. Mining stocks have about three times the market volatility of spot gold due to their operating leverage, according to PGM Global.
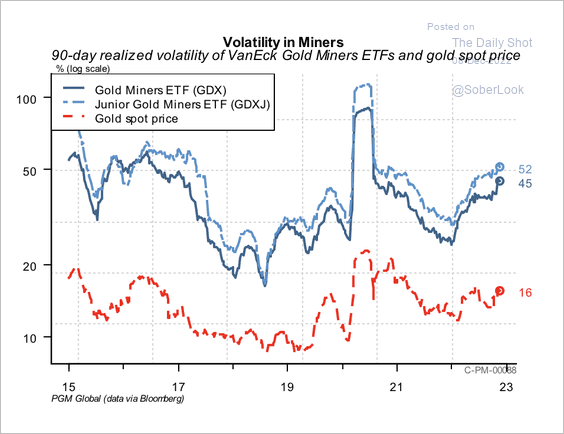 Source: PGM Global
2. The LME Nickel price continues to show bullish momentum as inventories trend lower.
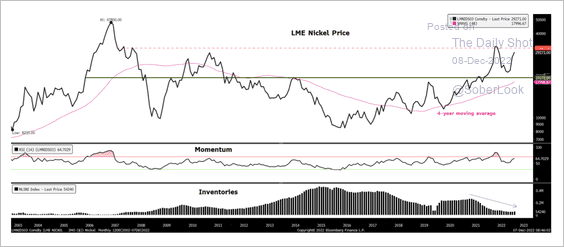 Source: Aazan Habib, Paradigm Capital
3. Central banks bought a lot of gold in recent months.
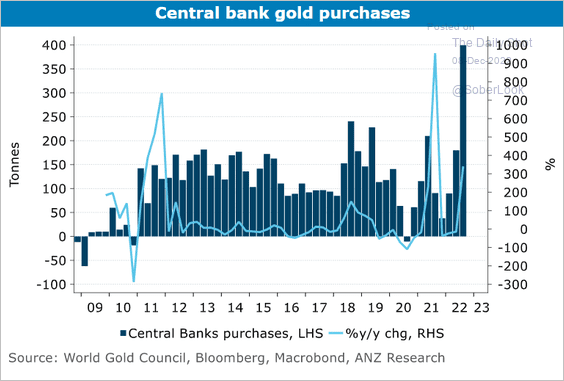 Source: @ANZ_Research
Back to Index
Energy
1. US oil inventories hit a multi-year low last week.
– Barrels:
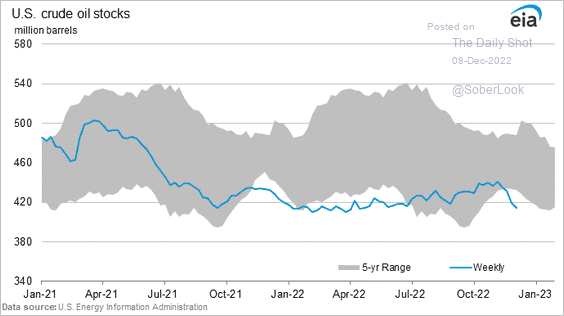
– Days of supply:

– The recent decline in inventories has been massive.
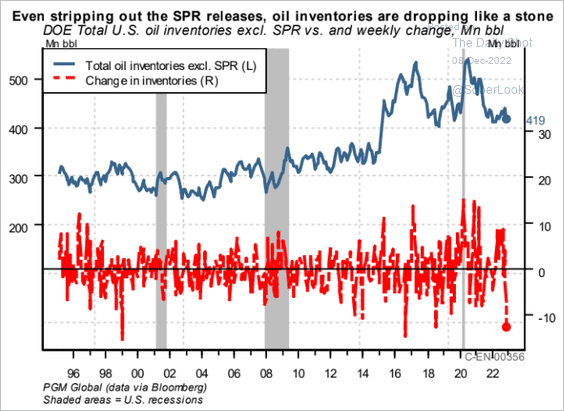 Source: PGM Global
– We are at a 36-year low if the Strategic Petroleum Reserve is included.
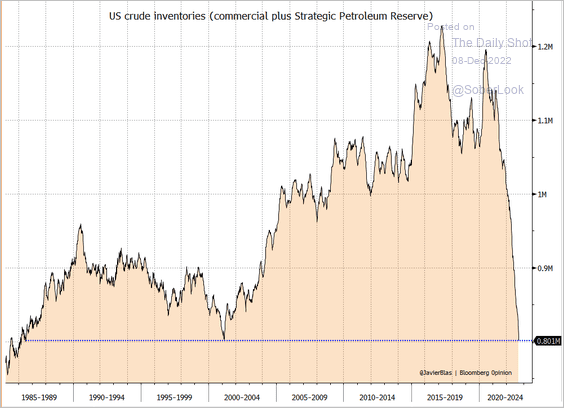 Source: @JavierBlas
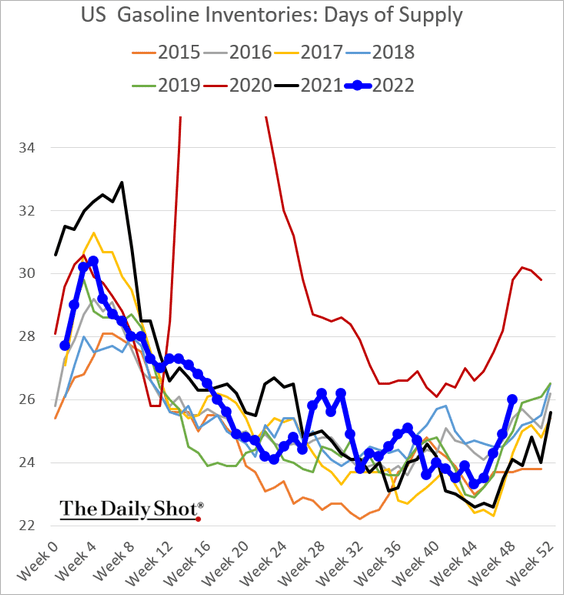
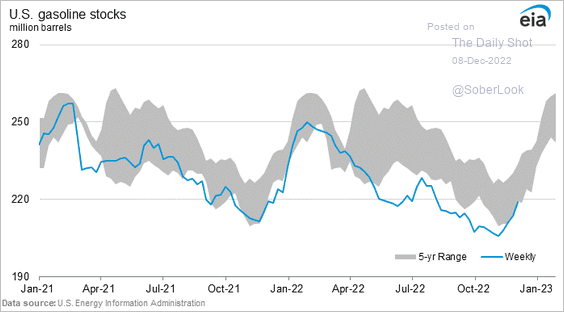
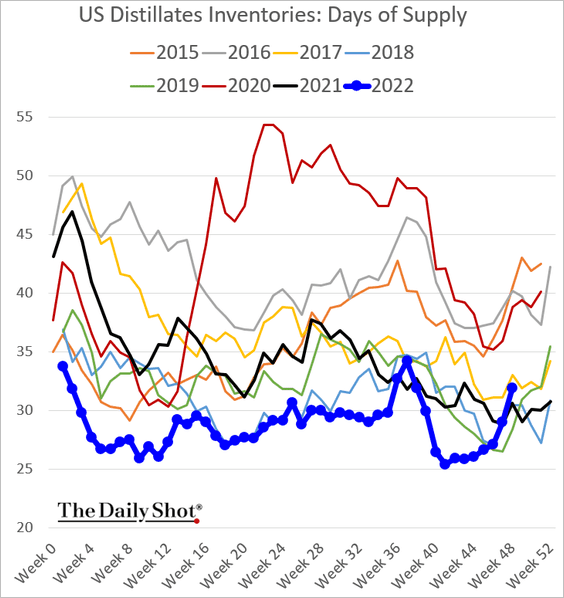
• But US refined product inventories jumped, offsetting the decline in crude stocks.
– Gasoline days of supply and barrels:
– Distillates:
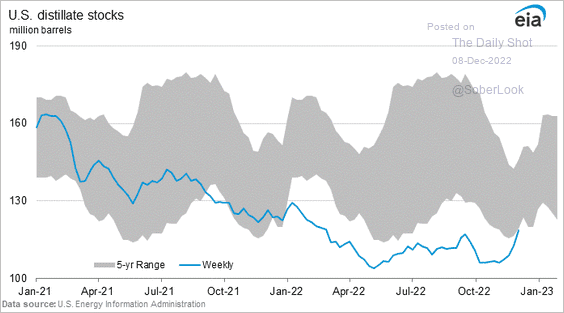
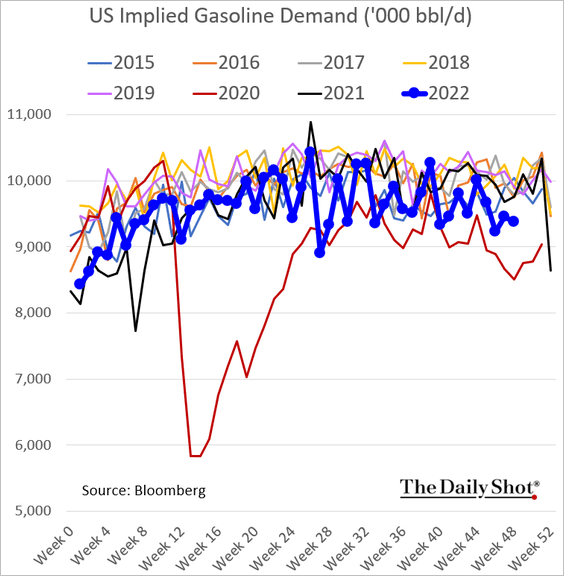
– Gasoline demand remains soft, which could be signaling an economic slowdown.
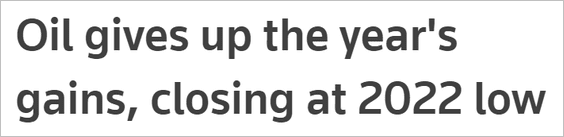
• Refined product prices declined sharply, …
– Gasoline:
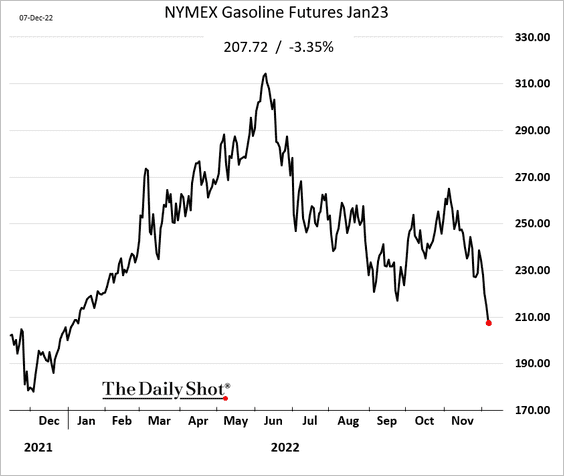
– Diesel:
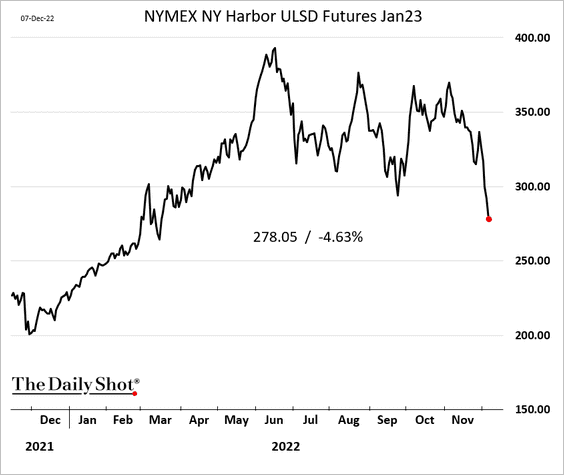
… dragging oil prices lower. Brent is now nearly flat vs. 12 months ago.
 Source: Reuters Read full article
——————–
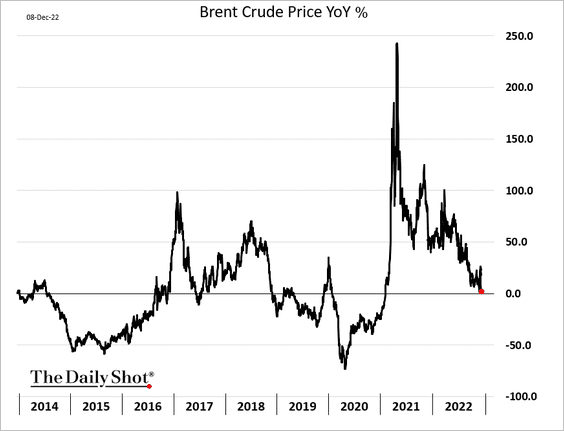
2. Lower crack spreads have also been contributing to falling gasoline prices.
 Source: PGM Global
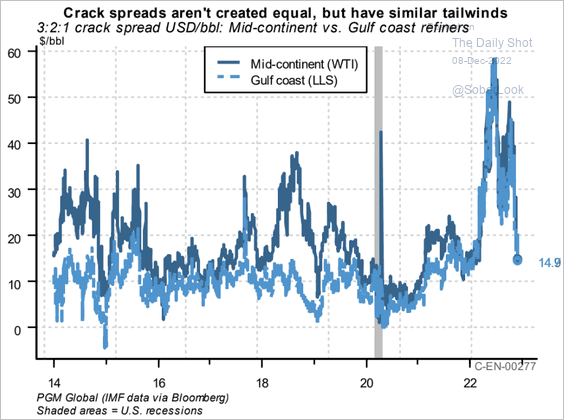
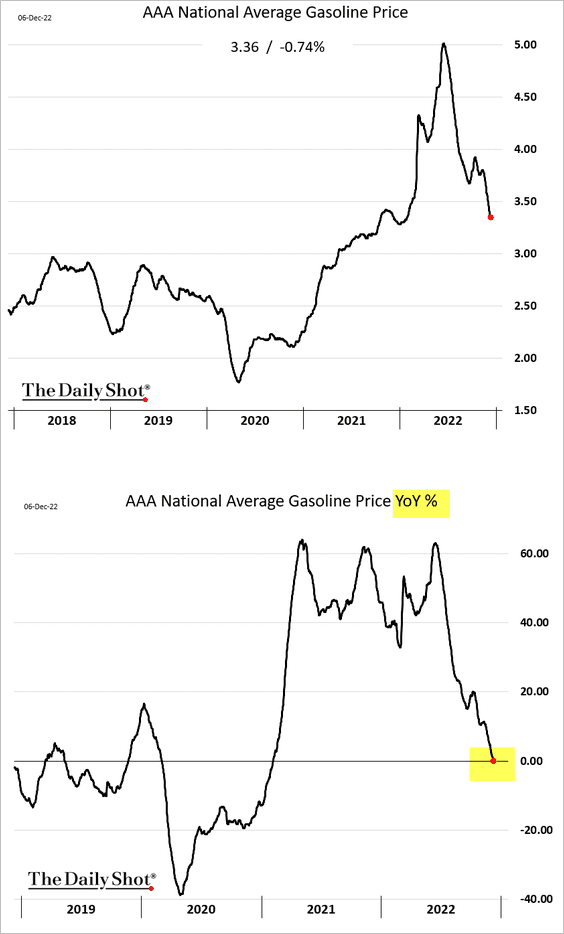
US retail gasoline prices are flat on a year-over-year basis.
——————–
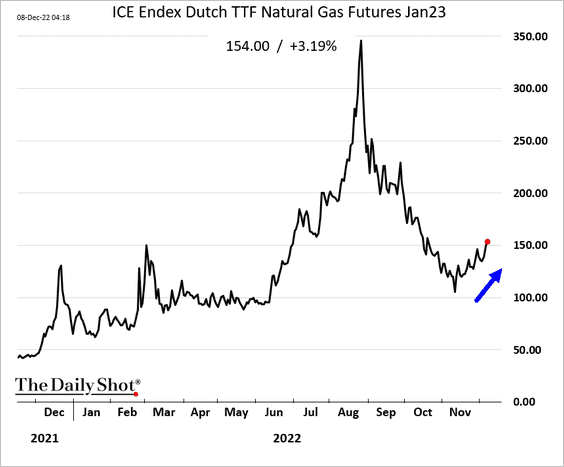
3. European natural gas prices continue to rebound.
4. US-Europe tanker rates have been surging.
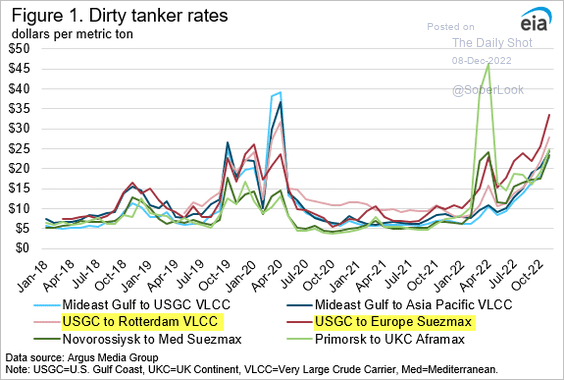 Source: @EIAgov
5. WTI and Brent futures’ open interest has been trending lower.
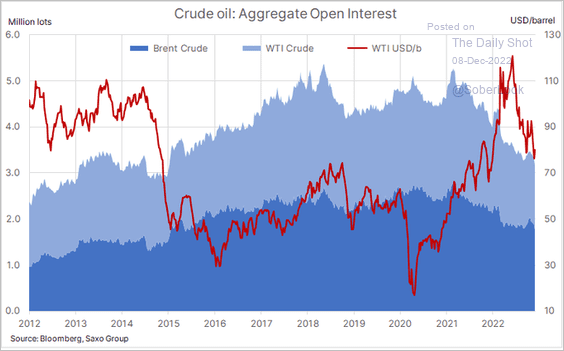 Source: @Ole_S_Hansen, h/t @dailychartbook
Back to Index
Equities
1. Are stocks and bonds decoupling as recession fears rise?
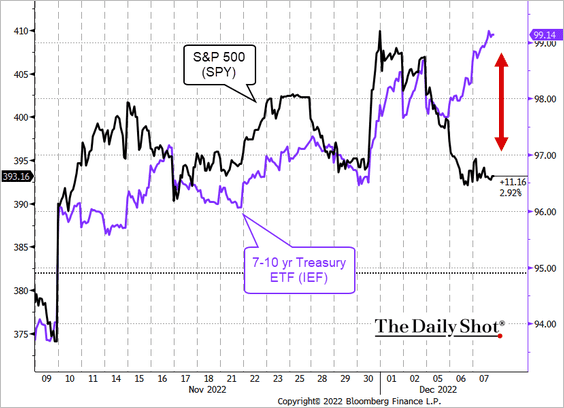 Source: @TheTerminal, Bloomberg Finance L.P.
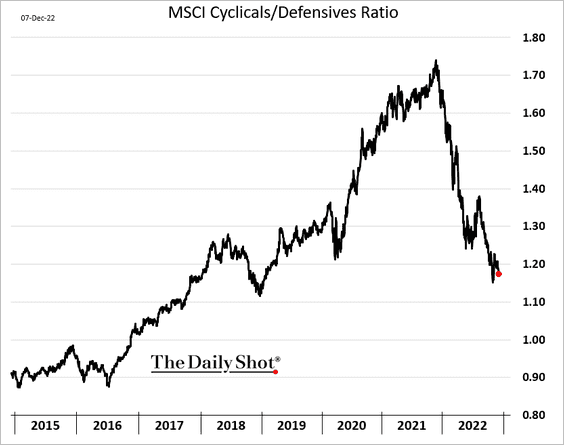
2. The cyclicals/defensives ratio is increasingly pricing a recession.
3. This chart shows Goldman’s soft- and hard-landing scenarios.
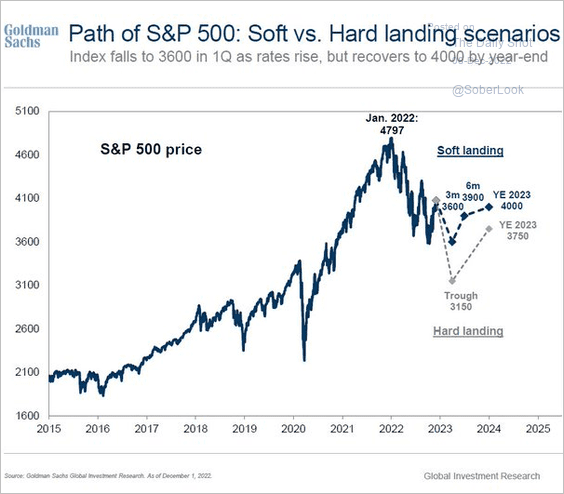 Source: Goldman Sachs; @LanceRoberts
4. Equity risk premium is too low, according to Nordea’s macro model.
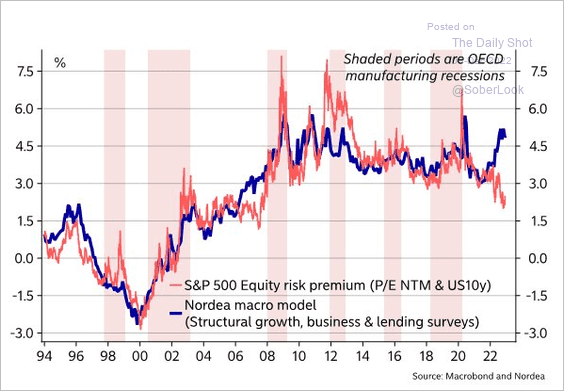 Source: @MikaelSarwe
5. The S&P 500 has been correlated with the euro.
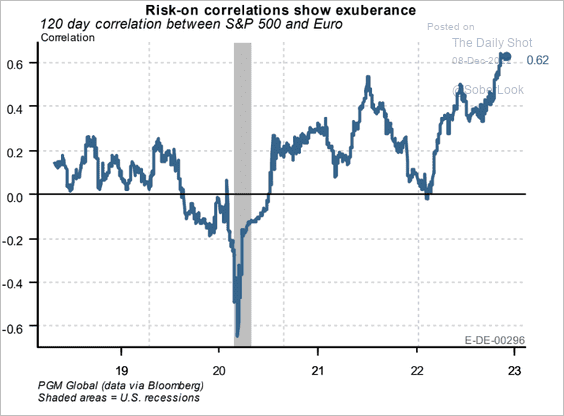 Source: PGM Global
6. Retail flows continue to slow.
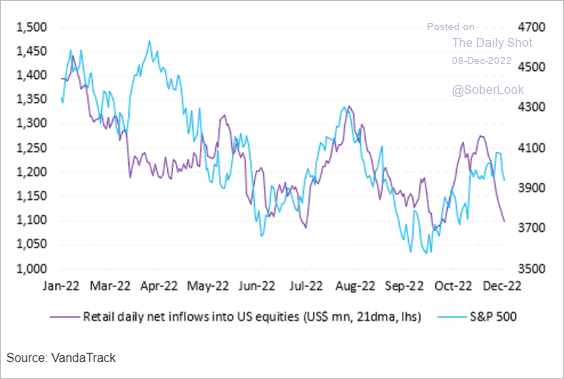 Source: Vanda Research
• This chart shows retail flows into mega-cap shares.
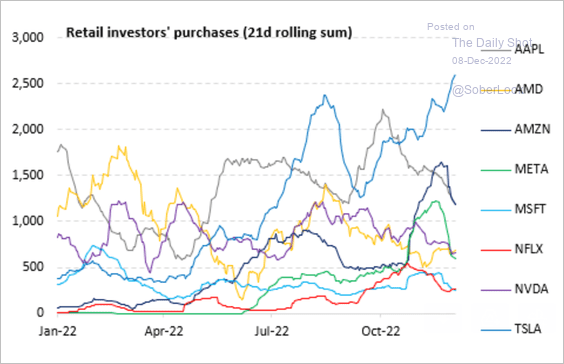 Source: Vanda Research
• Retail investors are no longer chasing the market higher with call option purchases.
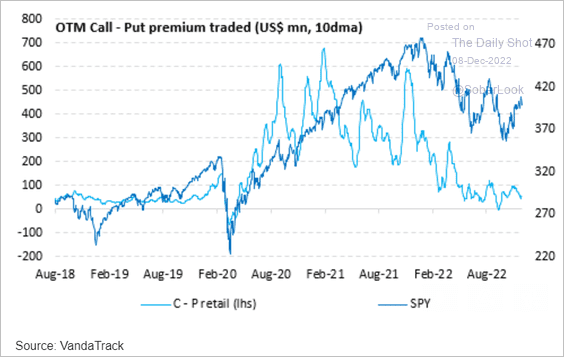 Source: Vanda Research
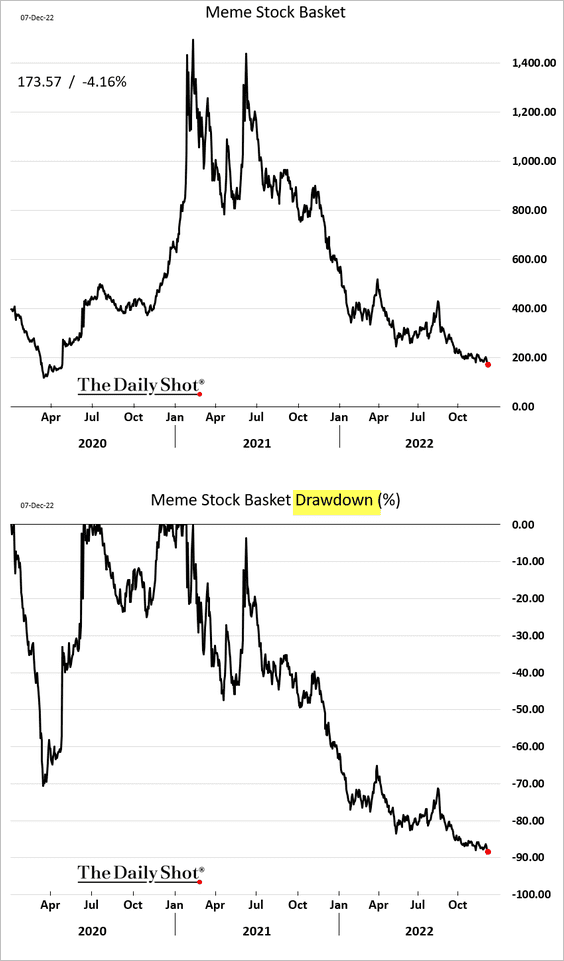
• The drawdown in meme stocks is approaching 90%.
——————–
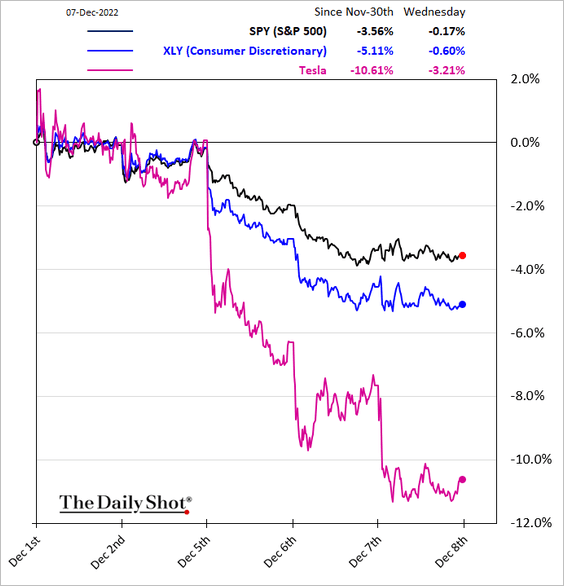
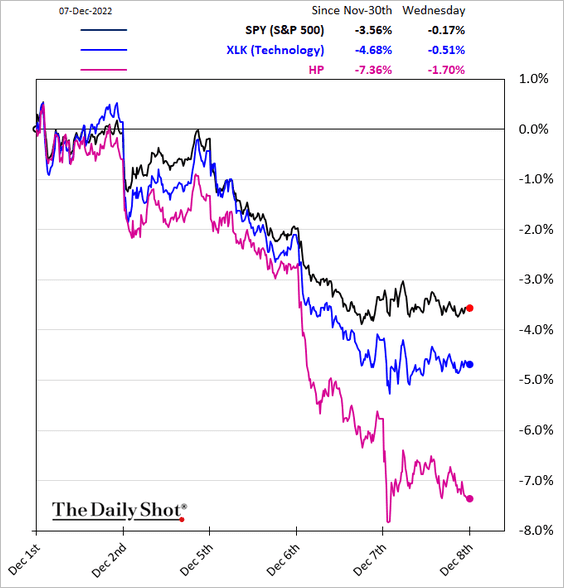
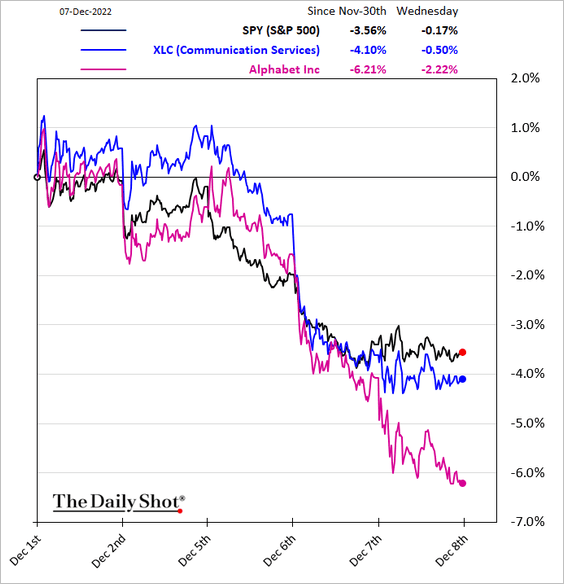
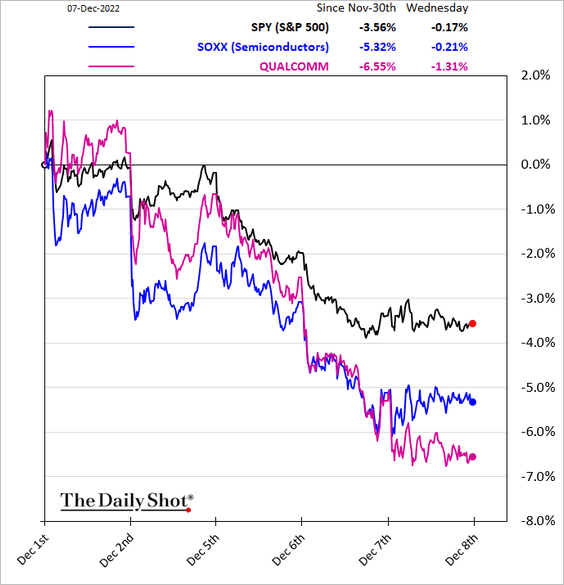
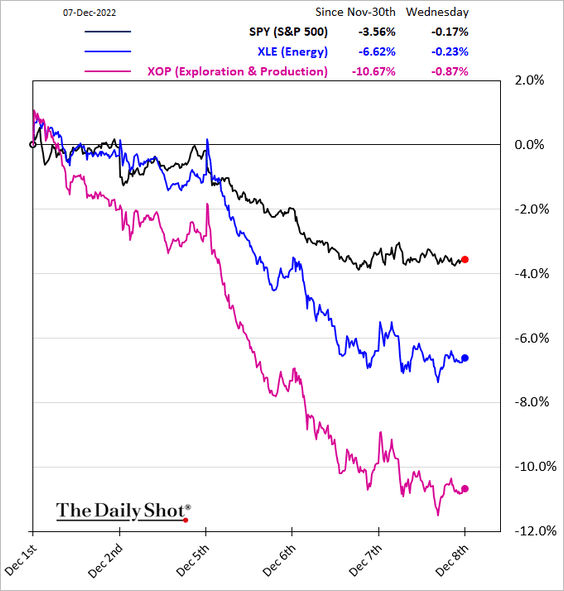
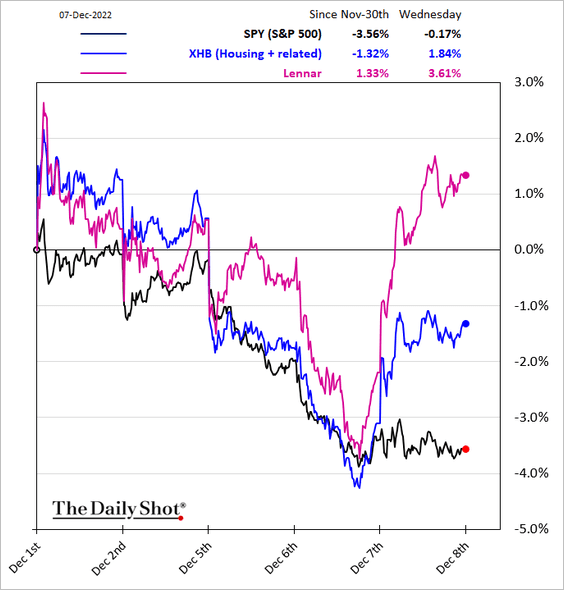
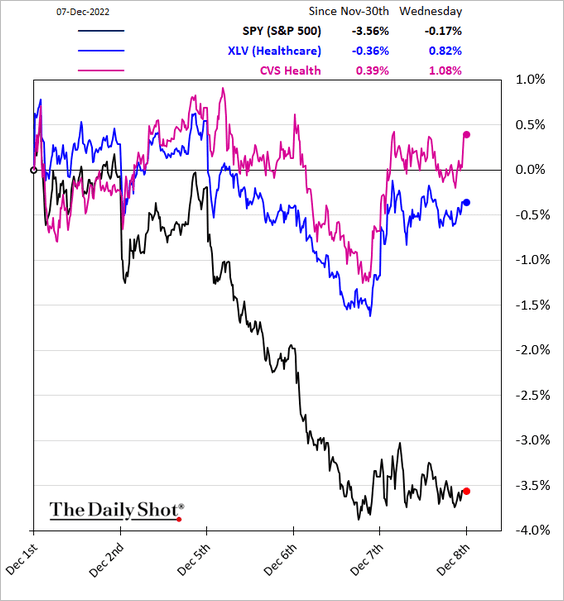
7. Next, we have some sector performance trends over the past five business days.
• Consumer Discretionary:
• Tech:
• Communication Services:
• Semiconductos:
• Industrials:
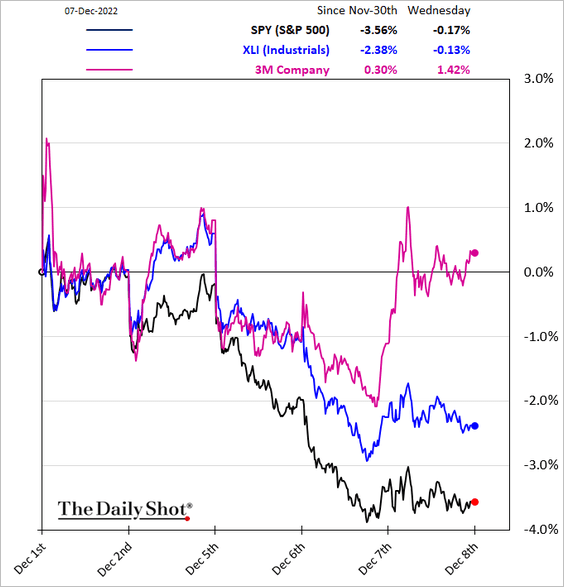
• Transportation:
![]()
• Energy:
• Housing:
• Healthcare:
——————–
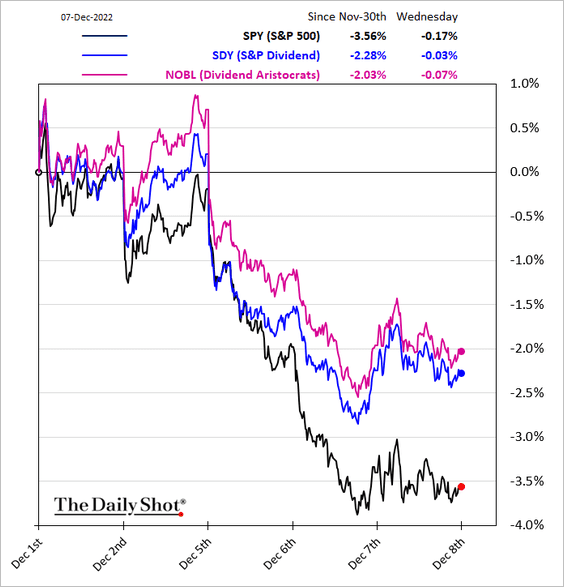
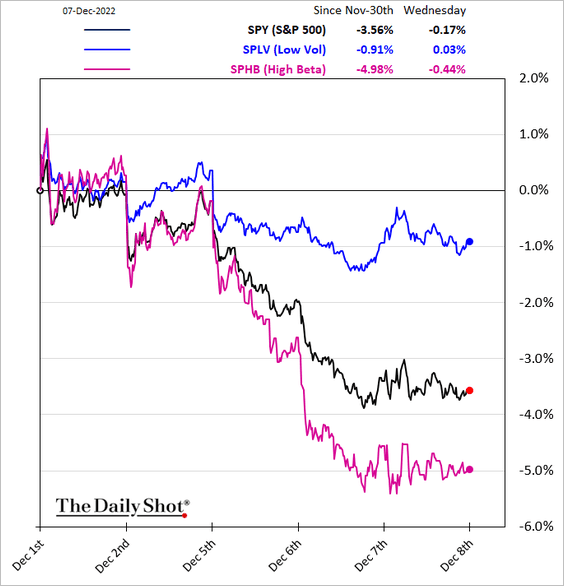
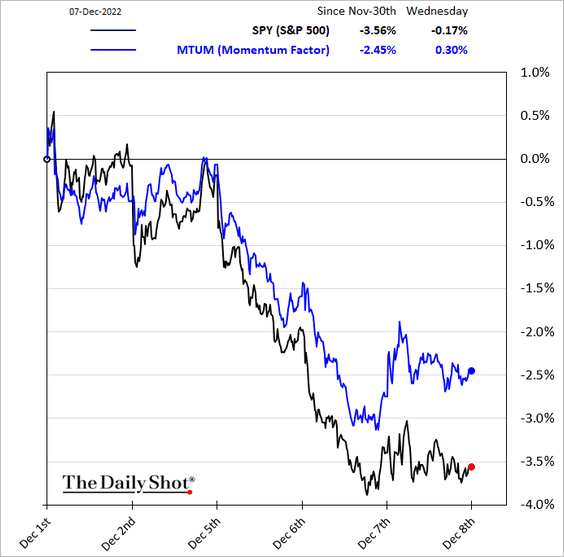
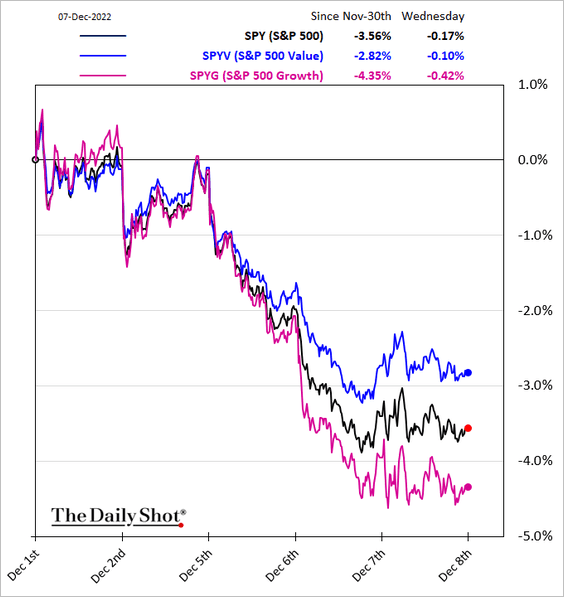
8. Finally, here are some equity factor trends.
• High-dividend and dividend growers:
• Low-vol and high-beta:
• Momentum:
• Growth vs. value:
Back to Index
Alternatives
1. This chart shows VC tech funds’ growth.
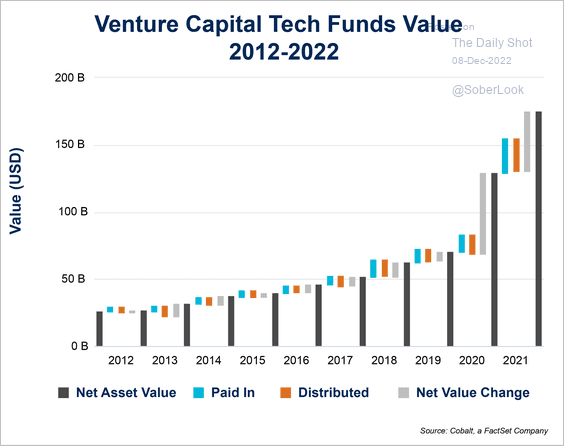 Source: @FactSet Read full article
2. Blackstone shares have underperformed massively in recent weeks. Is it just about BREIT (REIT) and BCRED (BDC) funds being gated as redemptions pick up? Or is the market increasingly concerned about alternative assets’ performance as recession approaches?

Back to Index
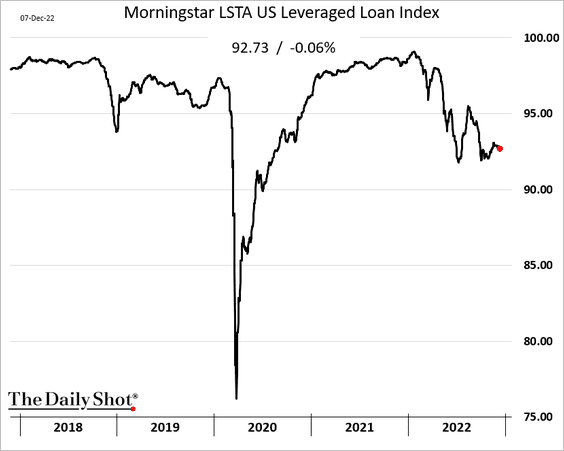
Credit
Today, let’s take a look at the leveraged loan market.
• Canary in the coal mine?
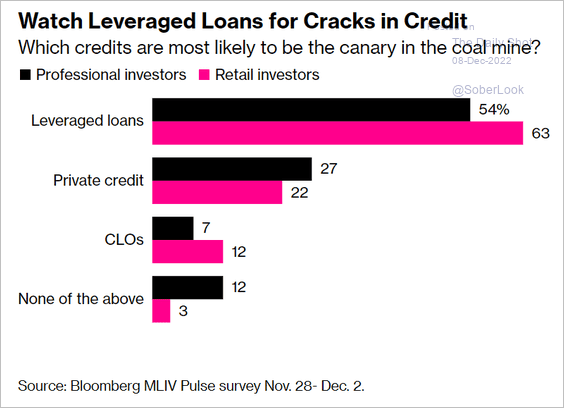 Source: @Sebaboyd, @markets Read full article
• Defaults remain low.
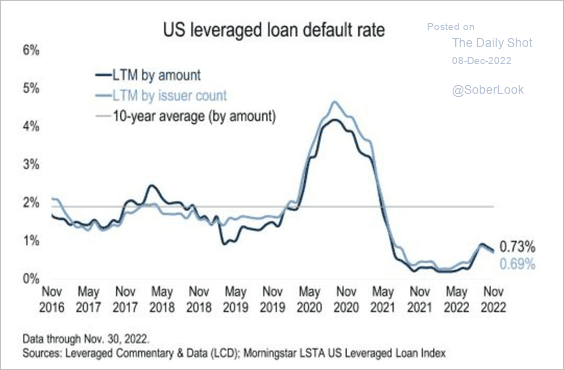 Source: @lcdnews, @Kakourisr, @PitchBook Read full article
• But distressed balances keep rising.
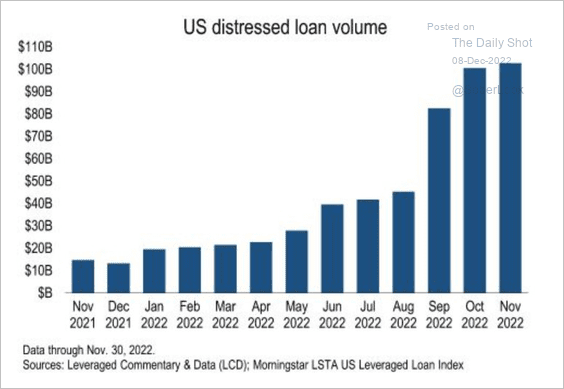 Source: @lcdnews, @Kakourisr, @PitchBook Read full article
• Prices are not rebounding.
• The gap between BB and B-rated loan prices has been widening.
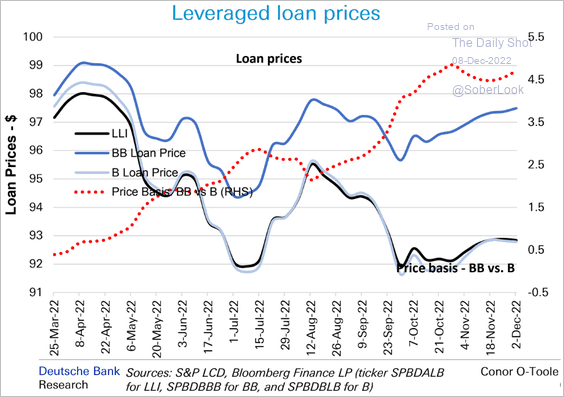 Source: Deutsche Bank Research
• Loan repayments continue to trend lower.
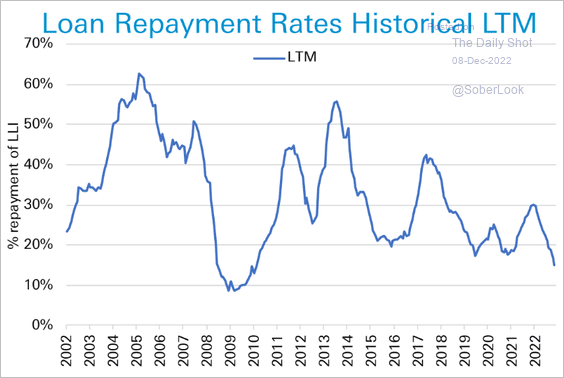 Source: Deutsche Bank Research
Back to Index
Rates
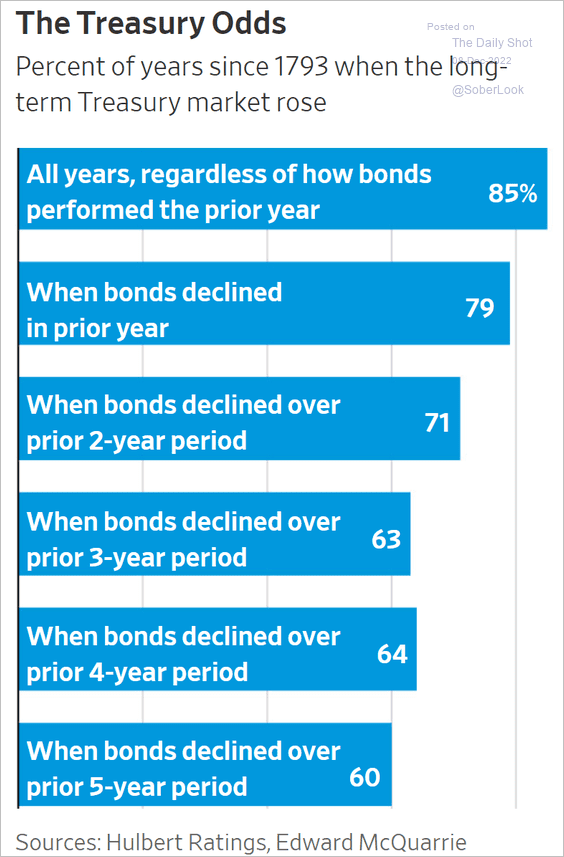
1. Long-dated Treasuries are having a good month.
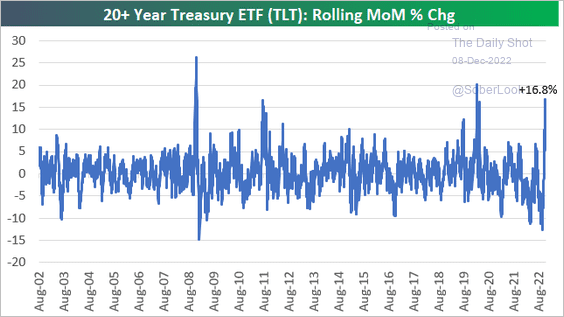 Source: @bespokeinvest
Here is some historical data on long-dated Treasuries.
 Source: @WSJ Read full article
——————–
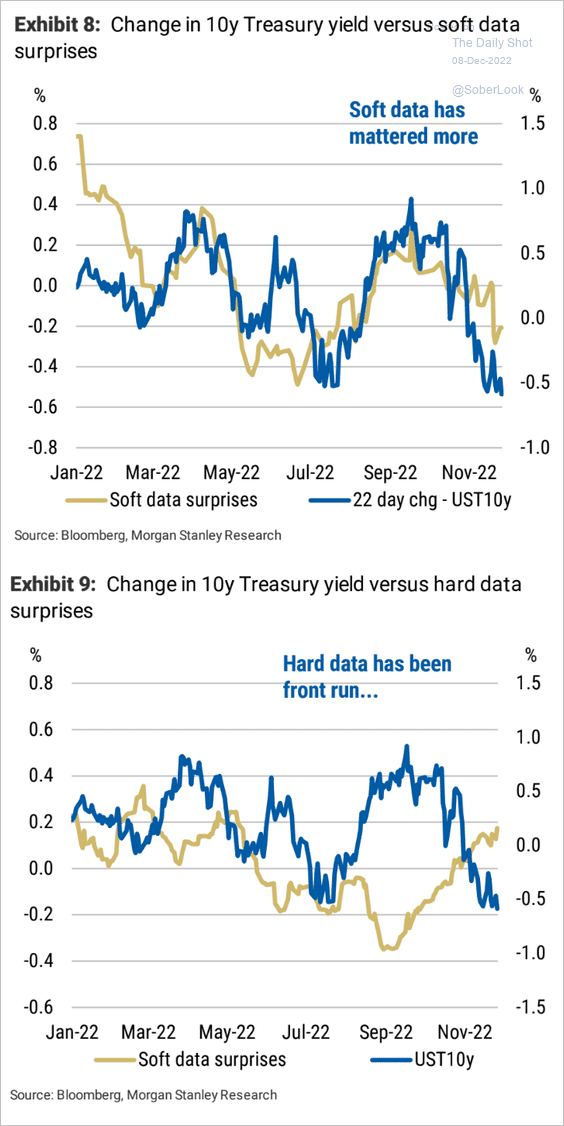
2. Soft (surveys) economic data surprises had a bigger impact on Treasuries than hard data.
 Source: Morgan Stanley Research
Back to Index
Global Developments
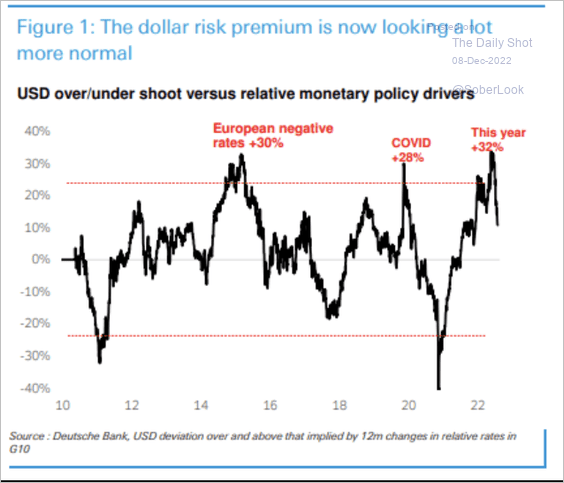
1. The dollar’s risk premium has sharply declined from peak levels.
 Source: Deutsche Bank Research
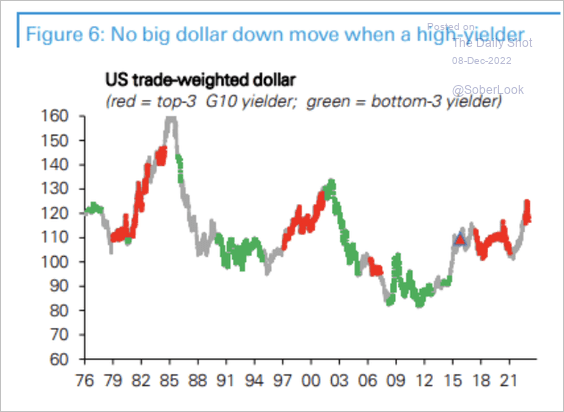
Positive yield differentials have supported the dollar’s rally.
 Source: Deutsche Bank Research
——————–
2. This chart shows the US dollar’s share of FX reserves.
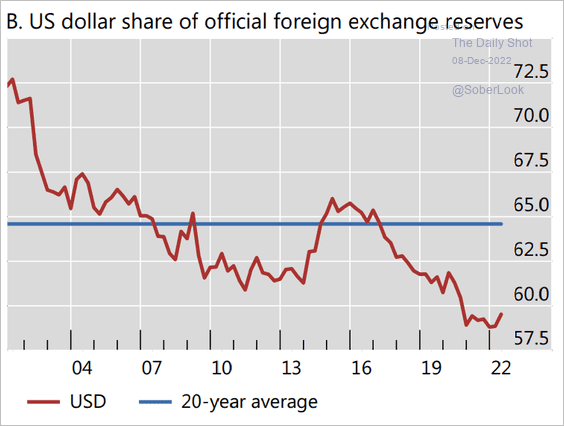 Source: BIS Read full article
How is the US dollar used globally?
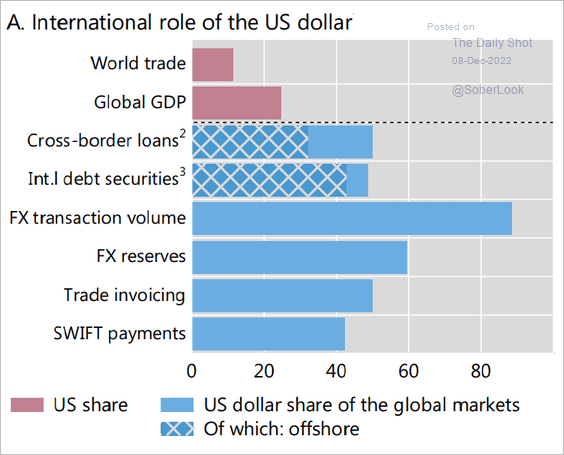 Source: BIS Read full article
——————–
3. Foreign exchange trading volumes continue to climb.
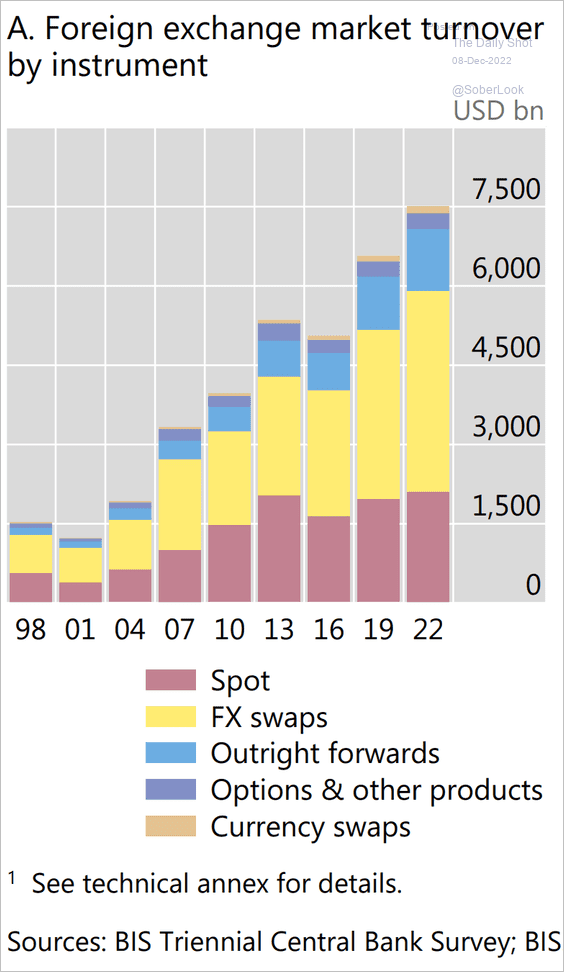 Source: BIS Read full article
4. Here is a list of funds that have lost the most value over the past decade, according to Morningstar.
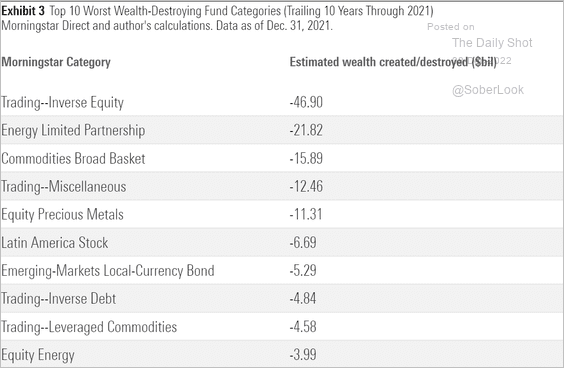 Source: Morningstar Read full article
——————–
Food for Thought
1. Population, GDP per capita, energy intensity, and CO2 emissions:
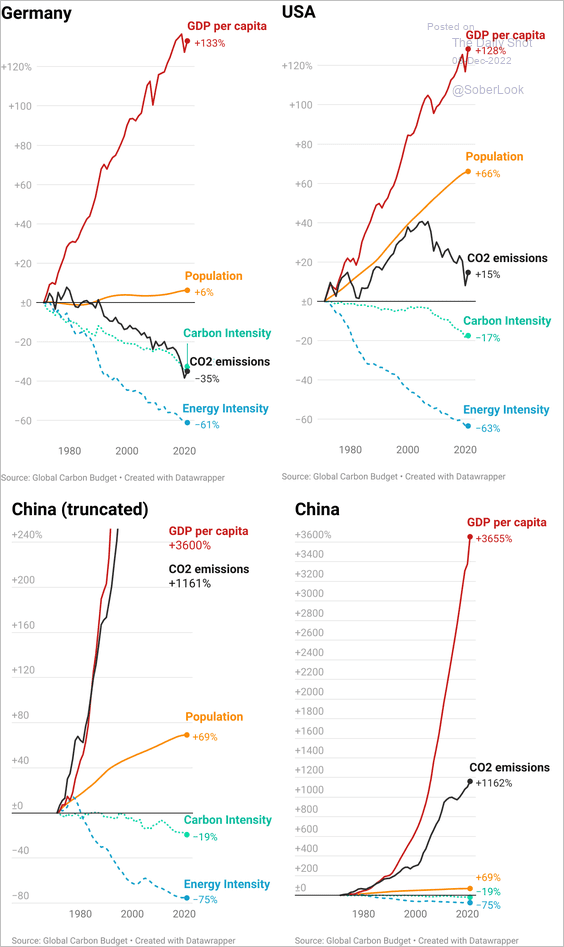 Source: Datawrapper
2. K-12 school shootings:
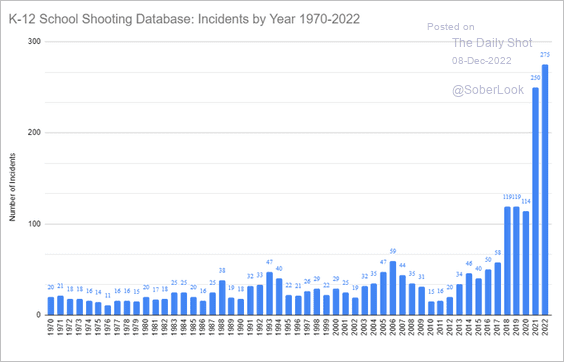 Source: @K12ssdb
3. Political tensions around the world:
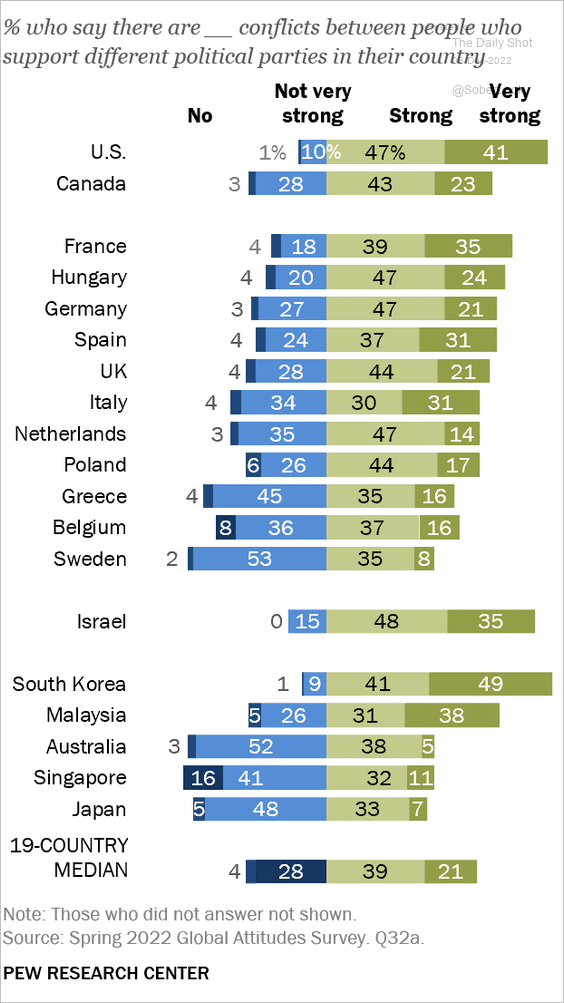 Source: Pew Research Center Read full article
4. Elon Musk’s tweets:
 Source: @axios Read full article
5. Homeownership among Americans aged 25-34:
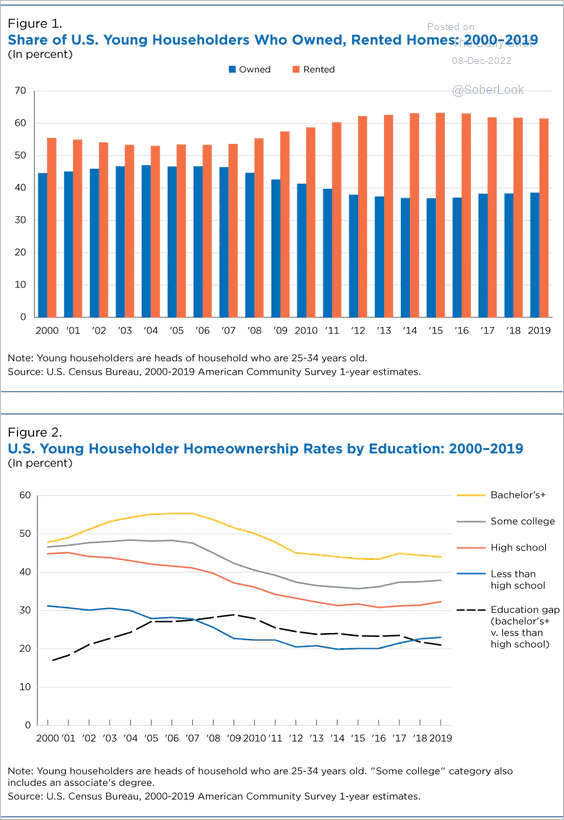 Source: US Census Bureau Read full article
6. Most commonly used symbols in flags:
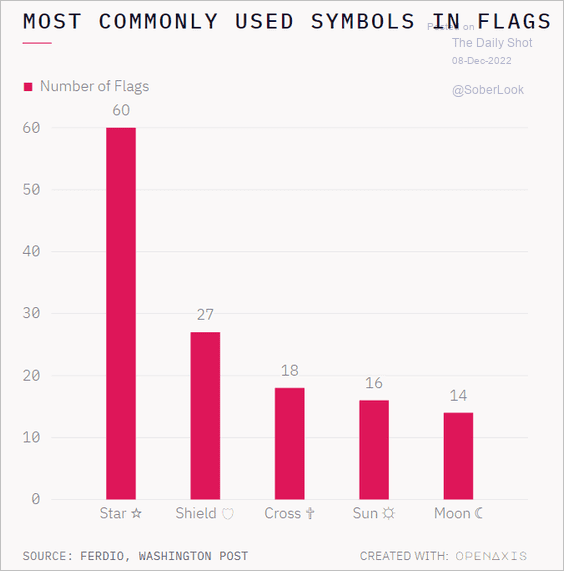 Source: @OpenAxisHQ
——————–
Back to Index