
The Daily Shot: 10-Jan-23
• The United States
• Canada
• The United Kingdom
• The Eurozone
• Japan
• China
• Emerging Markets
• Cryptocurrency
• Equities
• Credit
• Rates
• Global Developments
• Food for Thought
The United States
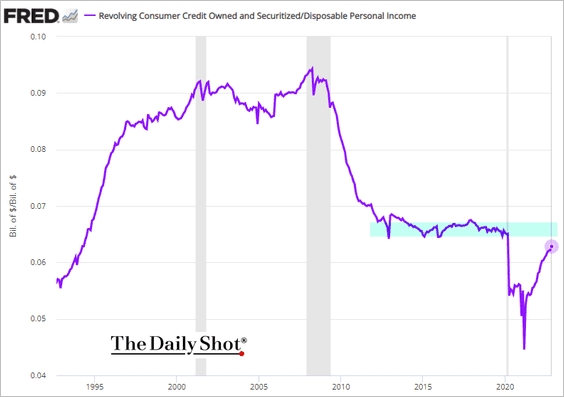
1. Consumer credit increased more than expected in November.
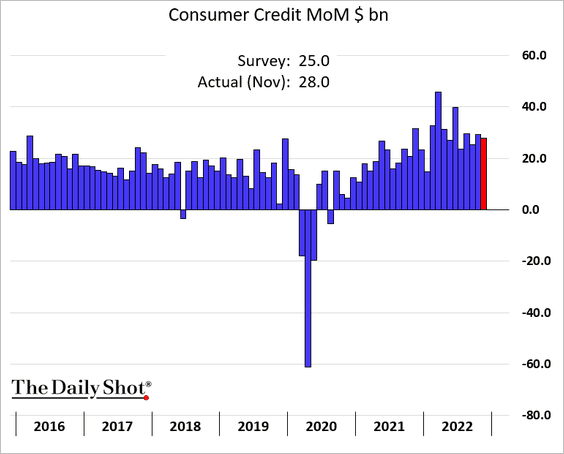
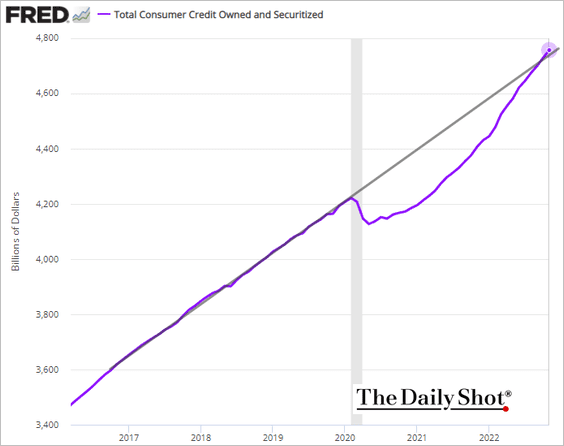
Total consumer credit is now above the pre-COVID trend.
• This graph shows consumer credit by income category.
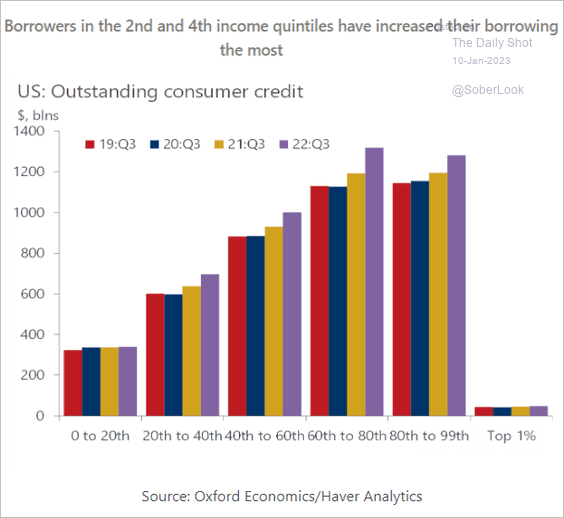 Source: Oxford Economics
• Credit card balances continue to surge.
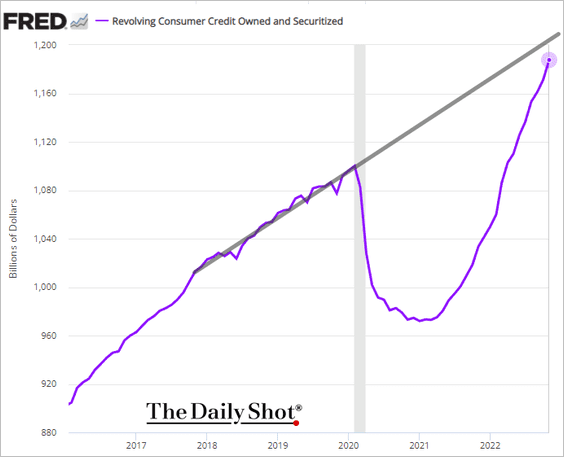
– Some Americans are increasingly tapping their credit cards to meet spending needs, …
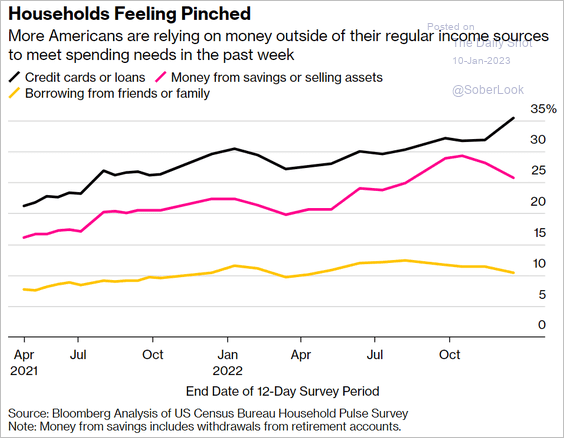 Source: @mackhawk, @wealth Read full article
… as excess savings are depleted.
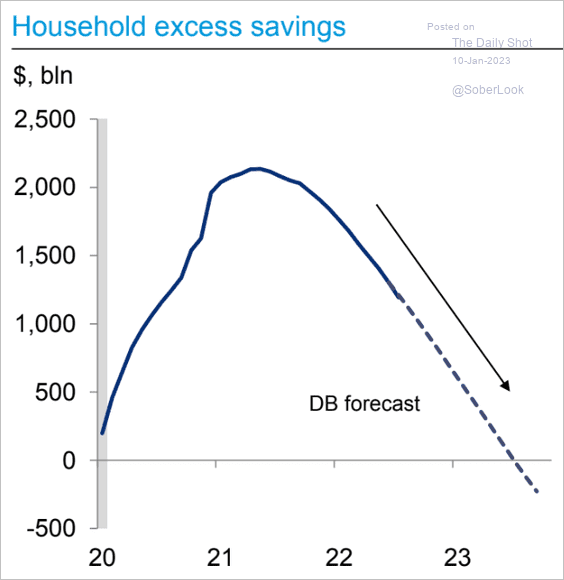 Source: Deutsche Bank Research
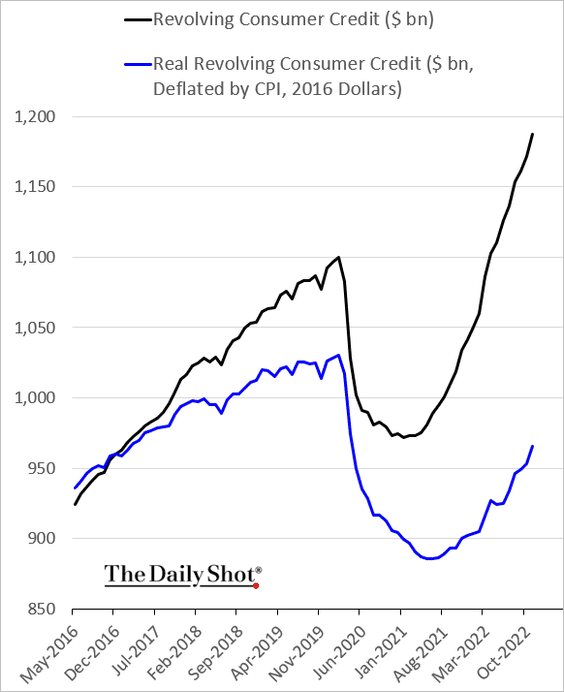
– The borrowed dollars aren’t stretching very far these days.
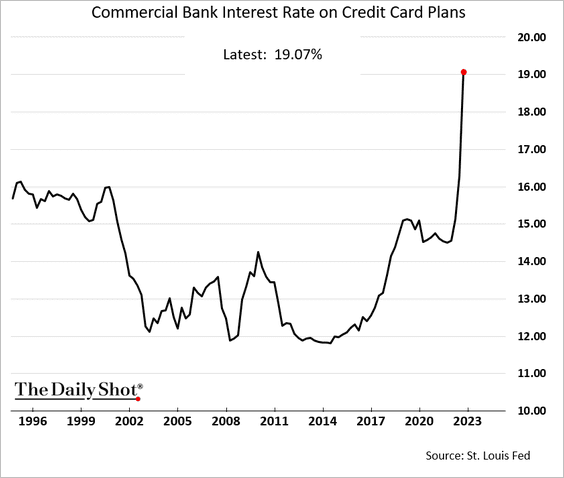
– And the cost to borrow on a credit card has not been this high in decades.
– Credit card balances as a share of disposable income remain below pre-COVID levels.
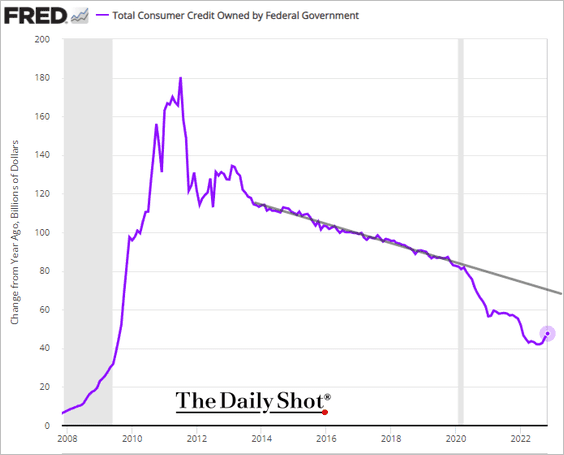
• Growth in student debt has bottomed (chart shows year-over-year changes in dollar terms).
——————–
2. Next, we have some updates on the labor market.
• Here is the jobs recovery by income tier.
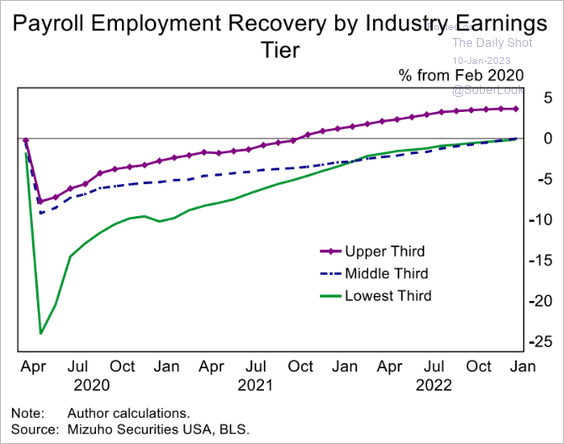 Source: Mizuho Securities USA
• Job gains have been the highest in sectors that saw the biggest COVID-shock losses.
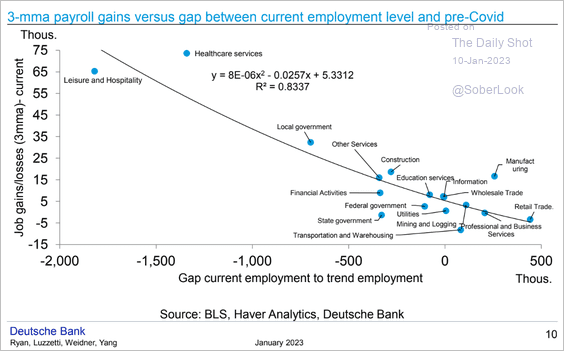 Source: Deutsche Bank Research
• Among service firms, only consumer services are hiring aggressively.
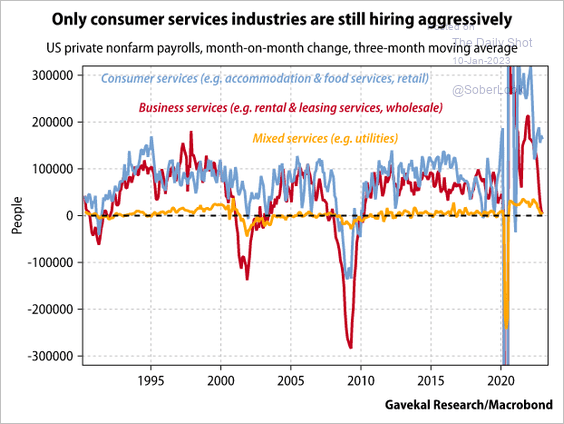 Source: Gavekal Research
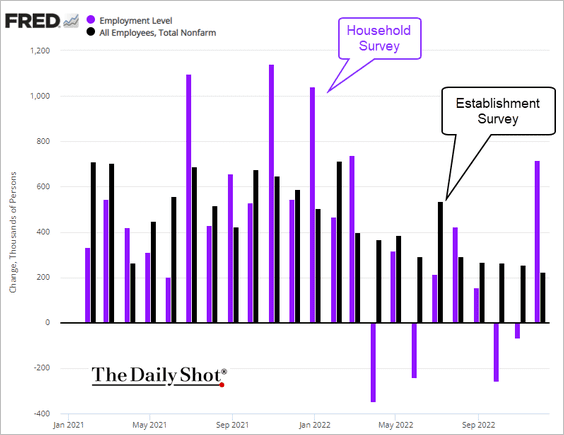
• The household survey showed a massive gain in employment last month.
• COVID is still a drag on the labor force.
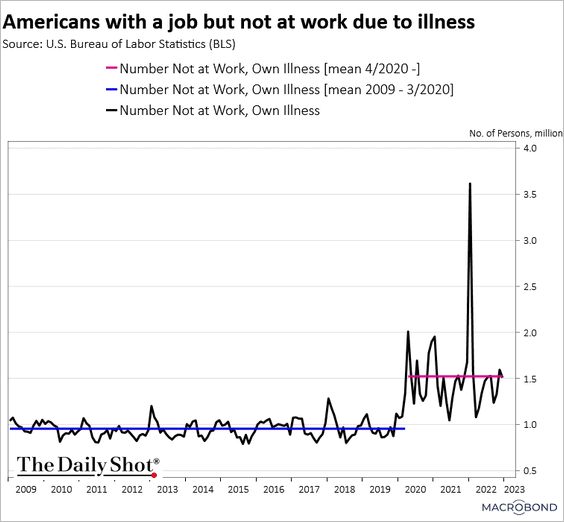 Source: Chart and data provided by Macrobond
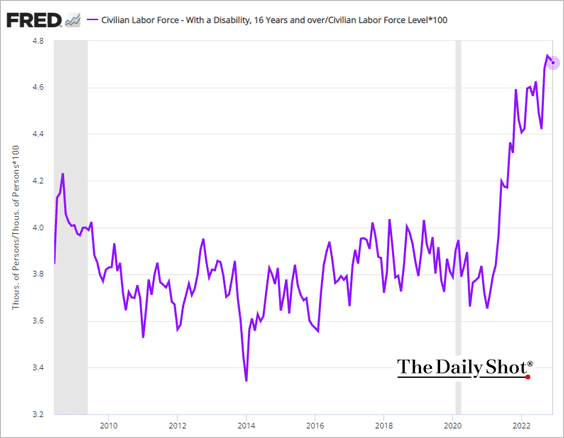
• The share of Americans in the labor force who report a disability remains elevated.
• Retiree numbers remain elevated relative to the pre-COVID trend.
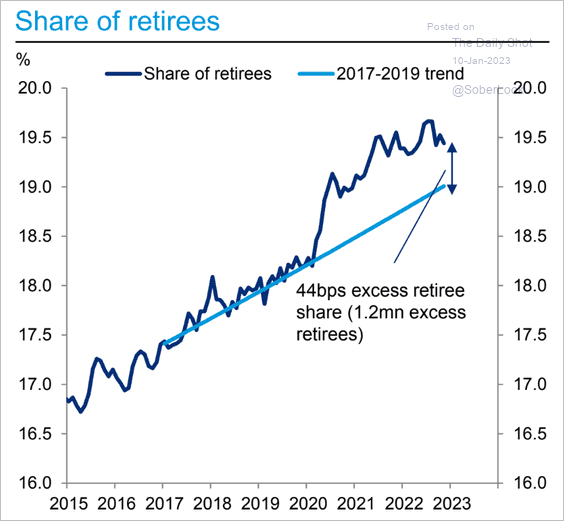 Source: Deutsche Bank Research
• Job loss expectations have been edging higher but remain below pre-COVID levels, according to the NY Fed’s consumer survey.
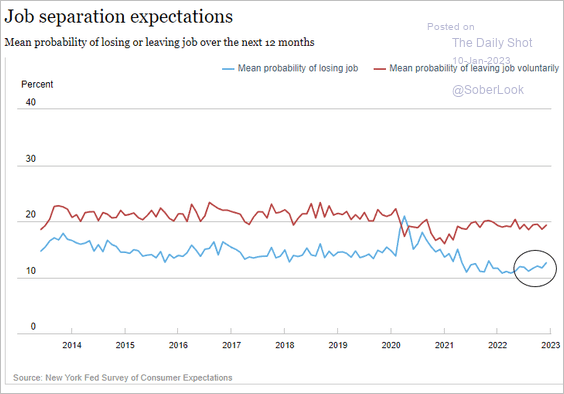 Source: Federal Reserve Bank of New York
• US foreign-born working-age population is still below the pre-pandemic trend.
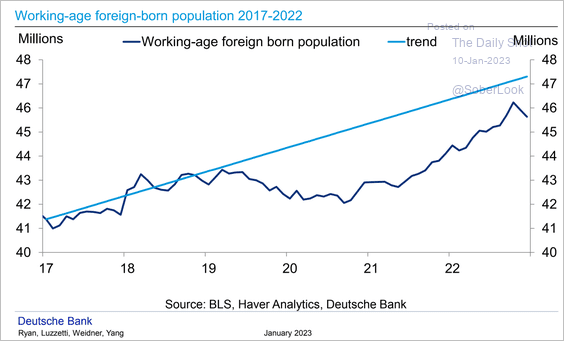 Source: Deutsche Bank Research
• This chart shows wage growth by sector.
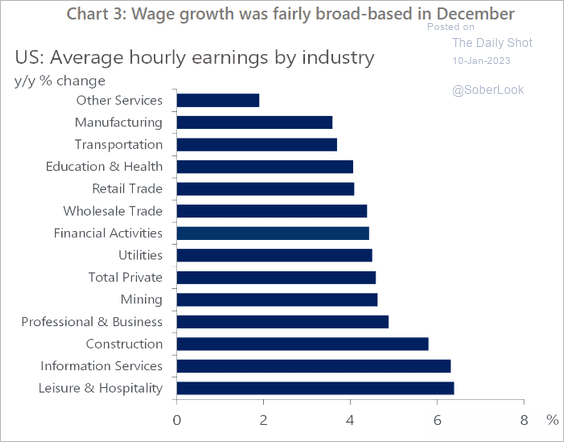 Source: Oxford Economics
• Finally, we have the Atlanta Fed’s famous labor market spider chart.
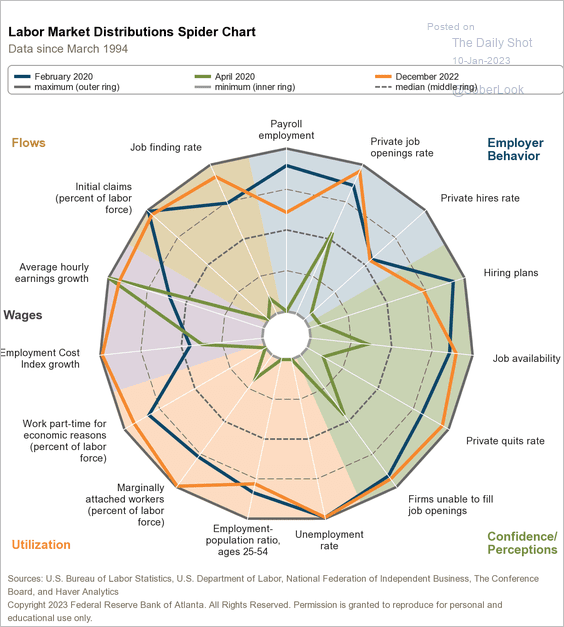 Source: @AtlantaFed
——————–
3. Last year’s massive global monetary tightening will remain a drag on US business activity throughout 2023.
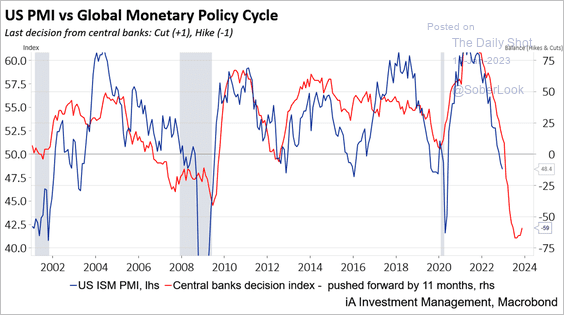 Source: Industrial Alliance Investment Management
Back to Index
Canada
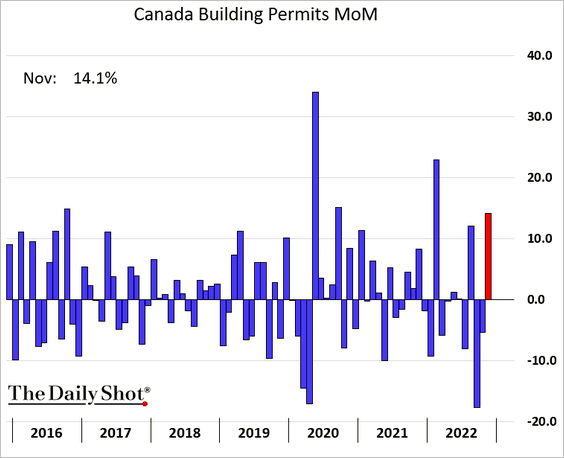
1. Building permits jumped in November.
2. Wages are now growing faster than inflation.
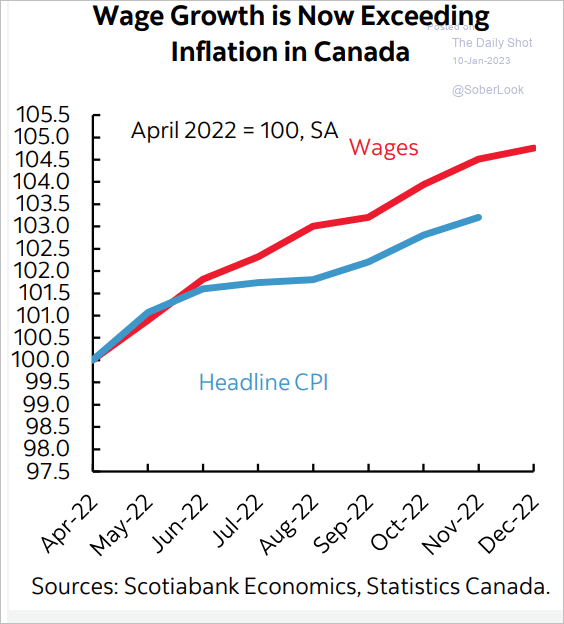 Source: Scotiabank Economics
3. Breadth in the TSX Venture Composite Index (microcaps) has improved over the past year despite weak price action.
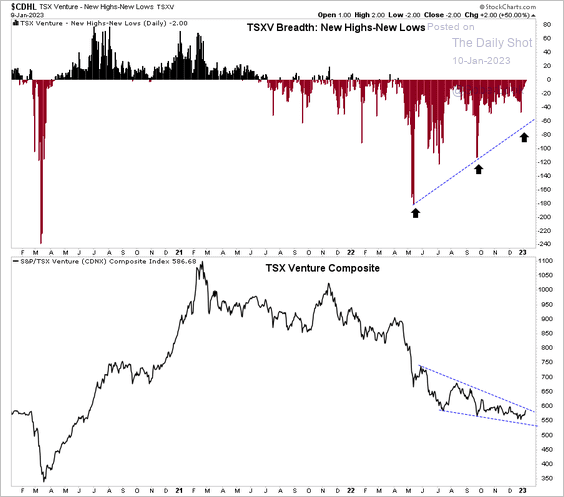 Source: Aazan Habib, Paradigm Capital
Back to Index
The United Kingdom
1. Nominal retail sales jumped in December.
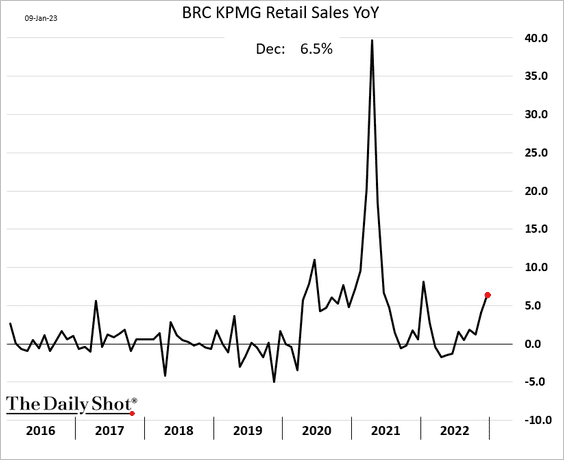
 Source: BBC Read full article
——————–
2. The percentage of young adults living with parents remains elevated.
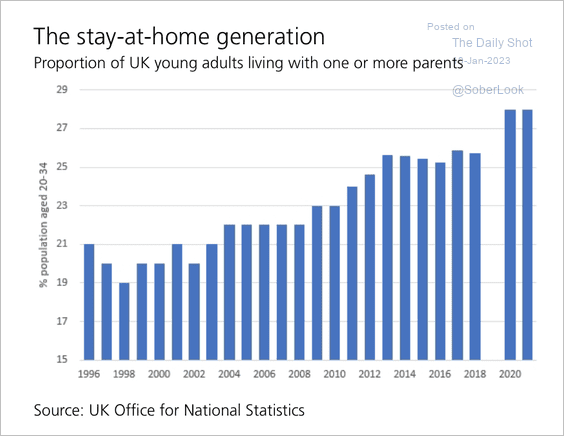 Source: UBS Research
Back to Index
The Eurozone
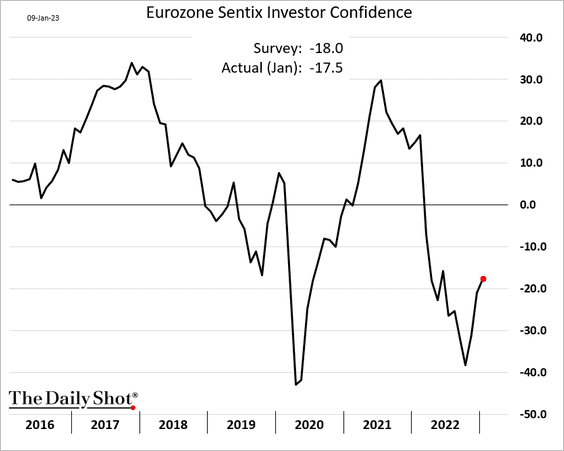
1. The Sentix Investor Confidence index improved again this month as energy-related concerns ease.
2. The rate of unemployment remained at its historically low levels during November.
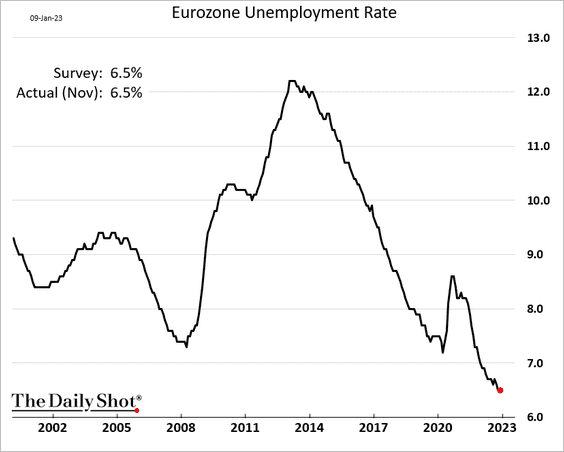
 Source: RTT News Read full article
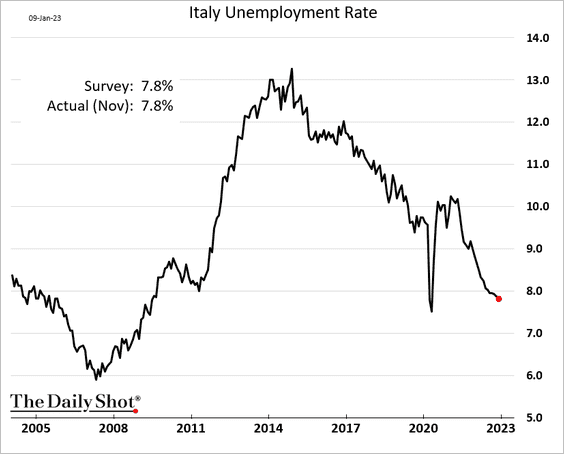
Here is Italy’s unemployment rate.
——————–
3. The Citi Eurozone Economic Surprise index has diverged from the US equivalent as European PMI indicators show signs of stabilization.
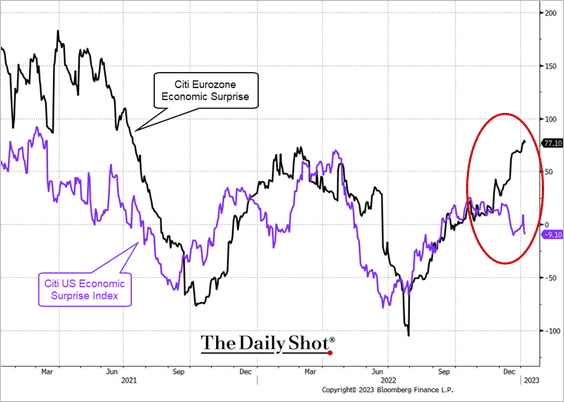 Source: @TheTerminal, Bloomberg Finance L.P.
4. The end of an era …
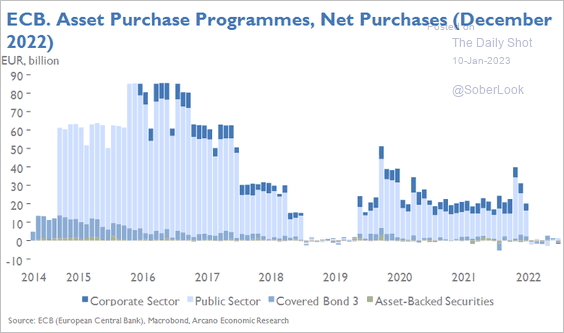 Source: Arcano Economics
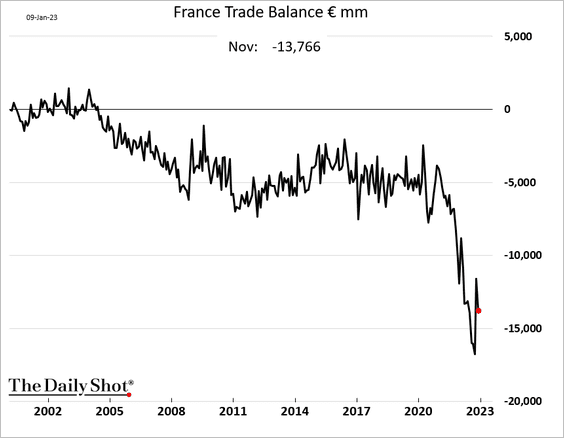
5. The French trade gap widened again in November.
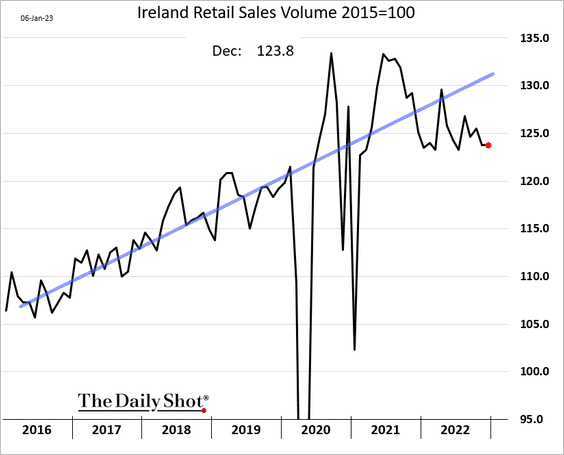
6. Irish retail sales have been slowing.
Back to Index
Japan
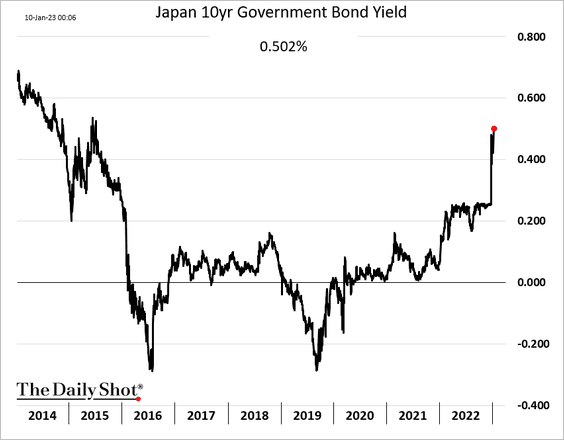
1. The 10yr JGB is once again testing the BoJ’s resolve, with some trades taking place above the 0.5% cap.
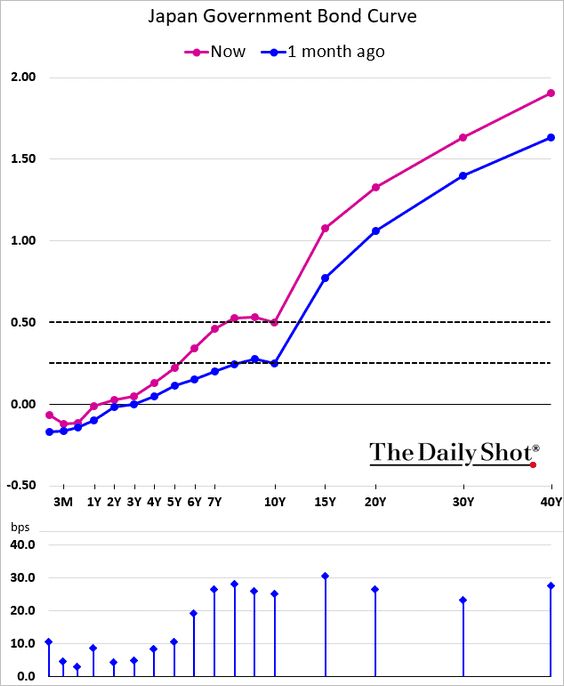
Here is the yield curve.
——————–
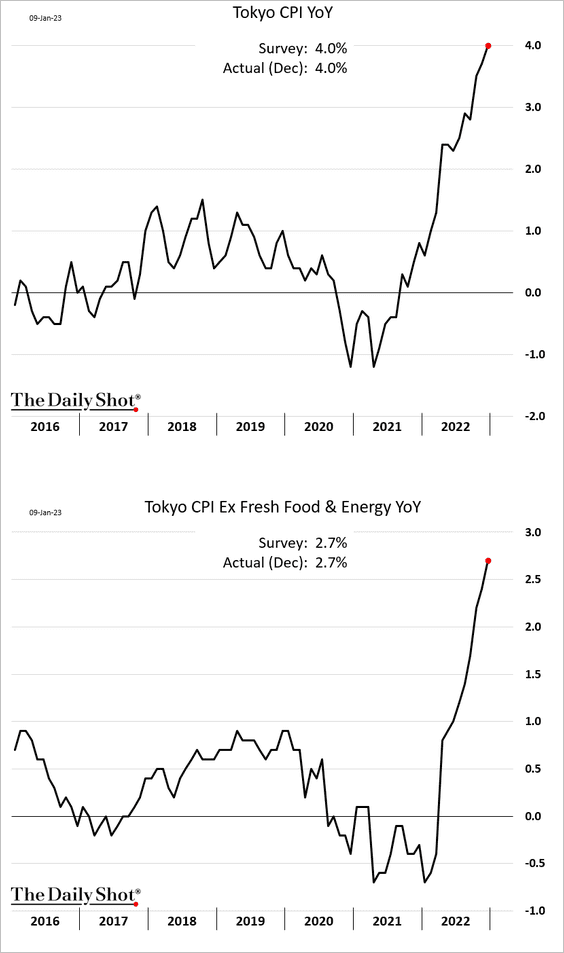
2. The Tokyo CPI climbed further last month.
3. Capital Economics flags downside risks for Japan’s exports.
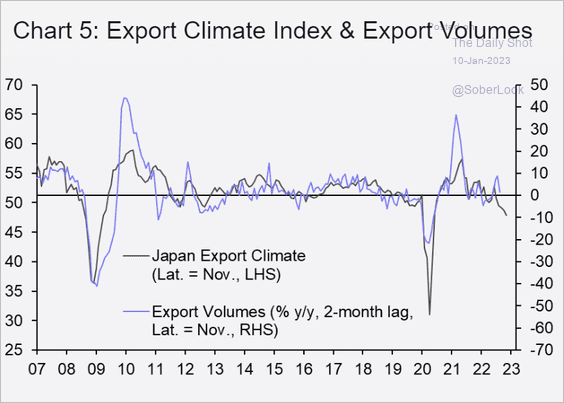 Source: Capital Economics
Back to Index
China
1. Hong Kong shares have been outpacing mainland stocks as the rally continues.
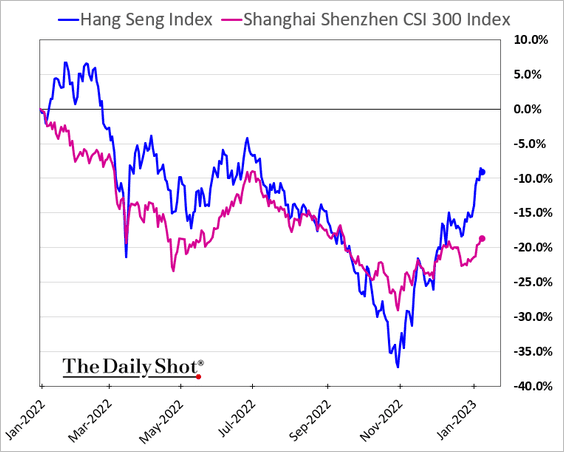
China’s stocks have been outperforming other EMs.
——————–
2. Morgan Stanley expects mobility to rebound rapidly this year.
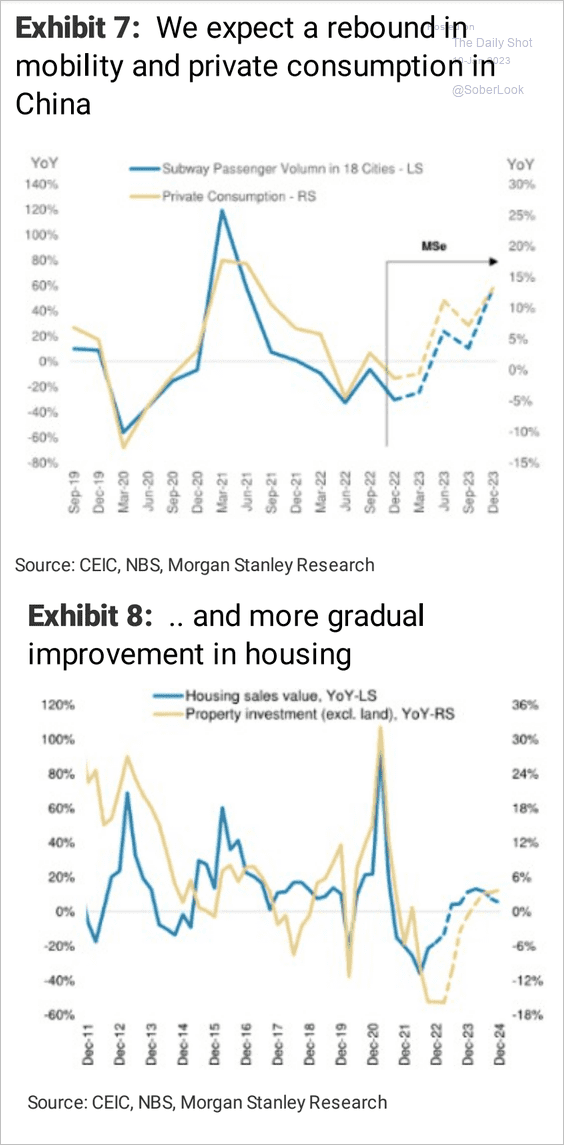 Source: Morgan Stanley Research
3. Import volumes have been contracting for 18 months.
 Source: BCA Research
4. China’s household savings rate has been outpacing the US.
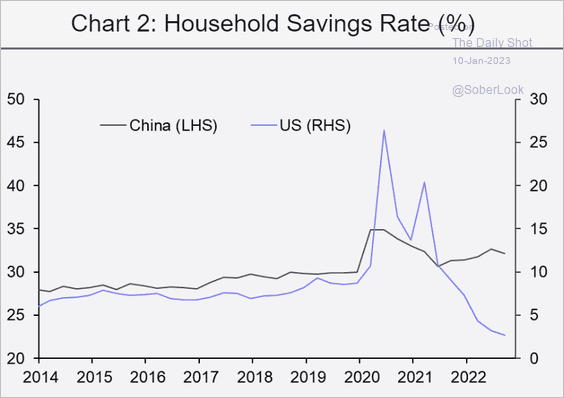 Source: Capital Economics
5. OECD nations’ investment in China has been shrinking.
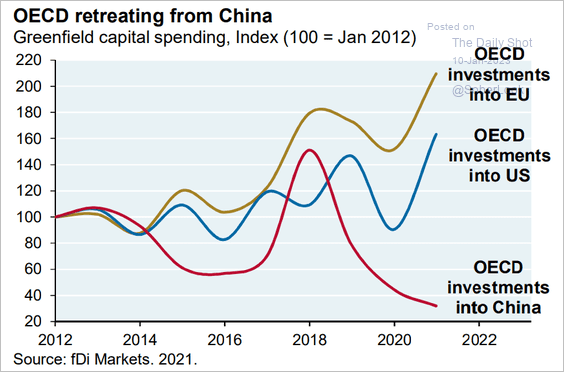 Source: J.P. Morgan Asset Management
Back to Index
Emerging Markets
1. Mexican inflation appears to have peaked.

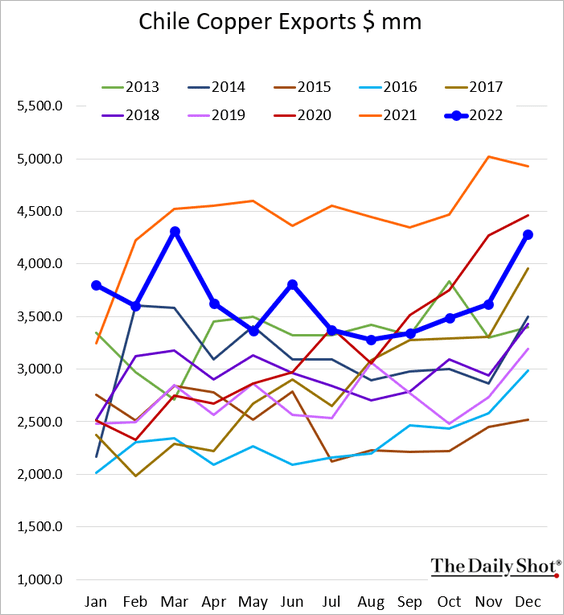
2. Here are Chile’s copper exports (in USD terms).
3. This chart shows the relationship between EM equity returns and exports to China.
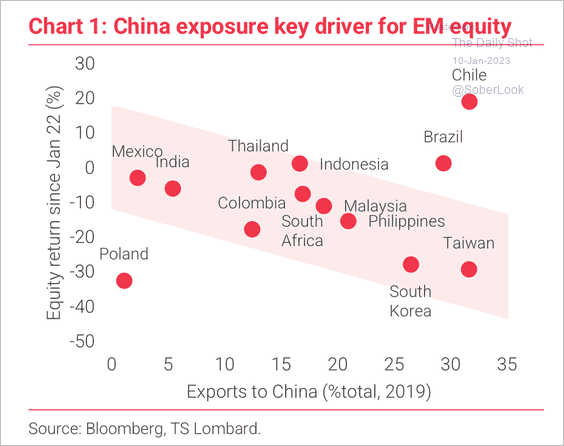 Source: TS Lombard
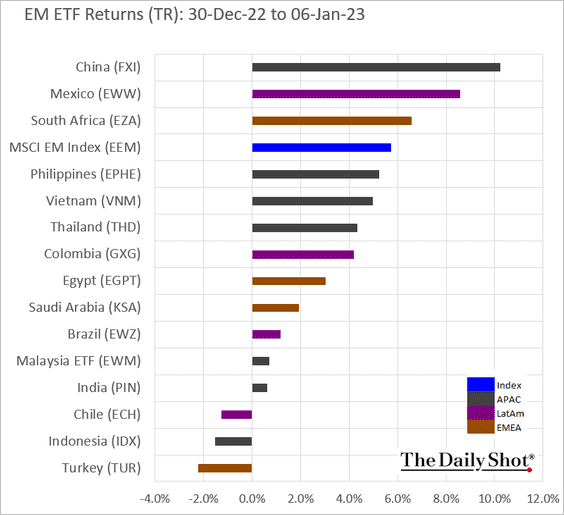
4. EM stocks are officially in a bull market.
 Source: Reuters Read full article
5. BCA Research flags downside risks for Indian shares.
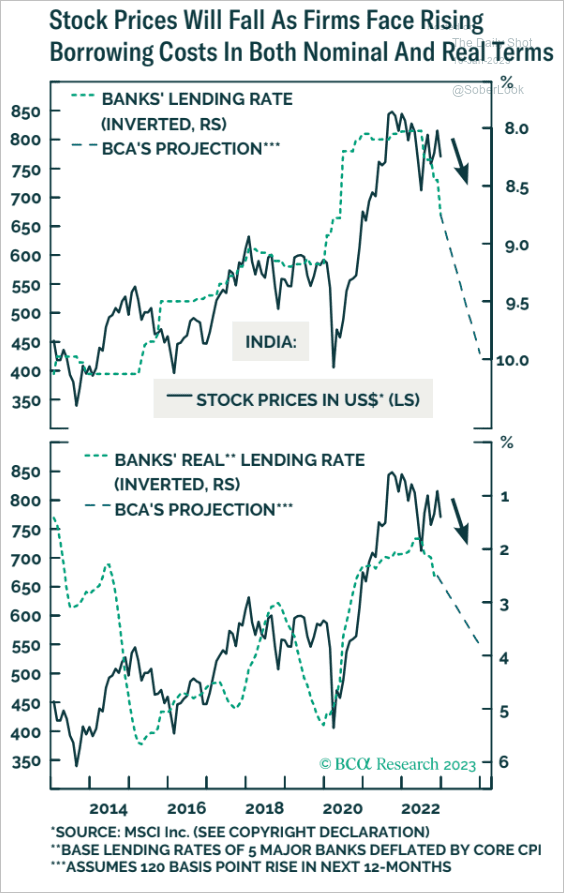 Source: BCA Research
6. Egypt’s inflation is squeezing consumers.
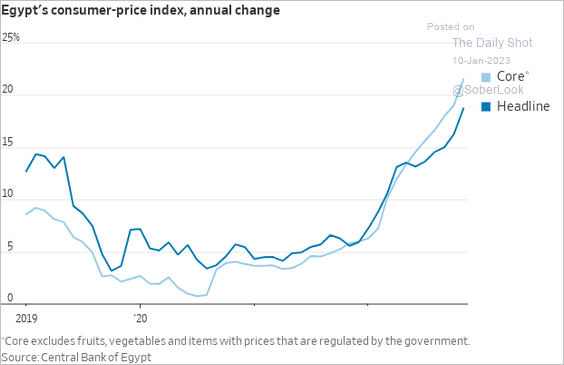 Source: @WSJ Read full article
Back to Index
Cryptocurrency
1. The BTC/ETH price ratio is holding support. A break above the 40-week moving average would imply risk-off conditions.
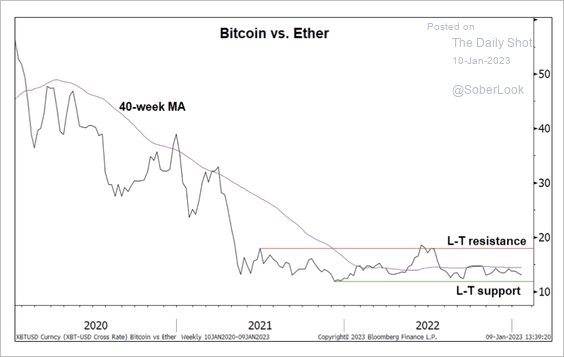 Source: @StocktonKatie
2. Crypto funds saw minor outflows last week, led by long-bitcoin and multi-asset products.
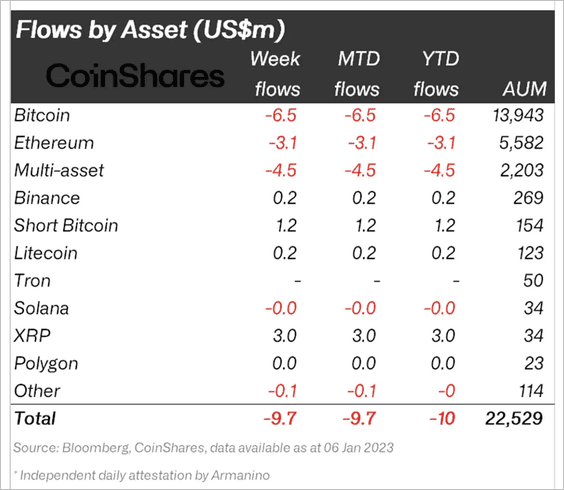 Source: CoinShares Read full article
Brazil and US-based crypto funds accounted for a majority of outflows last week.
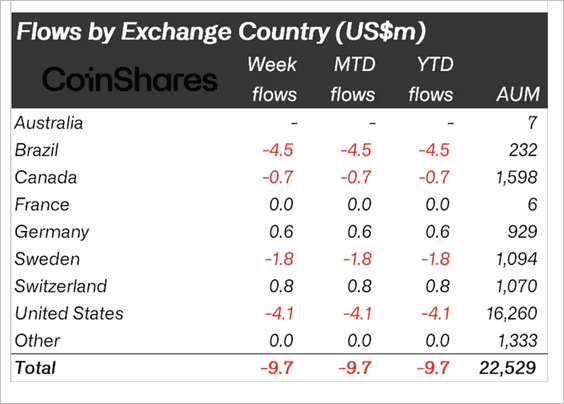 Source: CoinShares Read full article
——————–
3. Binance, the world’s largest crypto exchange, continues to see significant outflows.
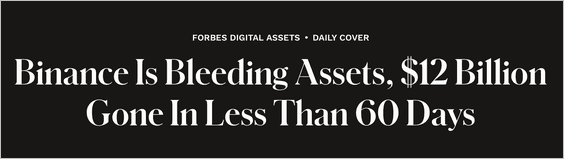 Source: Forbes Digital Assets Read full article
Binance USD’s (BUSD) “stable” coin holdings have steadily declined.
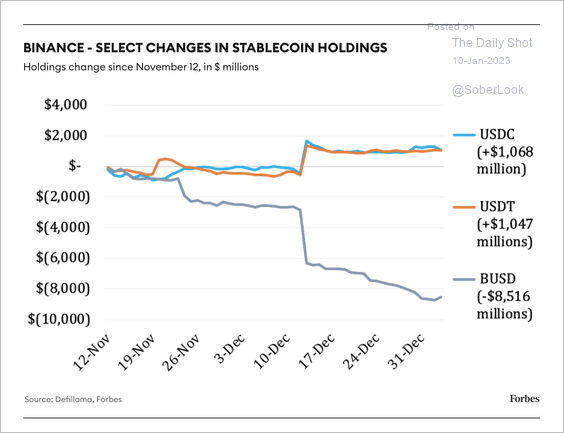 Source: Forbes Digital Assets Read full article
——————–
4. Countries with less affordable housing are more likely to have crypto enthusiasts, although the relationship varies.
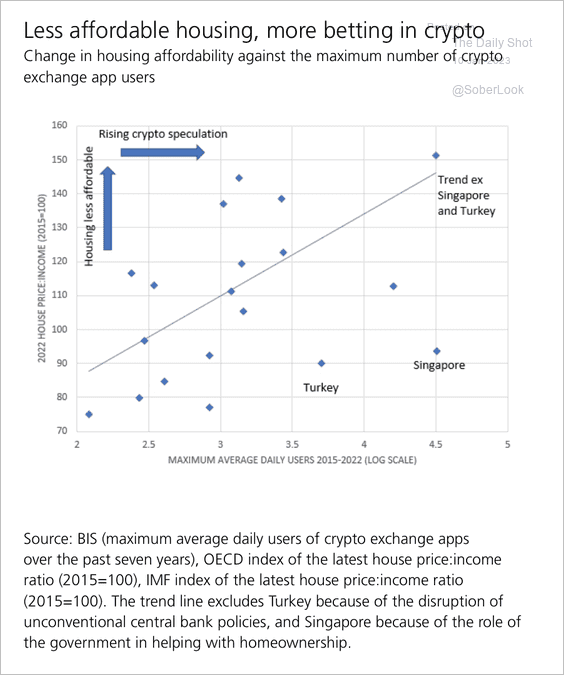 Source: UBS Research
5. Based on the dot-com analog, bitcoin has more room to fall.
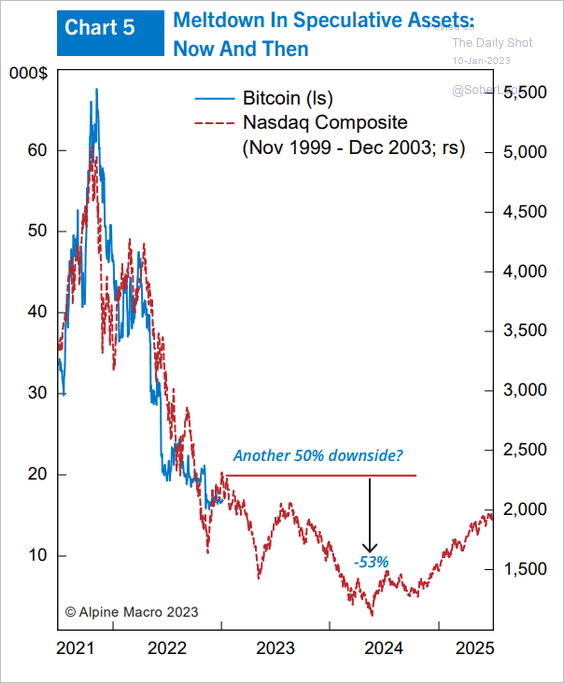 Source: Alpine Macro
Back to Index
Equities
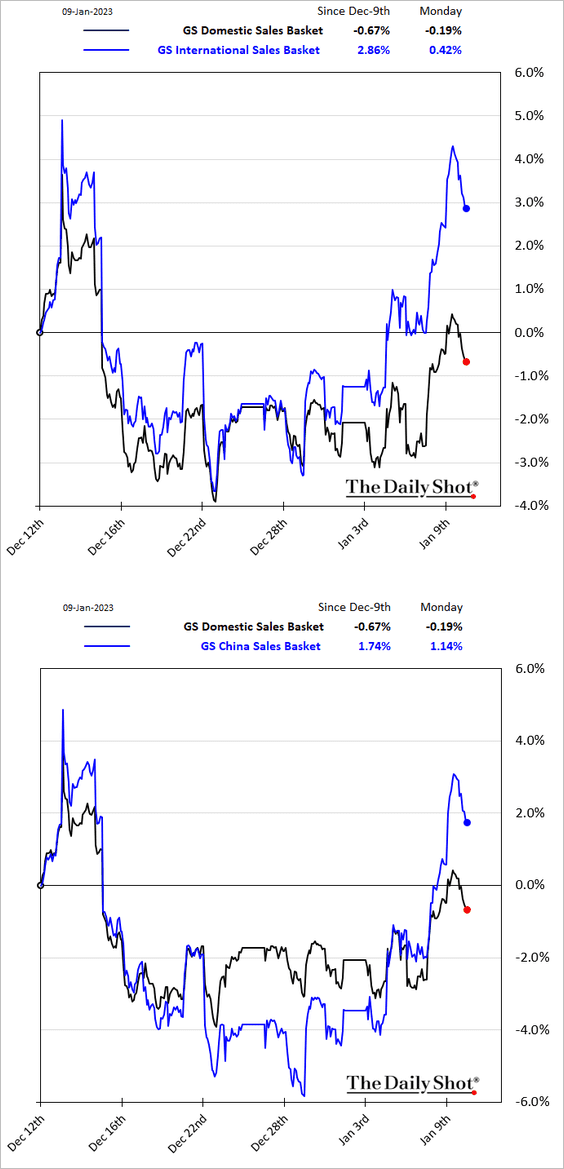
1. US shares with higher international sales have been outperforming as the dollar weakens and China reopens.
2. The S&P 500 Q4 earnings are expected to move closer to their long-term trend.
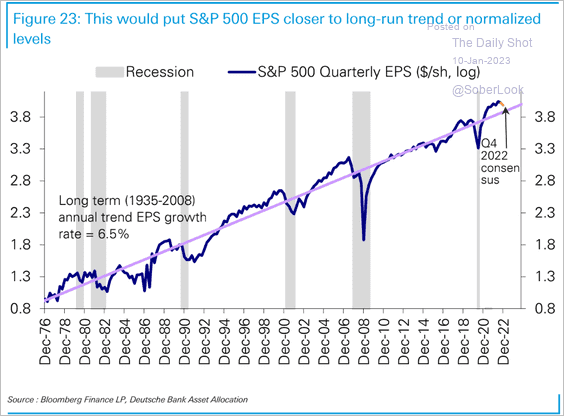 Source: Deutsche Bank Research
Mega-cap/tech earnings will fall below the trend.
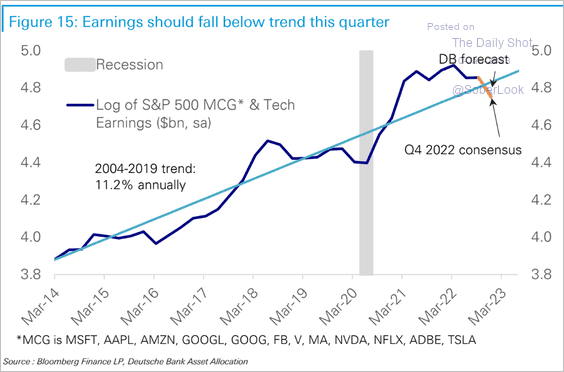 Source: Deutsche Bank Research
——————–
3. Goldman expects earnings growth to be flat for the full year.
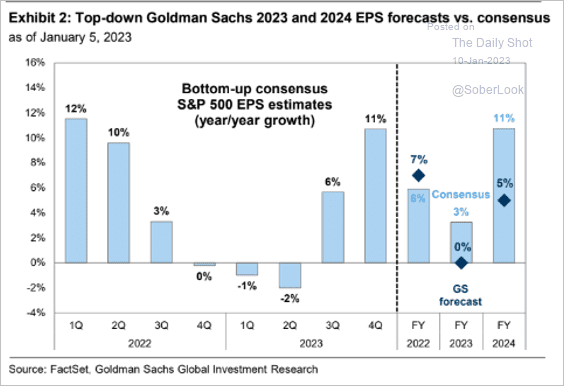 Source: Goldman Sachs; @MikeZaccardi
• Morgan Stanley’s leading earnings indicator continues to signal a severe deterioration in corporate earnings.
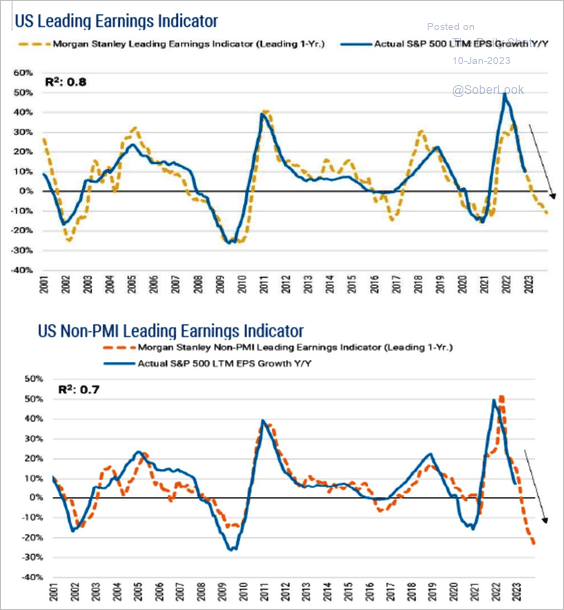 Source: Morgan Stanley Research; @WallStJesus
• The sharp decline in new home sales also points to an overall earnings contraction.
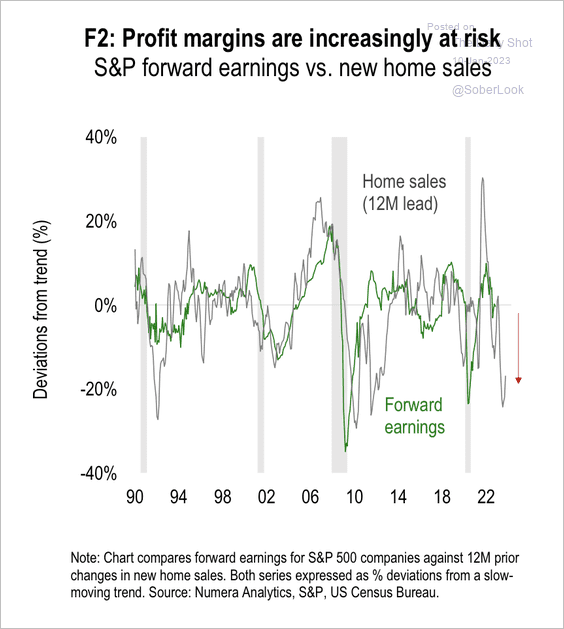 Source: Numera Analytics (@NumeraAnalytics)
——————–
4. The consolidated positioning indicator from Deutsche Bank suggests that investors are still very cautious.
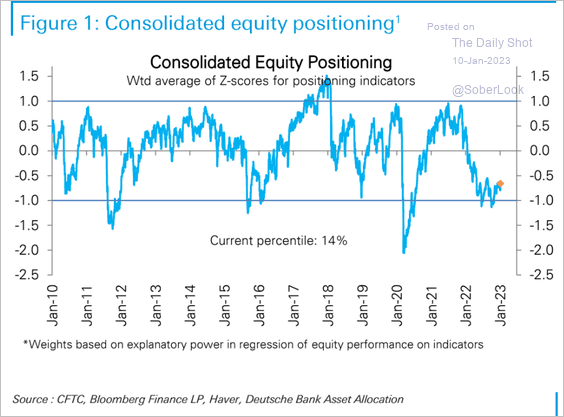 Source: Deutsche Bank Research
5. The S&P 500 ex. mega-caps has performed well over the past few months.
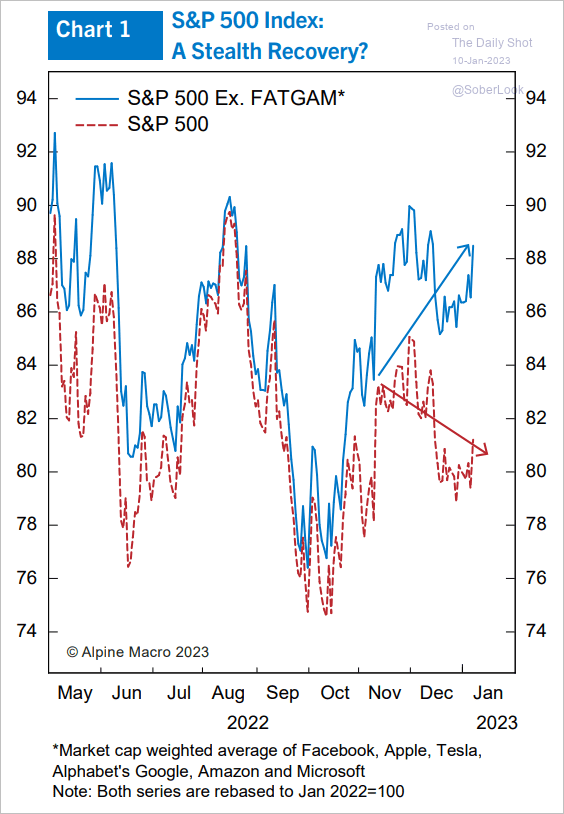 Source: Alpine Macro
And mega-caps remain expensive relative to the rest of the index.
 Source: Alpine Macro
——————–
6. Here is the dot-com analog for growth stocks.
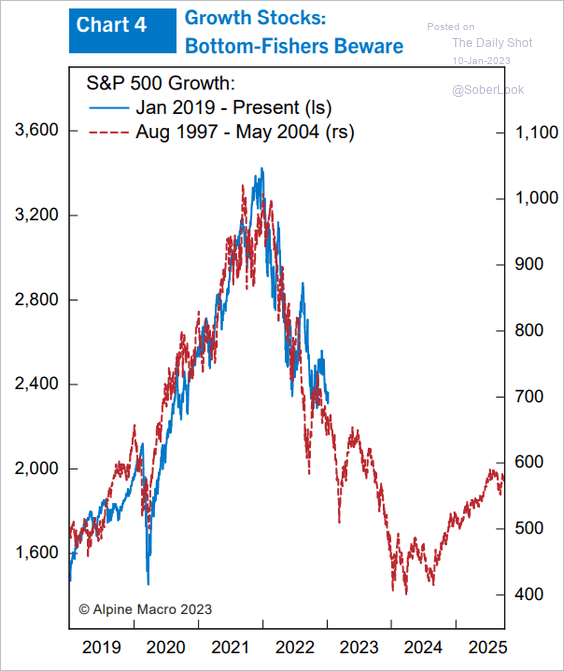 Source: Alpine Macro
7. The VVIX index (vol of vol) hit a multi-year low, signaling soft demand for VIX call options.
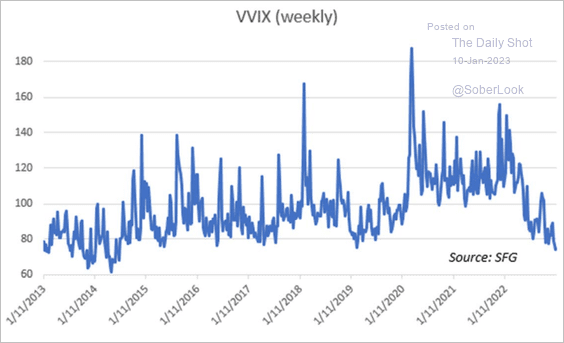 Source: Chris Murphy, Susquehanna International Group
8. Who expects higher stock prices this year? This chart is part of the NY Fed’s national consumer survey.
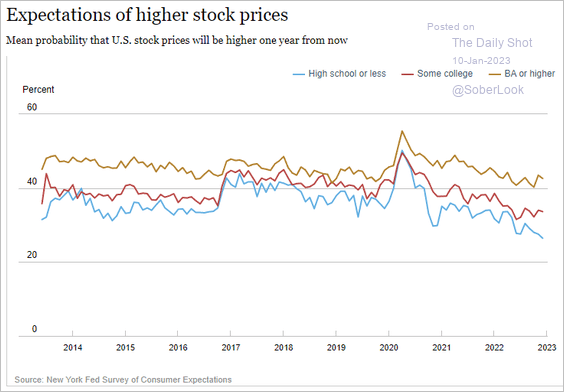 Source: Federal Reserve Bank of New York
Back to Index
Credit
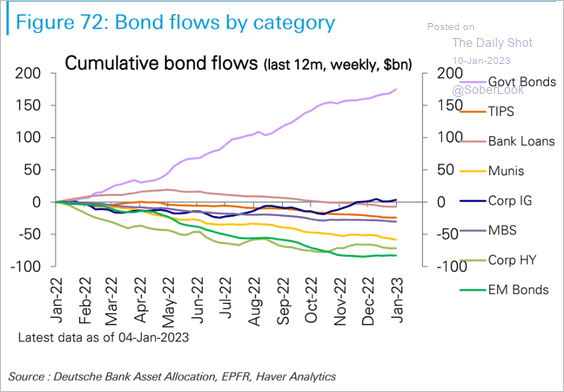
1. The largest HY ETF saw a hefty capital inflow last week, …
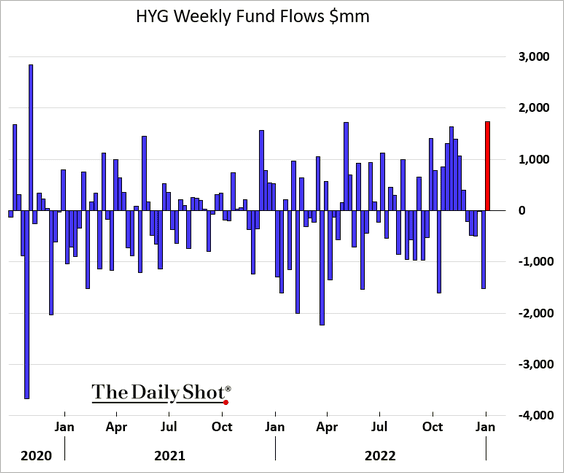
… after massive corporate credit outflows in 2022.
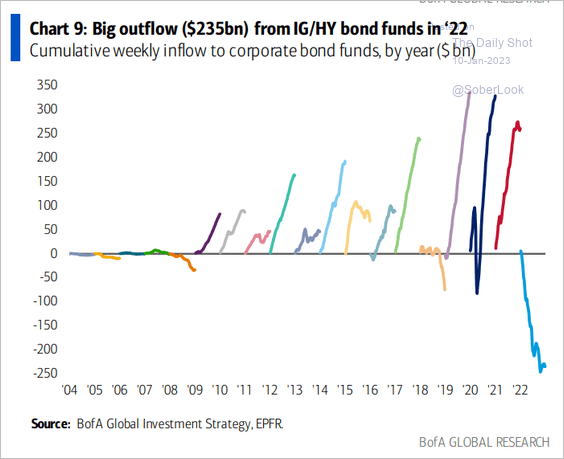 Source: BofA Global Research
Next, we have some additional fund flow data (2 charts).
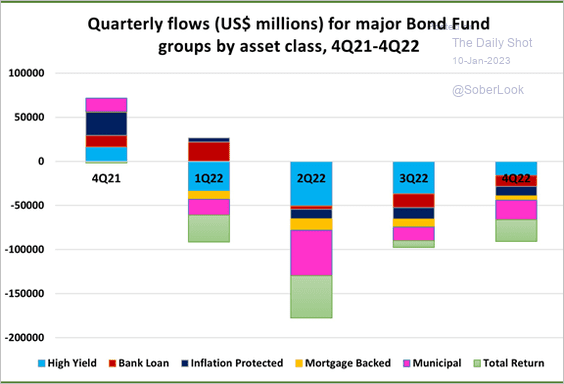 Source: EPFR
 Source: Deutsche Bank Research
——————–
2. Tighter loan standards point to higher defaults.
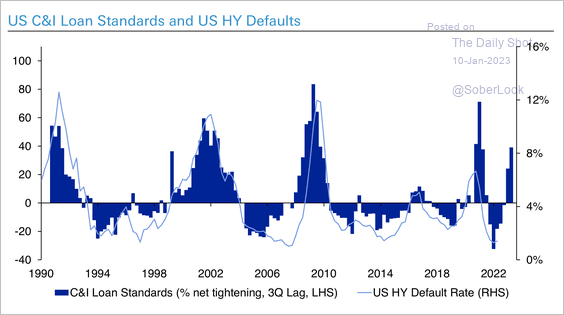 Source: Deutsche Bank Research
Defaults could increase into 2024, although capped by the lack of a maturity wall, according to Deutsche Bank.
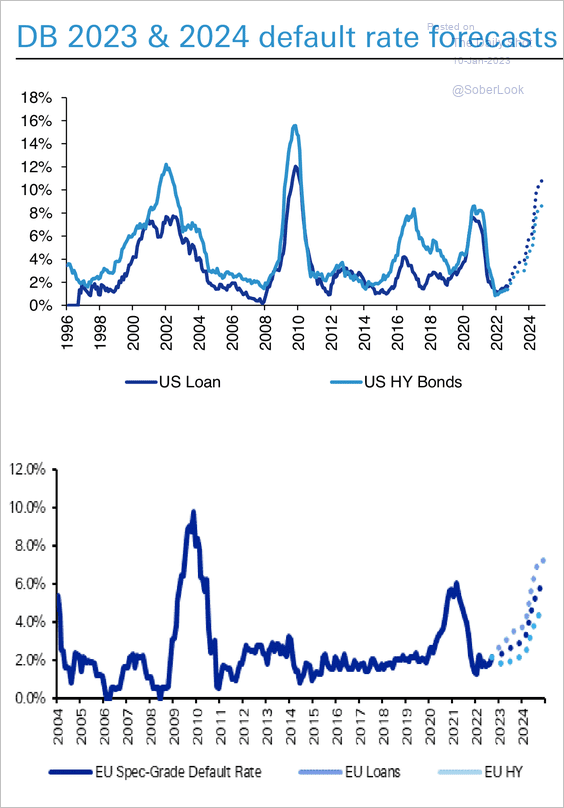 Source: Deutsche Bank Research
——————–
3. Private credit providers stepped up last year to fund LBOs as the syndicated loan market dried up.
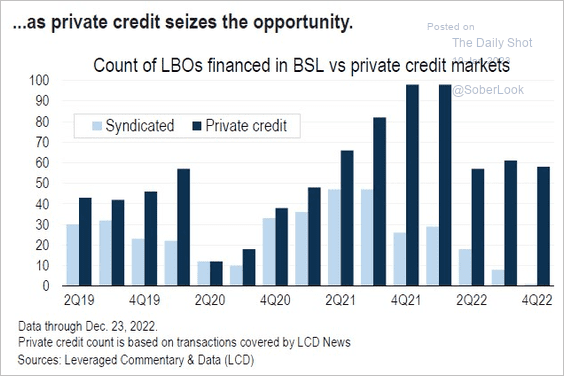 Source: @lcdnews
Back to Index
Rates
1. Numera Analytics expects the Fed funds rate to plateau at 5% early next year and remain at that level until Q1 2024. At that point, inflation could fall enough to justify a Fed pivot.
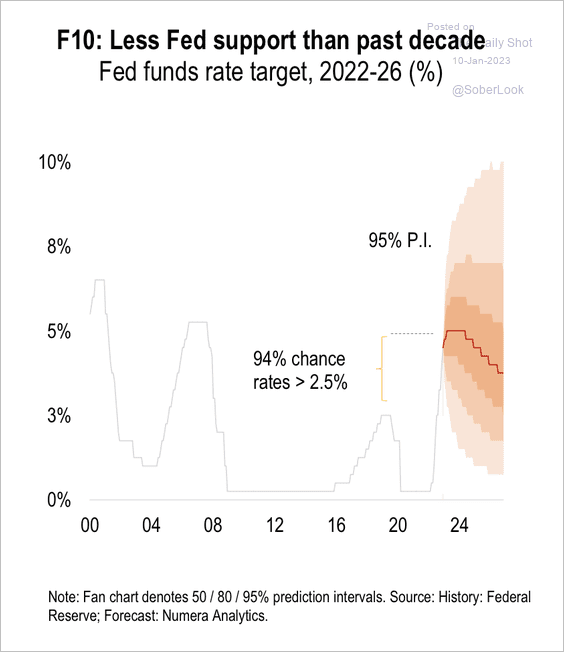 Source: Numera Analytics (@NumeraAnalytics)
2. Bearish positioning in Treasury futures is hitting extreme levels.
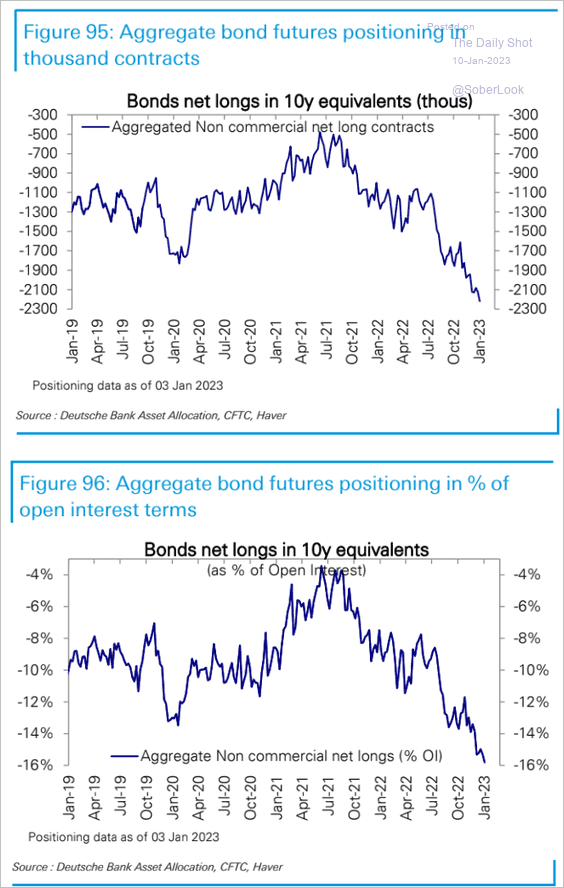 Source: Deutsche Bank Research
Back to Index
Global Developments
1. Hedge funds are boosting their bets against the dollar.
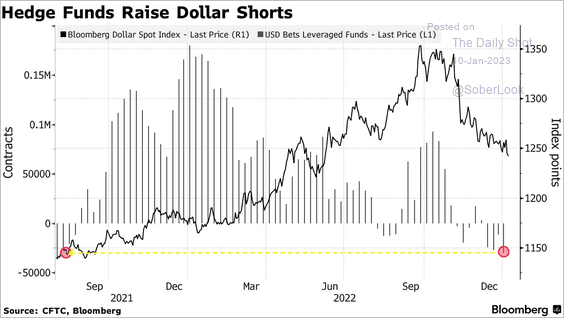 Source: @Ruth_Liew10, @markets Read full article
2. Here are the two most important macro factors, according to Alpine Macro.
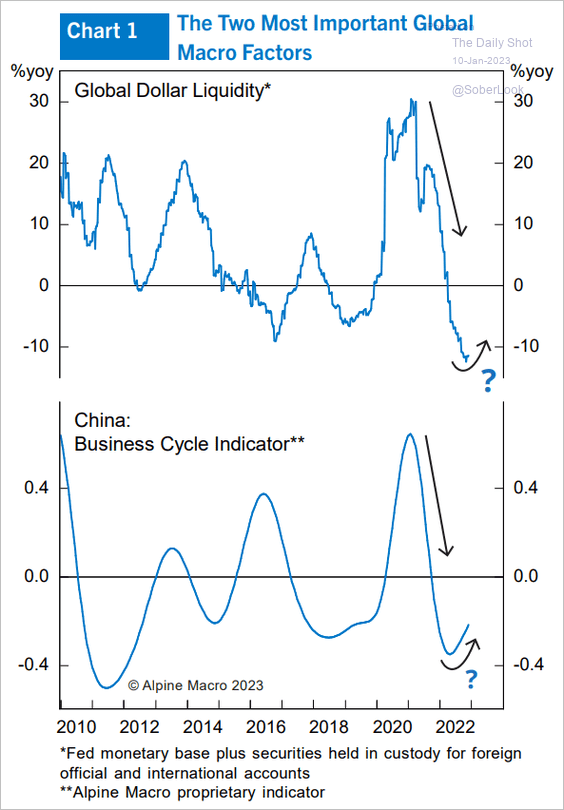 Source: Alpine Macro
3. Container shipping costs continue to fall.
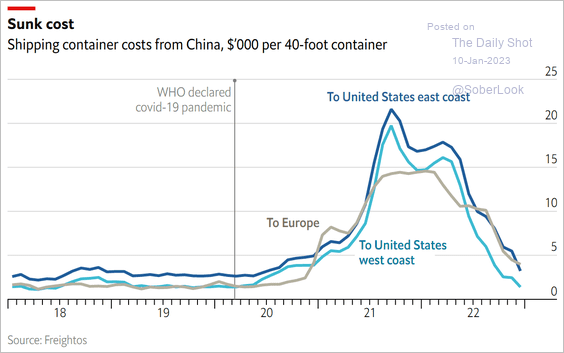 Source: The Economist Read full article
4. Global trade has been slowing.
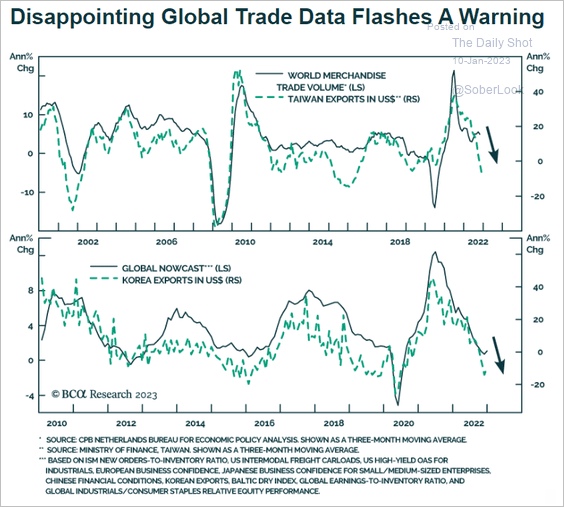 Source: BCA Research
5. Will China’s export price inflation slow further?
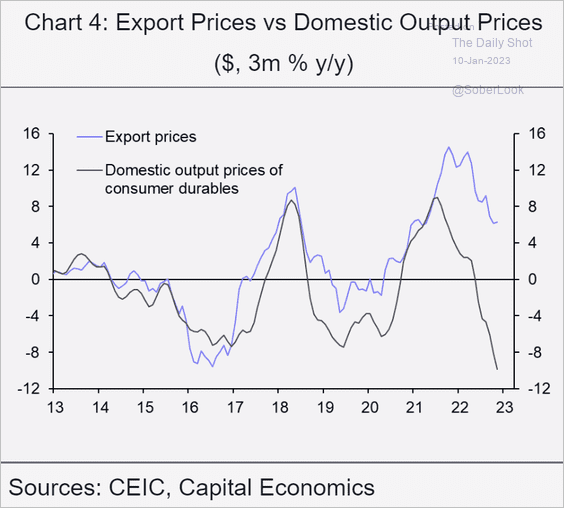 Source: Capital Economics
——————–
Food for Thought
1. Largest mergers and acquisitions:
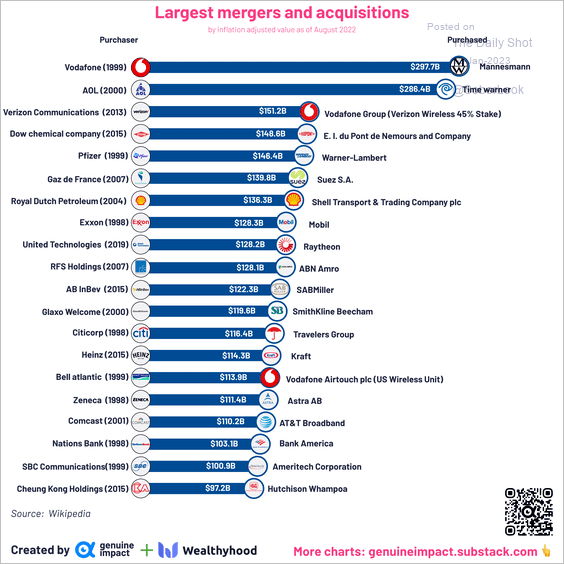 Source: @du_truman
2. Gen-Z brand favorability:
 Source: @CivicScience Read full article
3. Digital ad market share over time:
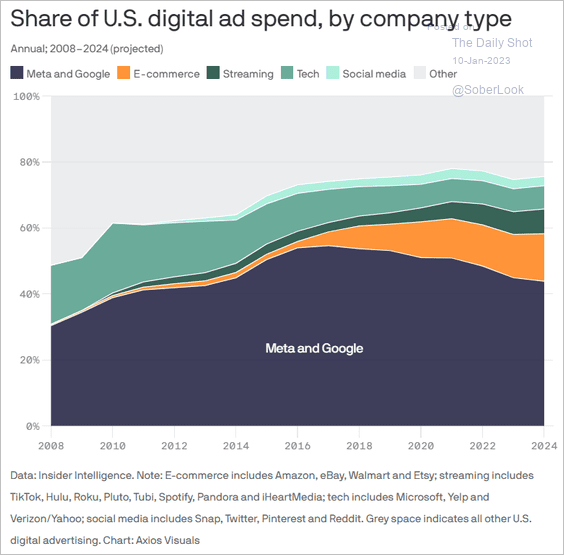 Source: @axios Read full article
4. Reevaluating supply chains:
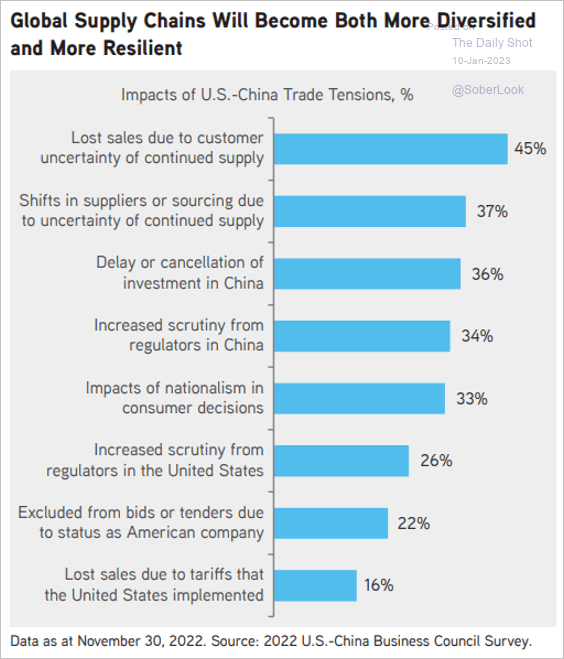 Source: KKR Global Institute
5. US farm income:
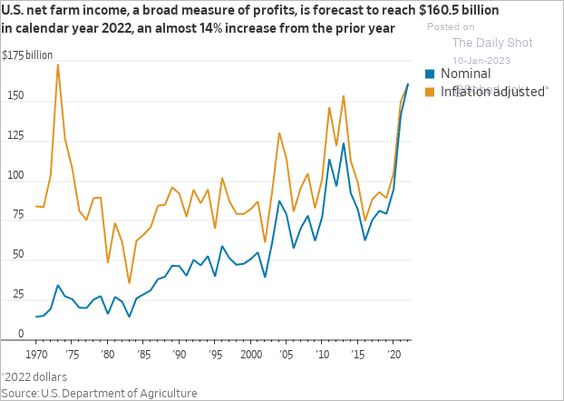 Source: @WSJ Read full article
6. Cold and flu medicine preferences:
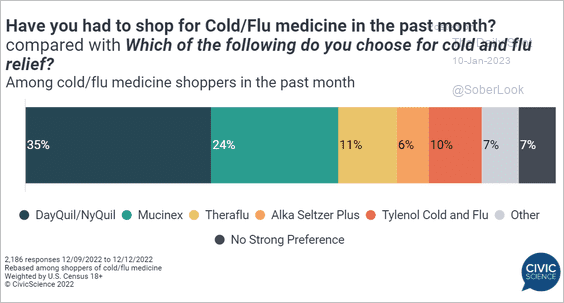 Source: @CivicScience Read full article
7. Excessive alcohol use deaths among US adults aged 20 to 49 (2015 to 2019):
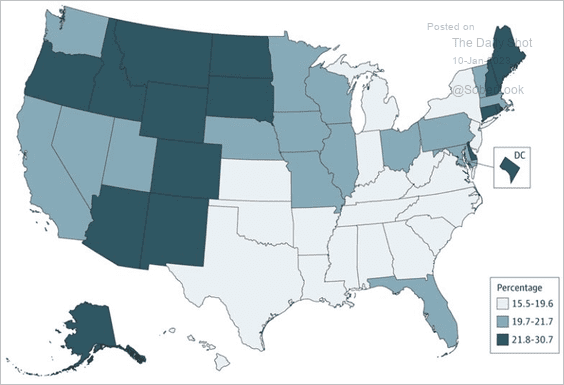 Source: Esser, Leung, Sherk, et al Read full article
8. New Year’s resolutions:
 Source: @chartrdaily
——————–
Back to Index