
The Daily Shot: 12-Jan-23
• The United States
• The Eurozone
• Japan
• Asia – Pacific
• China
• Emerging Markets
• Commodities
• Energy
• Equities
• Alternatives
• Credit
• Global Develoopments
• Food for Thought
The United States
1. Let’s begin with the housing market.
• Mortgage applications remain depressed.
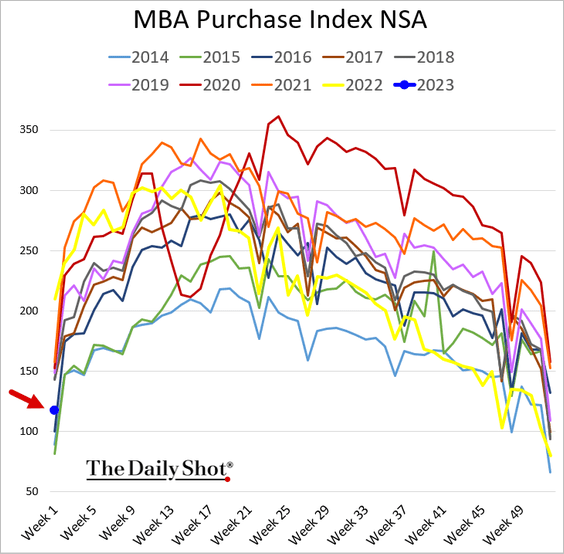
Here is the seasonally-adjusted index.
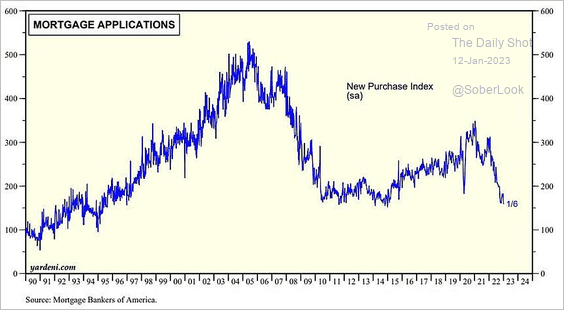 Source: Yardeni Research
And this chart shows the rate lock index.
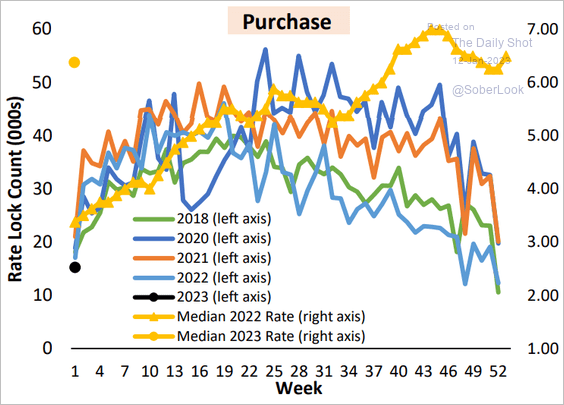 Source: AEI Housing Center
• Consumers see lower price gains but still don’t expect home prices to be down in 12 months.
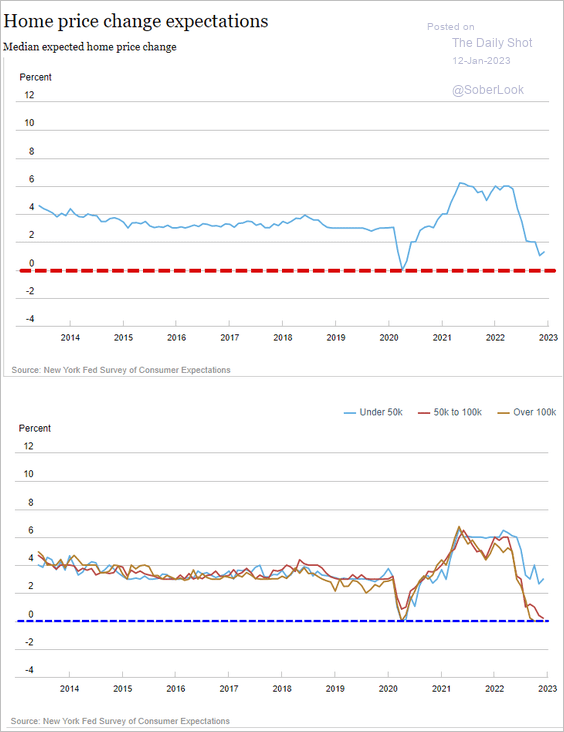 Source: Federal Reserve Bank of New York
• Here are new home sales vs. houses under construction.
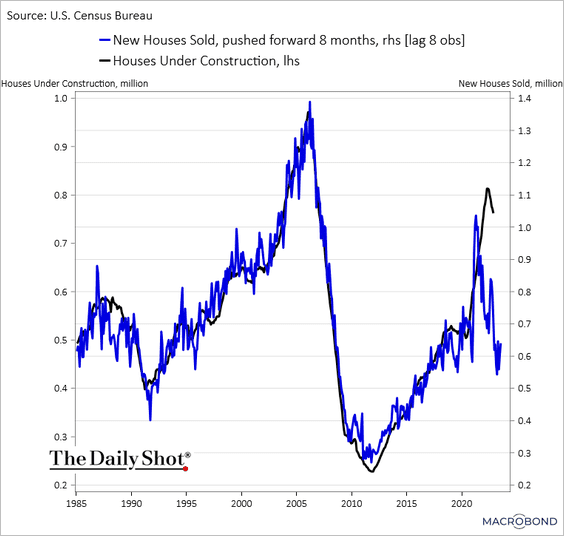 Source: Chart and data provided by Macrobond
• Fewer Americans expect to move over the next 12 months.
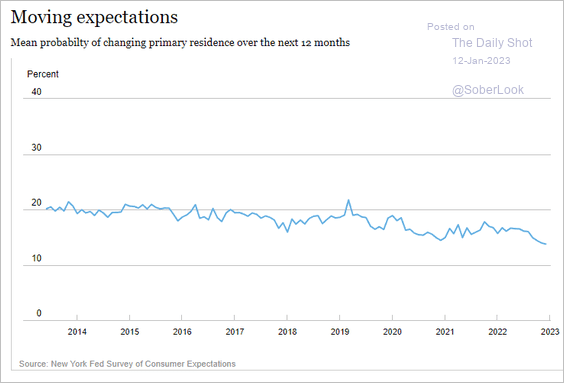 Source: Federal Reserve Bank of New York
• This chart shows the COVID-era shift in construction spending.
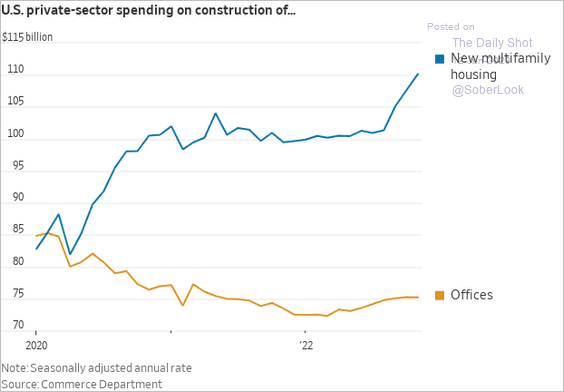 Source: @WSJ Read full article
——————–
2. Next, we have some updates on inflation.
• All eyes are on the CPI report today. But concerns persist about the Labor Department’s potential CPI data leak.
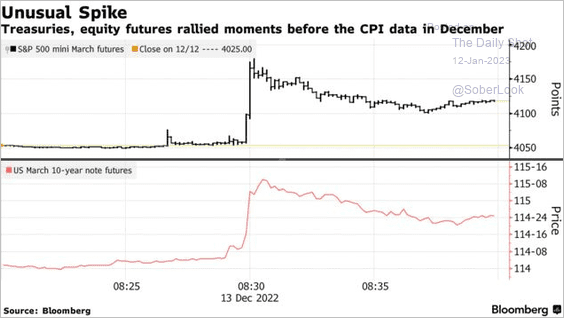 Source: @lena_popina, @mccormickliz, @ElleBeyoud, @markets Read full article
• Asking rents declined again last month as demand softens.
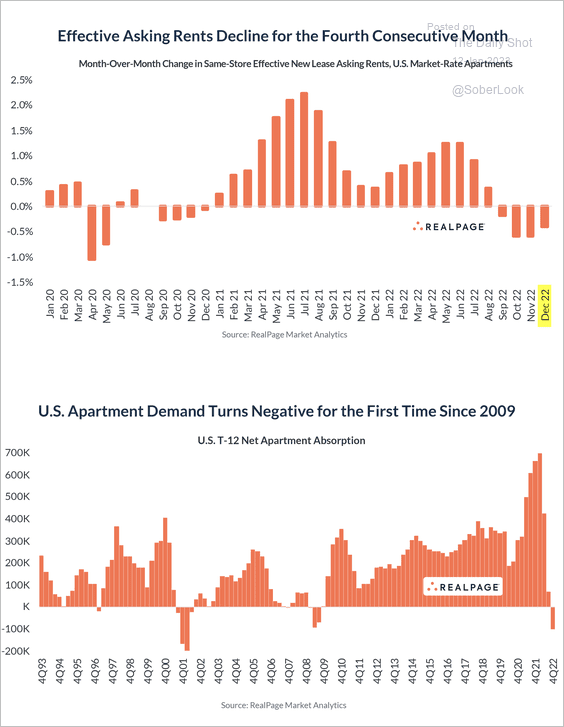 Source: RealPage
• A decrease in the number of union workers with a cost-of-living adjustment clause in their contracts reduces the potential for a wage-price spiral.
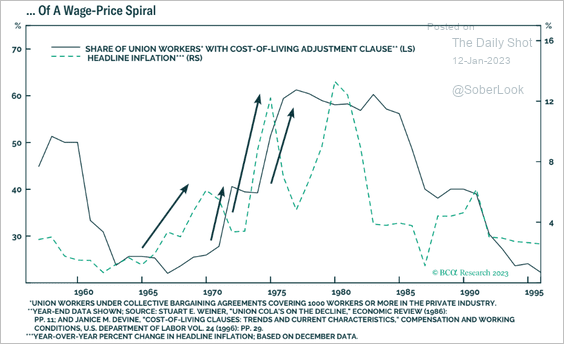 Source: BCA Research
• The NFIB small business report points to strong wage growth.
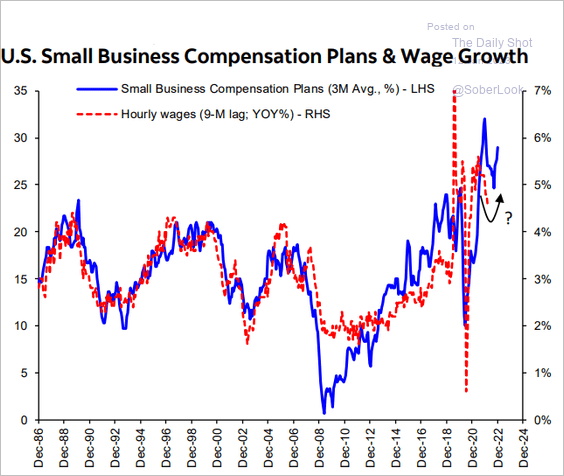 Source: Hugo Ste-Marie, Portfolio & Quantitative Strategy Global Equity Research, Scotia Capital
But data from Yipit support the payrolls report narrative of slower wage gains.
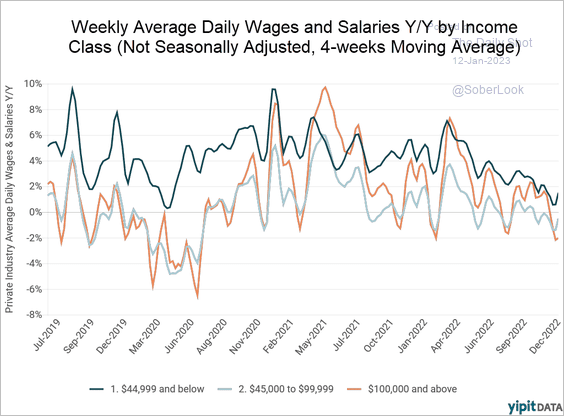 Source: YipitData
——————–
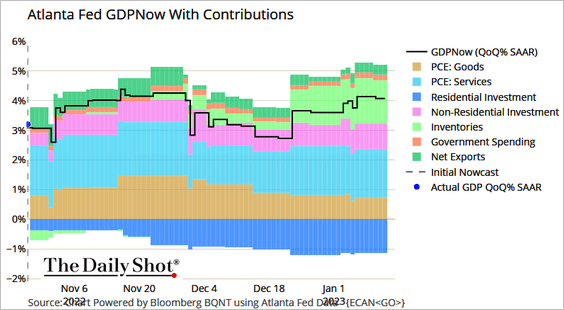
3. The Atlanta Fed’s GDPNow estimate for last quarter’s growth remains above 4% (annualized).
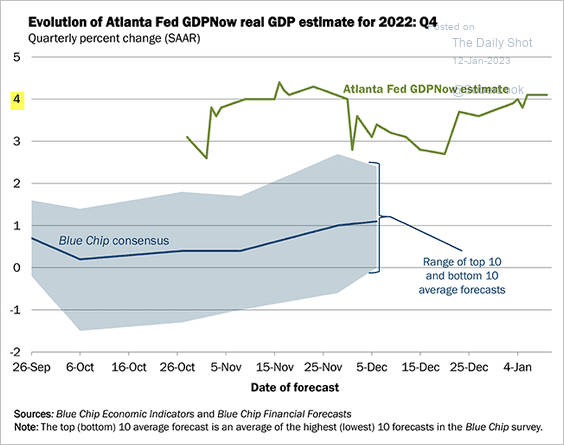 Source: @AtlantaFed
 Source: @TheTerminal, Bloomberg Finance L.P.
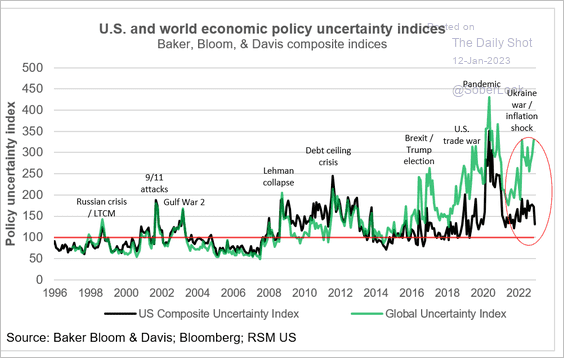
4. The US and global uncertainty indicators have diverged.
 Source: The Real Economy Blog
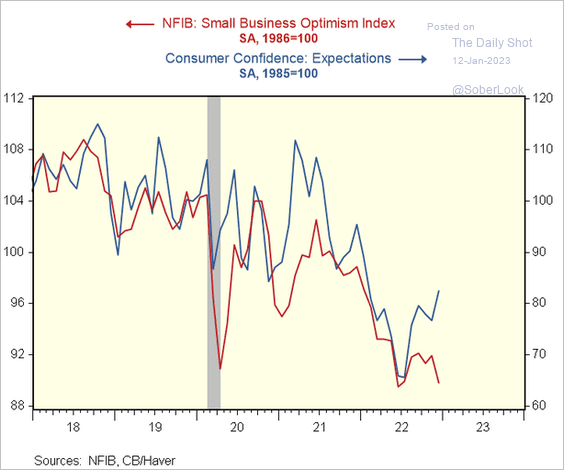
5. Are small firms too pessimistic?
 Source: @RenMacLLC
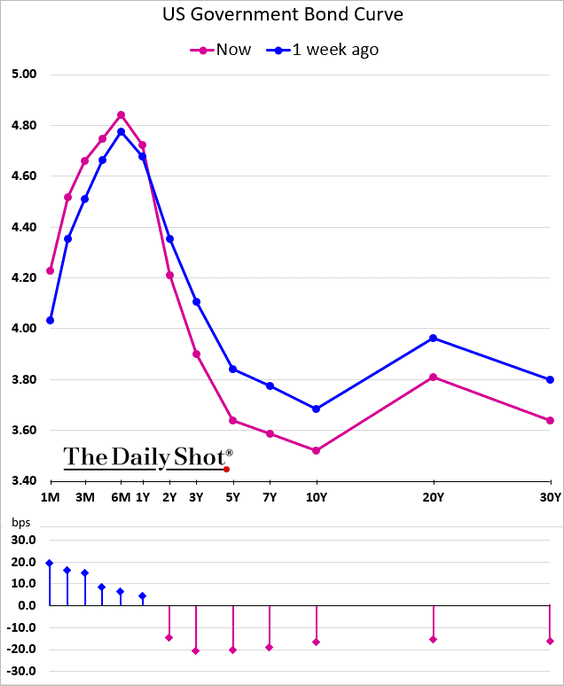
6. The yield curve inversion deepened this week (3 charts).
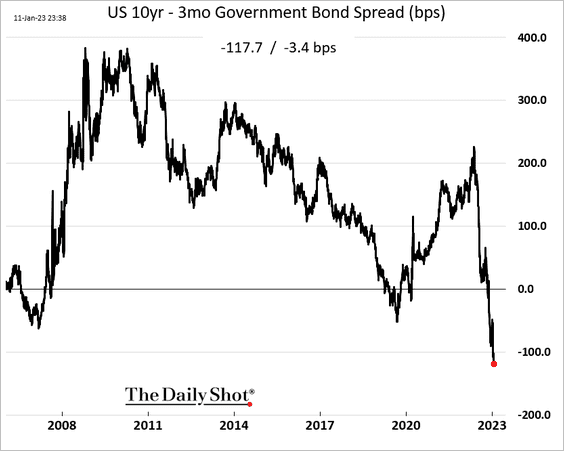
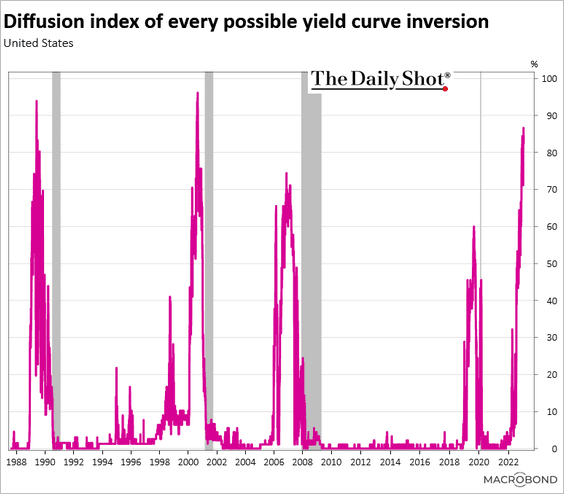 Source: Chart and data provided by Macrobond
Back to Index
The Eurozone
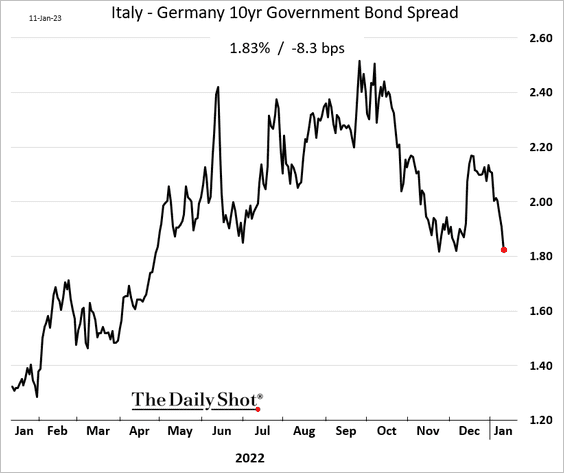
1. Despite worsening market fundamentals for Italian debt, …
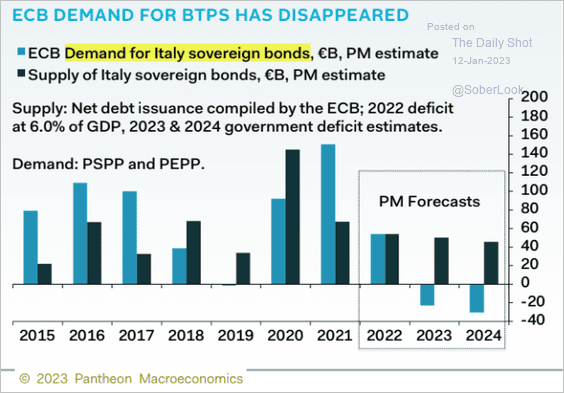 Source: Pantheon Macroeconomics
… Italian spreads have been tightening.
——————–
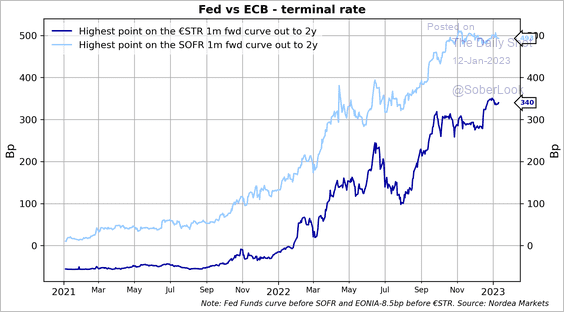
2. Where does the market see short-term rates over the next few years?
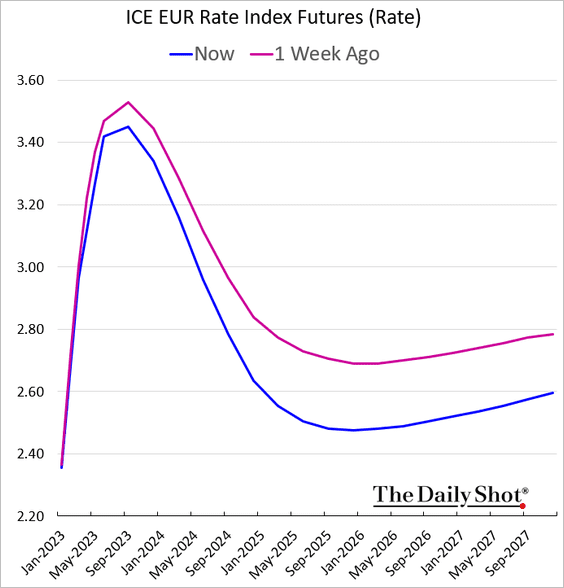
Here is the market expectation for US and euro-area terminal (peak) rates.
 Source: Nordea Markets
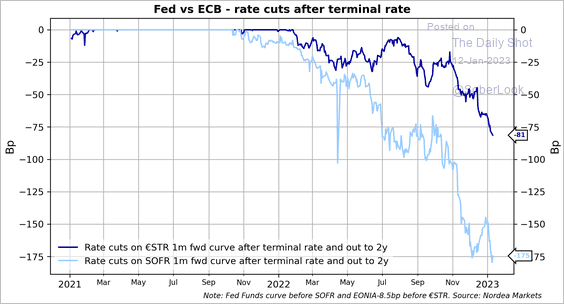
Where does the market see short-term rates heading after the peak?
 Source: Nordea Markets
——————–
3. Quantitative tightening continues.
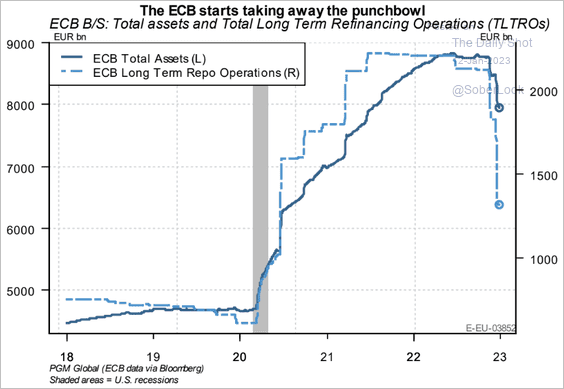 Source: PGM Global
4. Despite better-than-expected PMI data recently, a GDP contraction still looks likely.
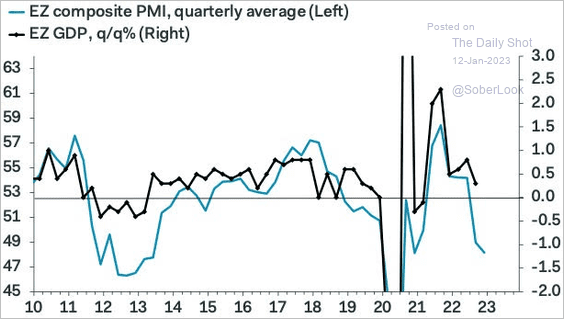 Source: Pantheon Macroeconomics
Back to Index
Japan
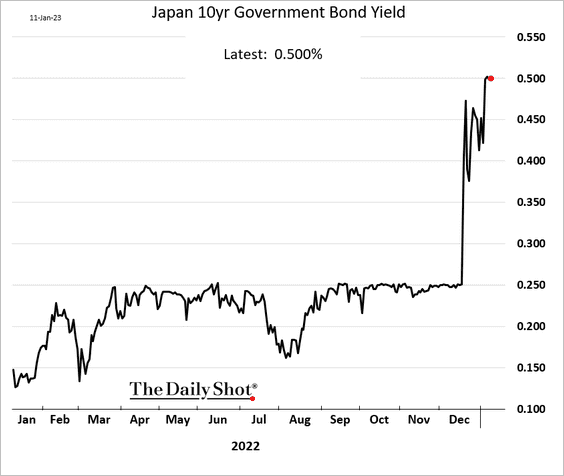
1. The dam is about to break. The BoJ’s battle with the markets is becoming too costly, as the central bank buys massive amounts of JGBs …
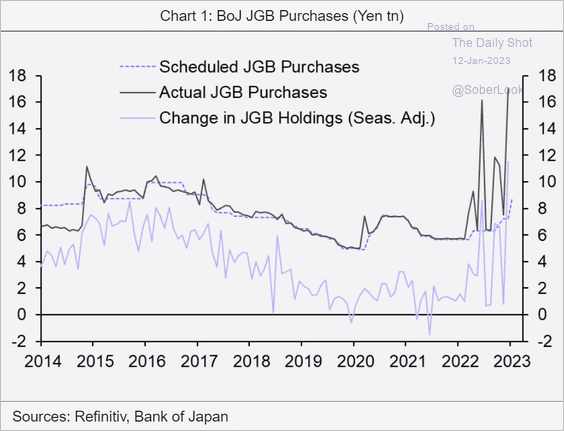 Source: Capital Economics
… while inflation accelerates. It’s not sustainable.
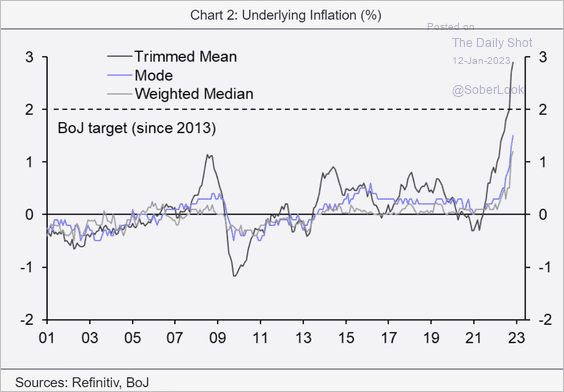 Source: Capital Economics
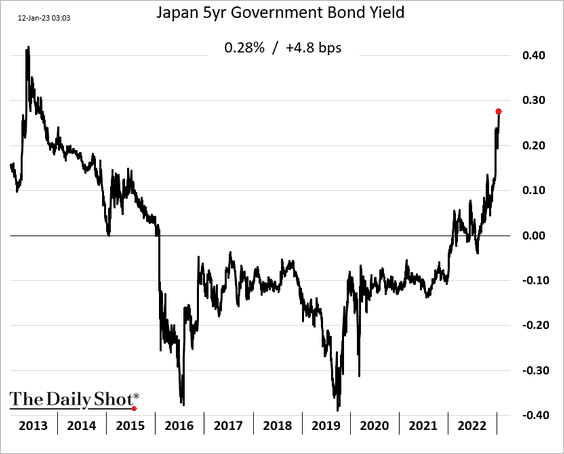
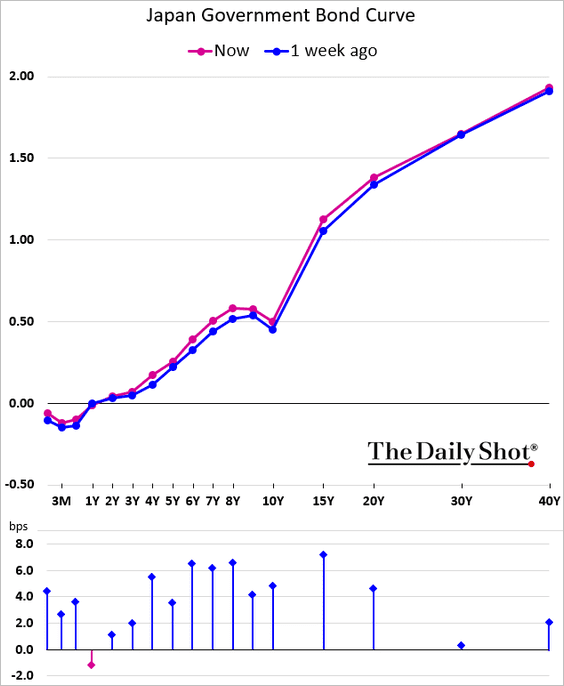
The market wants to take the 10-year above 0.5% …
… pushing other yields higher.
——————–
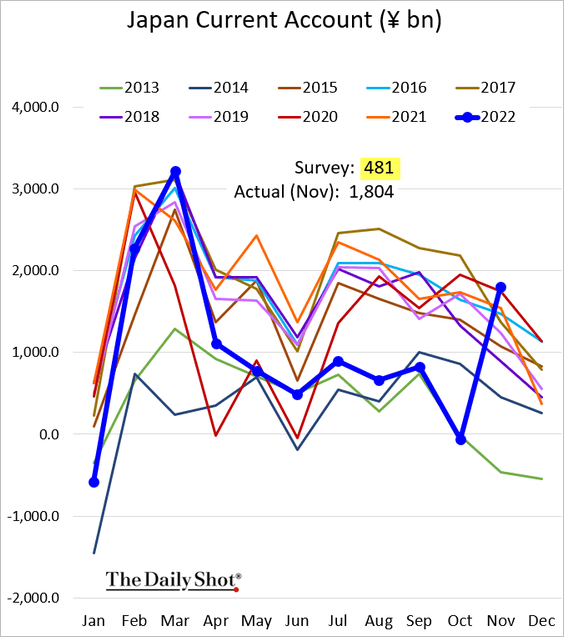
2. The current account surplus surged in November.
 Source: Reuters Read full article
Back to Index
Asia – Pacific
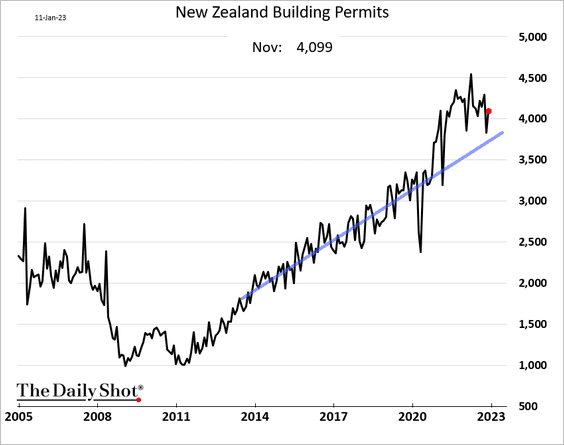
1. New Zealand’s building permits remain above the pre-COVID trend.
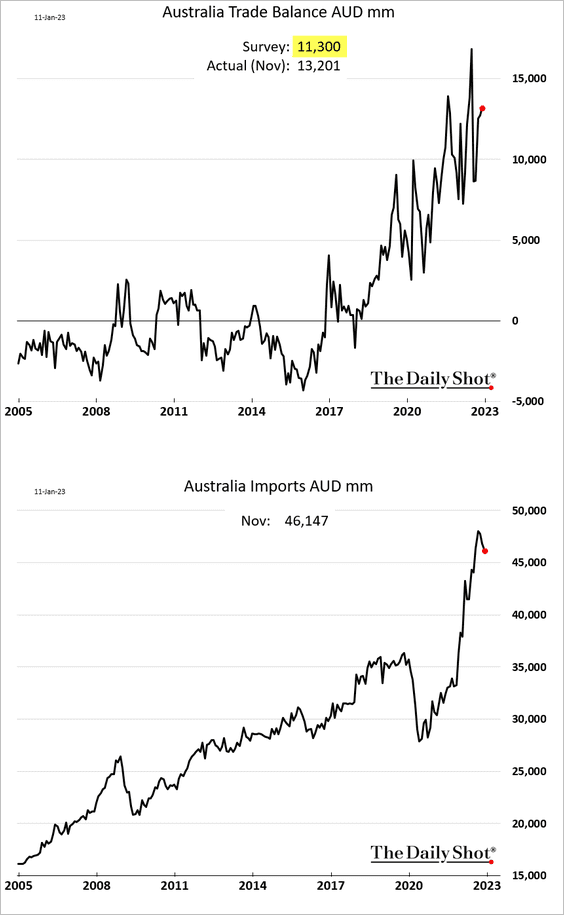
2. Next, we have some updates on Australia.
• The trade surplus topped expectations as imports softened (due to lower energy prices).
• Persistently high inflation …
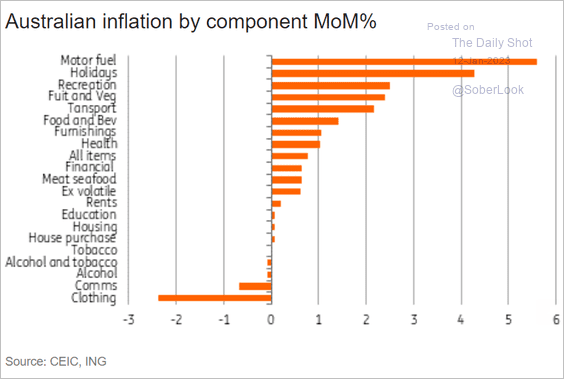 Source: ING
… points to a rate hike next month.
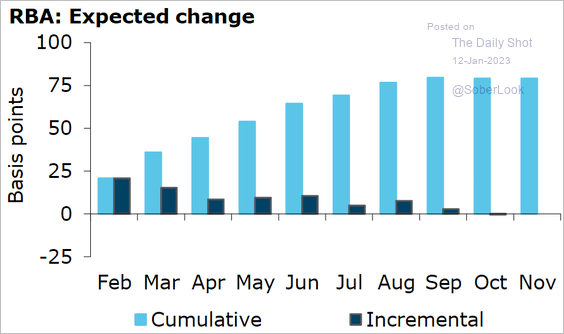 Source: @ANZ_Research
• Flooding in New South Wales and Victoria boosted produce prices.
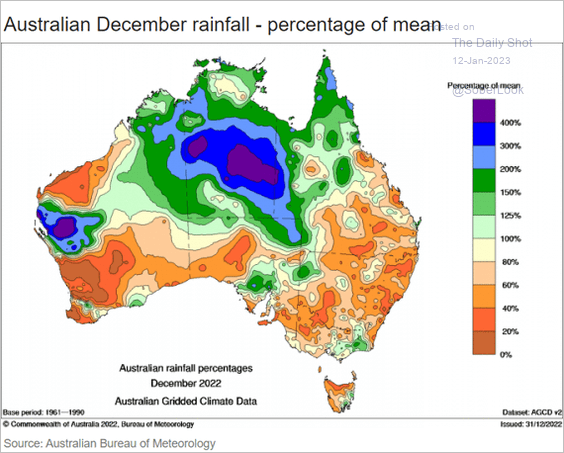 Source: ING
Back to Index
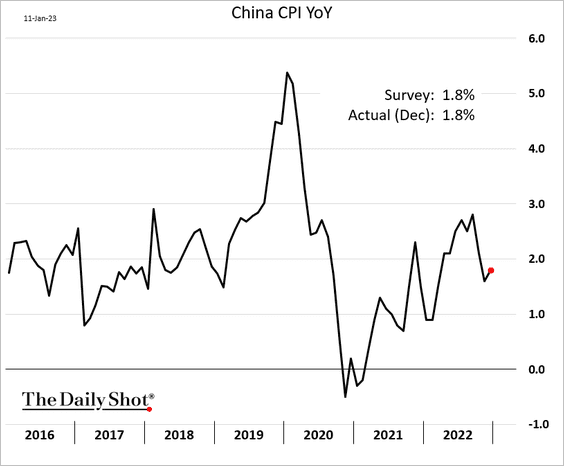
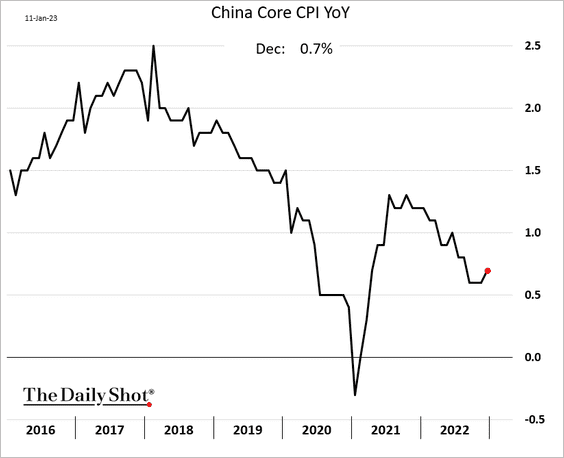
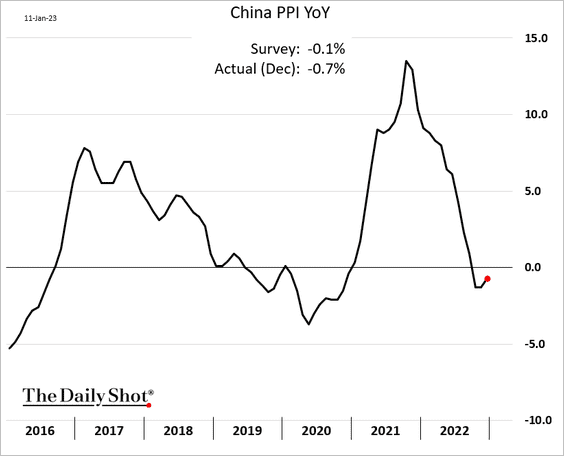
China
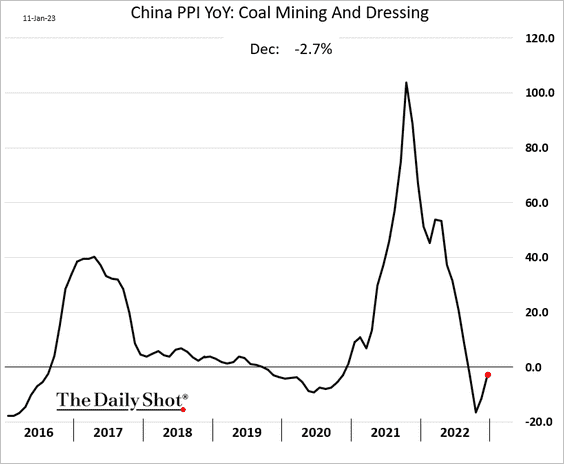
1. Inflation edged higher in December.
• CPI:
• Core CPI:
• PPI:
• PPI in the coal sector:
——————–
2. Confidence among entrepreneurs has been weak.
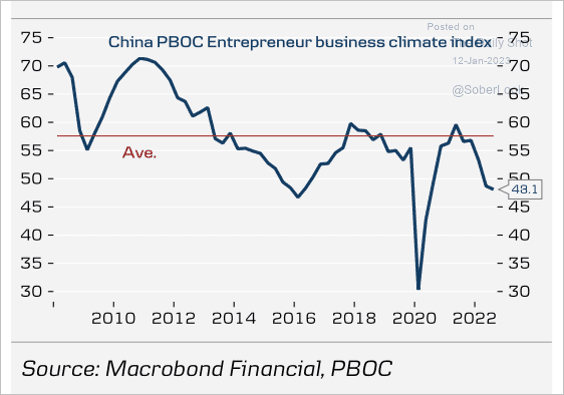 Source: Danske Bank
3. Stimulus is boosting longer-term corporate credit growth.
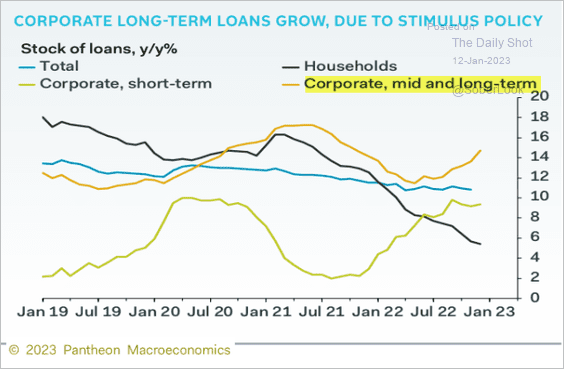 Source: Pantheon Macroeconomics
4. Household consumption has been persistently below trend since the onset of the pandemic.
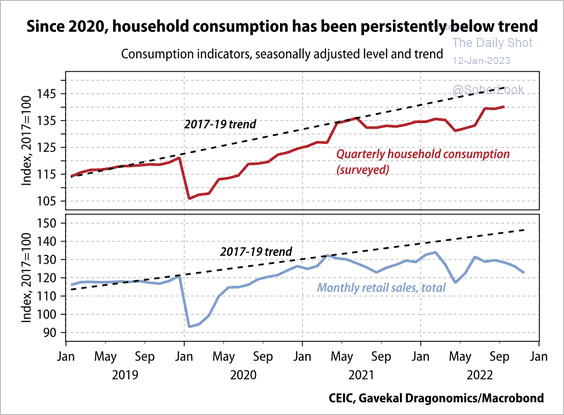 Source: Gavekal Research
The household debt burden stabilized, supported by the recent slowdown in mortgage growth.
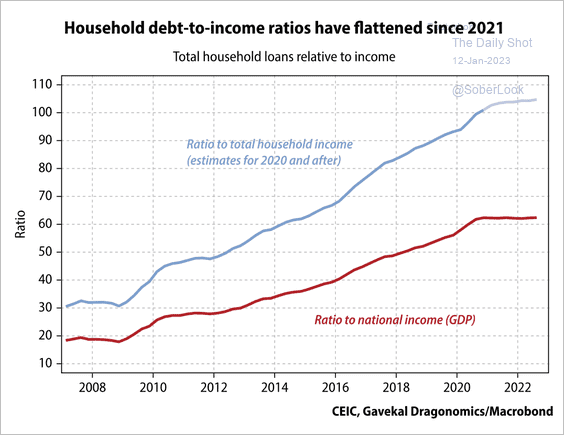 Source: Gavekal Research
Back to Index
Emerging Markets
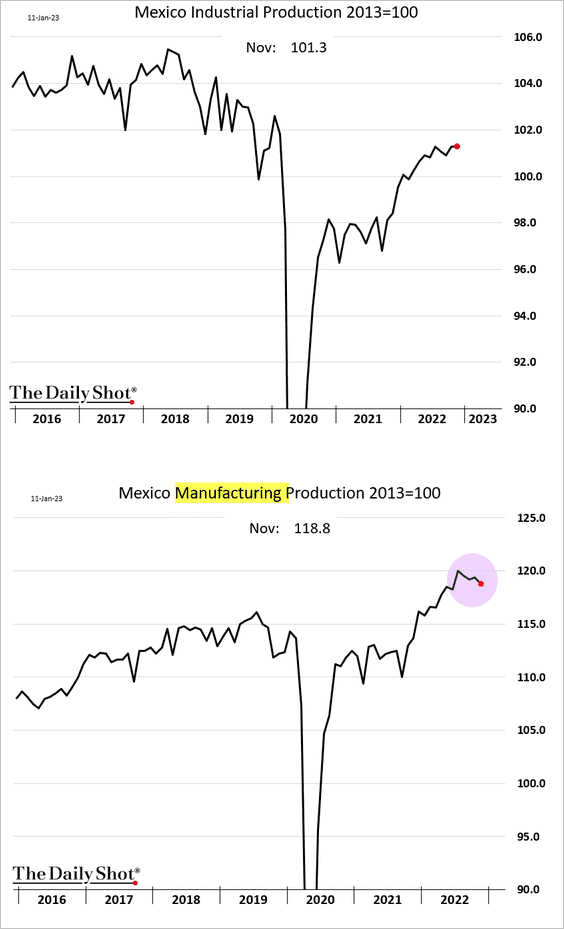
1. Mexico’s industrial production is holding up, but manufacturing output could be rolling over.
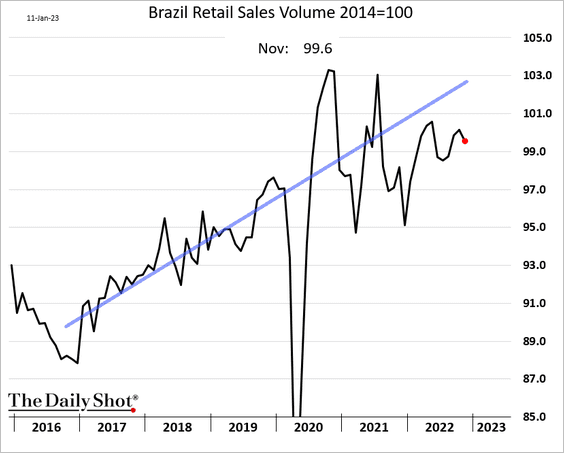
2. Brazil’s retail sales edged lower in November.
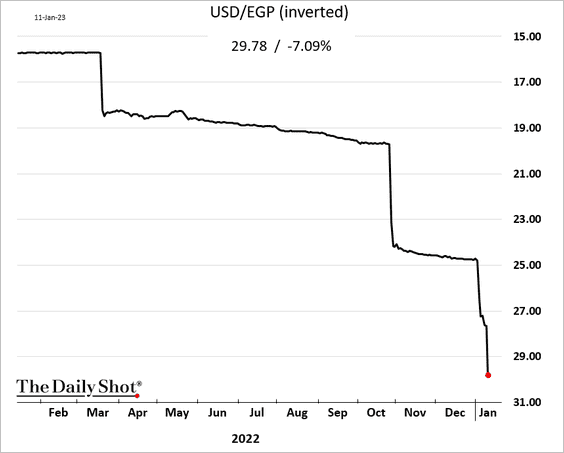
3. The Egyptian pound is in freefall.
4. South Africa’s bonds could be attractive due to the increased term premium.
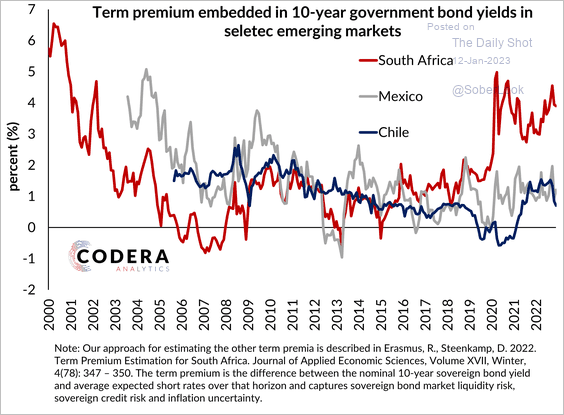 Source: Codera Analytics
5. This chart shows EM currency valuations based on Alpine Macros’ fair value model.
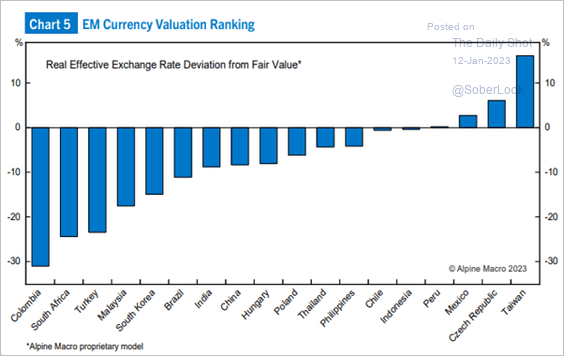 Source: Alpine Macro
Back to Index
Commodities
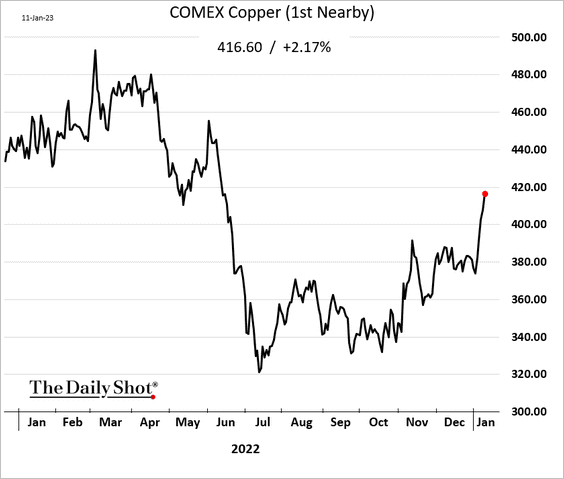
1. China’s reopening has been a boon for copper.
2. Here are the drivers of the recent gold rally, according to Numera Analytics.
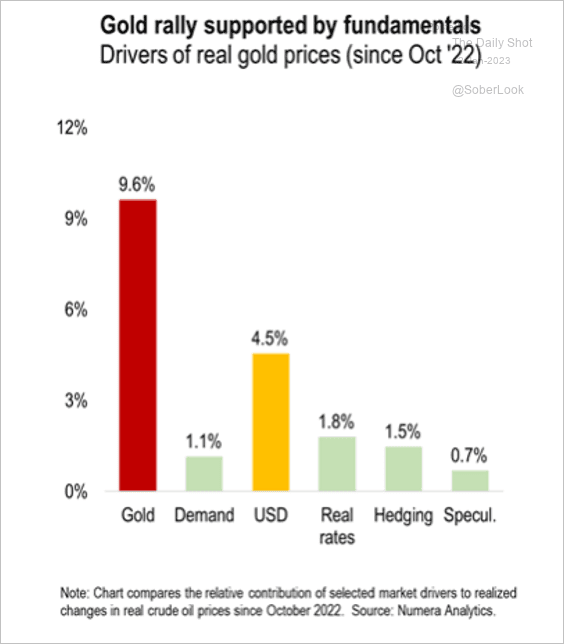 Source: Numera Analytics (@NumeraAnalytics)
3. Low CapEx signals weaker iron ore production ahead.
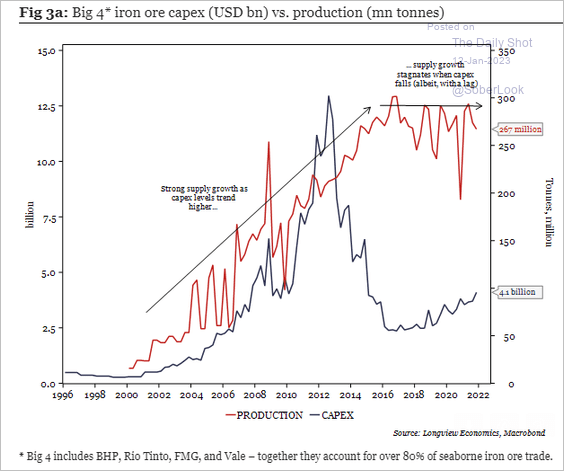 Source: Longview Economics
4. Coffee futures continue to tumble.
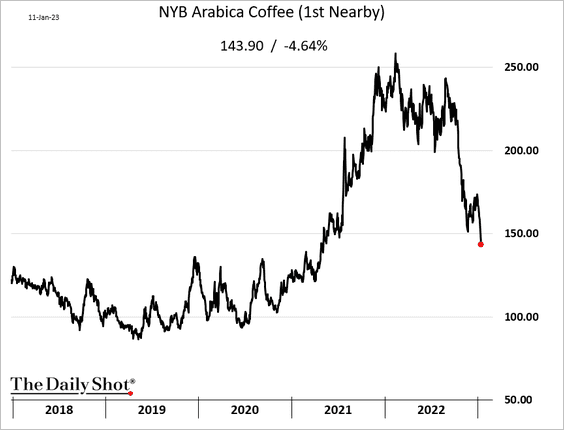
 Source: @WSJ Read full article
Back to Index
Energy
1. US crude oil inventories jumped last week.
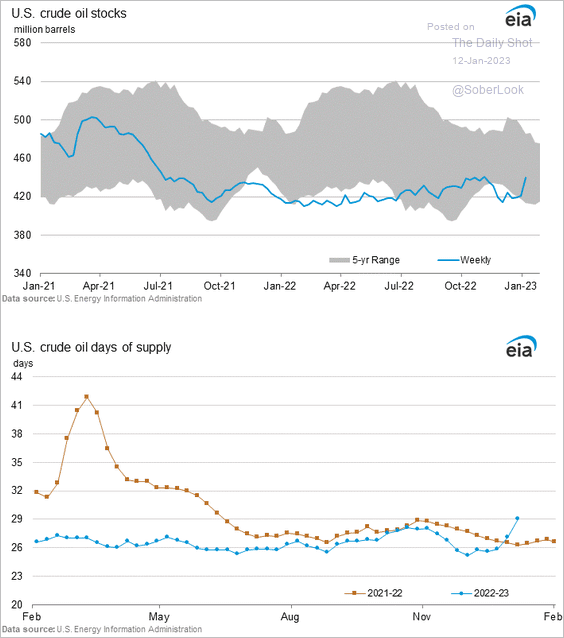
 Source: Reuters Read full article
2. Refinery inputs and diesel production are down sharply over the past couple of weeks.
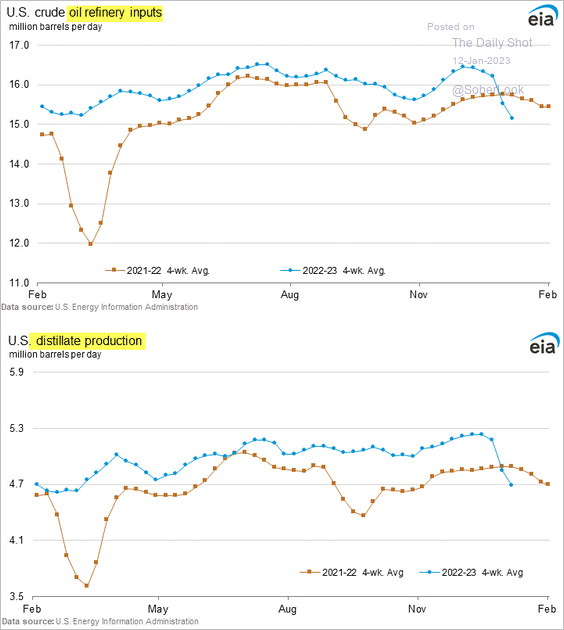
The diesel curve shows tight supplies.
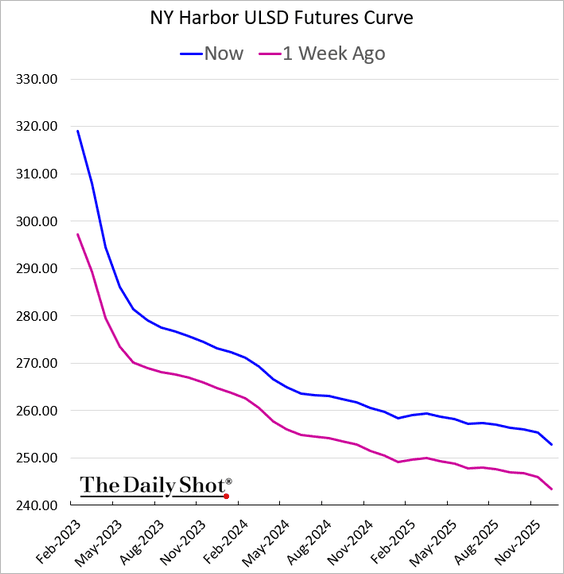
 Source: Oil Price Read full article
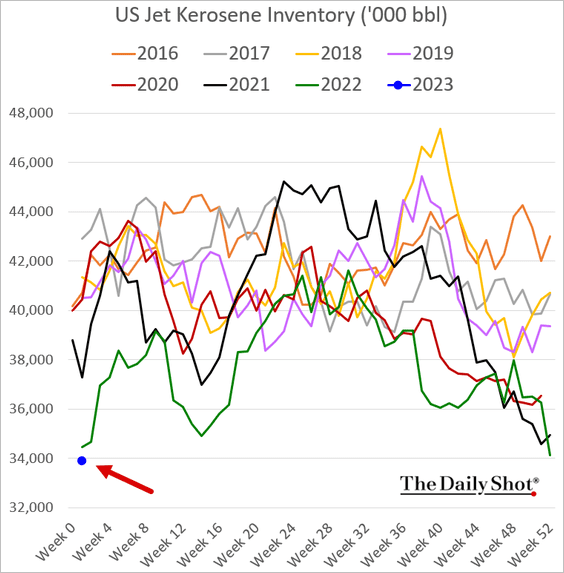
Jet fuel inventories are at a multi-year low.
——————–
3. When will US crude oil production exceed 12.2 million barrels per day?
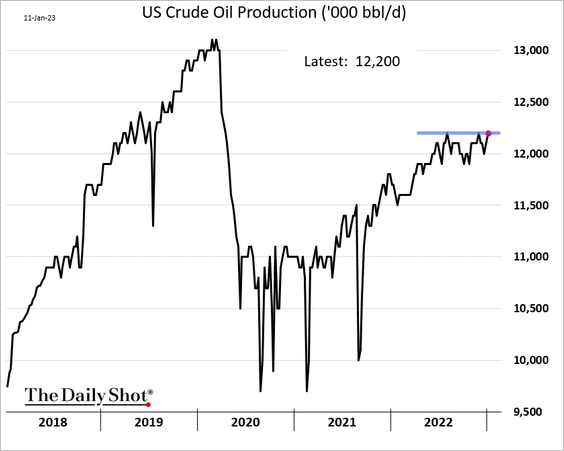
Here is US crude oil production by region.
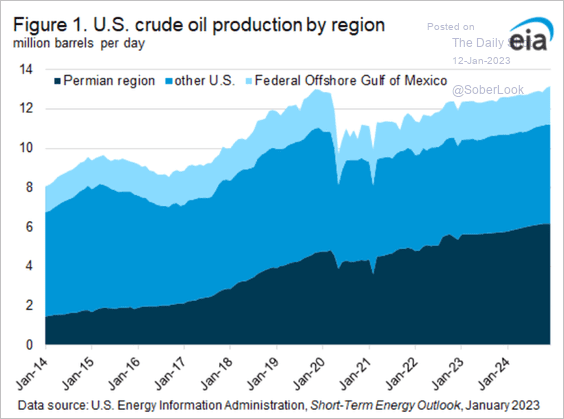 Source: @EIAgov
——————–
4. Russian crude is trading near the cap of $60/bbl.
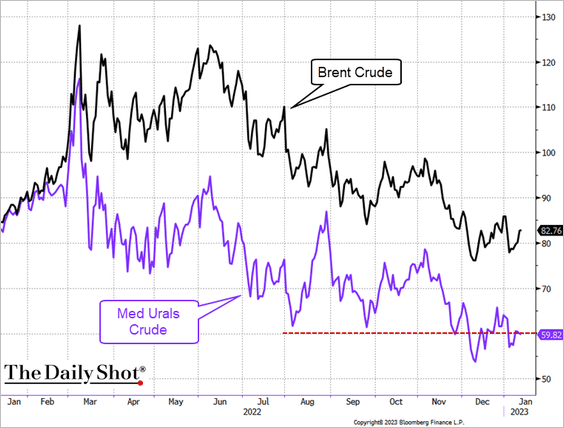 Source: @TheTerminal, Bloomberg Finance L.P.
 Source: Reuters Read full article
——————–
5. Consumption of petroleum products is heading lower.
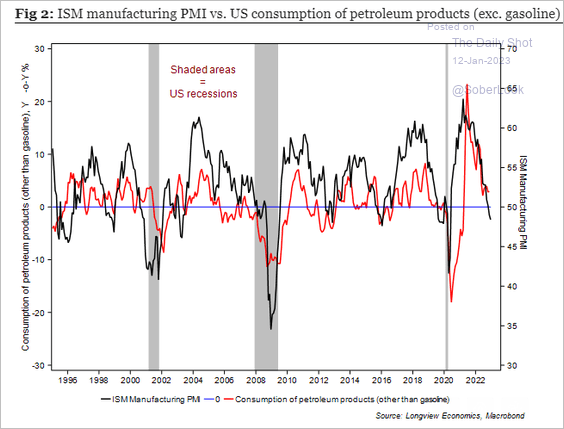 Source: Longview Economics
But higher demand for petrochemicals should offset that trend.
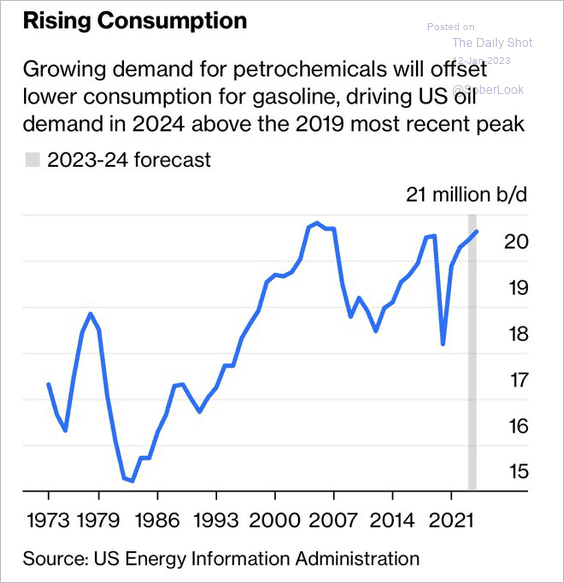 Source: @JavierBlas, @opinion, h/t @jessefelder Read full article
——————–
6. California’s natural gas prices remain elevated, even as NYMEX natural gas futures decline.
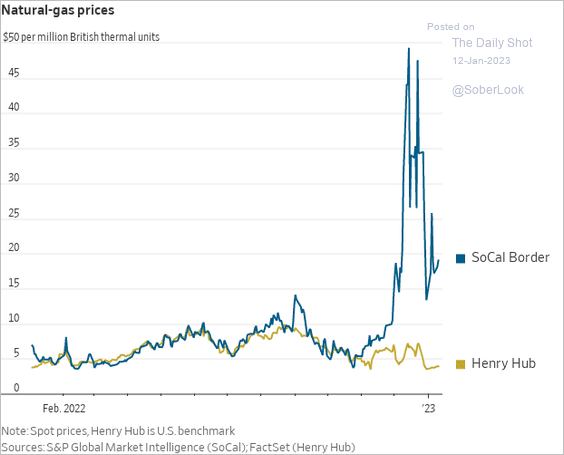 Source: @WSJ Read full article
Back to Index
Equities
1. All eyes are on the CPI report. Here is the S&P 500 implied vol term structure.
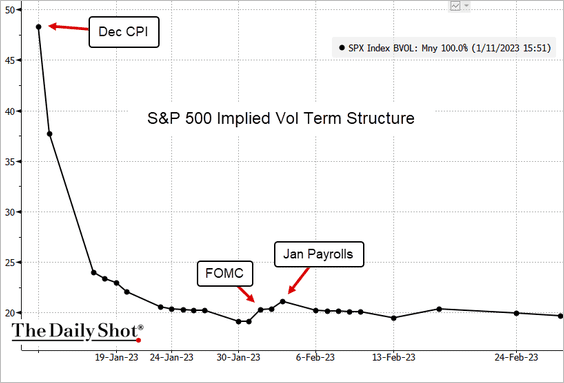 Source: @TheTerminal, Bloomberg Finance L.P.
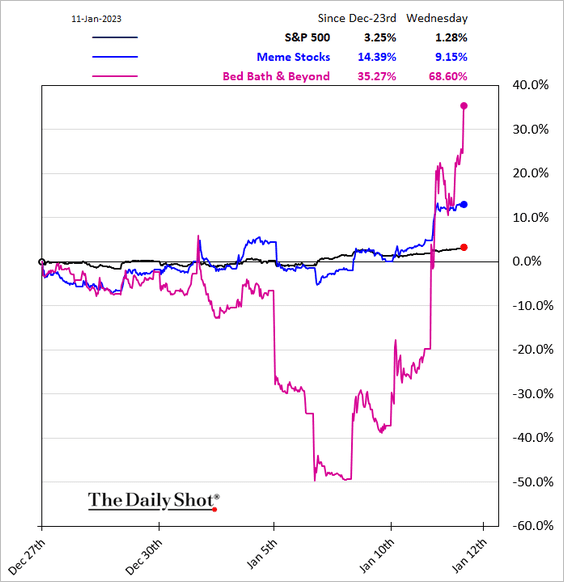
2. Guess who is back …
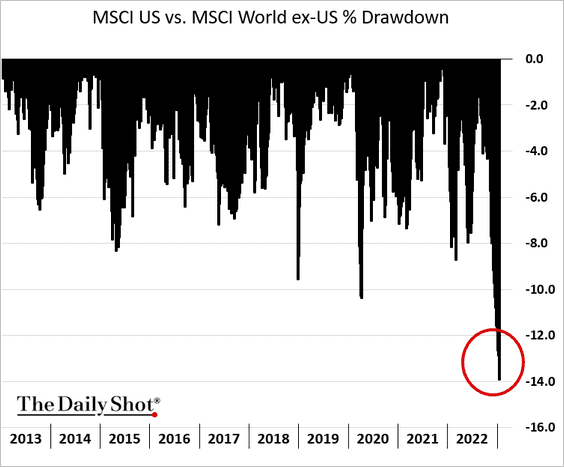
3. US stocks have sharply underperformed global peers in recent days.
4. Small-cap stocks are holding support relative to the S&P 500.
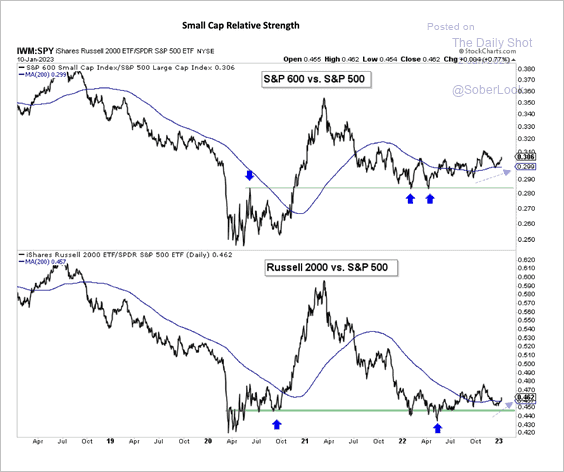 Source: Aazan Habib, Paradigm Capital
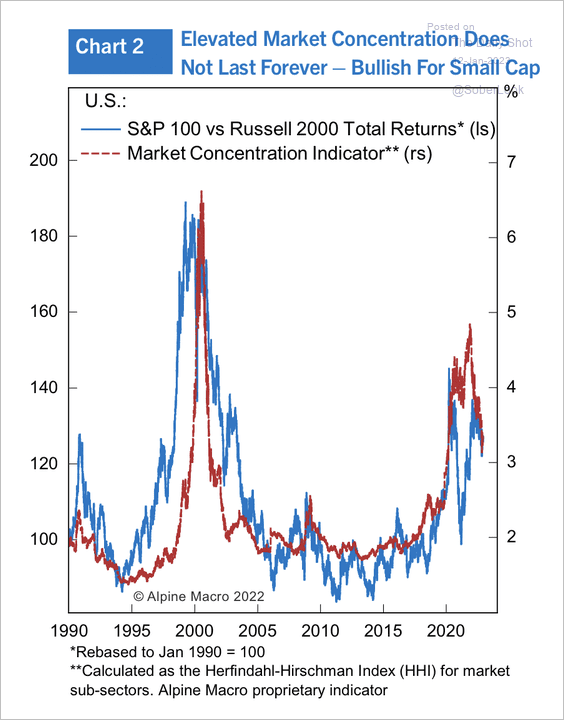
• Small caps tend to bottom during recessions and after peak market concentration, with value outperforming (2 charts).
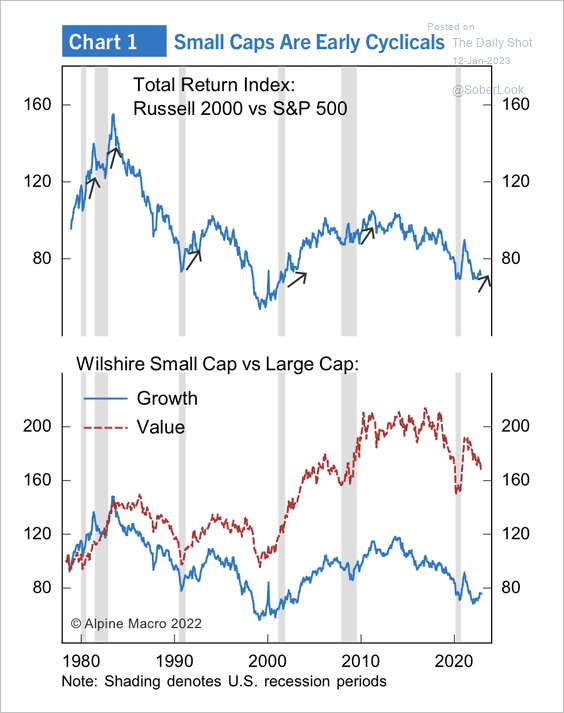 Source: Alpine Macro
 Source: Yardeni Research
• US small-caps appear attractively valued, but depressed small business sentiment poses downside risks.
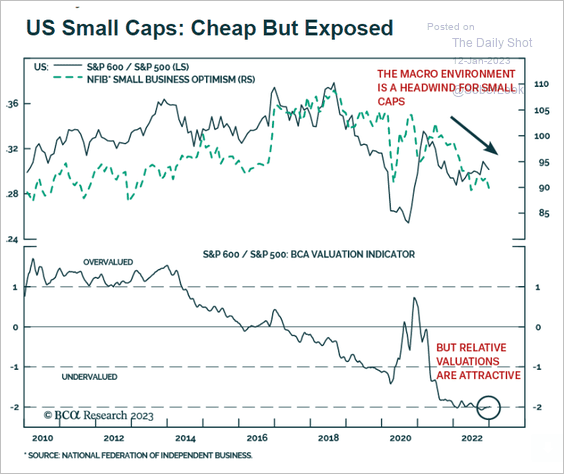 Source: BCA Research
——————–
5. The S&P 500 typically does well after a 25% decline.
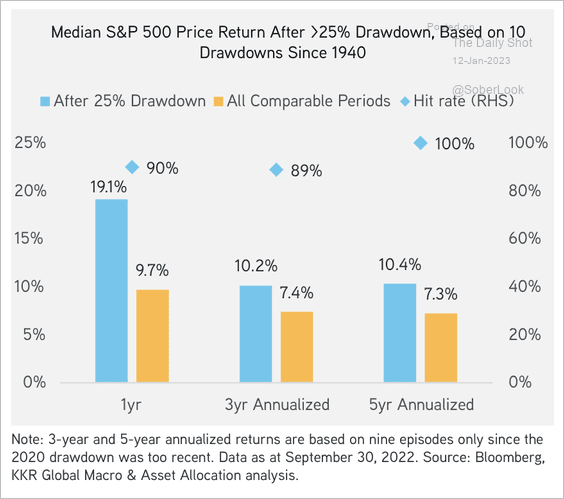 Source: KKR
6. Cautious equity positioning tends to support share prices during the earnings season.
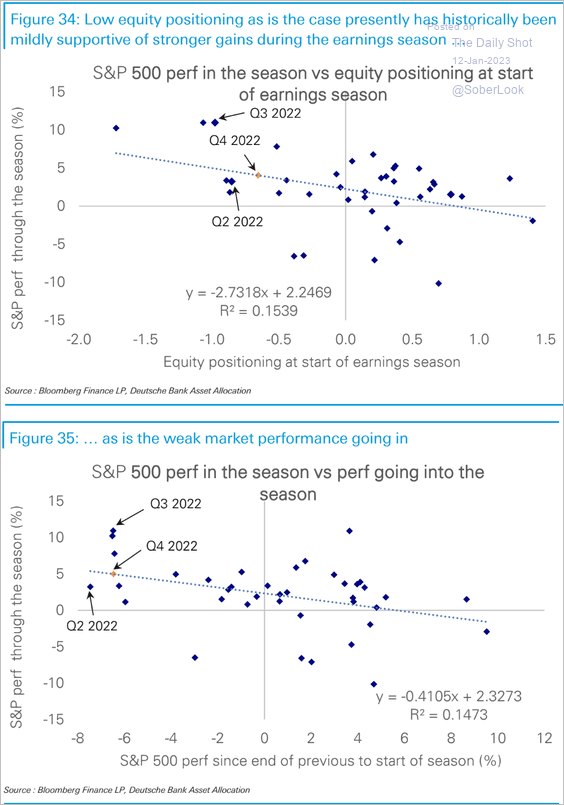 Source: Deutsche Bank Research
Back to Index
Alternatives
1. Let’s start with global private equity activity over time (2 charts).
![]() Source: S&P Global Market Intelligence
Source: S&P Global Market Intelligence
![]() Source: S&P Global Market Intelligence
Source: S&P Global Market Intelligence
2. US venture capital deal value declined much more than deal counts last year.
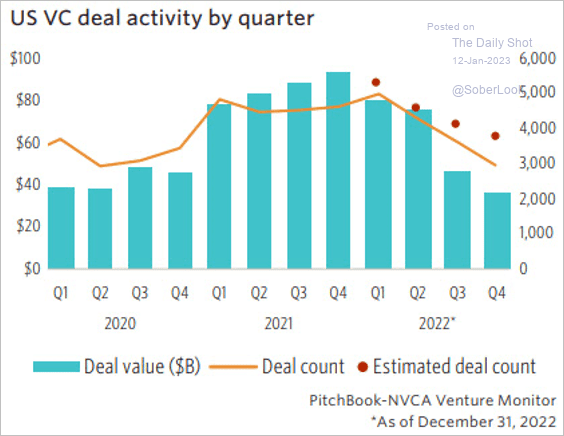 Source: PitchBook
3. Next, we have some data on PE fund launches.
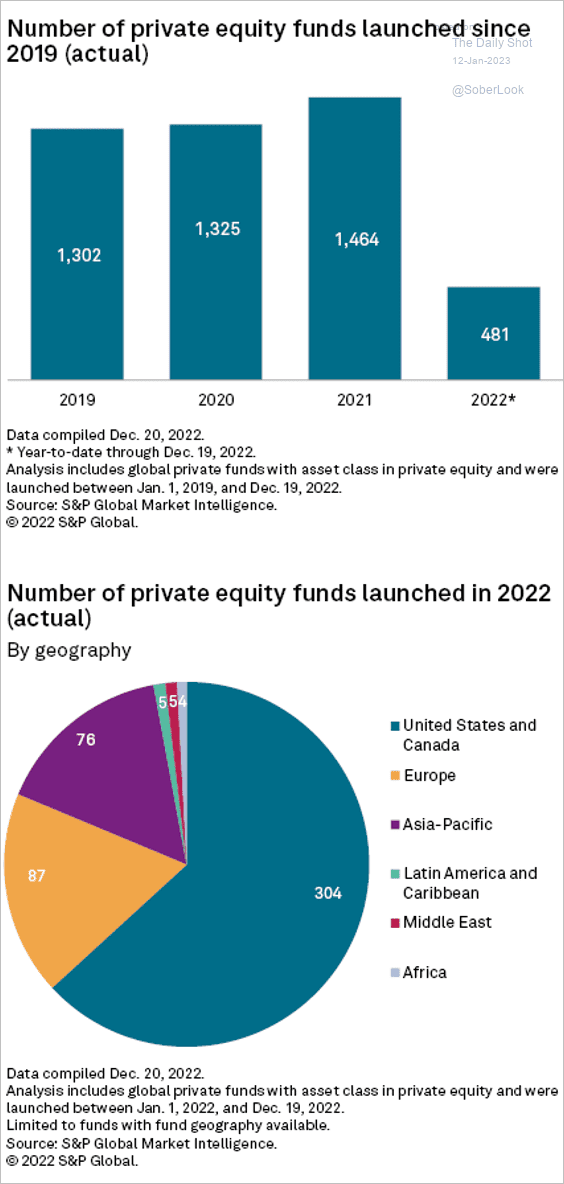 Source: S&P Global Market Intelligence
4. This chart shows PE portfolio companies that filed for bankruptcy by year.
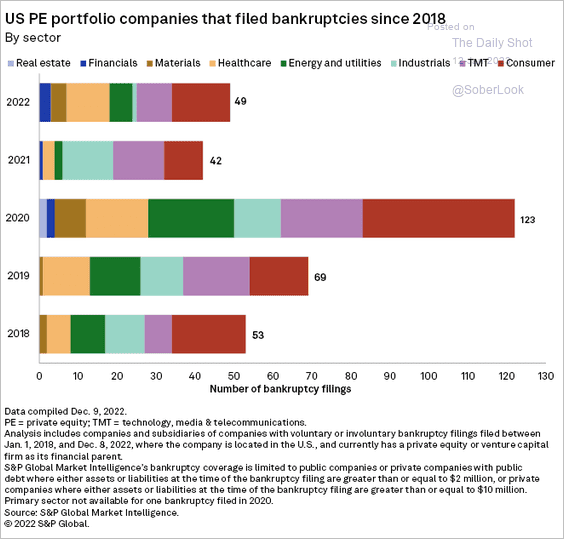 Source: S&P Global Market Intelligence
Back to Index
Credit
1. Historically, high-yield bonds have recovered after reaching current price levels.
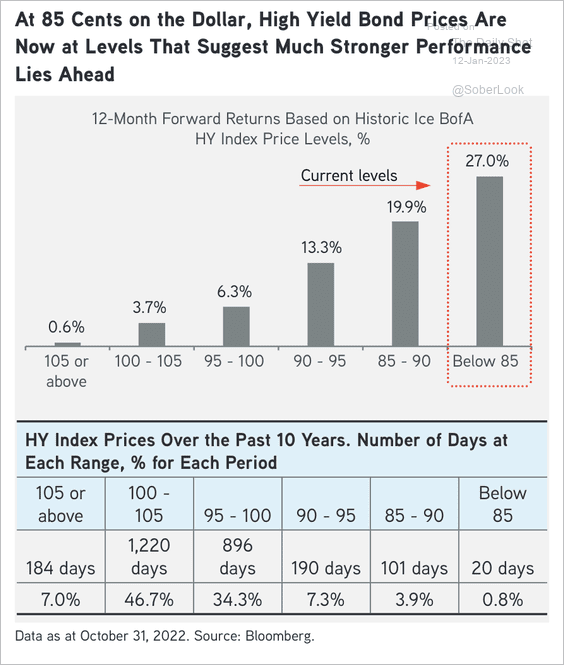 Source: KKR
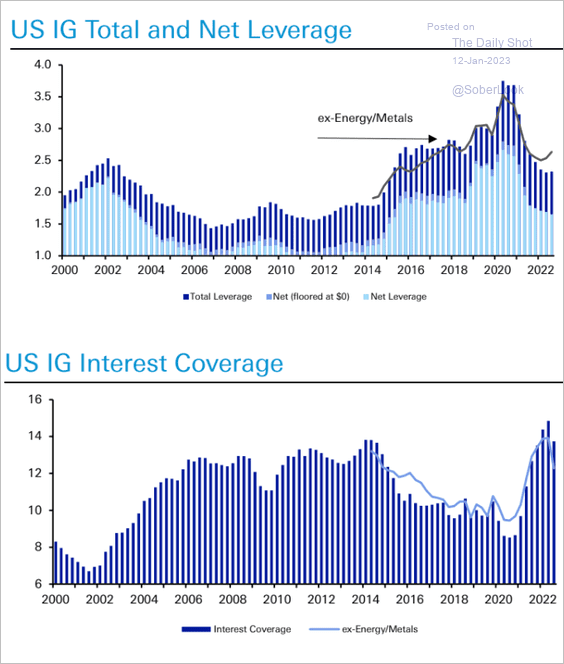
2. Next, we have corporate credit leverage and interest coverage over time.
• Investment grade:
 Source: Deutsche Bank Research
• High yield:
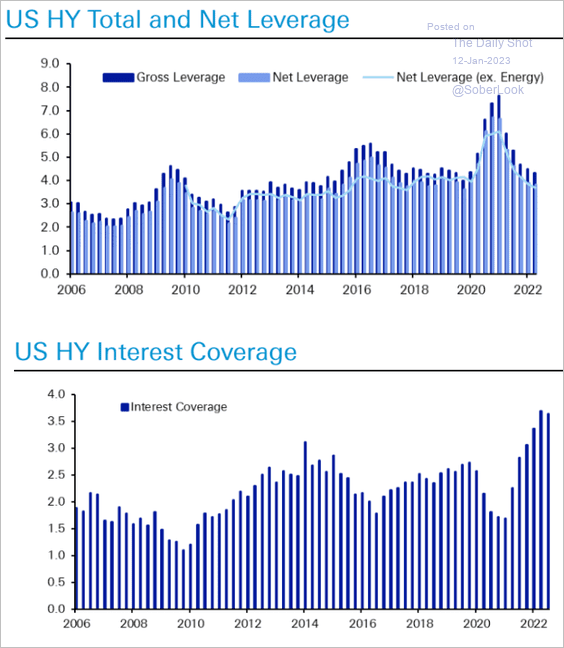 Source: Deutsche Bank Research
Back to Index
Global Develoopments
1. Successive declines in a 60% stock/40% bond portfolio are rare.
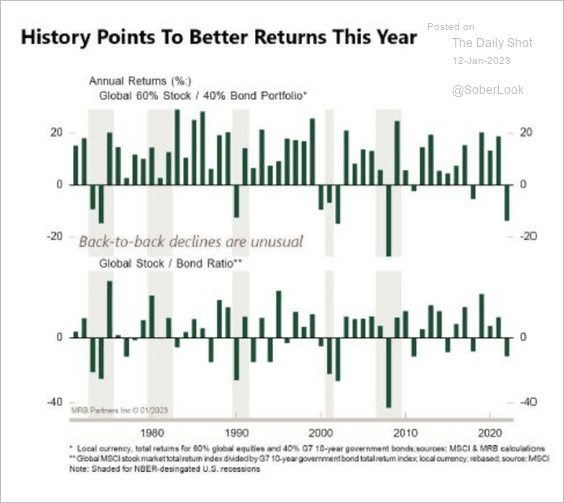 Source: MRB Partners
2. This chart shows market expectations for terminal (peak) rates in select economies.
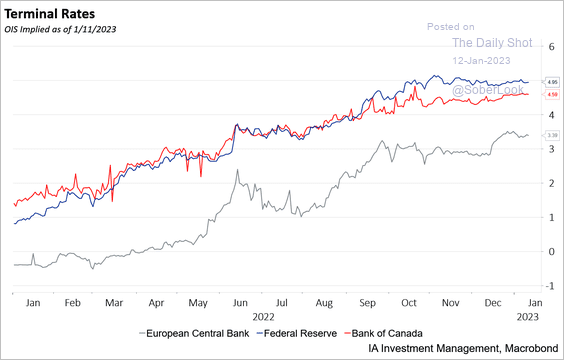 Source: Industrial Alliance Investment Management
3. Global inflation continues to slow.
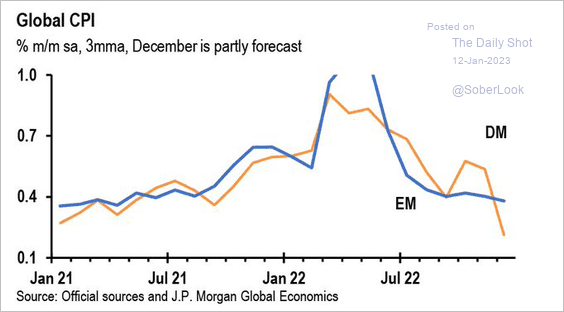 Source: JP Morgan Research; @carlquintanilla
4. Is the worst (almost) over for the global economy?
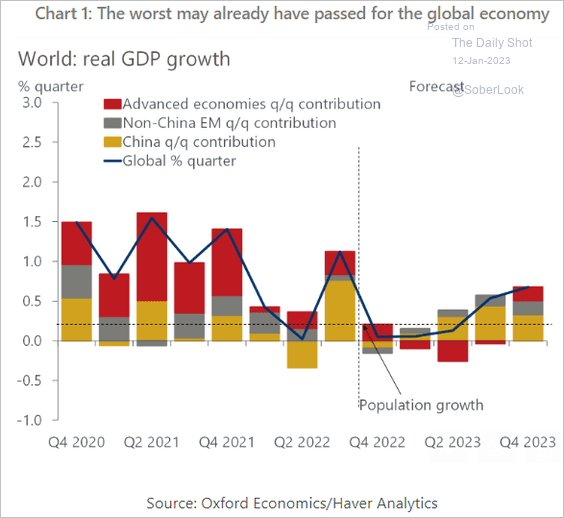 Source: Oxford Economics
——————–
Food for Thought
1. Oil production by country:
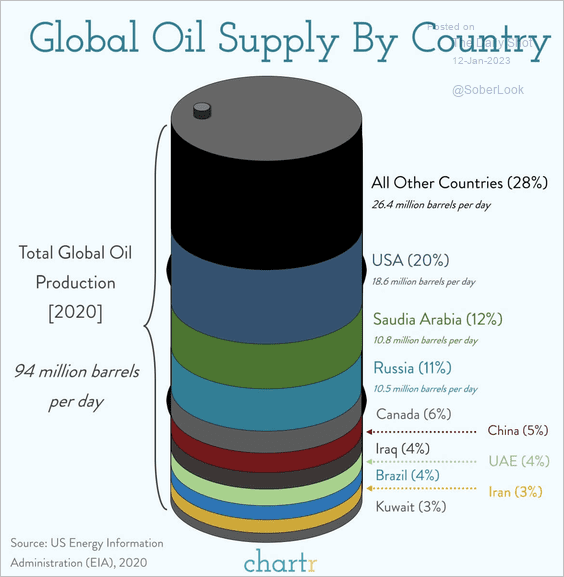 Source: @chartrdaily
2. Share of global goods exports by region:
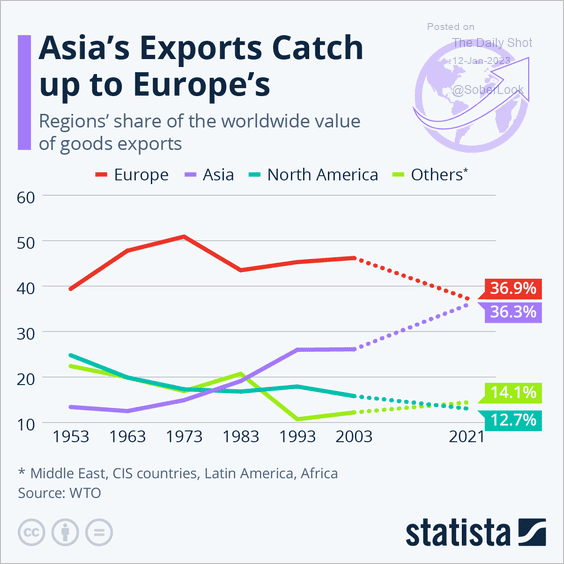 Source: Statista
3. Targeted advertising on social media:
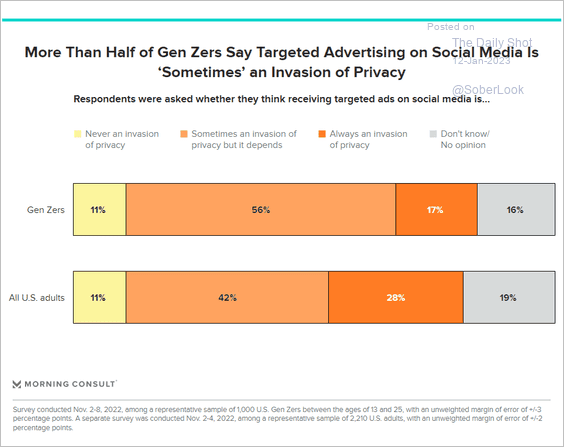 Source: Morning Consult Read full article
4. American Rescue Plan spending:
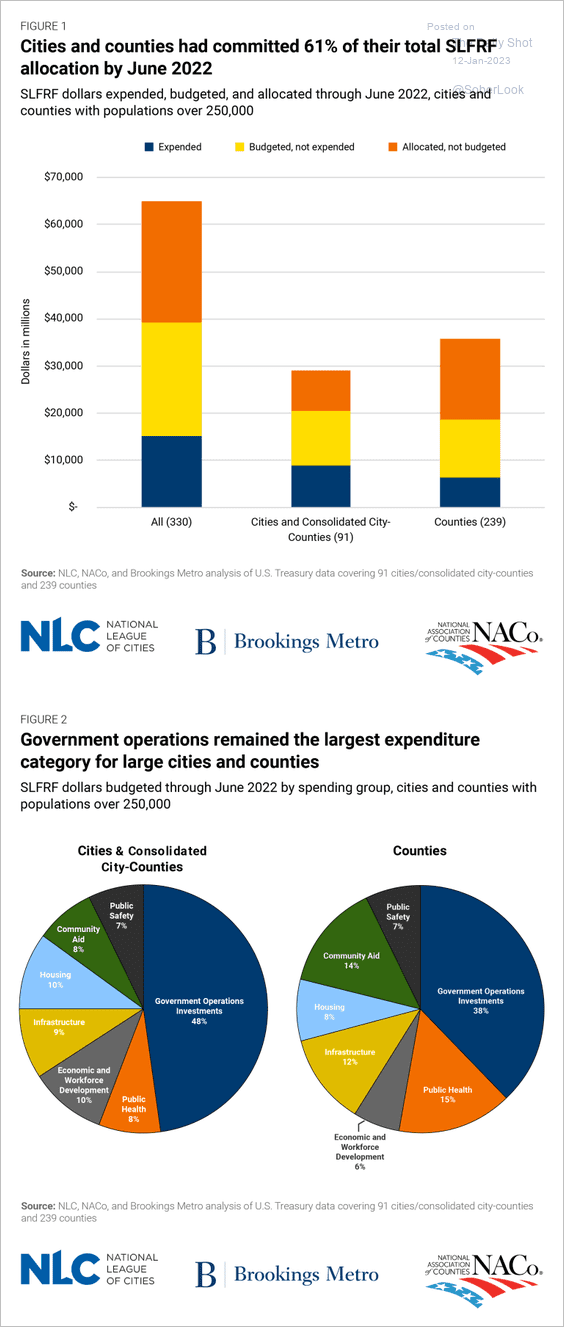 Source: Brookings Read full article
5. China’s and India’s military expenditures:
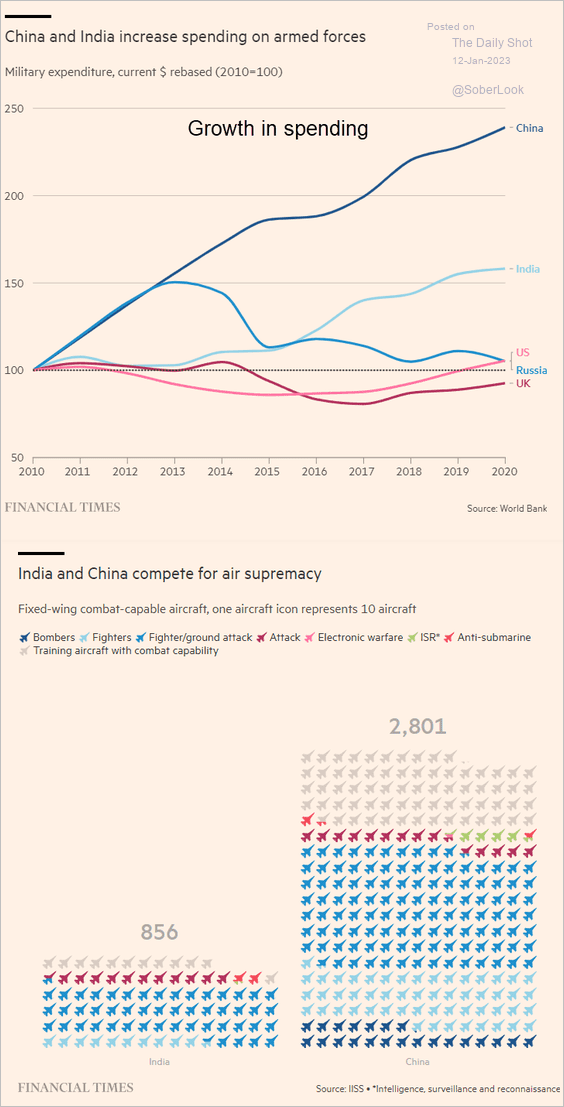 Source: @financialtimes Read full article
6. Deadliest protests:
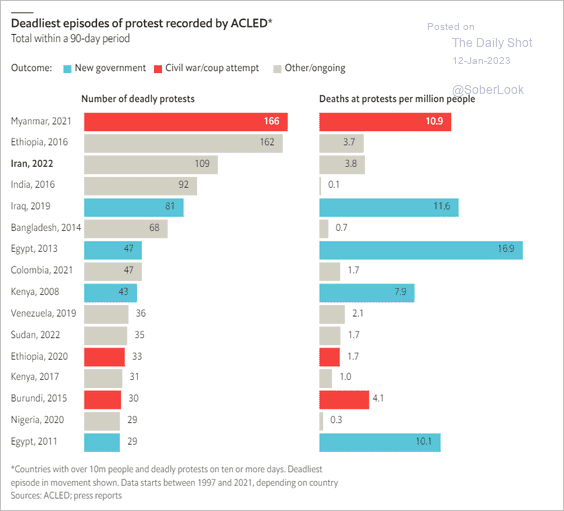 Source: The Economist Read full article
7. Dry January participation rates:
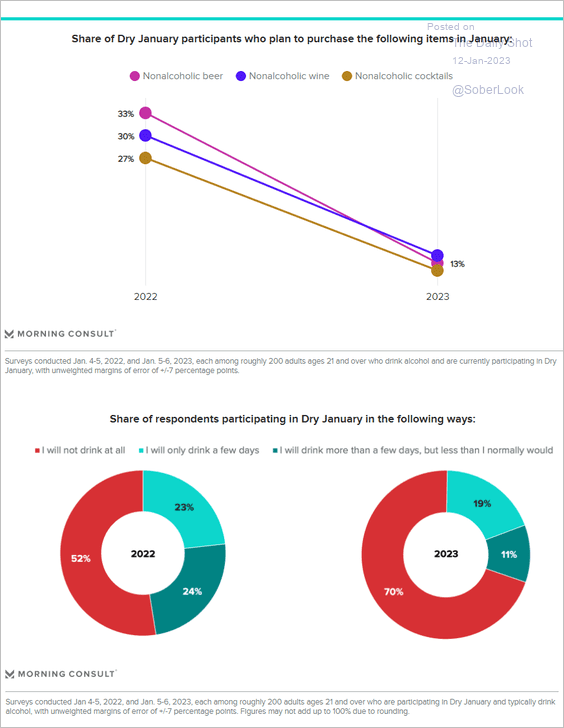 Source: Morning Consult Read full article
8. Life on earth measured by weight in carbon:
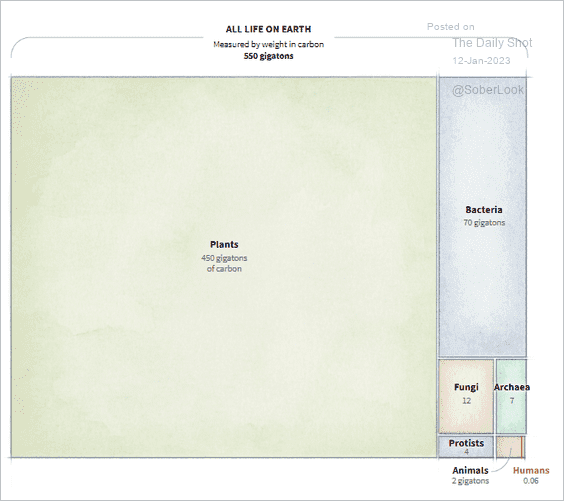 Source: Reuters Read full article
——————–
Back to Index