
The Daily Shot: 27-Jan-23
• The United States
• Canada
• The United Kingdom
• The Eurozone
• Europe
• Asia – Pacific
• Emerging Markets
• Energy
• Equities
• Rates
• Global Developments
• Food for Thought
The United States
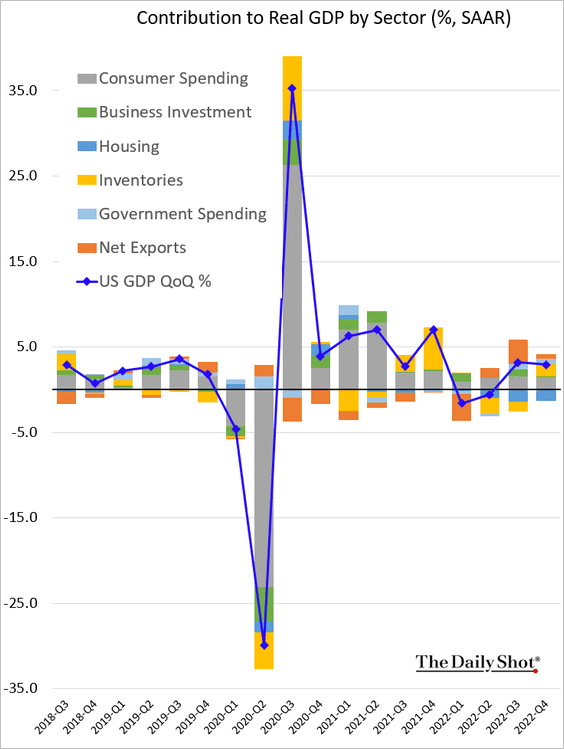
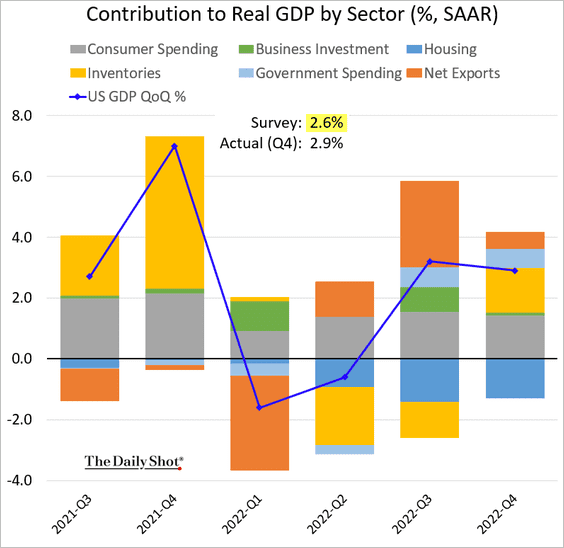
1. The Q4 GDP growth was stronger than expected.
This chart zooms in on the past six quarters.
• For now, growth remains above the post-GFC trend.
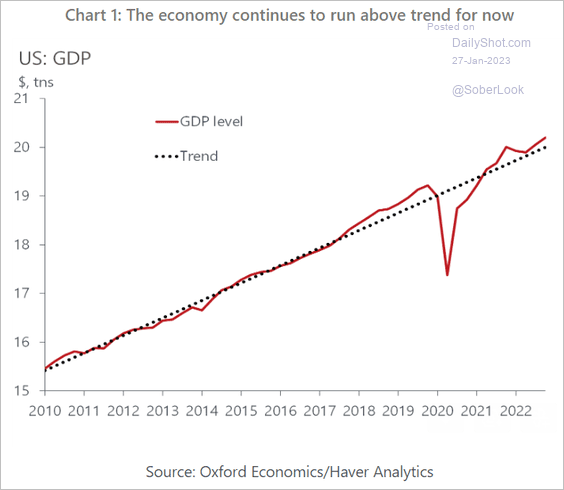 Source: Oxford Economics
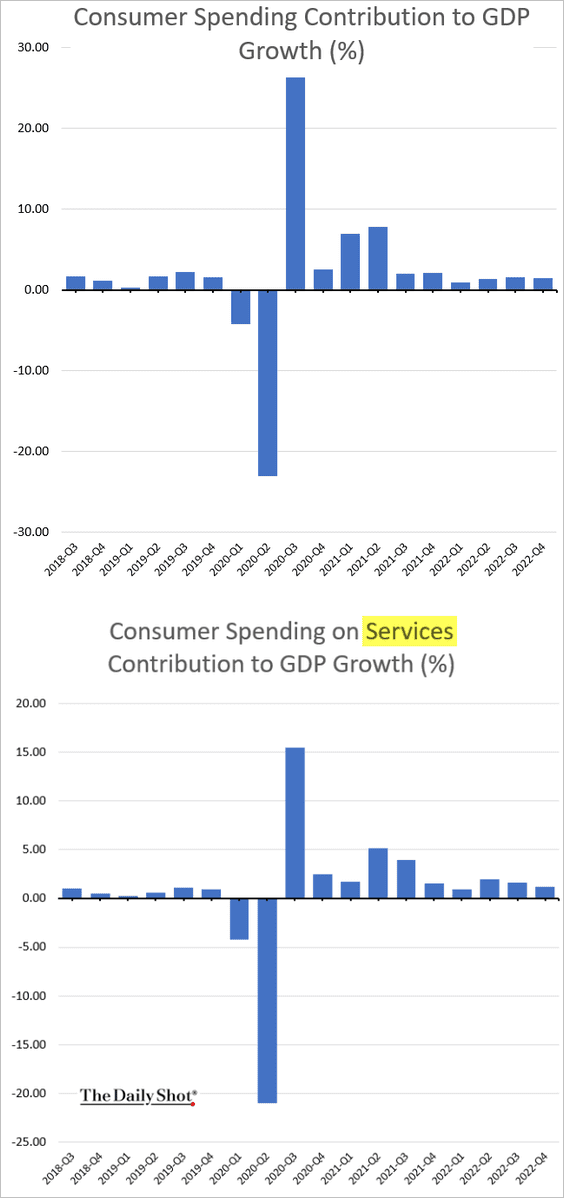
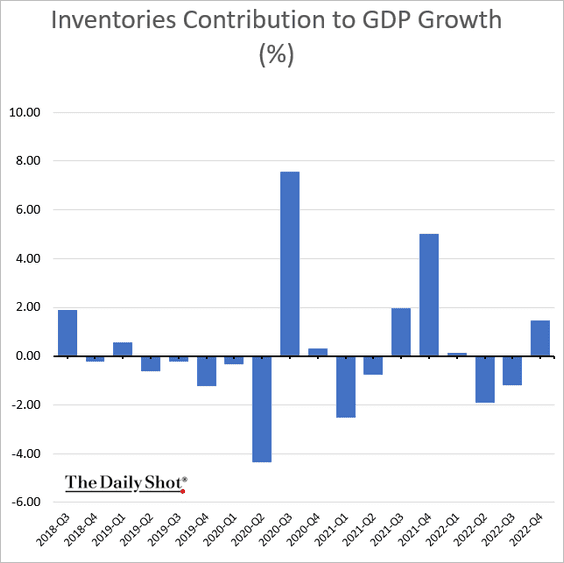
• Consumer spending continued to grow.
But the rest of the GDP gains were driven by inventories, trade, and government spending.
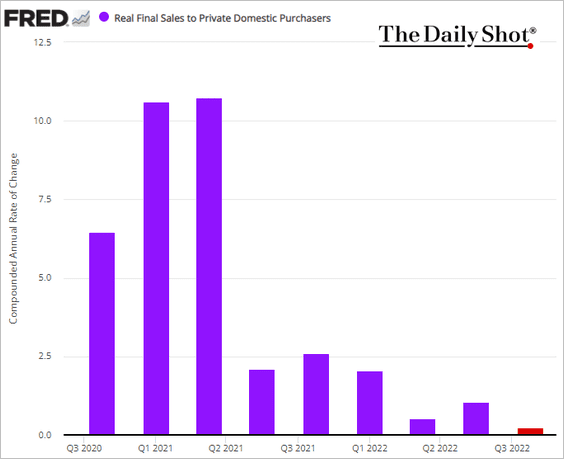
Real final sales to private domestic purchasers, also known as the “core GDP,” saw almost no growth.
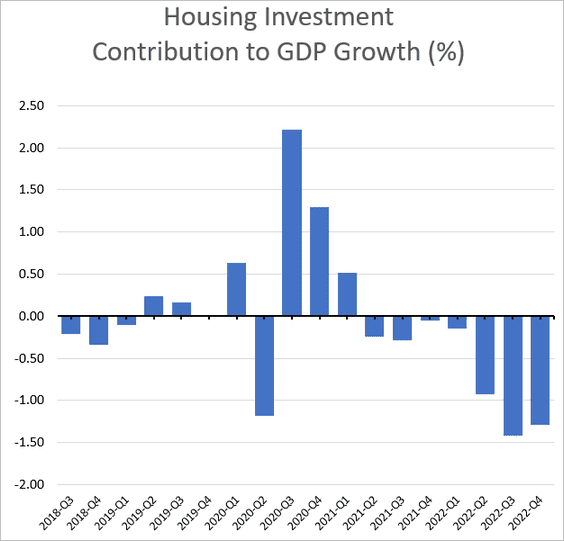
• Housing investment remains a substantial drag on the GDP.
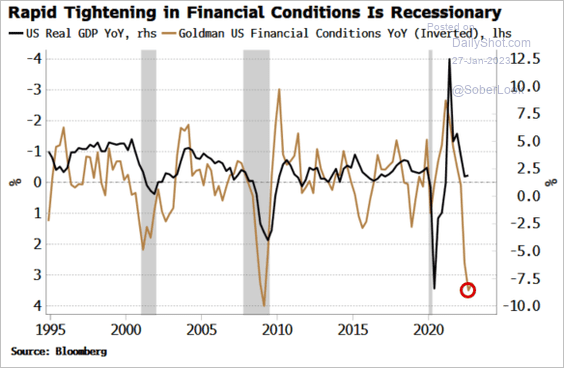
• Economic weakness in December and multiple leading indicators signal weaker US growth ahead.
– GDP vs. financial conditions:
 Source: Simon White, Bloomberg Markets Live Blog
– Business surveys:
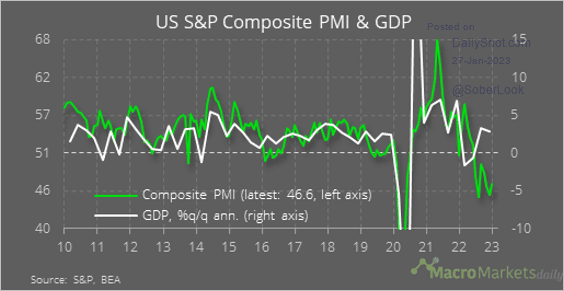 Source: @macro_daily
– Nordea’s GDP model:
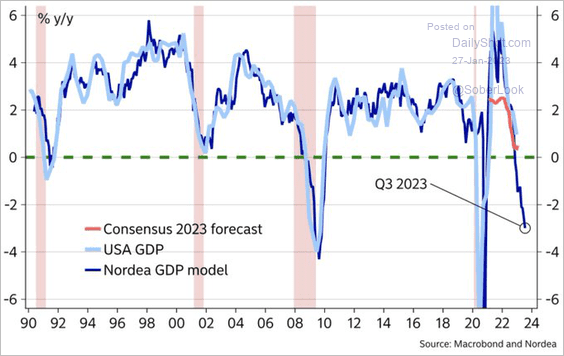 Source: @MikaelSarwe
——————–
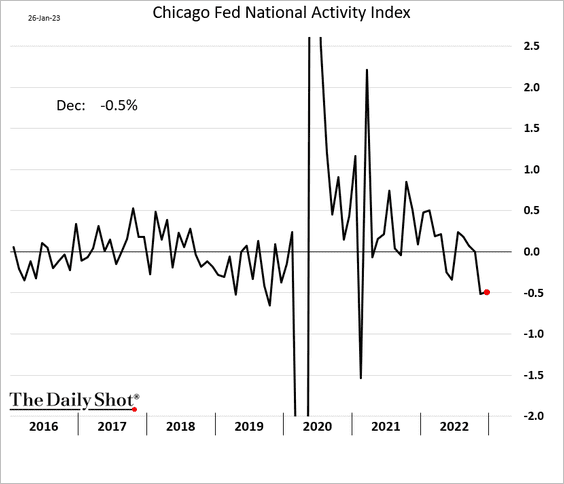
2. Here is the Chicago Fed’s national activity index.
3. Durable goods orders rose sharply in December, …
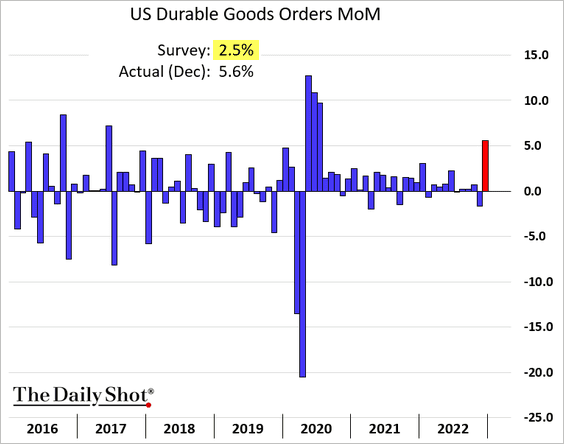
… driven by aircraft orders (such as Boeing’s 250 aircraft orders from United Airlines).
![]()
 Source: MarketWatch Read full article
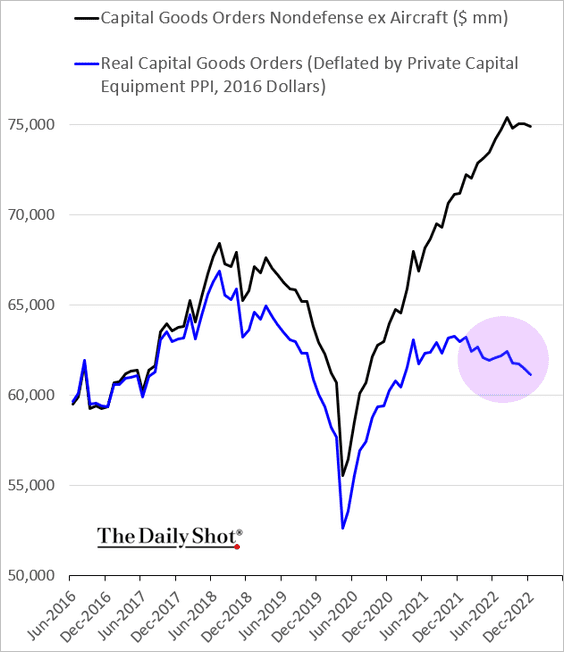
Capital goods orders and shipments, excluding aircraft, declined.
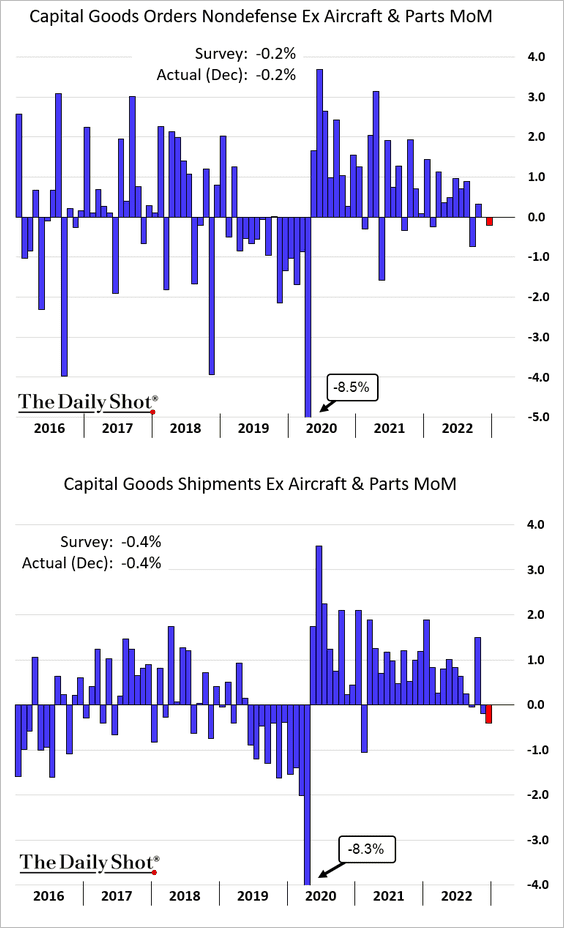
Real capital goods orders continue to sink, signaling slower business investment.
——————–
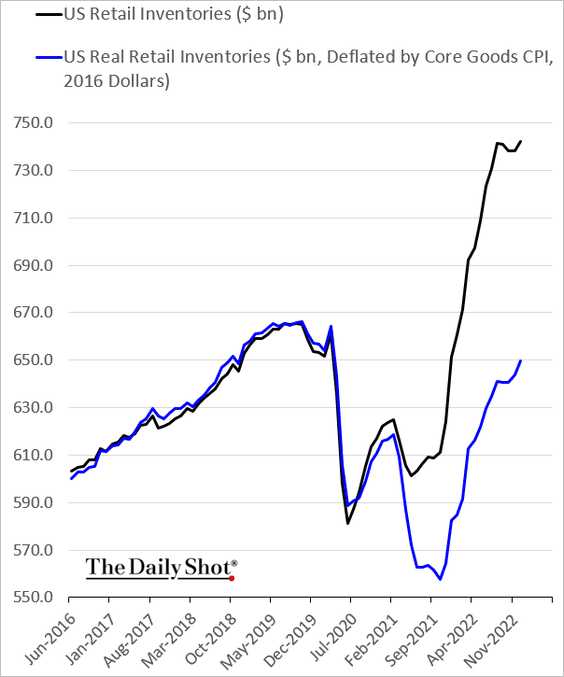
4. Retail inventories climbed in December.
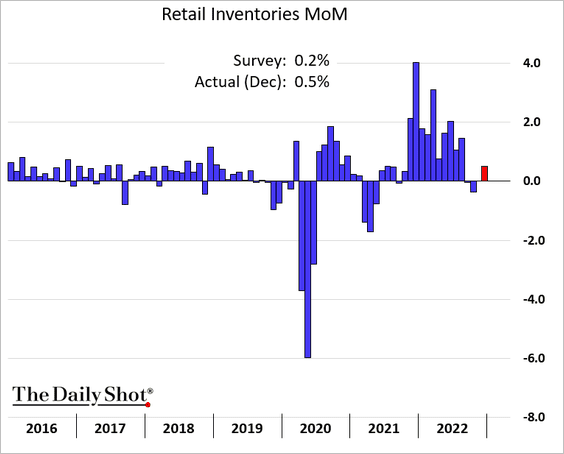
Real inventories are approaching pre-COVID levels.
——————–
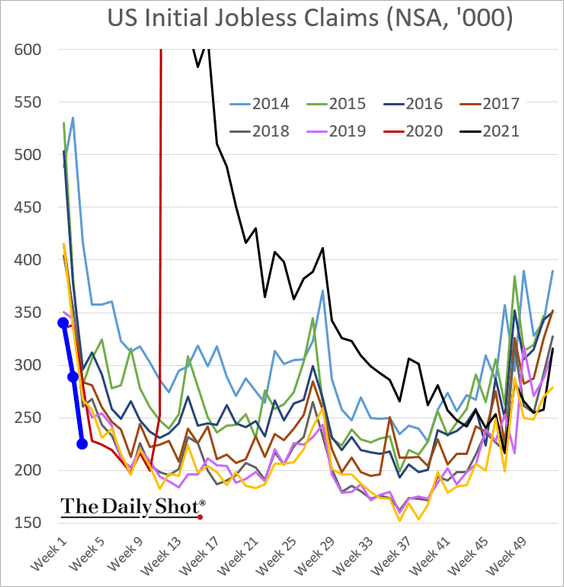
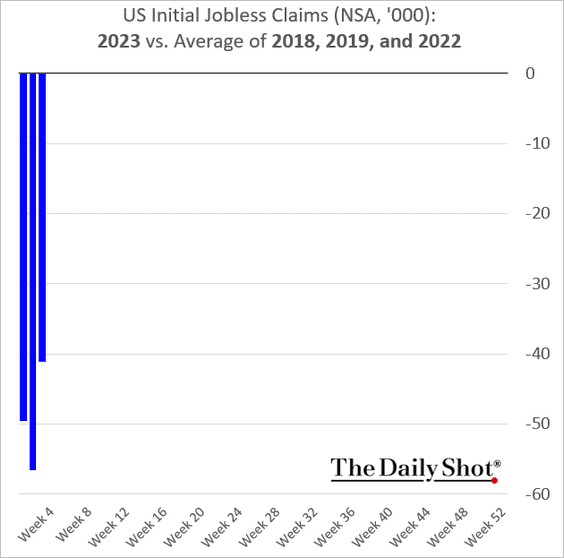
5. Initial jobless claims remain remarkably low.
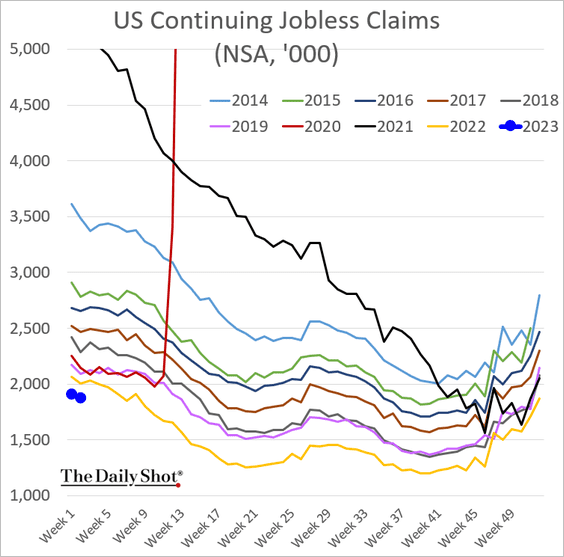
This chart shows continuing jobless claims.
• However, trend unemployment rates increased in 39 states in December (in most cases only slightly).
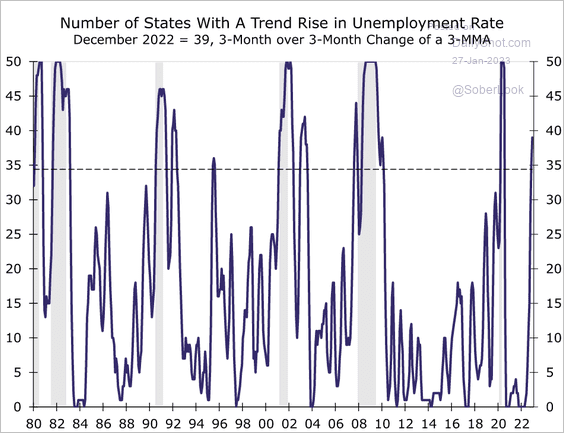 Source: Wells Fargo Securities
• Small businesses continue to hire.
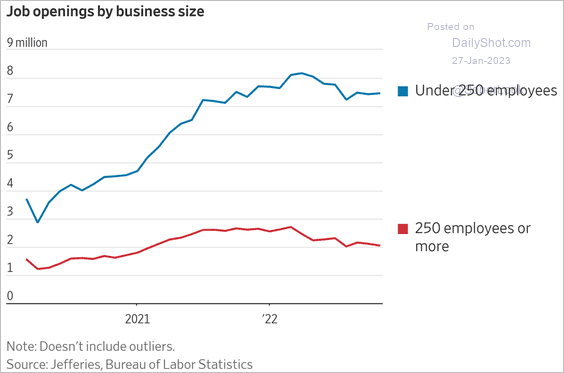 Source: @WSJ Read full article
——————–
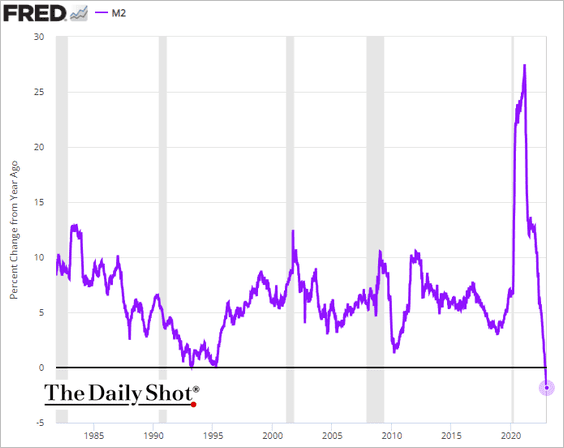
6. The broad money supply has not registered a year-over-year decline like this in decades, which should help cool inflation.
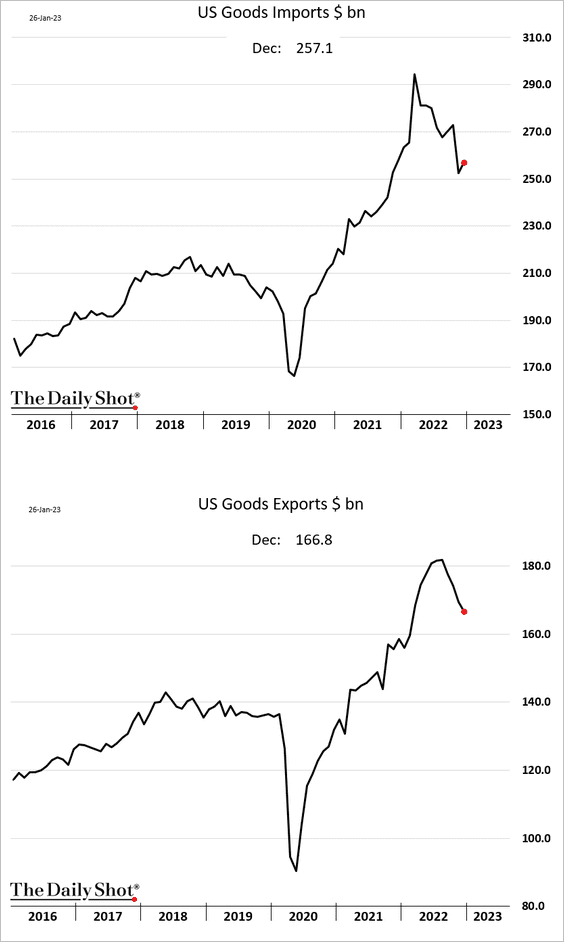
7. The trade gap in goods widened last month, …
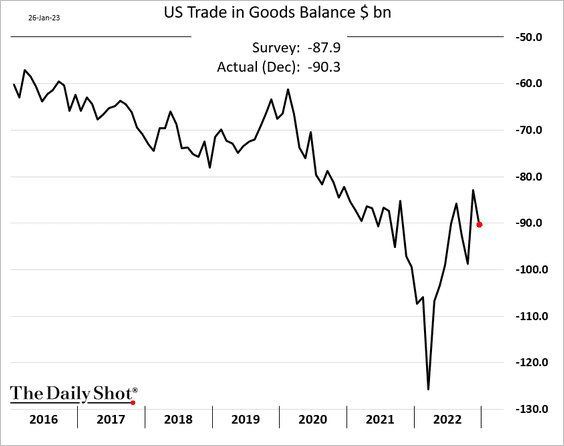
… as imports edged higher while exports continued to decrease.
——————–
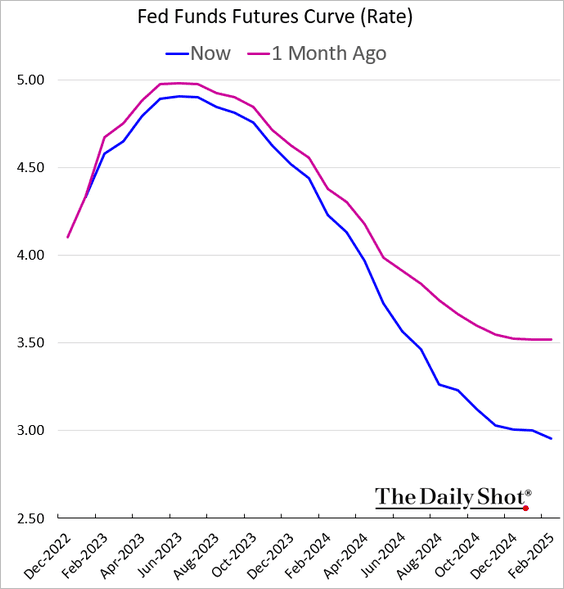
8. The market is pricing a faster pace of Fed rate cuts than it did a month ago.
Nomura projects an even steeper pace of rate cuts than the market, with the fed funds rate dipping below 75 bps by the end of next year.
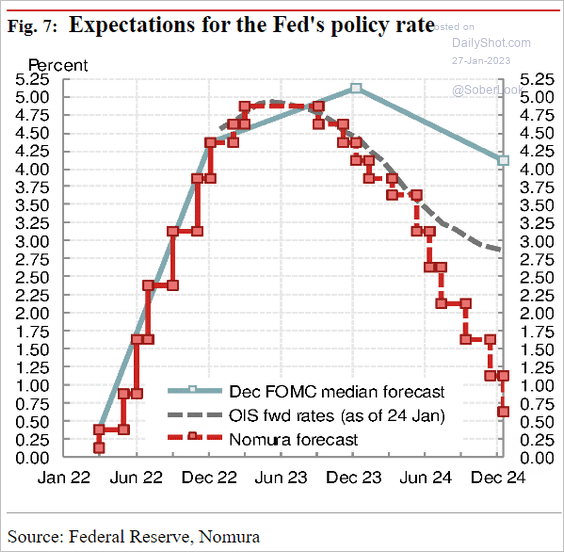 Source: Nomura Securities
By the way, Volcker’s Fed slashed interest rates during the recessions of 1979–1983.
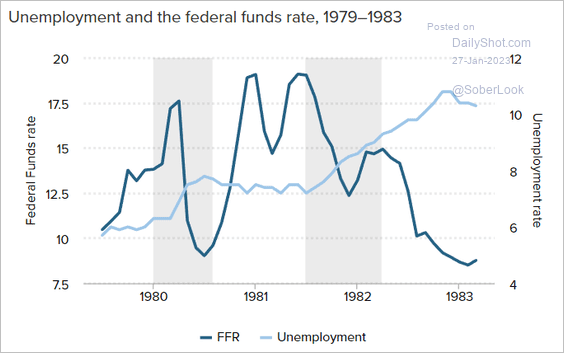 Source: EPI Read full article
Back to Index
Canada
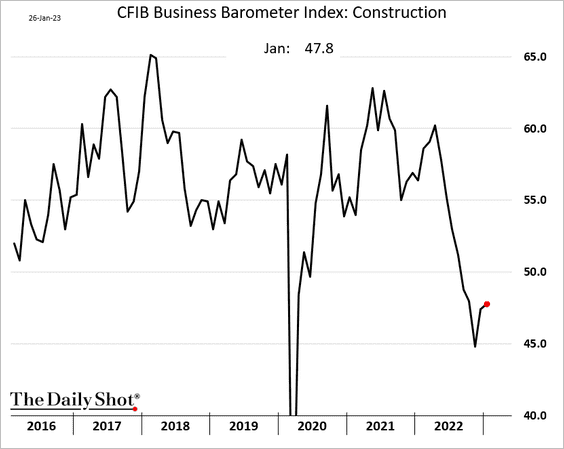
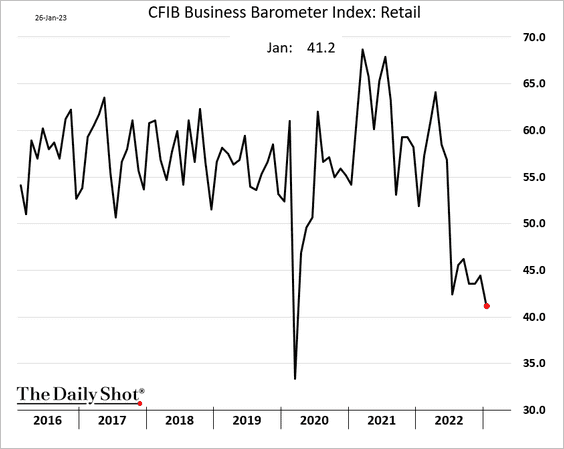
1. The CFIB medium/small-business index edged higher this month.
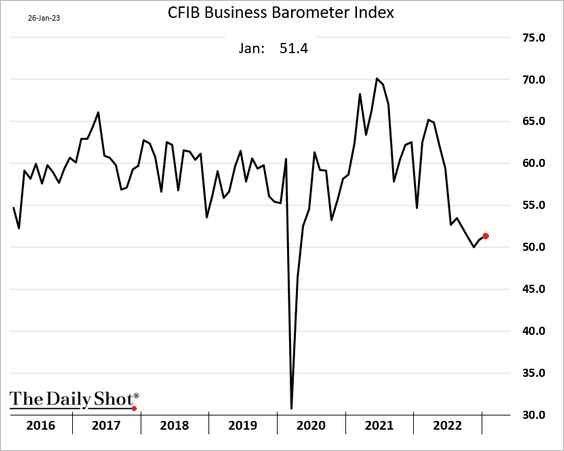
Underlying trends were mixed.
• Construction:
• Retail:
——————–
2. The housing market correction signals slower inflation ahead.
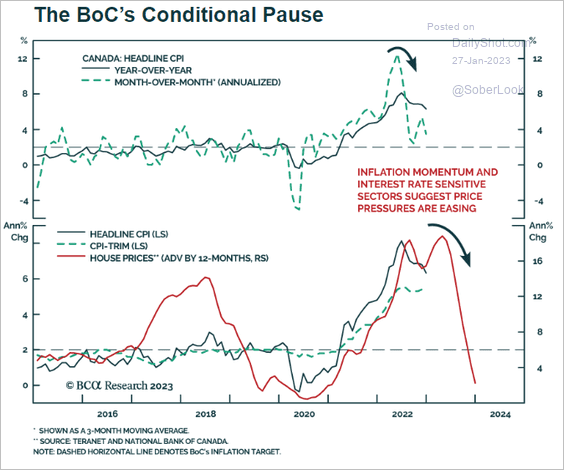 Source: BCA Research
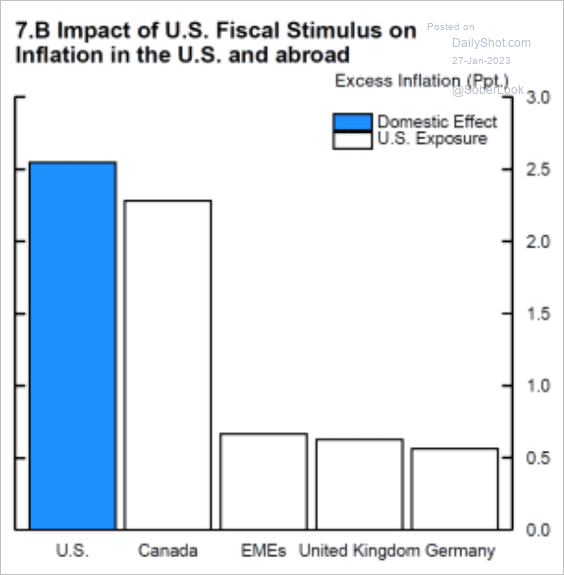
3. US fiscal stimulus boosted inflation in the US and Canada.
 Source: @NickTimiraos Read full article
4. The yield curve is heavily inverted, …
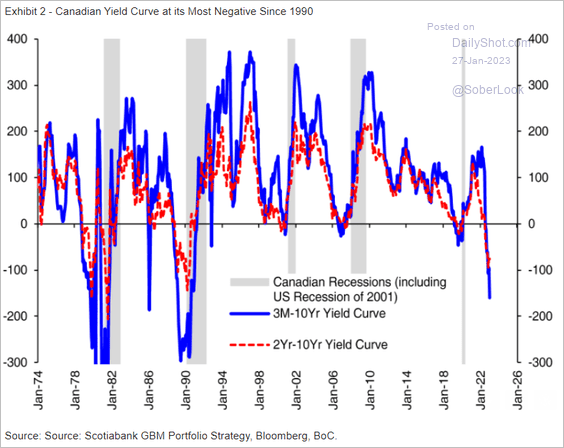 Source: Hugo Ste-Marie, Portfolio & Quantitative Strategy Global Equity Research, Scotia Capital
… similar to the US and Mexico.
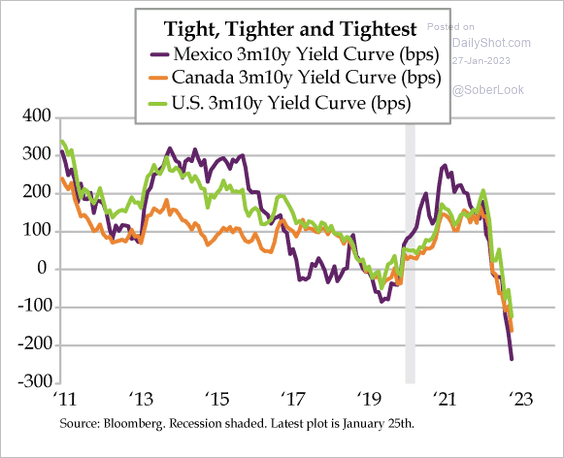 Source: Quill Intelligence
Back to Index
The United Kingdom
1. The CBI report showed weakness in retail sales this month. Retailers are also pessimistic about the future.
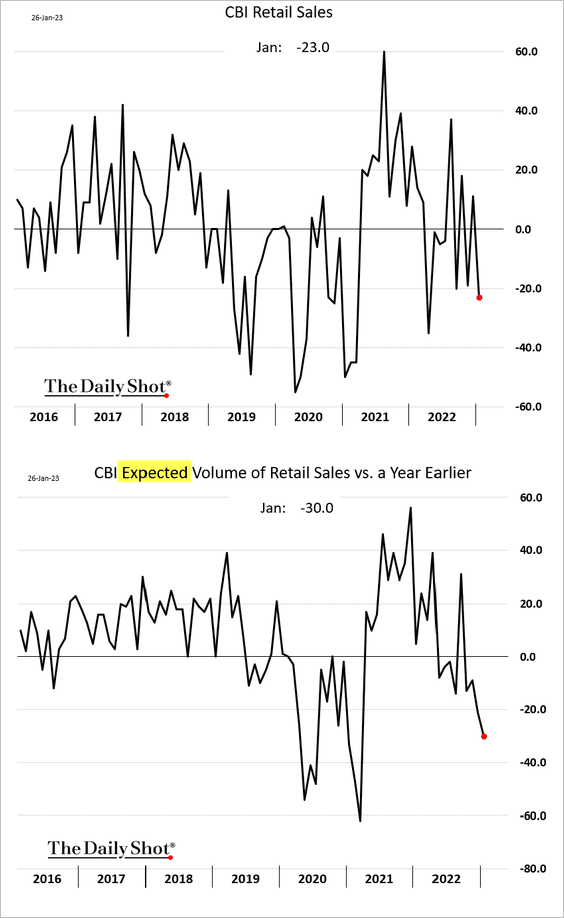
 Source: Reuters Read full article
The CBI report also signaled slower inflation ahead.
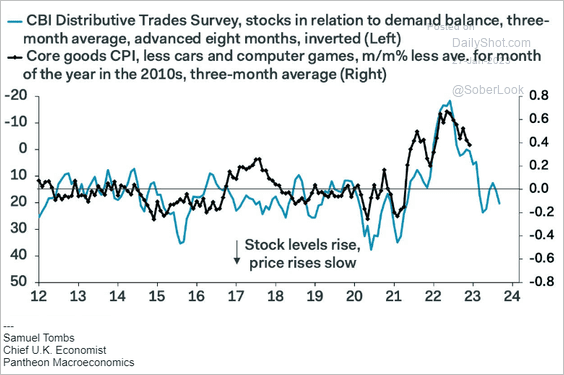 Source: Pantheon Macroeconomics
——————–
2. Insolvencies continue to rise.
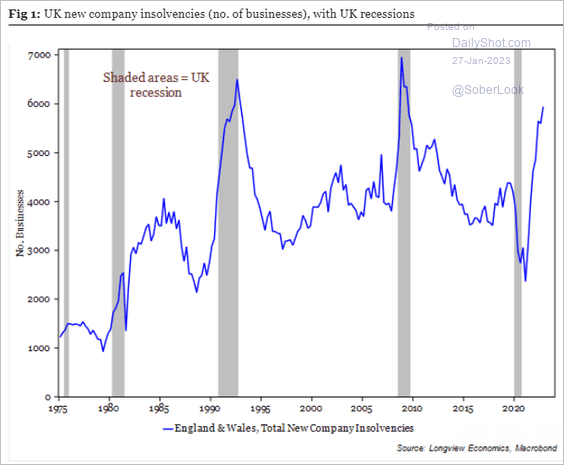 Source: Longview Economics
3. A record-high share of young people live with their parents.
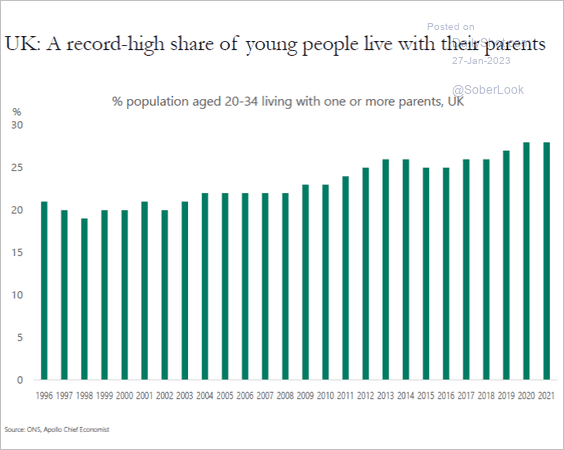 Source: Torsten Slok, Apollo
Back to Index
The Eurozone
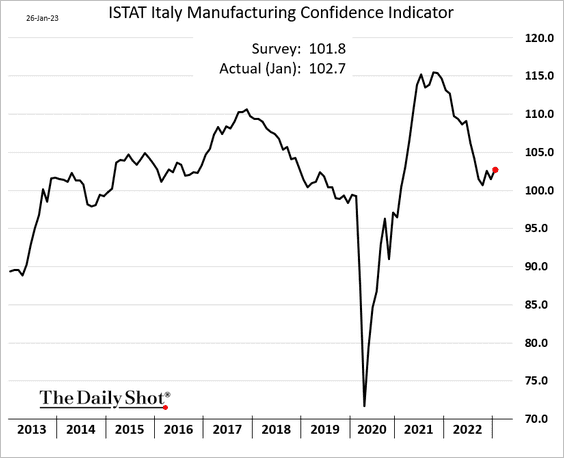
1. Italian consumer sentiment declined this month, …
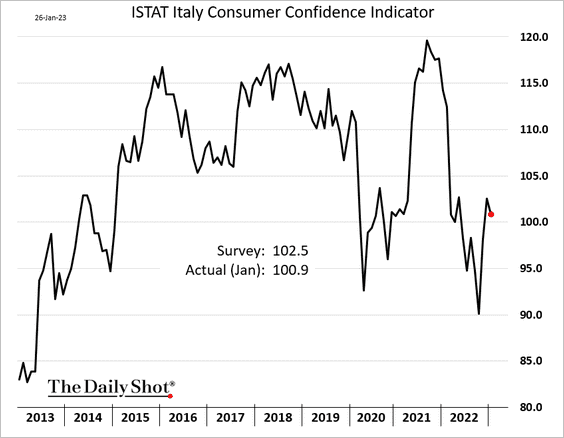
… but manufacturing confidence edged higher.
——————–
2. French building permits decreased sharply last year.
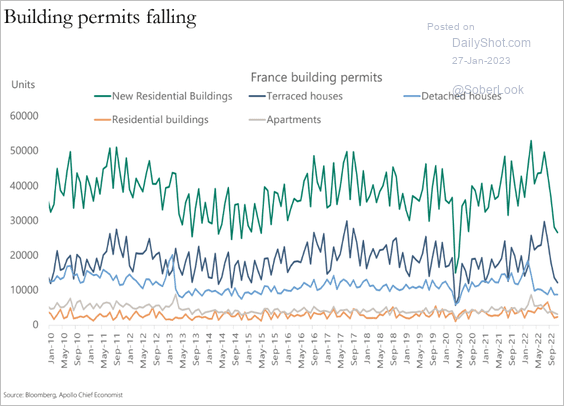 Source: Torsten Slok, Apollo
3. Mortgage rates in Spain are remarkably low.
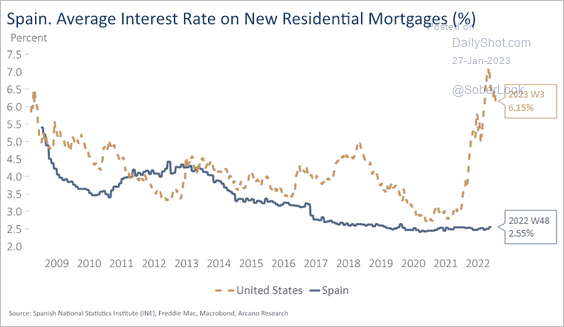 Source: Arcano Economics
4. At current trends, German gas storage could be 100% full by July.
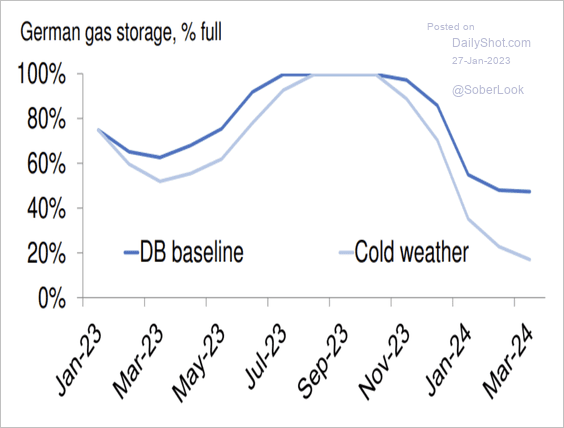 Source: Deutsche Bank Research
5. The market expects a 50 bps ECB rate hike next month.
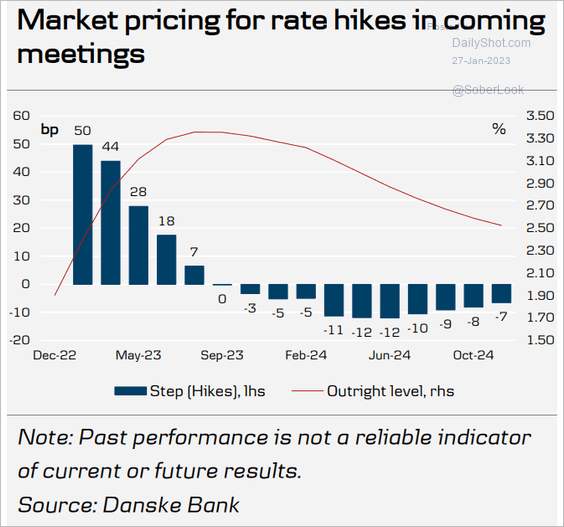 Source: Danske Bank
Core inflation is expected to remain elevated for some time.
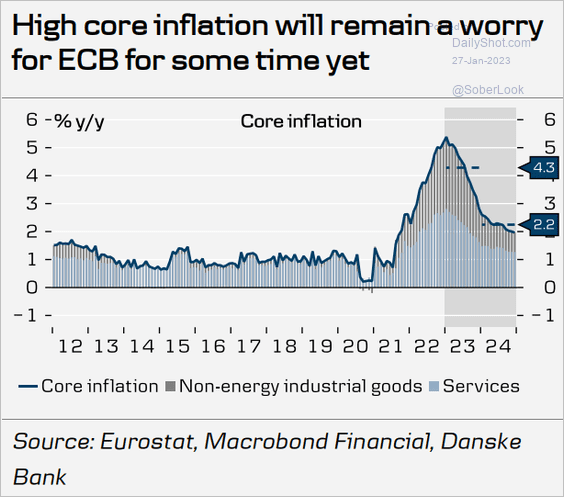 Source: Danske Bank
Back to Index
Europe
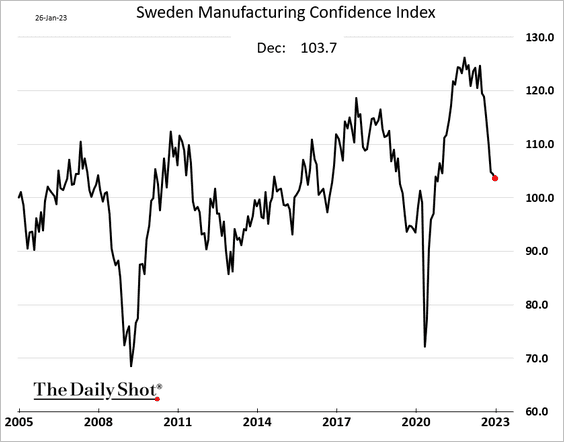
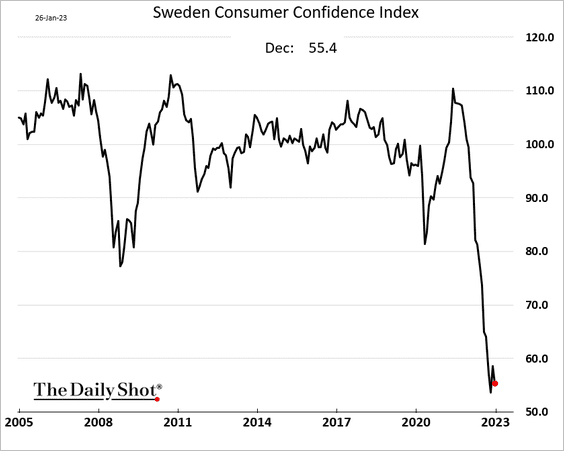
1. Sweden’s sentiment indicators worsened in December.
• Manufacturing confidence:
• Consumer confidence:
——————–
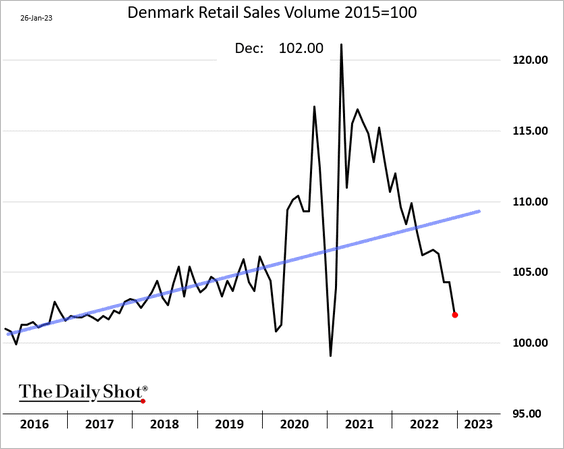
2. Denmark’s real retail sales continue to tumble.
3. Investors keep flooding into European stocks.
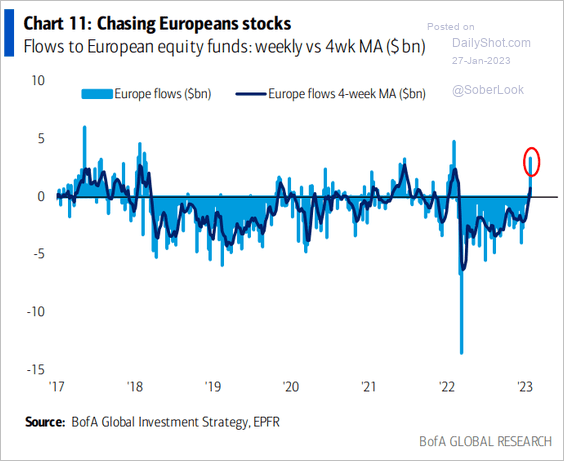 Source: BofA Global Research
4. It’s been the best January on record for European bond sales.
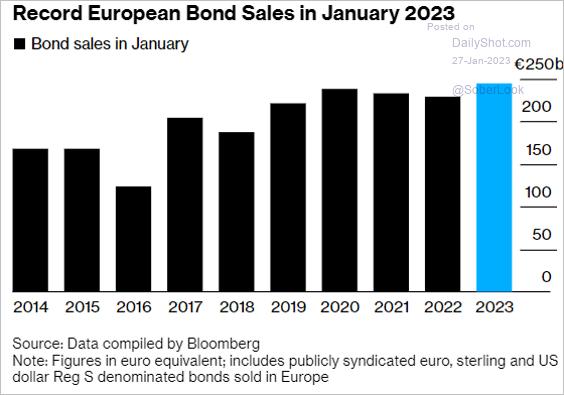 Source: @priazrocha, @markets Read full article
5. Here is the number of energy deals since January 2022 between EU member states and third countries.
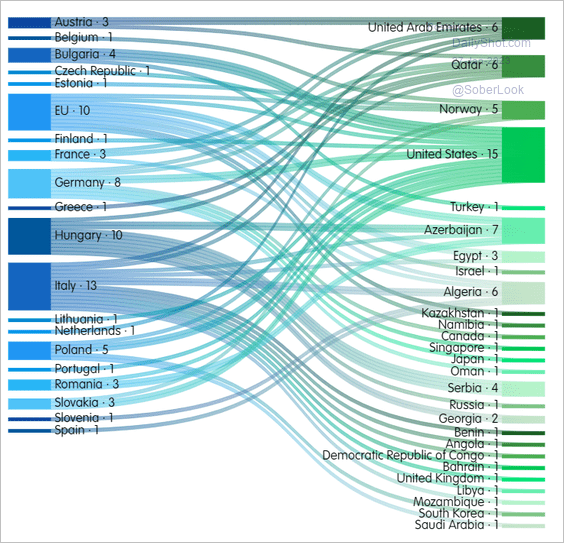 Source: European Council on Foreign Relations Read full article
6. Finally, we have some data on tourism in the EU.
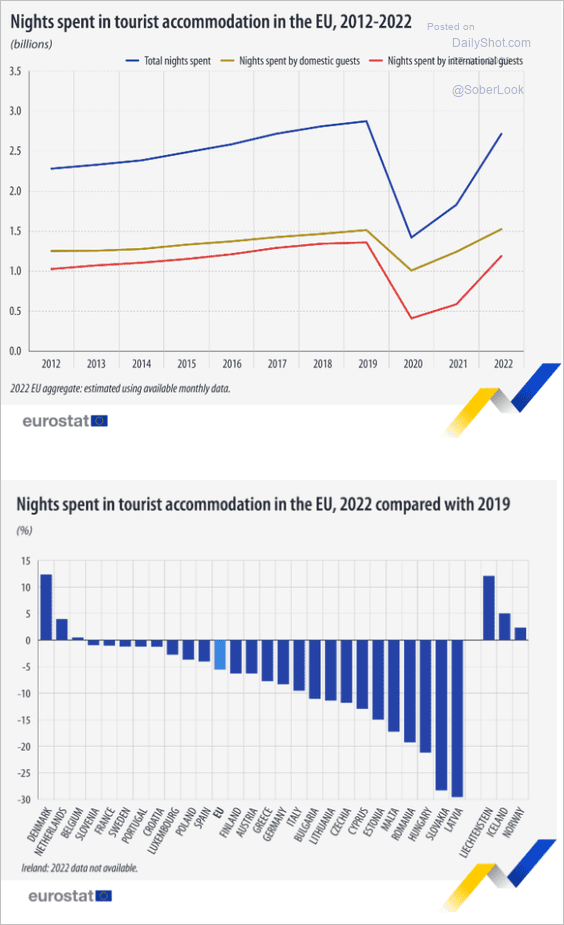 Source: European Commission Read full article
Back to Index
Asia – Pacific
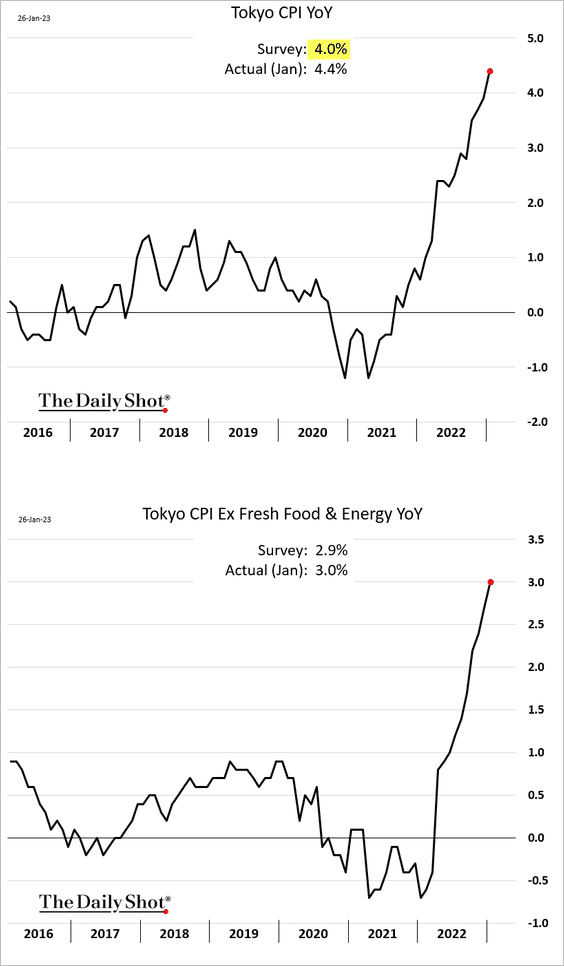
1. The Tokyo CPI continued to surge this month, exceeding forecasts. Will the BoJ keep ignoring this trend?
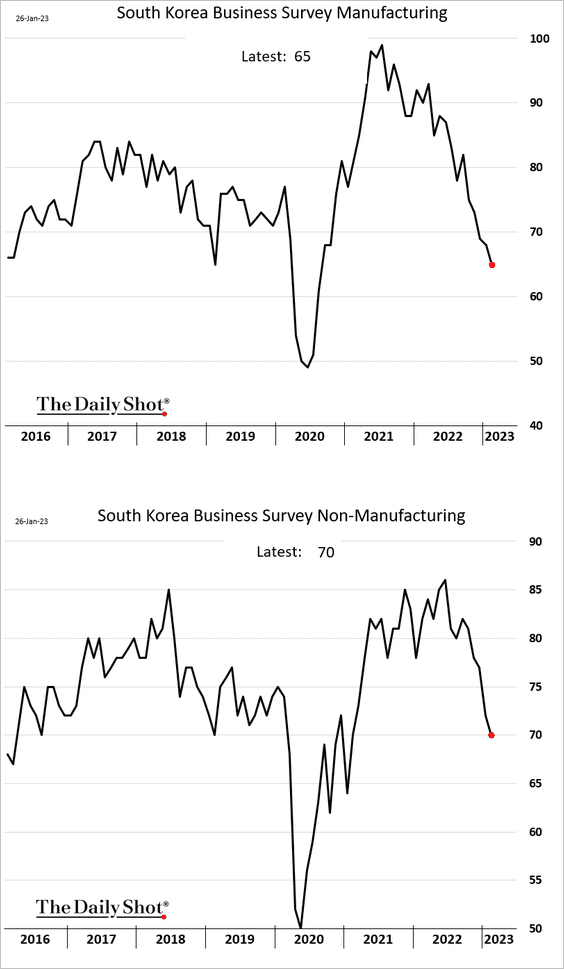
2. The BoK’s business surveys continue to show deteriorating sentiment.
Back to Index
Emerging Markets
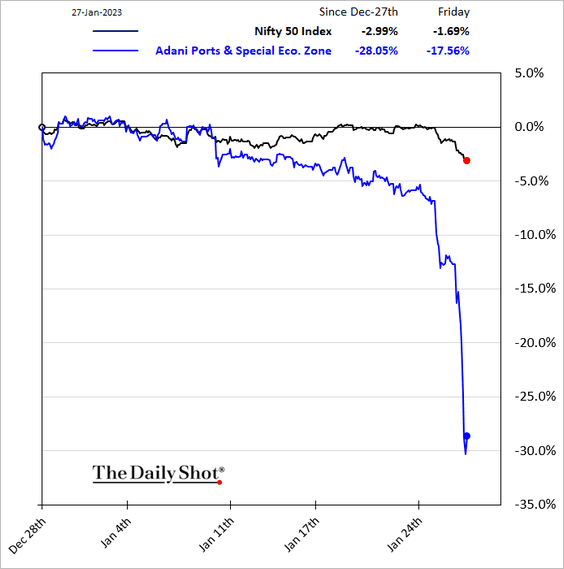
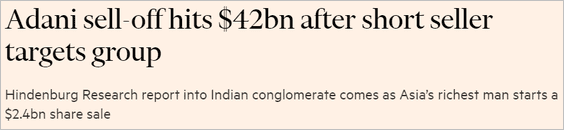
1. India’s Nifty index is under pressure as Adani companies’ share prices plunge.
 Source: @financialtimes Read full article
——————–
2. The Pakistani rupee continues to tumble.
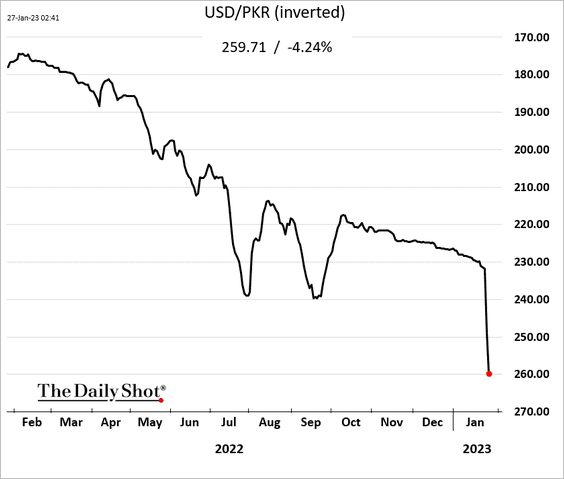
 Source: NDTV Read full article
——————–
3. Hungarian real wages have been sinking.
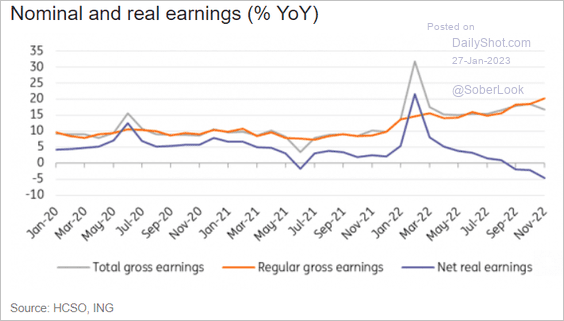 Source: ING
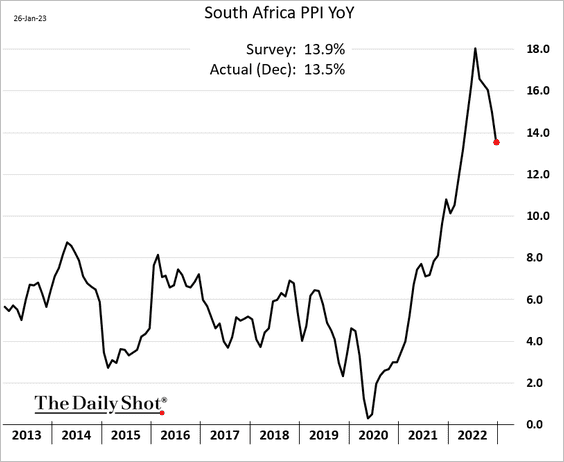
4. South Africa’s central bank (SARB) raised rates by 25 bps (the market expected 50 bps).
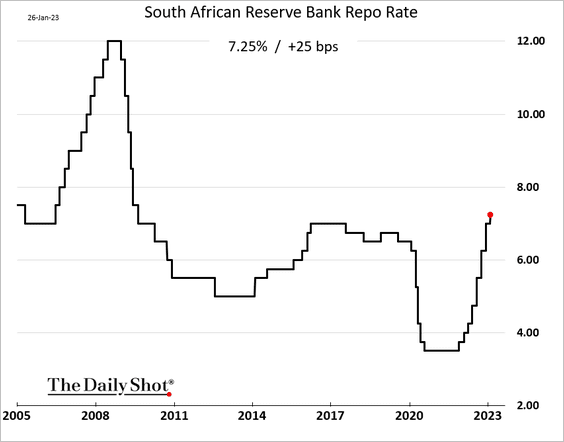
• SARB, like other central banks, was surprised by the extent of the pickup of inflation in 2021 and 2022.
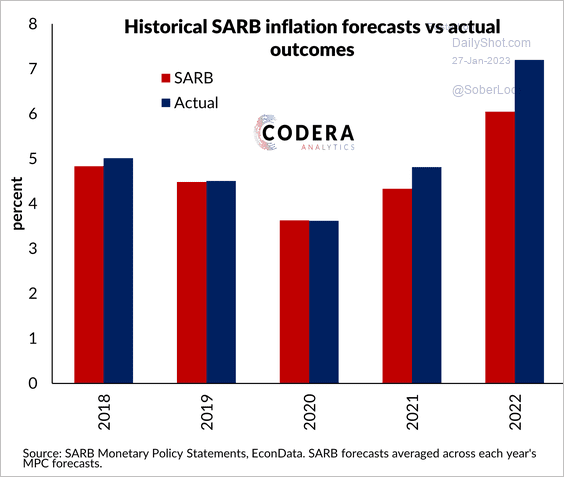 Source: Codera Analytics Further reading
• The PPI continues to ease.
——————–
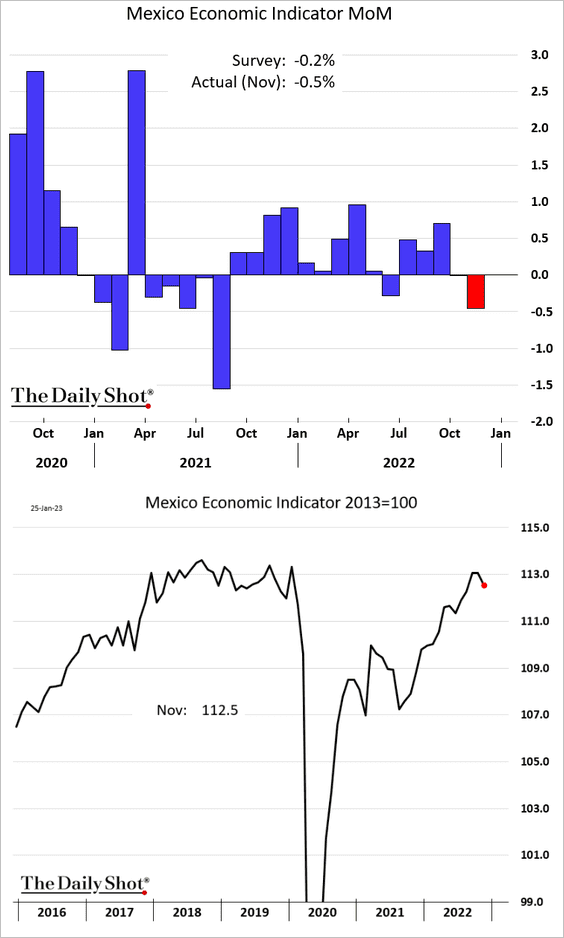
5. Mexico’s economy contracted in November.
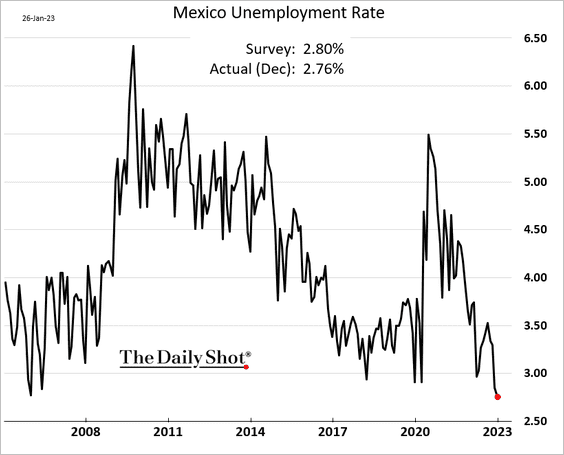
The unemployment rate hit a multi-year low last month.
——————–
6. Colombia’s retail and industrial confidence indicators have diverged.

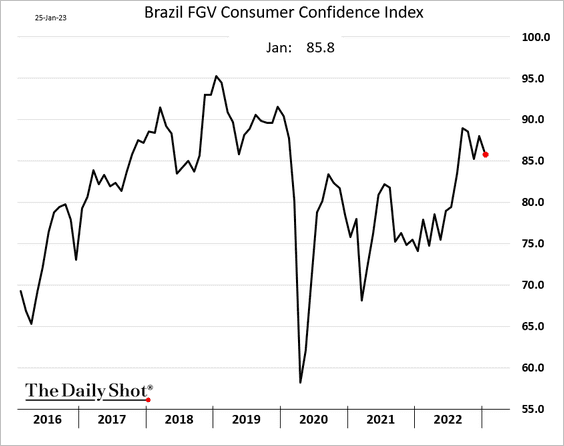
7. Brazil’s consumer confidence edged lower this month.
8. Argentina’s consumer confidence has rebounded sharply.
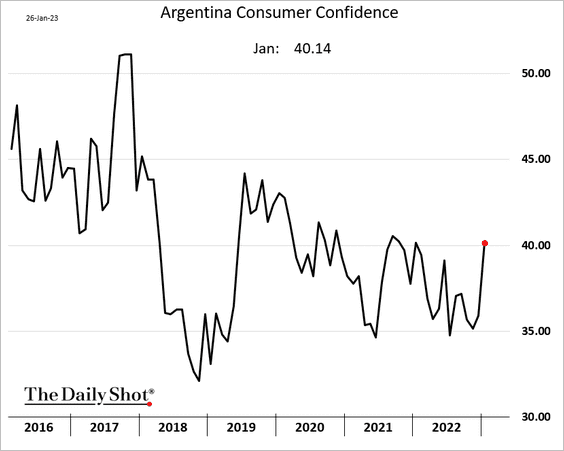
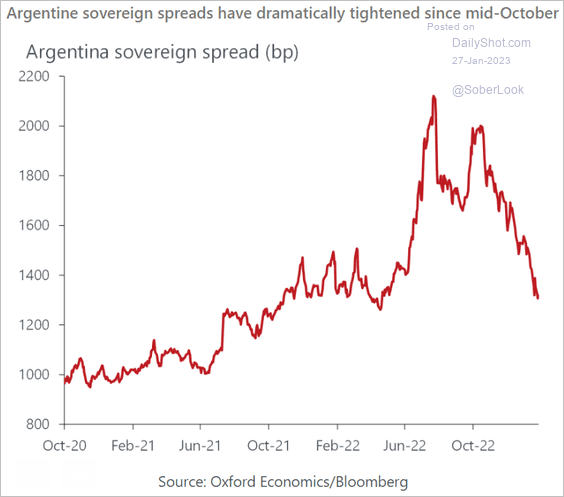
Argentina’s overeign spreads have been tightening rapidly in recent months.
 Source: Oxford Economics
——————–
9. Most EM currencies are substantially undervalued.
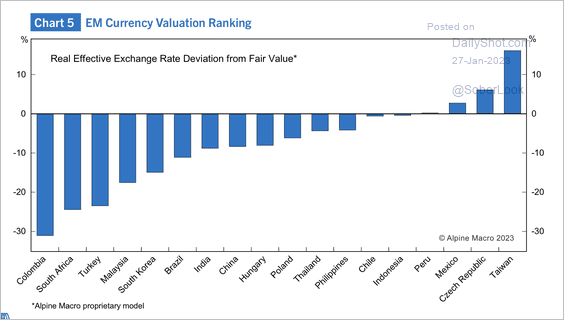 Source: Alpine Macro
Back to Index
Energy
1. When adjusted for inflation, oil prices are not considered excessively high.
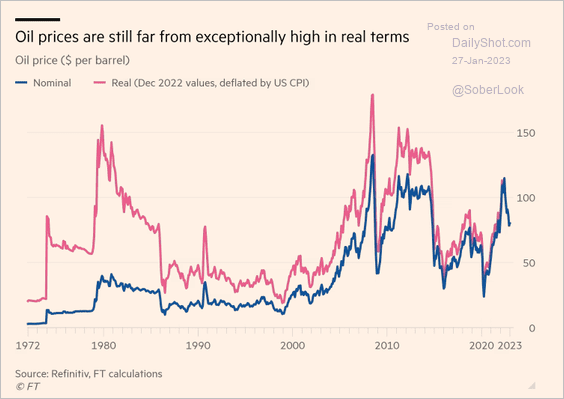 Source: @financialtimes Read full article
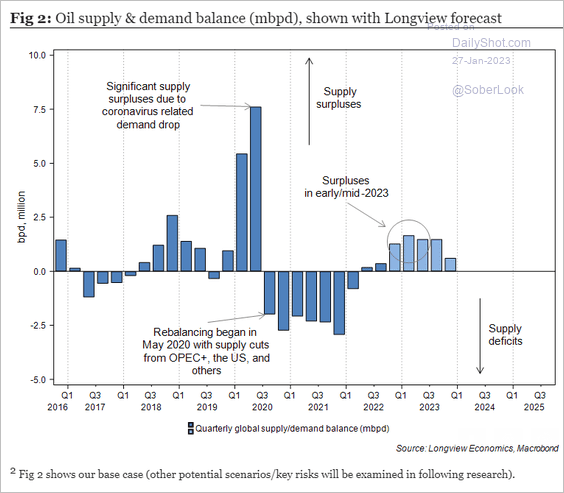
2. Here is a contrarian view on oil markets. Longview Economics sees global oil inventories rising from here, putting downward pressure on crude prices.
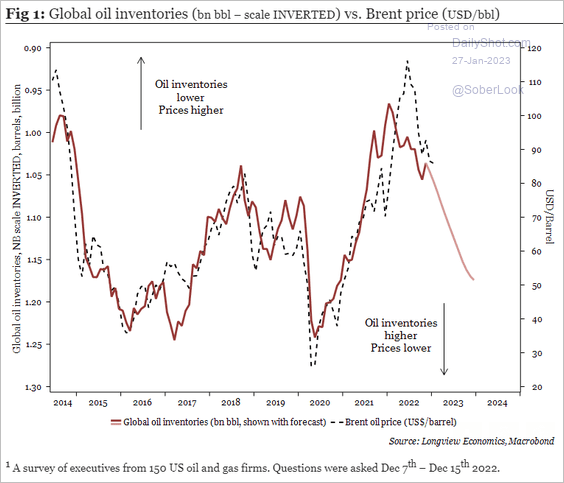 Source: Longview Economics
The research firm expects the market to be in surplus this year as Russia’s production continues uninterrupted.
 Source: Longview Economics
——————–
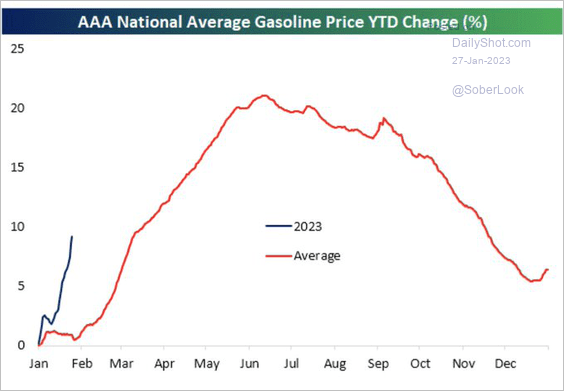
3. The average US retail gasoline price is back above $3.5/gal.
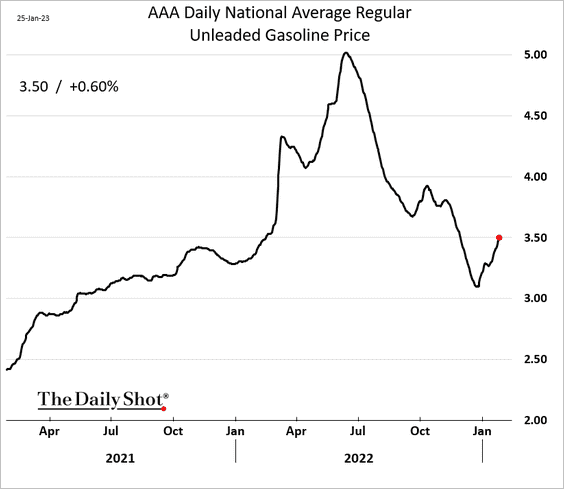
The January price increase has been rapid relative to previous years.
 Source: @carlquintanilla, @bespokeinvest
——————–
4. US propane inventories remain elevated amid strong production and warm weather.
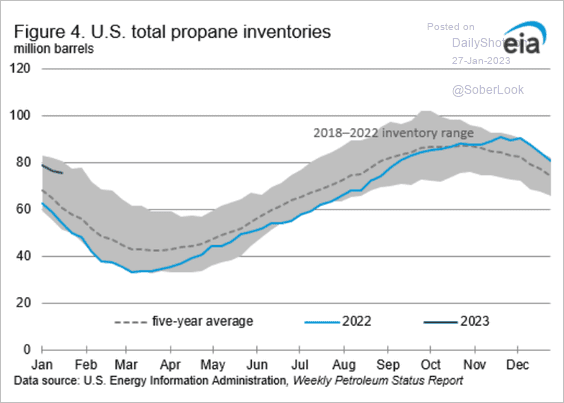 Source: @EIAgov
Back to Index
Equities
1. Is 4100 the next stop for the S&P 500?
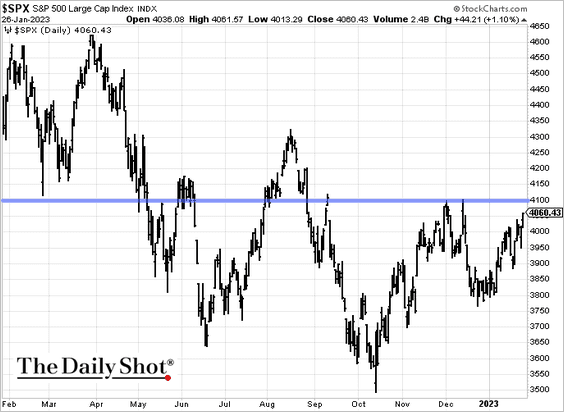
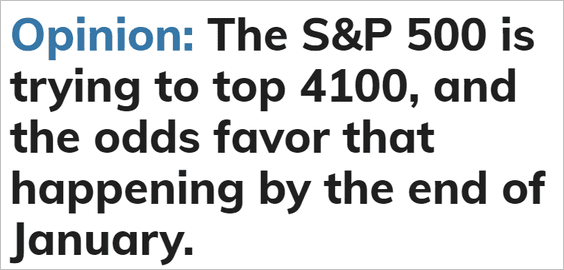 Source: MarketWatch Read full article
——————–
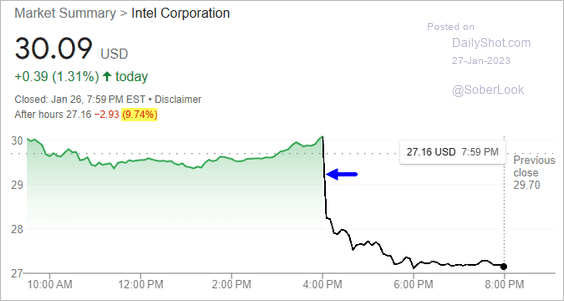
2. Semiconductor shares have been surging, …
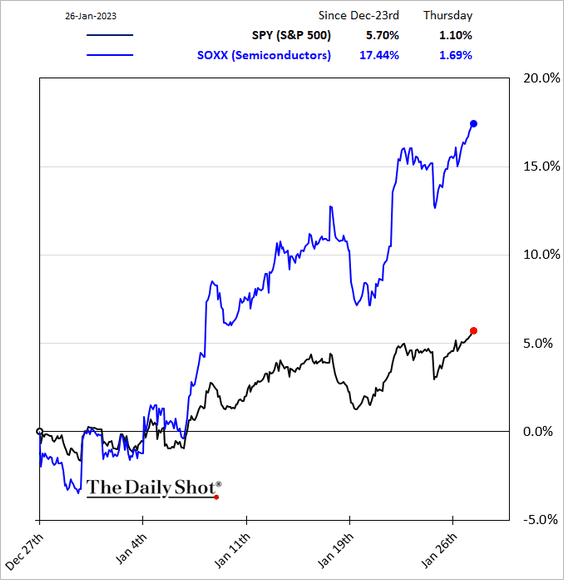
… but is this a warning sign?
 Source: CNBC Read full article
 Source: Google
——————–
3. Here are some additional sector updates.
• Share buyback announcements by sector:
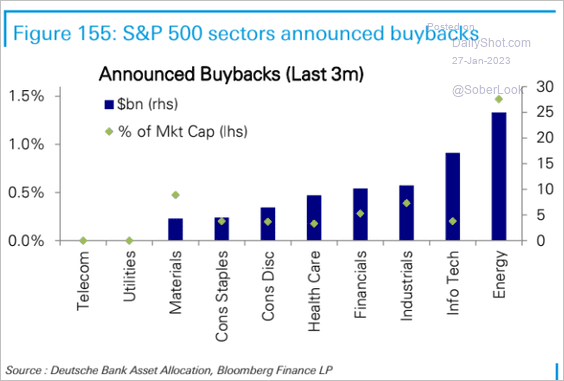 Source: Deutsche Bank Research
• Put skew by sector (a higher number means elevated demand for downside protection):
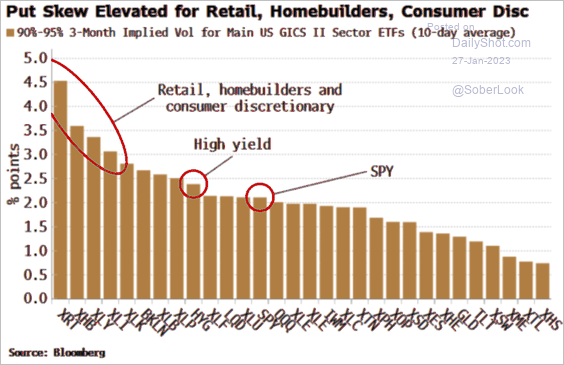 Source: Simon White, Bloomberg Markets Live Blog
• Cumulative sector fund flows:
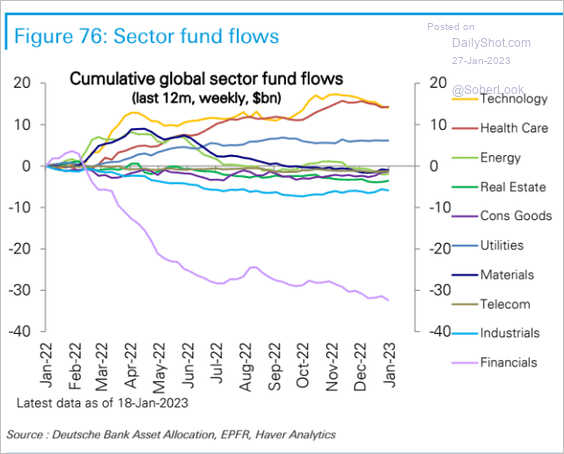 Source: Deutsche Bank Research
• Weekly tech and healthcare fund flows:
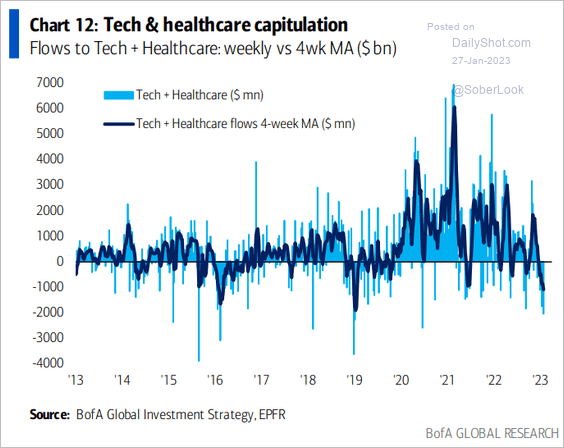 Source: BofA Global Research
• BofA wealth management clients have been dumping REITs.
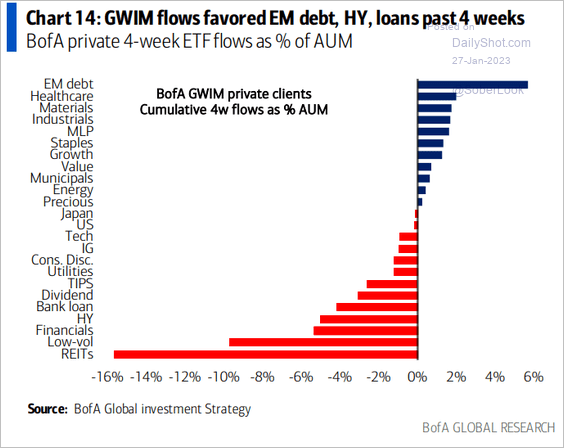 Source: BofA Global Research
——————–
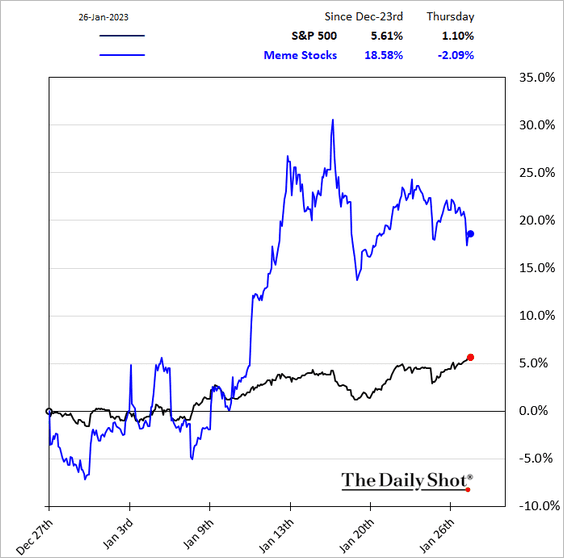
4. Retail investor flows into stocks rose this month, …
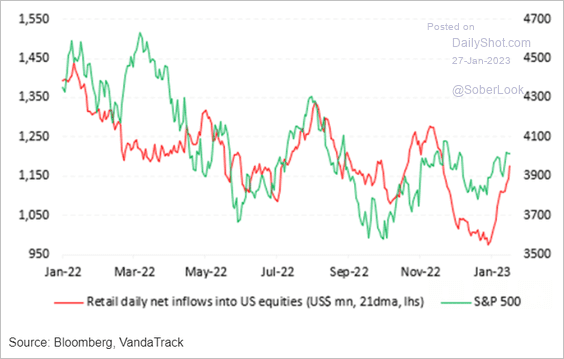 Source: Vanda Research
… boosted by purchases of semiconductors, mega-caps, and of course, Tesla.
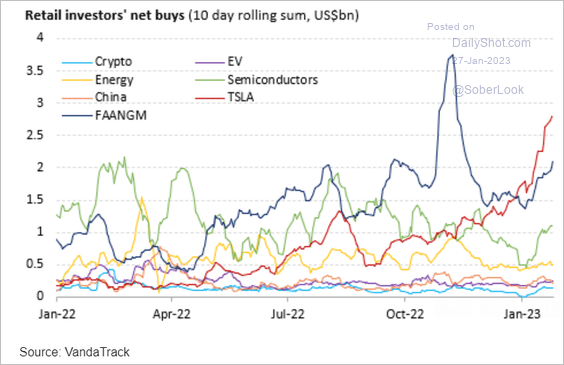 Source: Vanda Research
The rally in meme stocks has stalled.
——————–
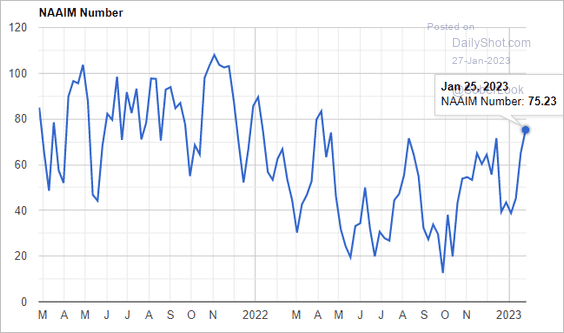
5. Investment managers are chasing stocks higher. This is the NAAIM Exposure Index.
 Source: NAAIM
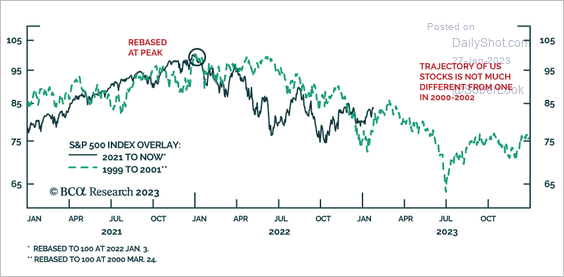
6. Finally, here is the 2000-2001 analog.
 Source: BCA Research
Back to Index
Rates
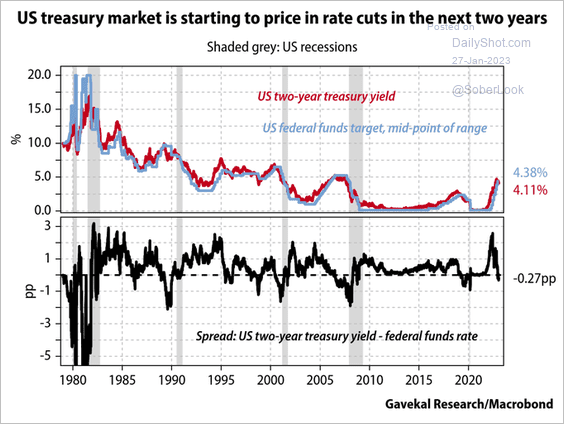
1. The 2-year Treasury yield is back below the fed funds rate.
 Source: @Gavekal
2. US real yields continue to trend lower.
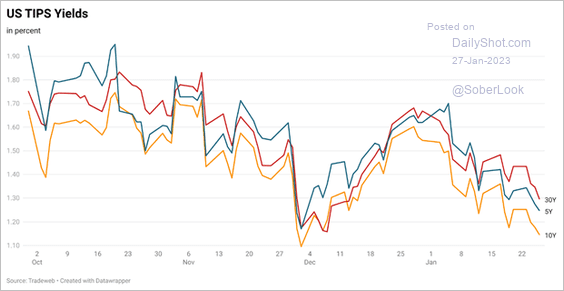 Source: Tradeweb
3. The current trajectory of US rates vol is different from other tightening episodes in recent history. The rise in vol since 2018 was interrupted by unprecedented monetary stimulus in 2020. Rising inflation and aggressive rate hikes created the perfect storm for vol to rebound. That’s very different from the orderly unwind of financial repression in 2016-2018, according to Deutsche Bank. (2 charts)
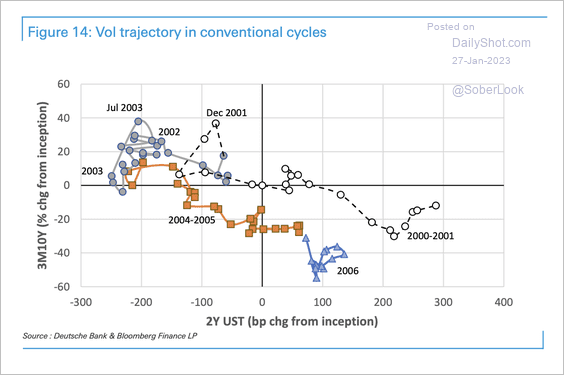 Source: Deutsche Bank Research
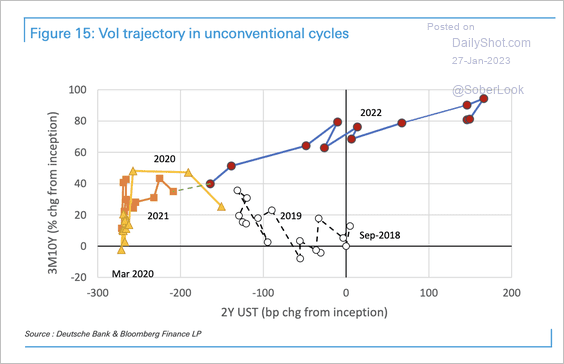 Source: Deutsche Bank Research
Back to Index
Global Developments
1. Here is the IMF World Uncertainty Index.
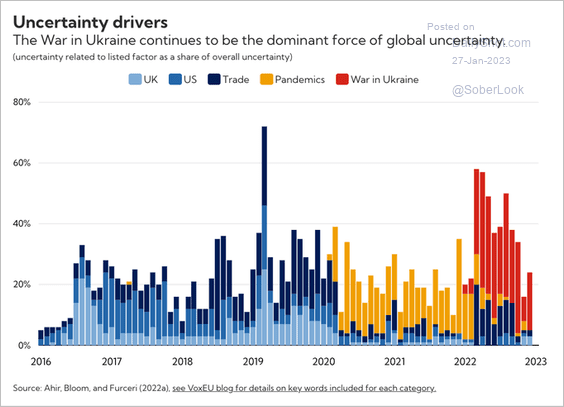 Source: @IMFNews Read full article
2. Is China’s reopening inflationary? Below are investor responses from a Deutsche Bank survey,
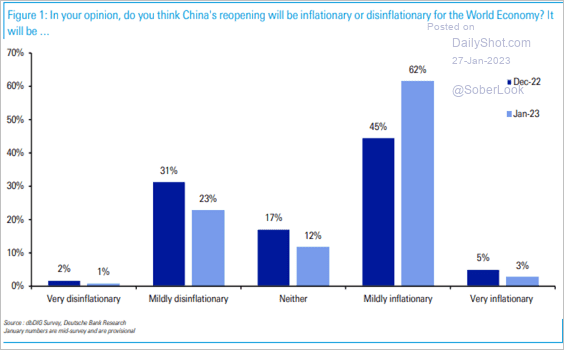 Source: Deutsche Bank Research
3. Is global consumer confidence starting to rebound?
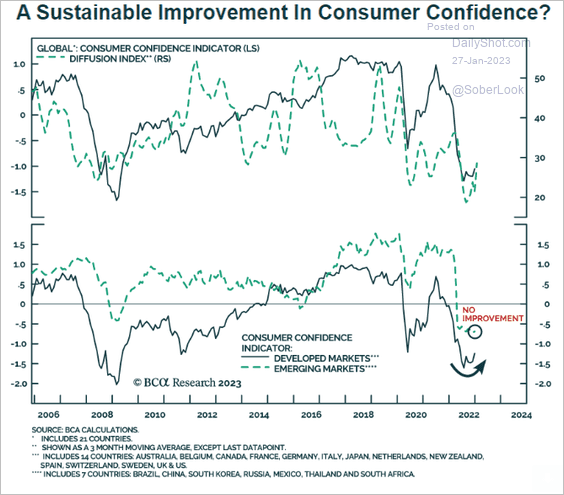 Source: BCA Research
4. Real global goods exports (yellow line) continue to rise.
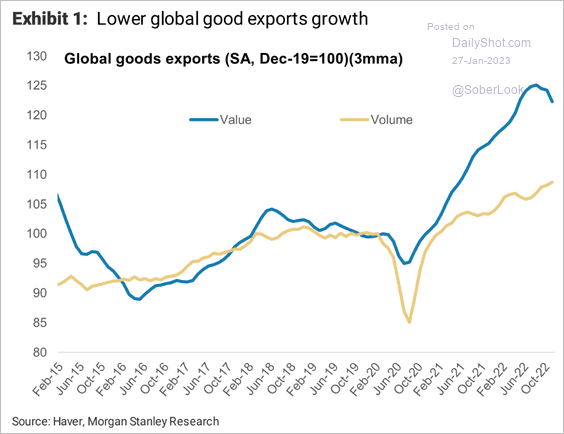 Source: Morgan Stanley Research
——————–
Food for Thought
1. Changes in the younger-than-10 population:
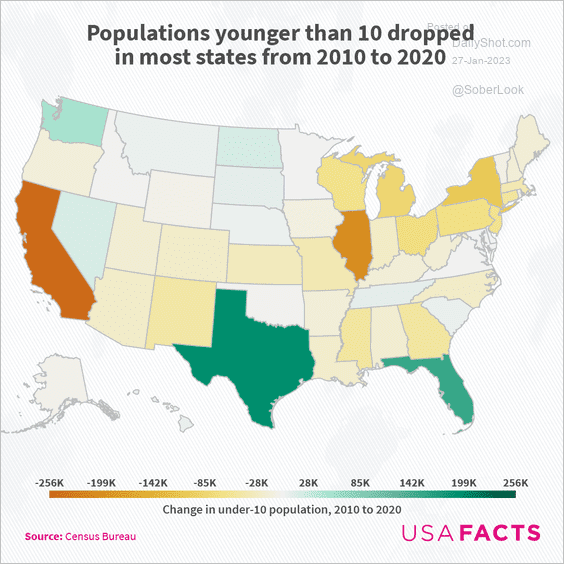 Source: USAFacts
2. Americans abroad:
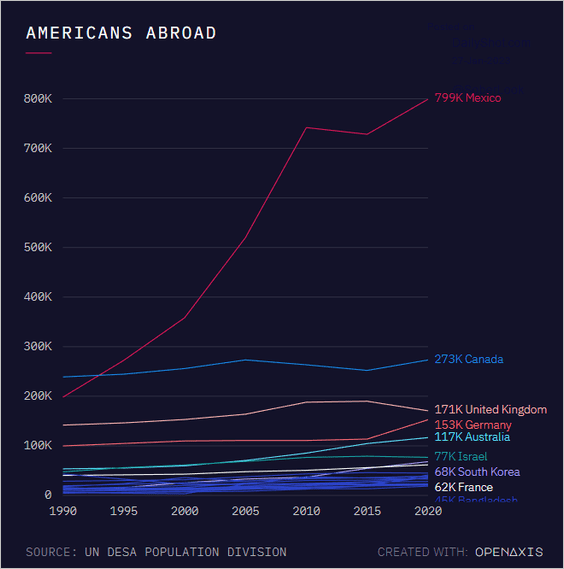 Source: Alex Damianou, @OpenAxisHQ
3. Life expectancy vs. GDP per capita:
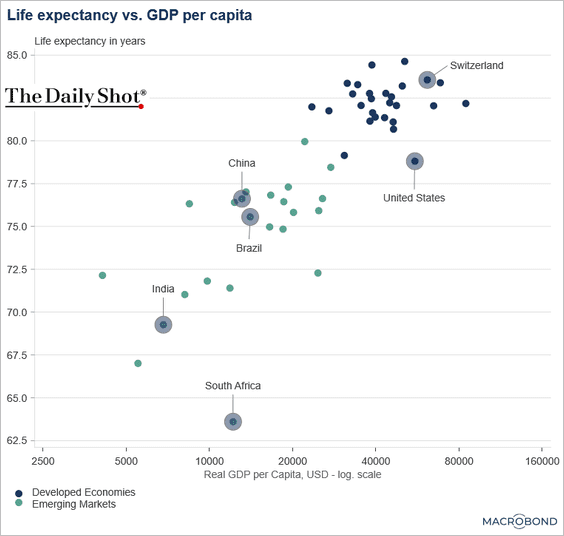 Source: Chart and data provided by Macrobond
4. There hasn’t been a lot of snow in the Northeast this winter.
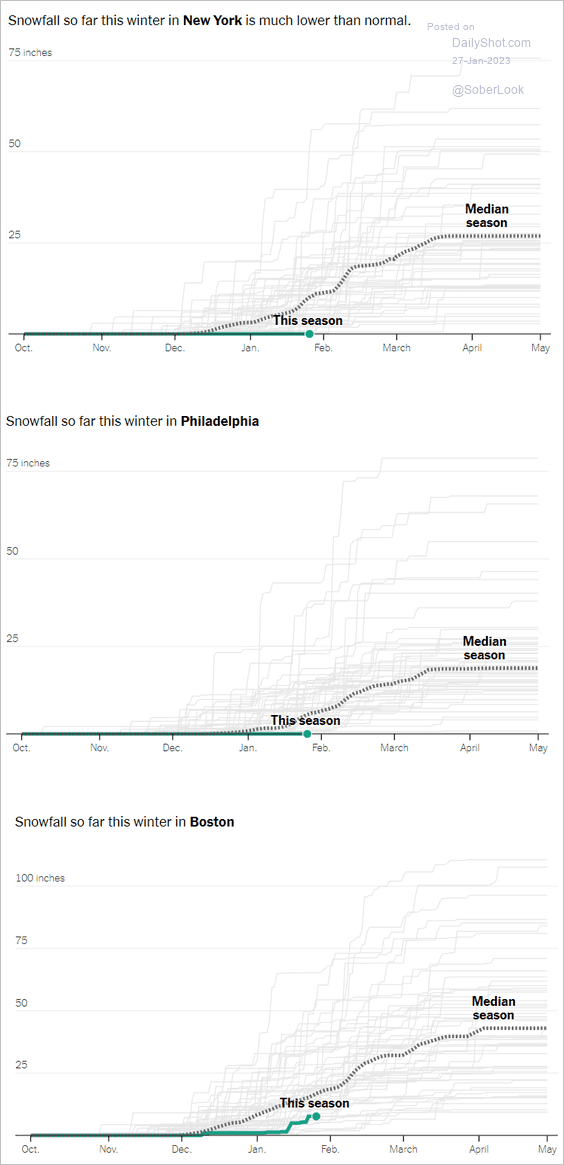 Source: The New York Times Read full article
5. Ad spending on technologies that use high temperatures to break down plastic into its basic components:
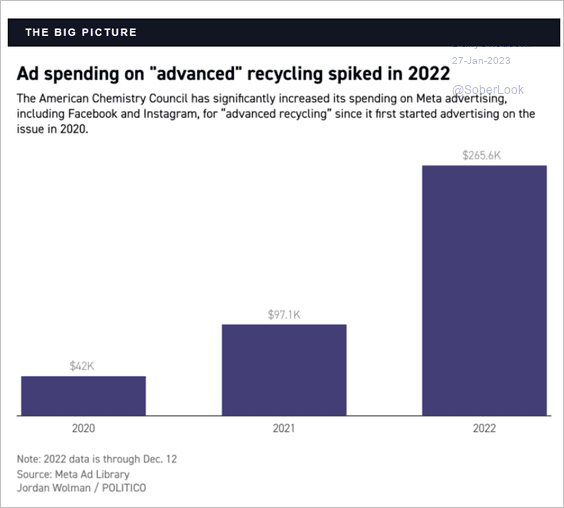 Source: Politico Read full article
6. Finding work after a layoff:
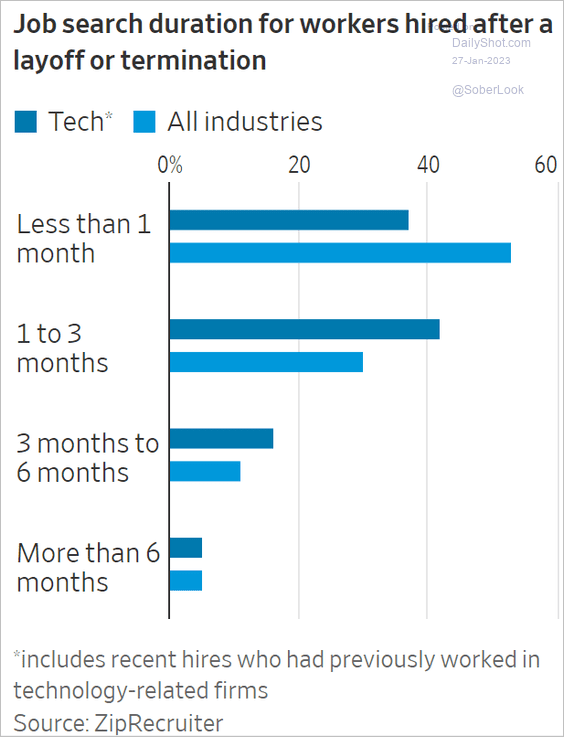 Source: @WSJ Read full article
7. Geothermal energy:
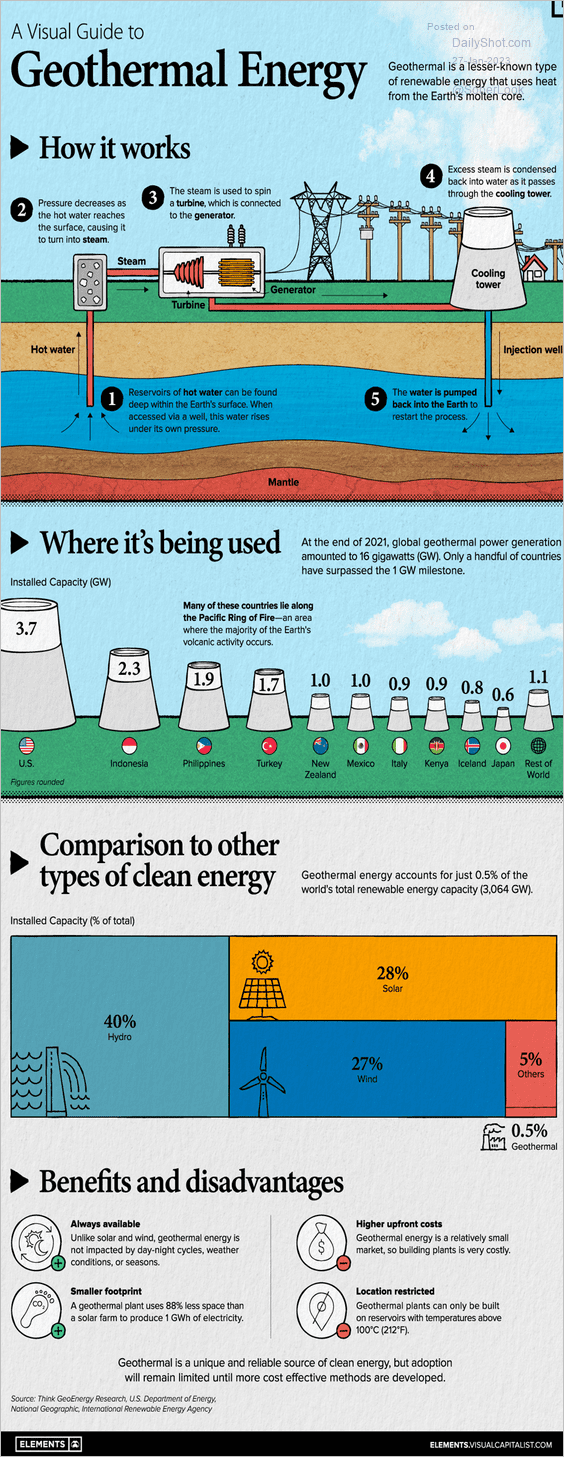 Source: Visual Capitalist Read full article
——————–
Have a great weekend!
Back to Index