
The Daily Shot: 02-Feb-23
• The United States
• The United Kingdom
• The Eurozone
• Asia – Pacific
• Emerging Markets
• Cryptocurrency
• Energy
• Equities
• Rates
• Global Developments
• Food for Thought
The United States
1. The Fed raised rates by 25 bps (as expected) and signaled more to come.
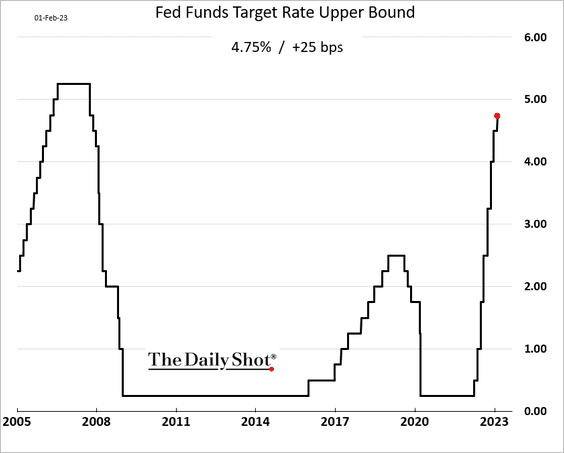
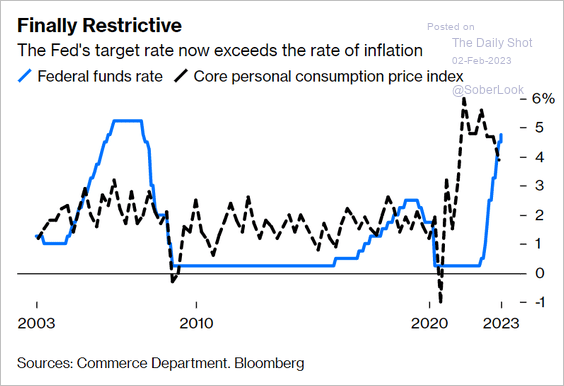
• The policy rate has been moving into restrictive territory.
 Source: @BobOnMarkets, @opinion Read full article
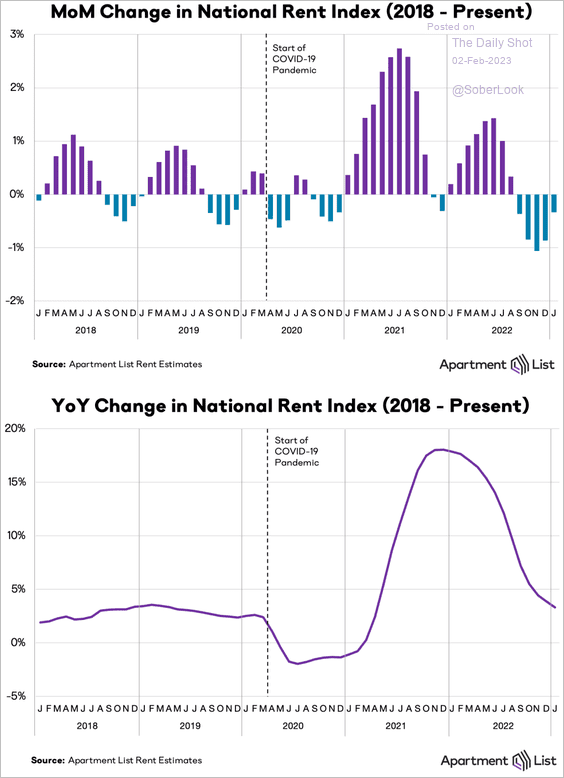
• The central bank acknowledged progress on inflation, with Chair Powell pointing to disinflation in core goods. The FOMC also sees housing inflation moderating based on numerous leading indicators, such as rent. Below is the rent index from Apartment List (through January).
 Source: Apartment List
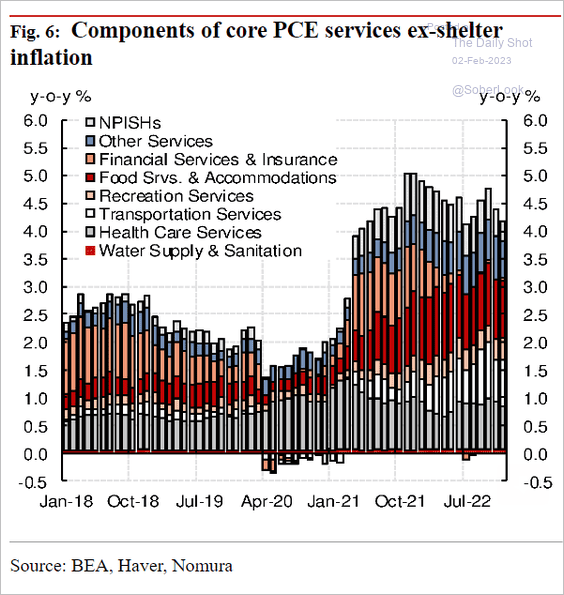
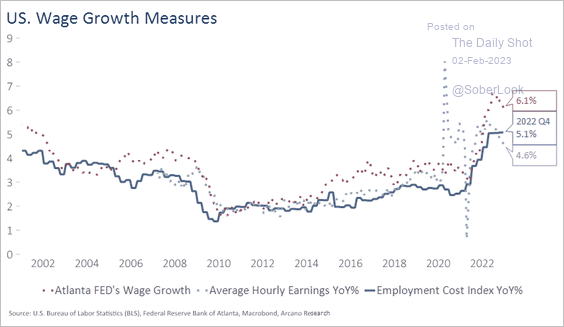
• The FOMC’s focus is now on the rest of the core inflation index – excluding goods and housing. In particular, the Fed is watching the components sensitive to wage growth, such as food services.
 Source: Nomura Securities
 Source: Arcano Economics
• Concerned about a rebound in inflation, as we saw in the late 1970s (below), Powell continues to push back on rate cuts this year.
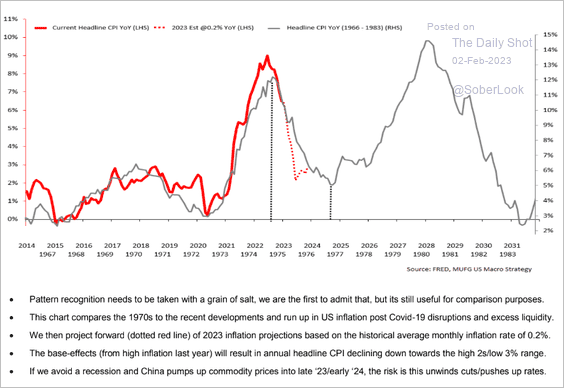 Source: MUFG Securities
But the market still sees a 50 bps reduction in the second half of the year.
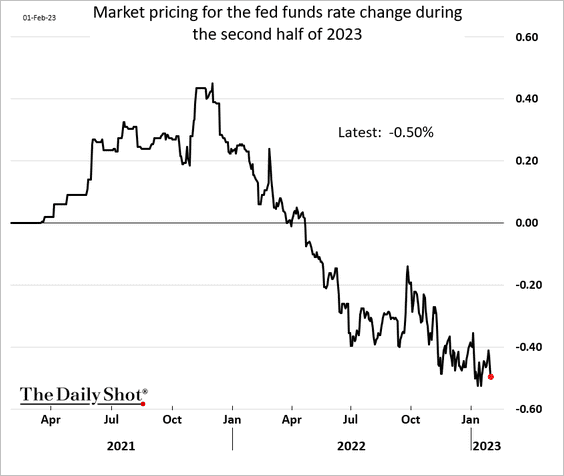
Some economists see even deeper rate cuts ahead. Here is a forecast from Nomura.
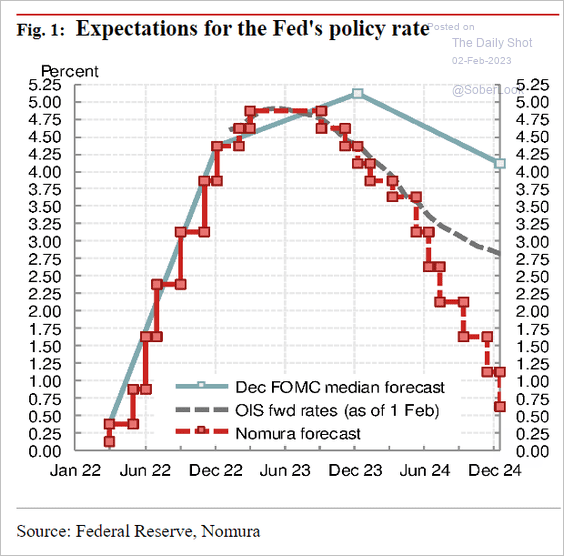 Source: Nomura Securities
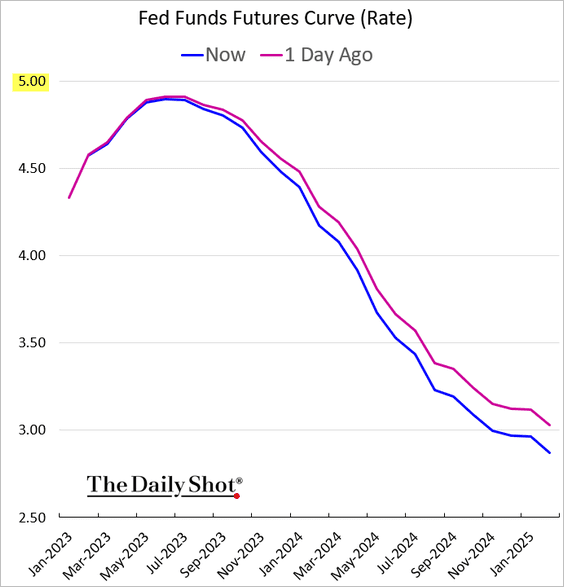
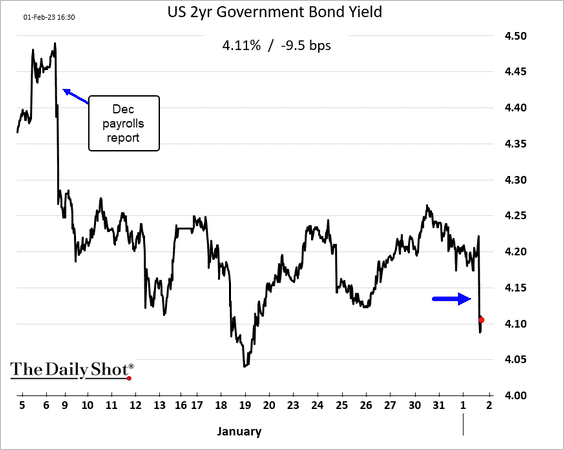
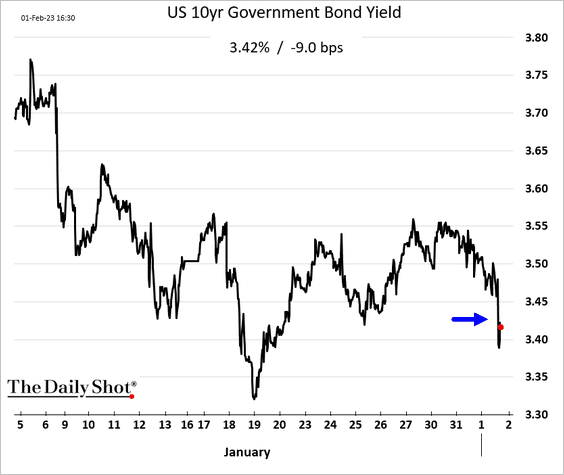
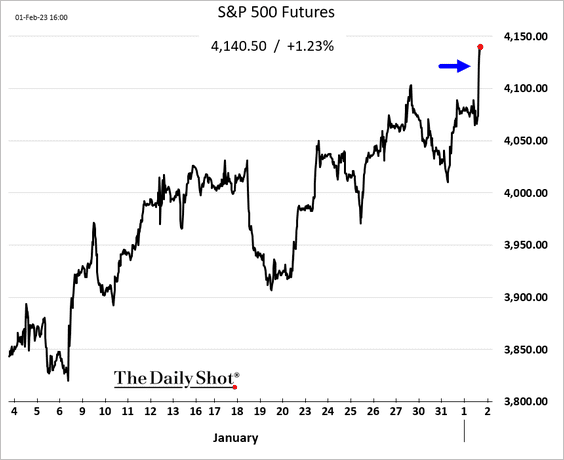
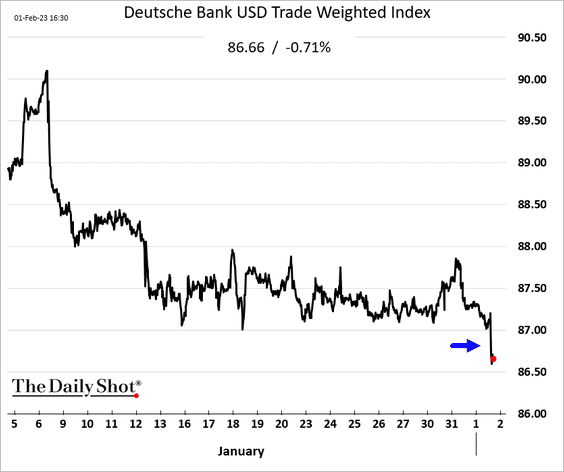
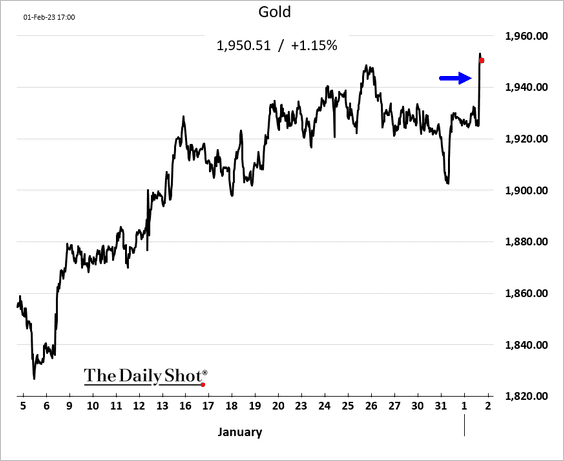
• With Chair Powell stressing data dependency and no aggressive pushback on easing financial conditions (such as lower bond yields), the market interpreted the FOMC’s stance as being on the dovish side. Here is how markets reacted.
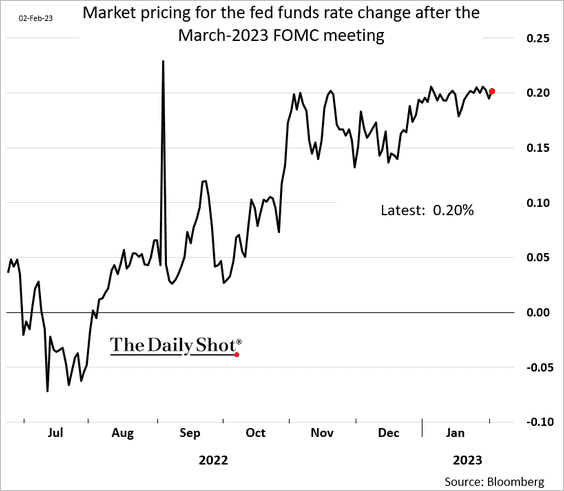
– The fed funds rate trajectory:
– Treasury yields:
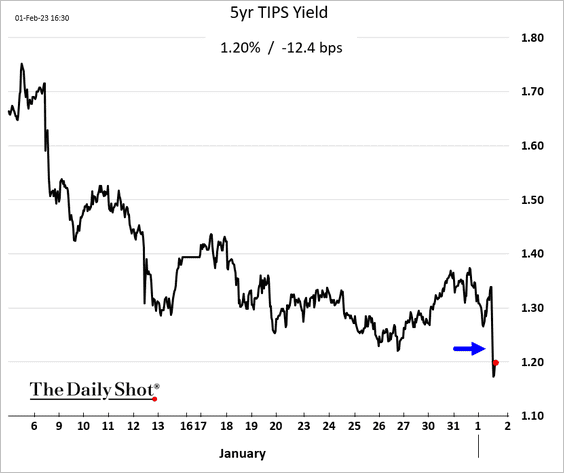
– Real yields:
– Stocks:
– The dollar:
– Gold:
The market continues to price an 80% chance of another 25 bps rate hike in March.
——————–
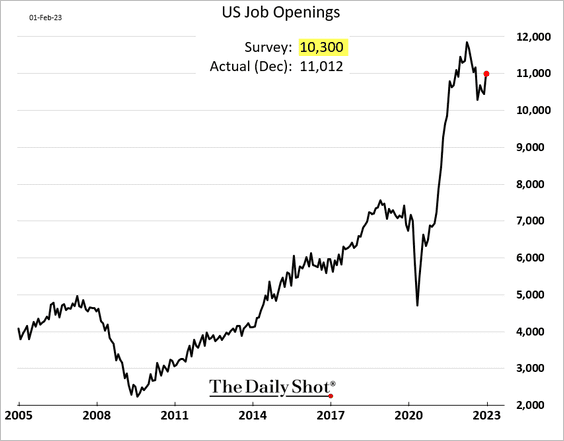
2. Job openings unexpectedly jumped in December.
• Here are the drivers of monthly changes in job openings.
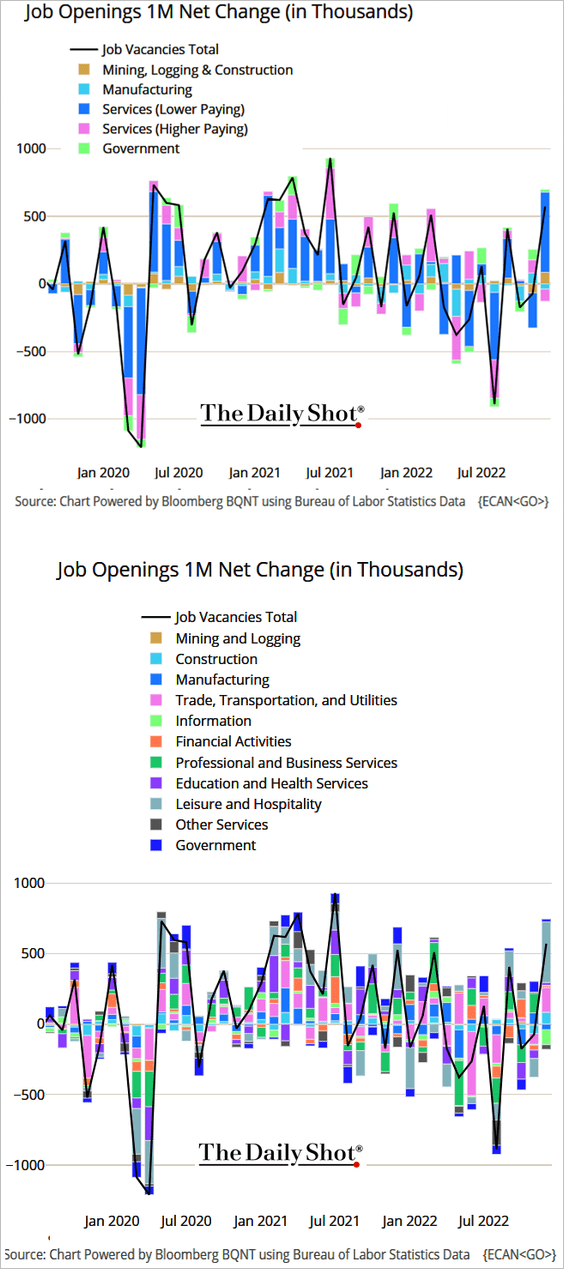 Source: @TheTerminal, Bloomberg Finance L.P.
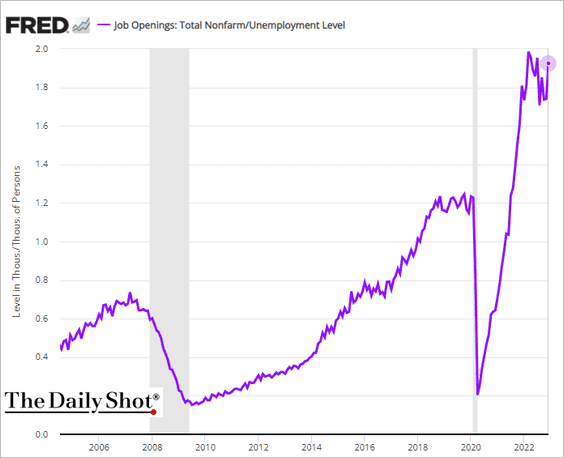
• The labor market imbalance is what’s keeping the Fed from pausing. There are almost two job openings for every unemployed American.
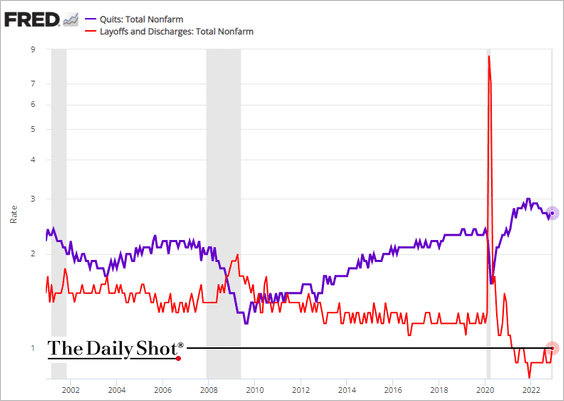
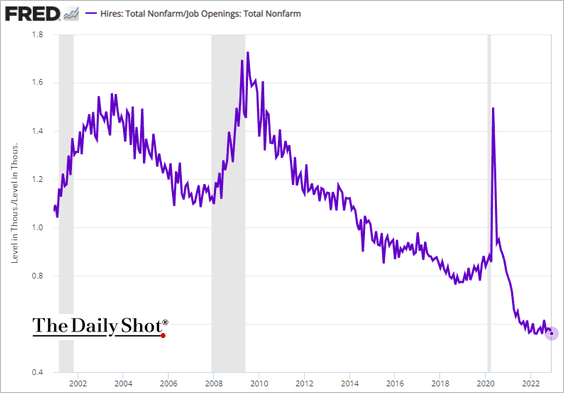
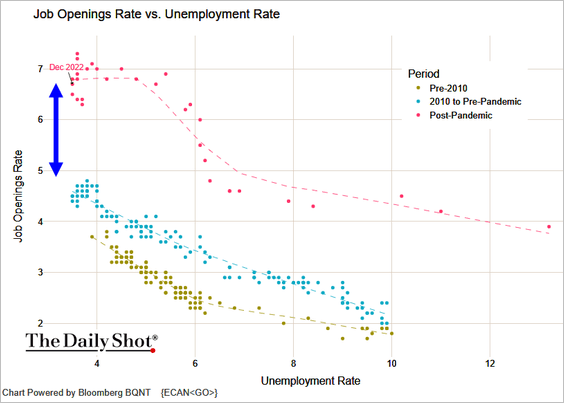
• Below are some additional trends pointing to persistent tightness in the job market.
– Quits (voluntary resignations) vs. layoffs:
– The hires-to-openings ratio:
– The Beveridge curve:
 Source: @TheTerminal, Bloomberg Finance L.P.
——————–
3. The ADP private payrolls report is signaling a hiring slowdown in January. It’s unclear if this softening will be reflected in the official jobs report.
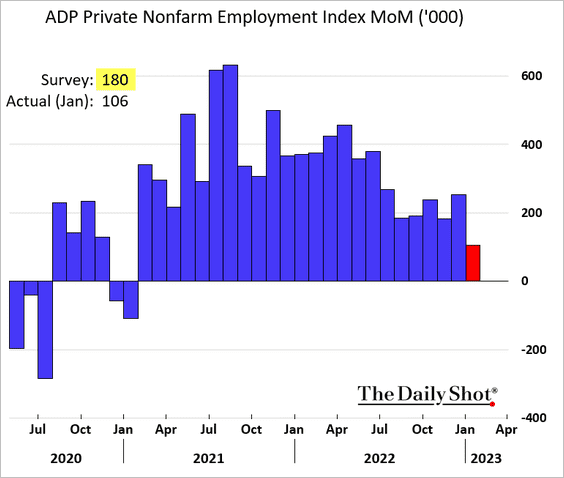
 Source: CNBC Read full article
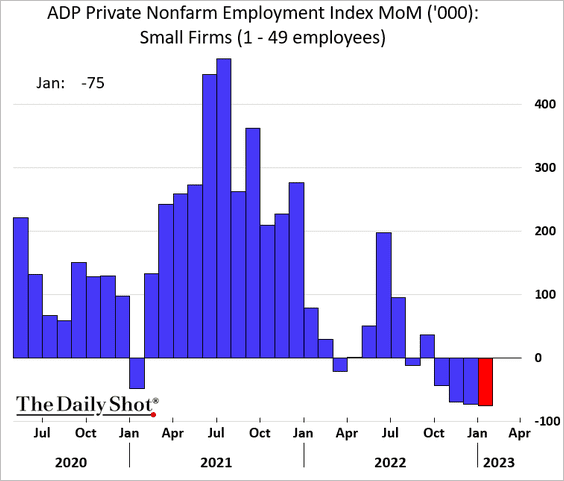
One area to watch is small business employment. According to ADP, small companies shed jobs for four months in a row.
——————–
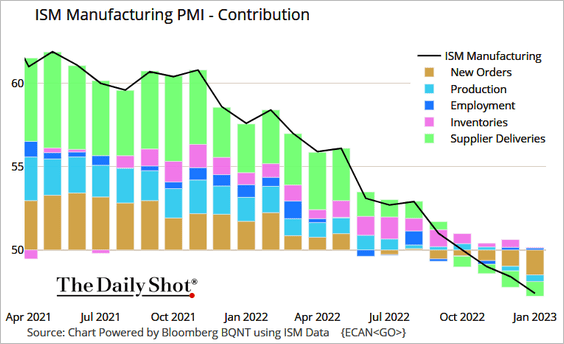
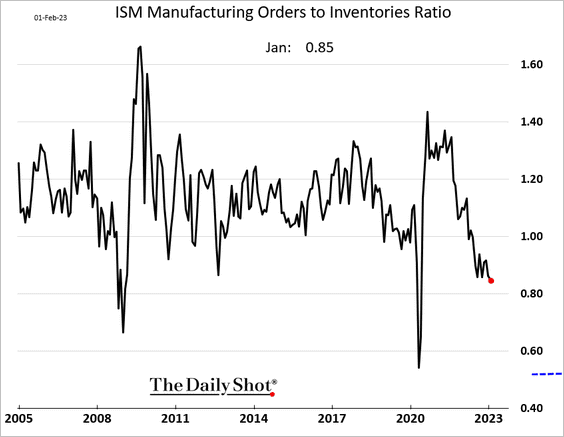
4. The ISM manufacturing PMI report signaled a deepening contraction in January.
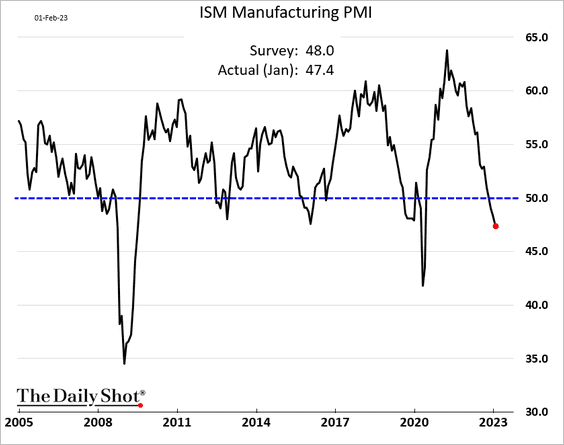
 Source: @TheTerminal, Bloomberg Finance L.P.
• Demand has been crashing, …
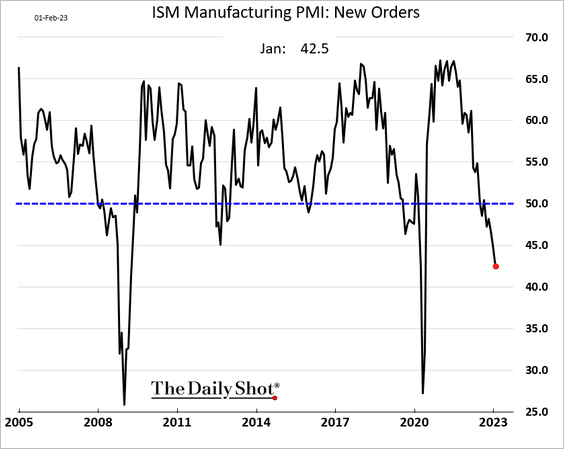
… which is signaling a US recession.
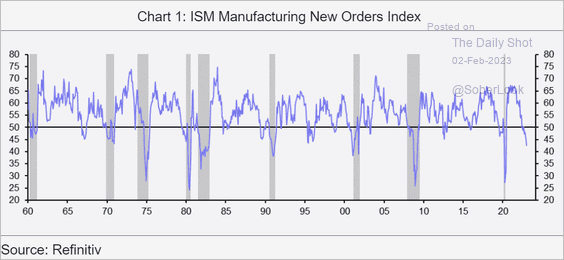 Source: Capital Economics
• Here is the orders-to-inventories index.
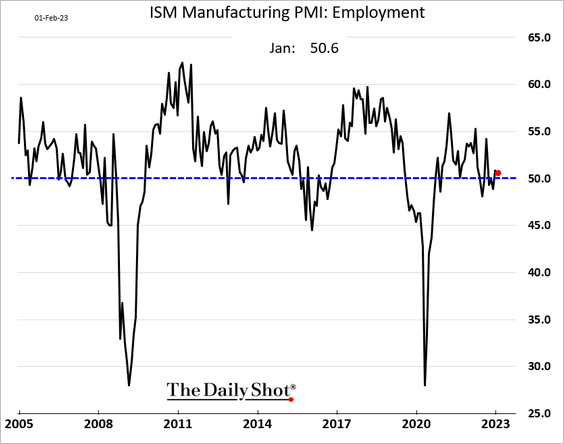
• Factory employment remains stable for now.
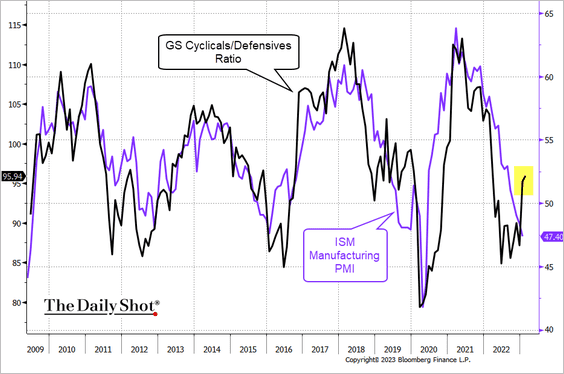
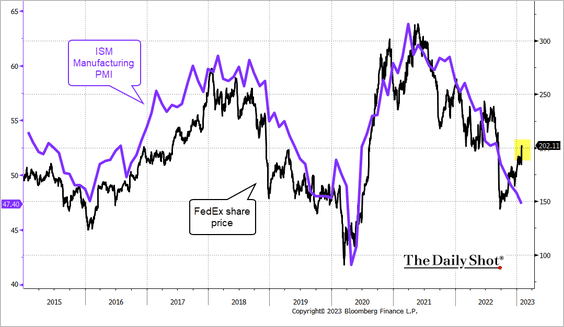
• The stock market points to easing manufacturing contraction in the months ahead.
– Goldman’s cyclicals/defensives ratio:
 Source: @TheTerminal, Bloomberg Finance L.P.
– FedEx share price:
 Source: @TheTerminal, Bloomberg Finance L.P.
Back to Index
The United Kingdom
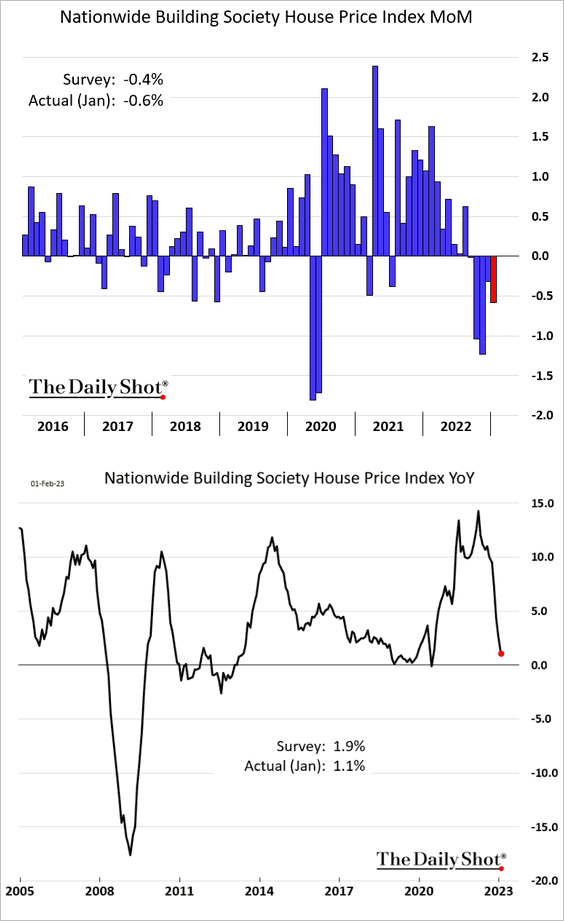
1. Home prices declined more than expected in January.
2. Factory activity continued to contract last month.
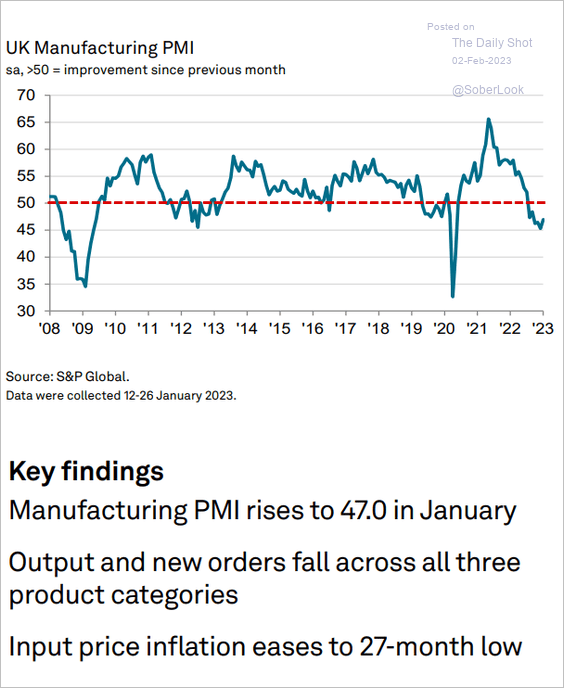 Source: S&P Global PMI
But manufacturers are becoming more upbeat about the future.
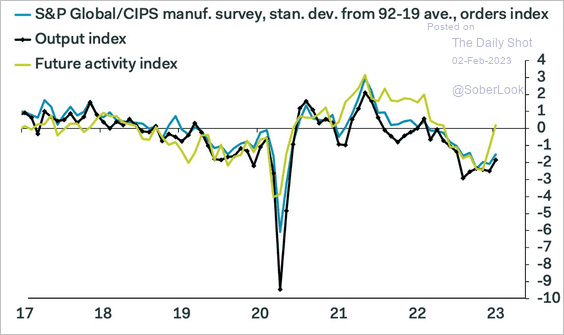 Source: Pantheon Macroeconomics
——————–
3. UK GDP growth projections for this year look awful relative to the rest of G7.
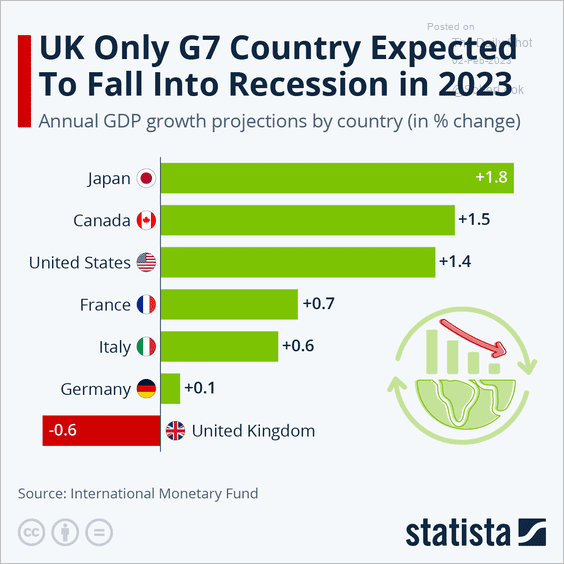 Source: Statista
Back to Index
The Eurozone
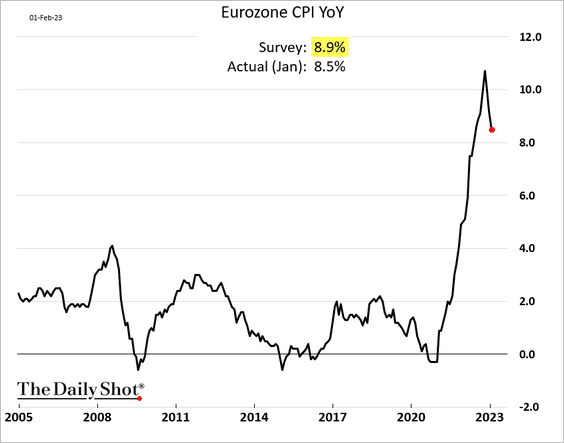
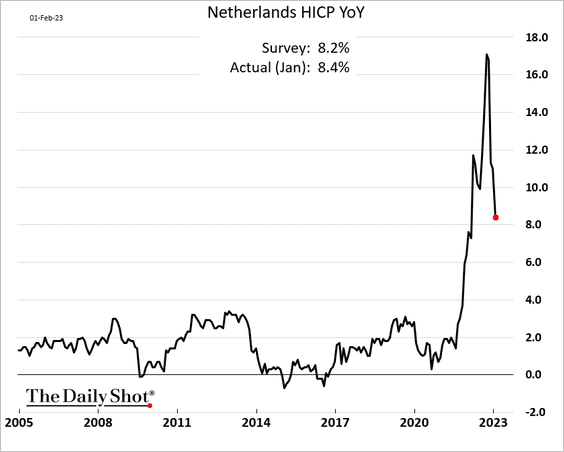
1. The headline inflation eased more than expected last month.
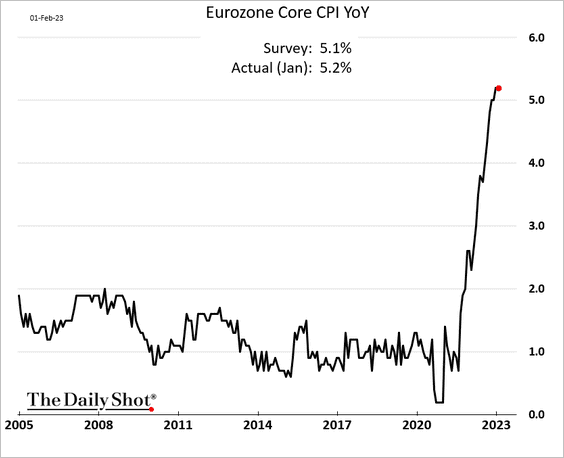
But the core CPI continues to run hot.
• This chart shows the evolution of consensus forecasts for inflation.
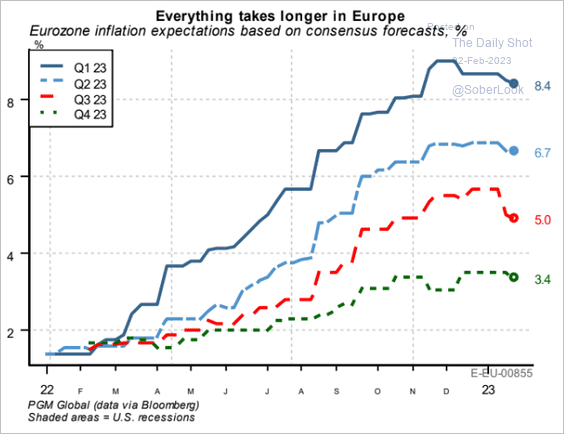 Source: PGM Global
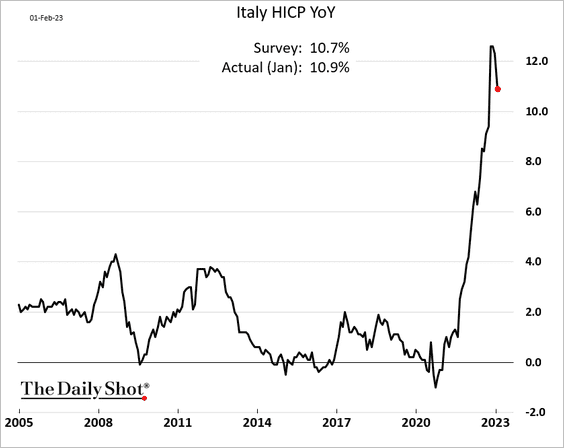
• Here are the inflation trends for Italy and the Netherlands.
——————–
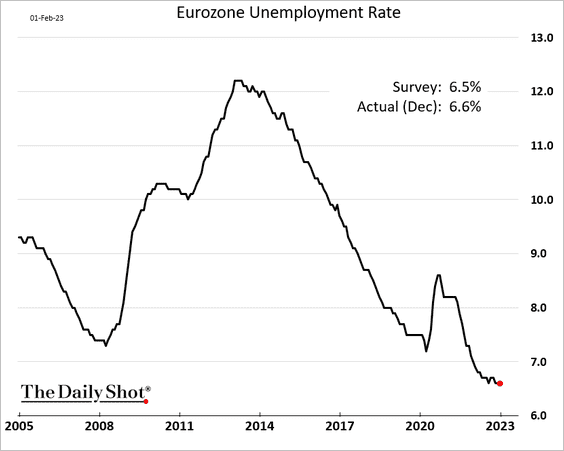
2. The unemployment rate remains remarkably low.
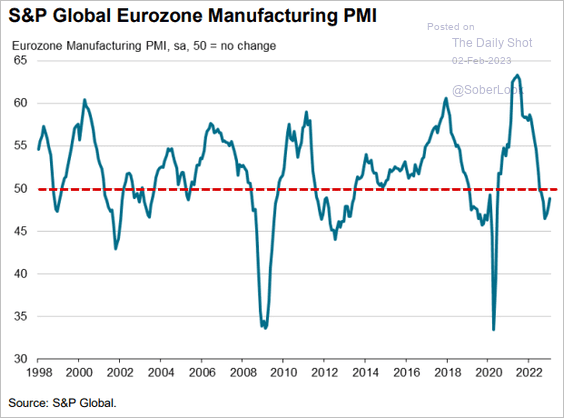
3. Next, we have some manufacturing PMI trends.
• The Eurozone (slower contraction):
 Source: S&P Global PMI
• Italy (back in growth mode):
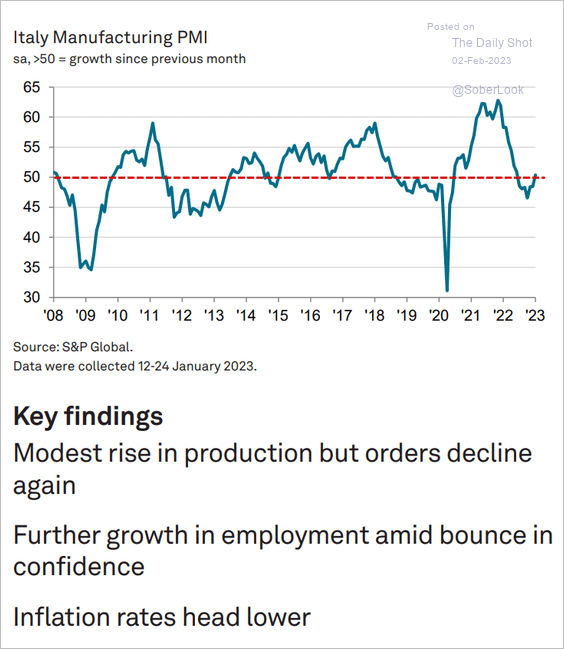 Source: S&P Global PMI
• Spain (slower contraction):
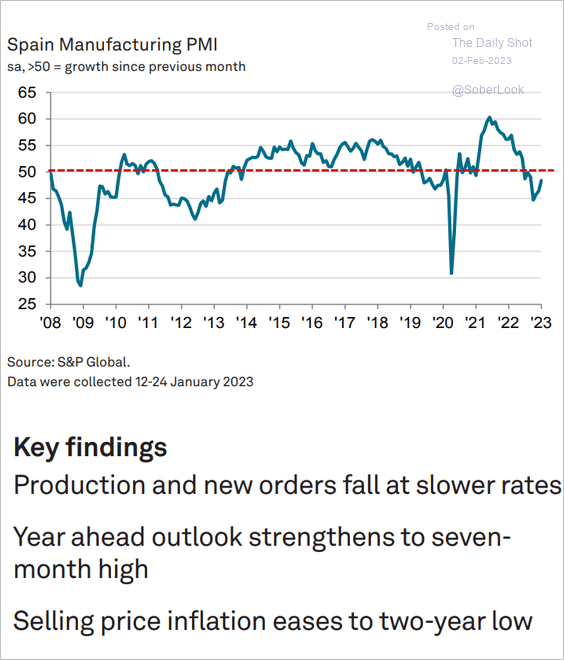 Source: S&P Global PMI
• The Netherlands (stabilizing):
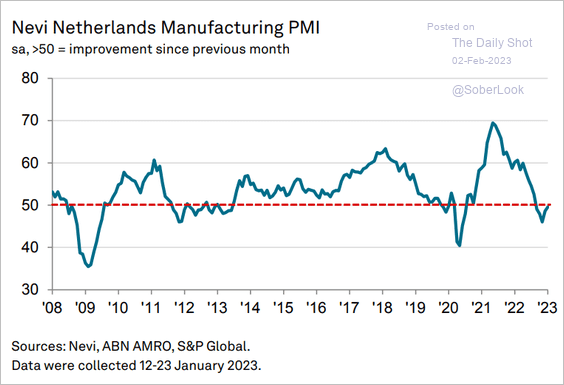 Source: S&P Global PMI
——————–
3. What should we expect from the ECB? Here are some scenarios from ING.
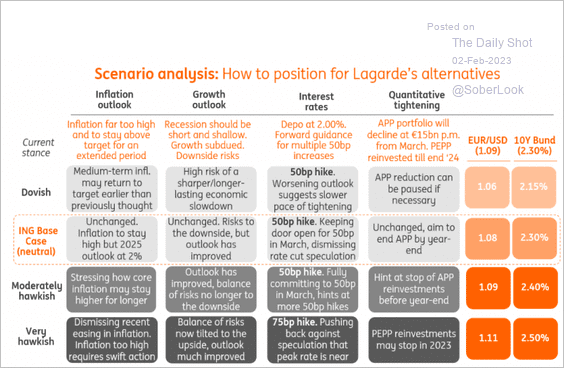 Source: ING
Back to Index
Asia – Pacific
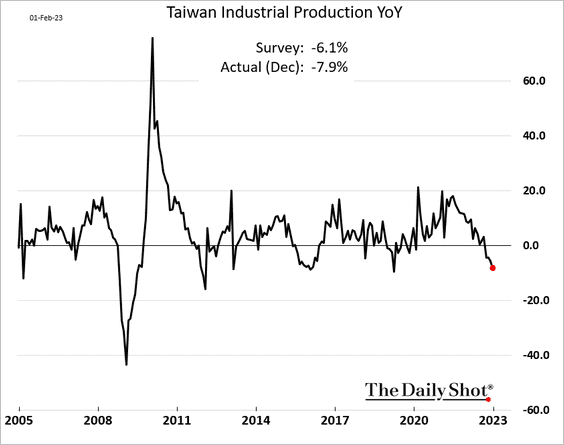
1. Taiwan’s industrial production continues to shrink.
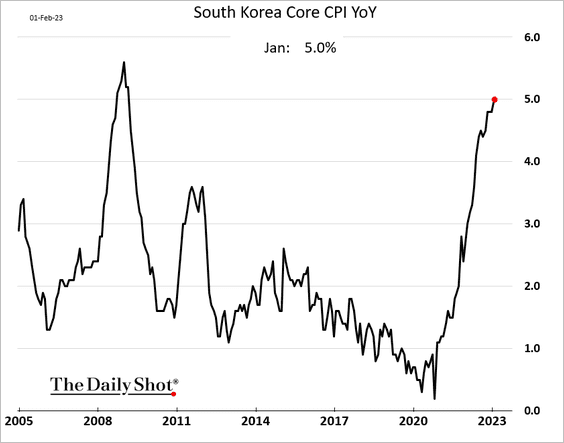
2. South Korea’s core inflation is surging.
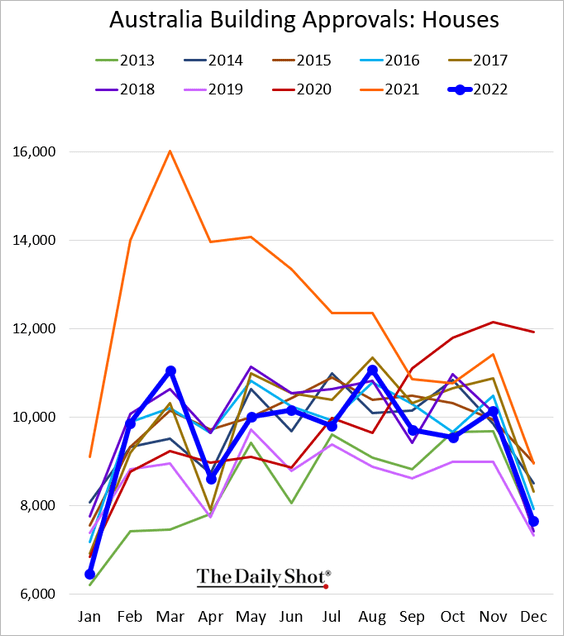
3. Australia’s building approvals slowed to 2013 levels in December.
Australia’s credit growth is expected to slow furhter.
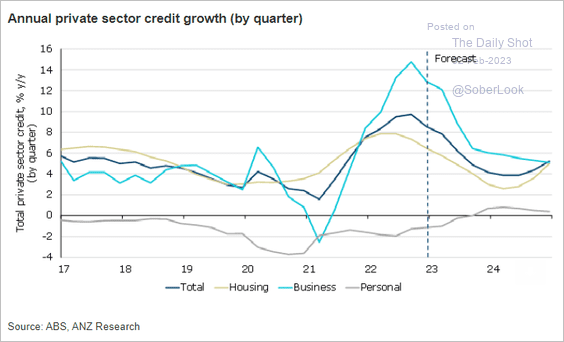 Source: @ANZ_Research
Back to Index
Emerging Markets
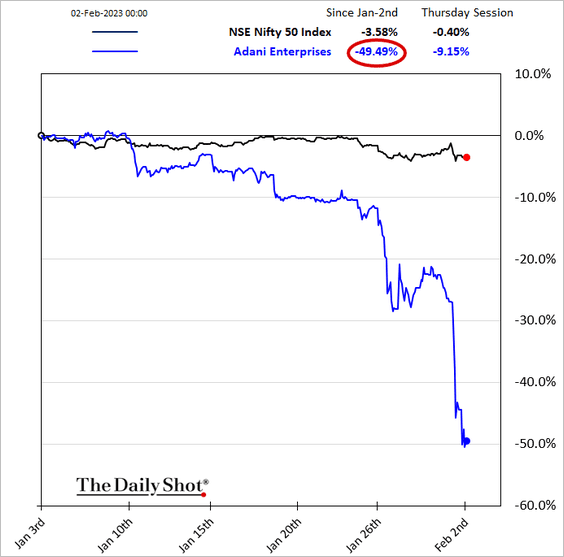
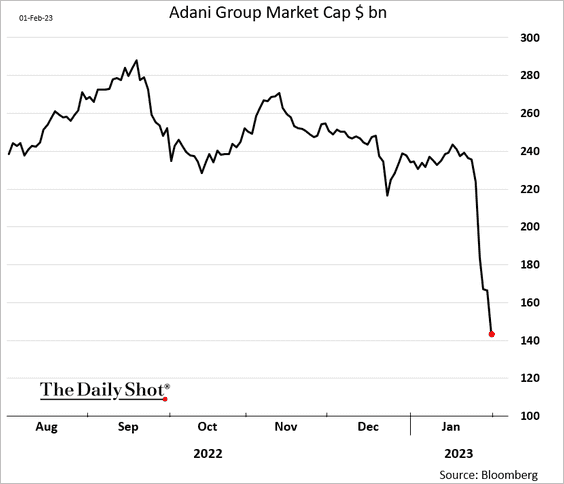
1. The Adani conglomerate rout continued after the share sale was pulled.
 Source: @WSJ Read full article
• The market value loss has been massive.
 h/t Naoto Hosoda
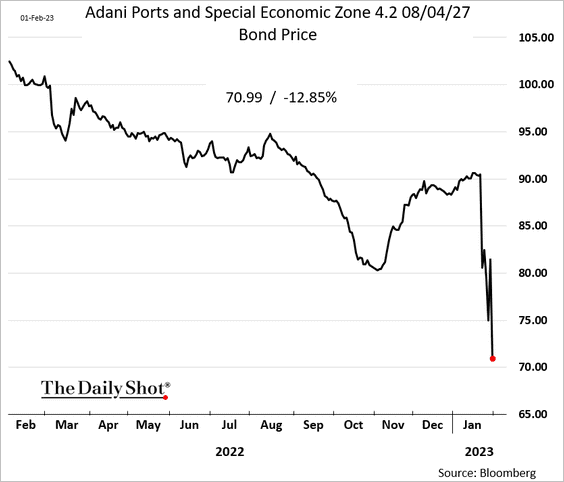
• And bonds are under pressure.
——————–
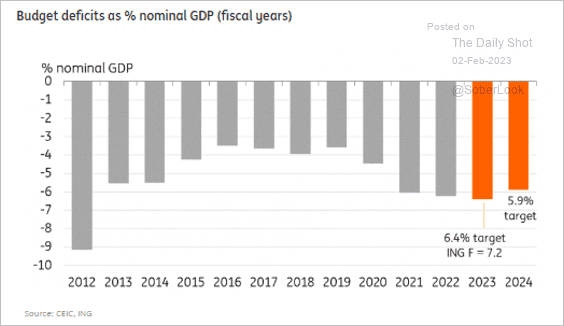
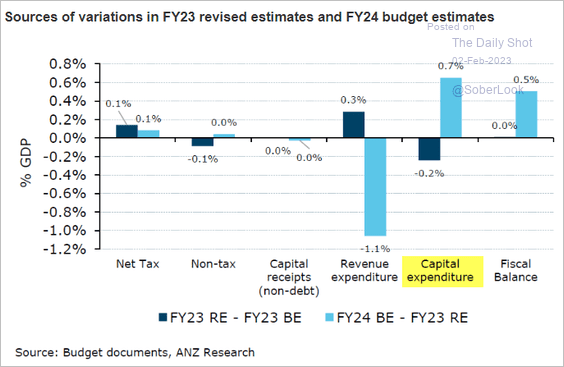
2. Are big increases in India’s infrastructure spending consistent with the deficit reduction goal (below 6%)?
 Source: ING
 Source: @ANZ_Research
• India’s manufacturing activity remains strong.
 Source: S&P Global PMI
——————–
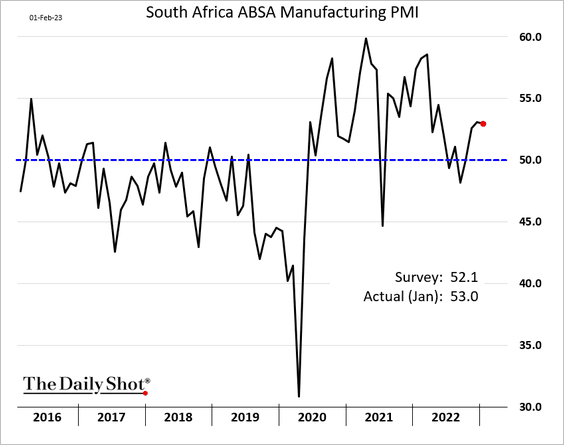
3. South Africa’s manufacturing growth has been robust.
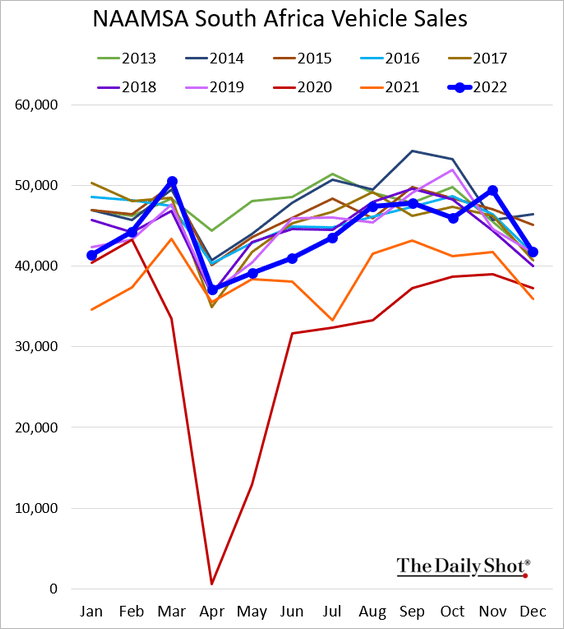
• Vehicle sales eased in December.
• South Africa’s terms of trade have risen meaningfully over the last two decades and more than in commodity-exporting economies such as Canada and New Zealand
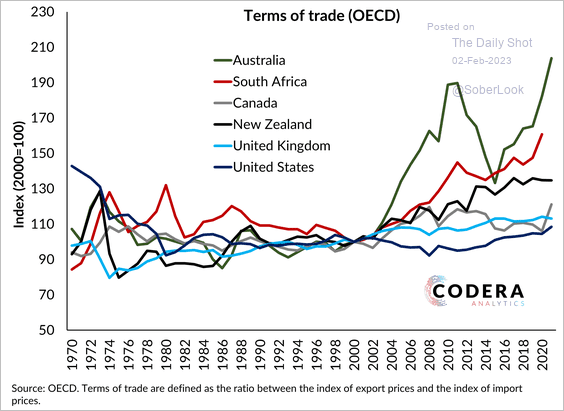 Source: Codera Analytics
——————–
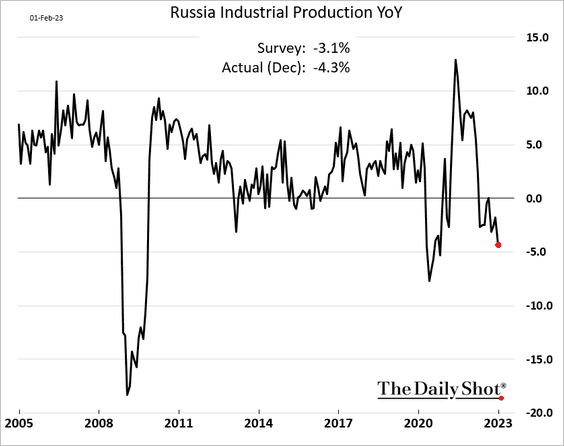
4. Russia’s industrial production shows some deterioration. Note that this is government data, which has to be taken with a “pinch of salt.”
5. Here is the stagflation risk score from Oxford Economics.
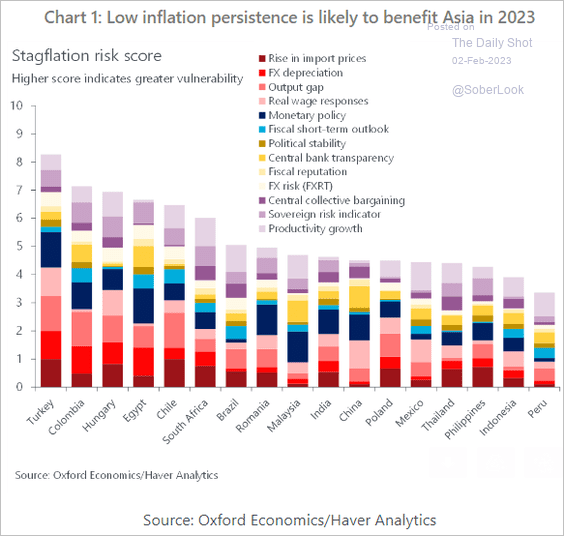 Source: Oxford Economics
Back to Index
Cryptocurrency
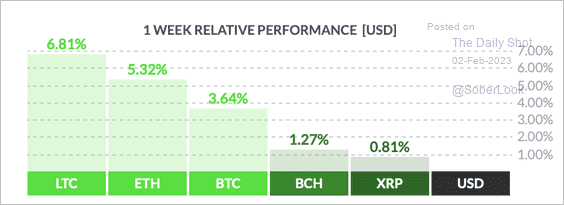
1. So far, it’s been a good week for cryptos, with litecoin (LTC) and ether (ETH) leading large-cap peers.
 Source: FinViz
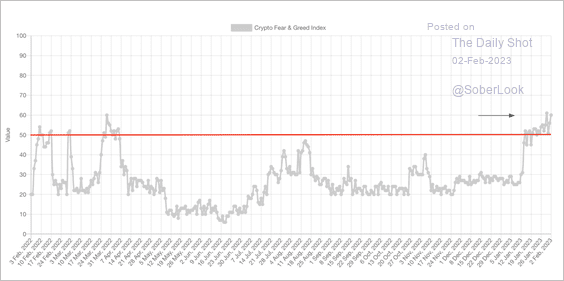
2. The Crypto Fear & Greed Index broke out into “greed” territory for the first time since March 2022.
 Source: Alternative.me
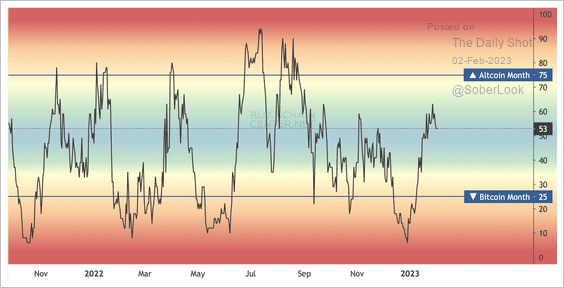
3. 53% of the top 50 coins have outperformed bitcoin over the past month as risk appetite among crypto traders improved.
 Source: Blockchain Center
4. Bitcoin’s put/call ratio is trending lower.
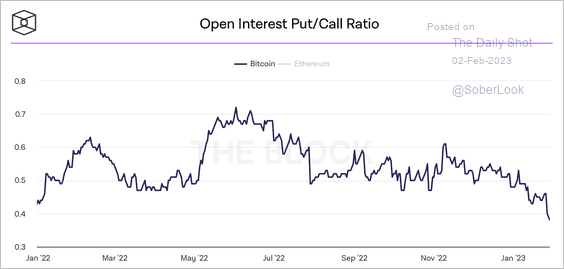 Source: The Block
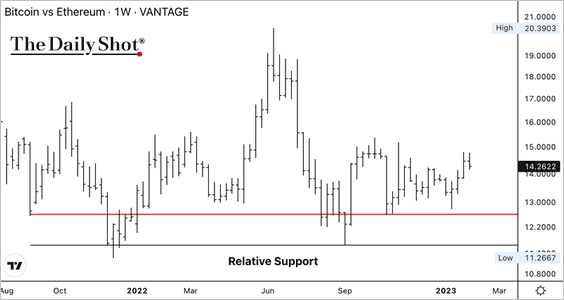
5. The BTC/ETH price ratio is holding long-term support. A breakout above 15 could indicate a pause in the crypto rally.
Back to Index
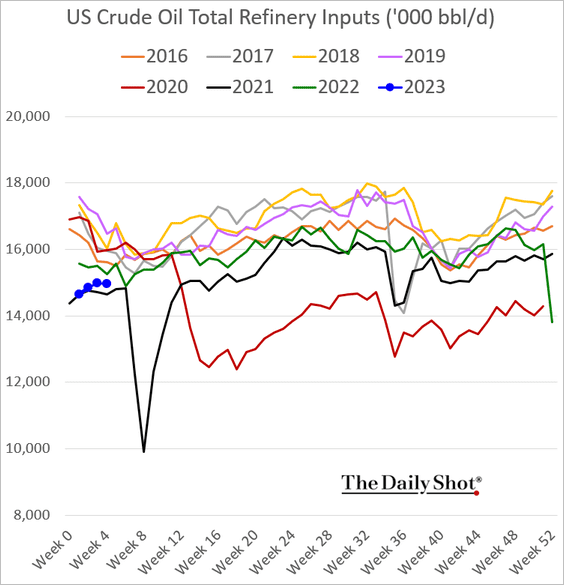
Energy
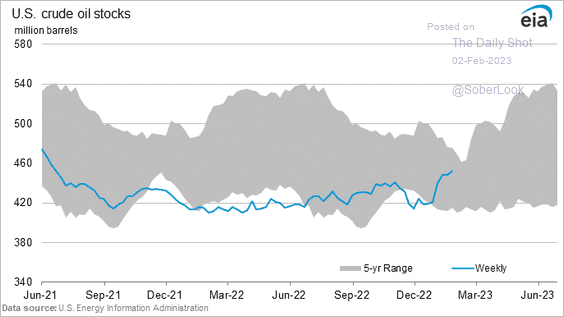
1. US oil inventories climbed further last week.
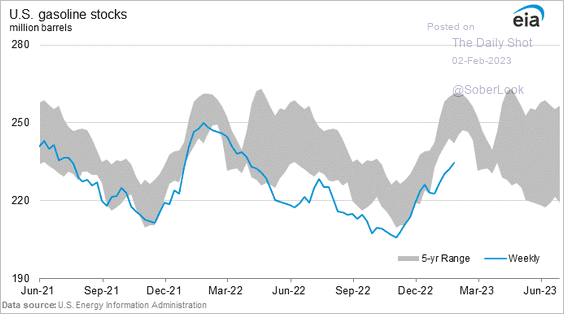
• Gasoline inventories remain depressed.
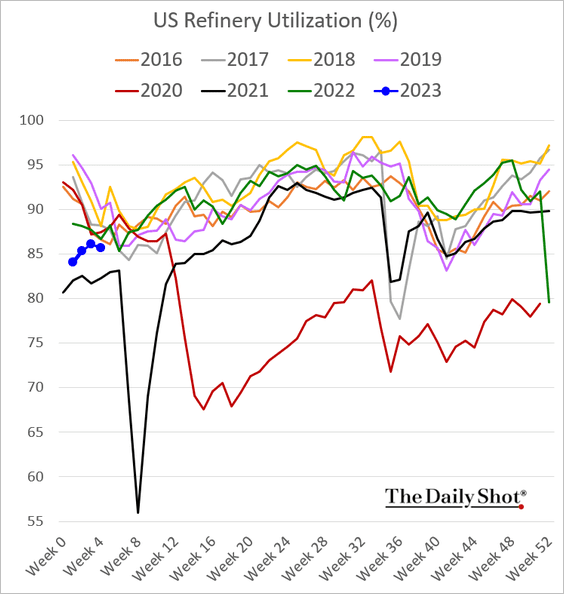
• Refinery runs and utilization have been soft for this time of the year.
——————–
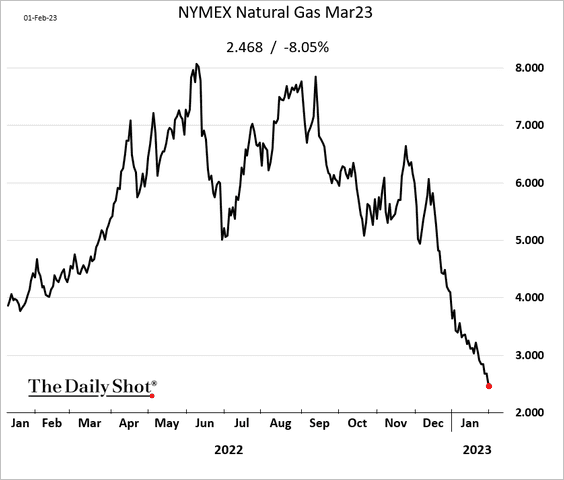
2. US natural gas futures dipped below $2.50/MMBtu.
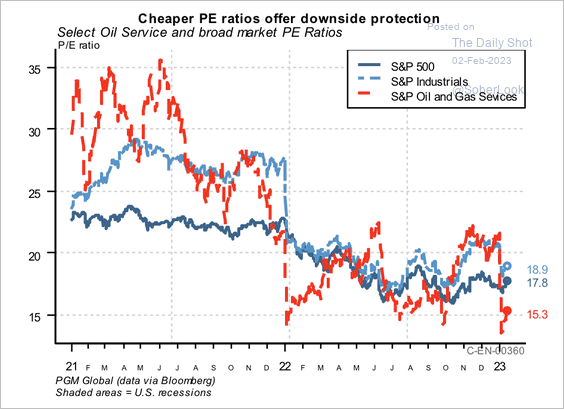
3. Earnings forecasts for leading US oil and gas exploration companies are holding up well despite the pullback in WTI’s spot price.
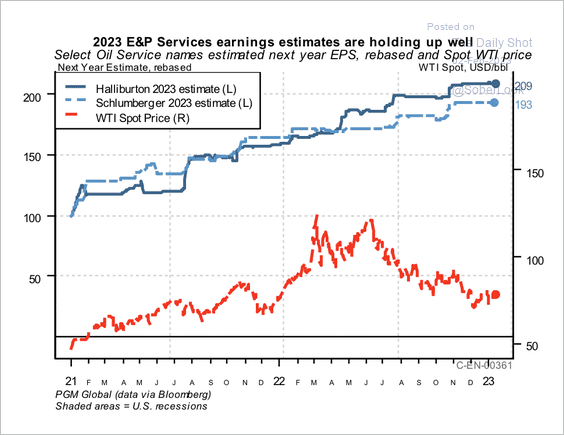 Source: PGM Global
• S&P 500 oil and gas services stocks are trading at relatively low valuations.
 Source: PGM Global
Back to Index
Equities
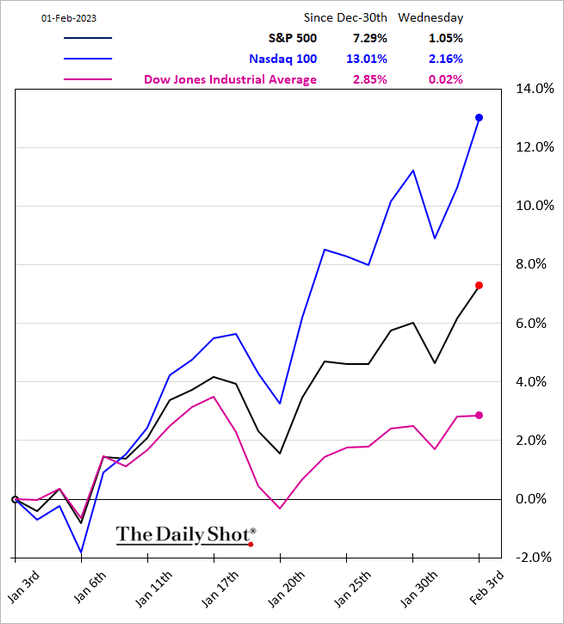
1. Nasdaq shares continue to outperform.
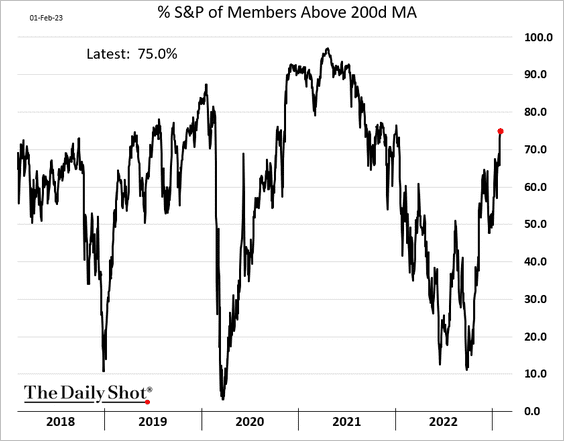
2. 75% of S&P 500 members are now above their 200-day moving average.
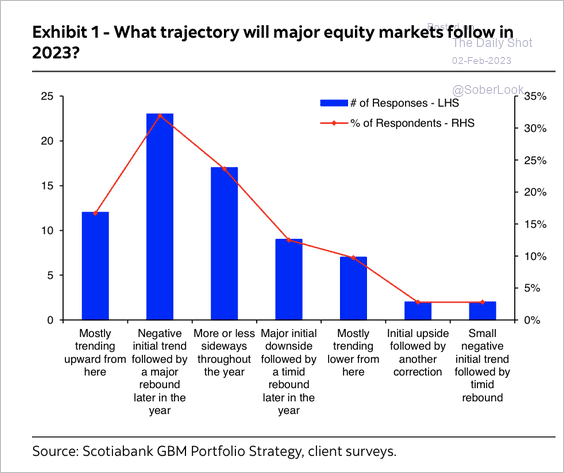
3. Here is the January performance of large-cap indices around the world.
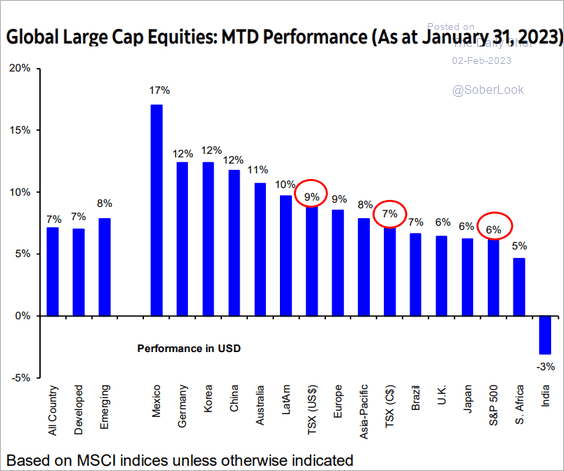 Source: Hugo Ste-Marie, Portfolio & Quantitative Strategy Global Equity Research, Scotia Capital
Global equities could see a negative initial trend followed by a major rebound later this year, according to a Scotiabank survey of institutional investors.
 Source: Hugo Ste-Marie, Portfolio & Quantitative Strategy Global Equity Research, Scotia Capital
——————–
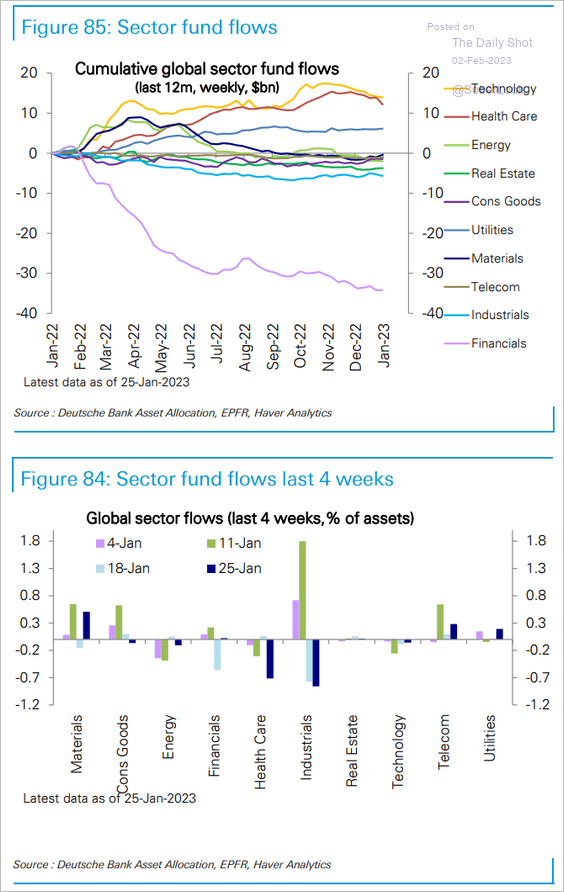
4. Healthcare funds are seeing some outflows.
 Source: Deutsche Bank Research
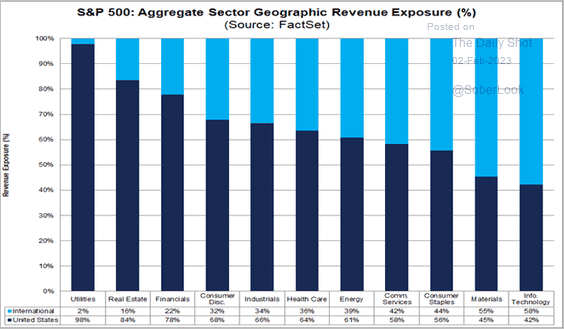
5. This chart shows geographic revenue exposure by sector.
 Source: FactSet
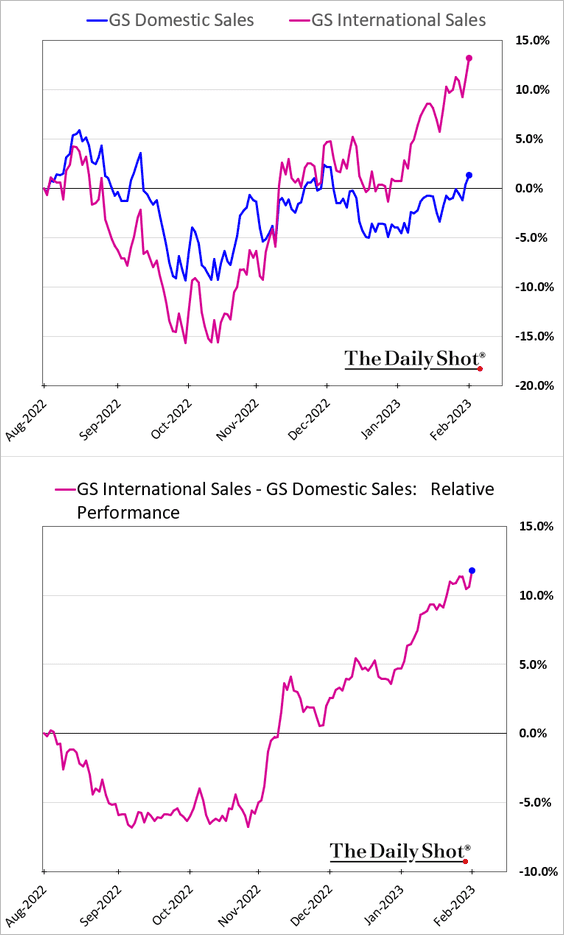
Companies with international sales exposure continue to outperform as the US dollar softens.
——————–
6. Forward earnings among US small caps have rolled over relative to S&P 500.
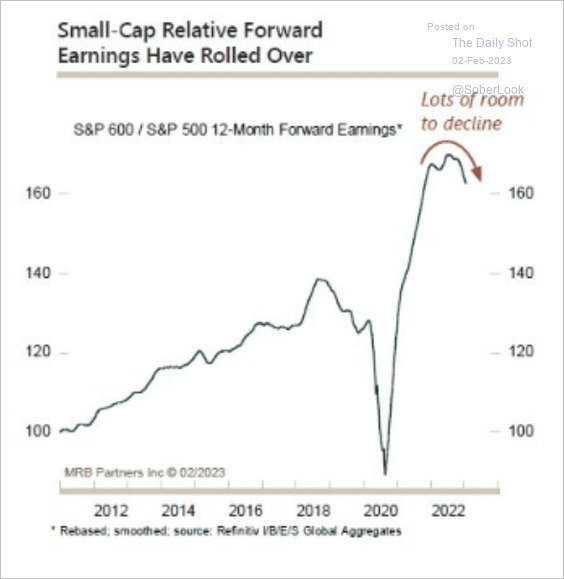 Source: MRB Partners
This chart shows small-cap returns throughout the election cycle.
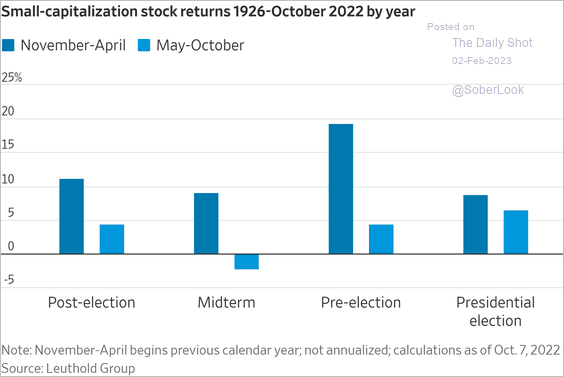 Source: @WSJ Read full article
——————–
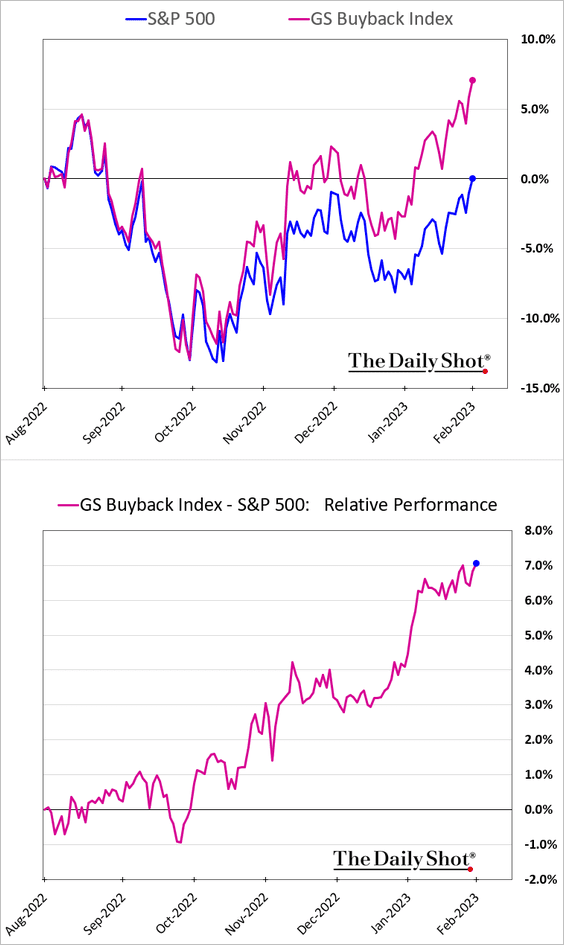
7. Companies known for share buybacks have been outperforming.
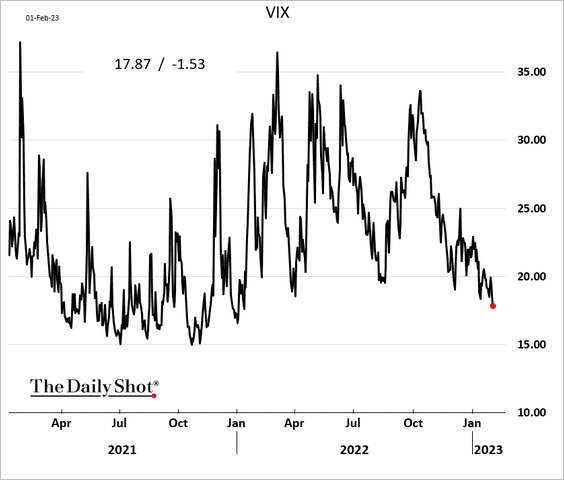
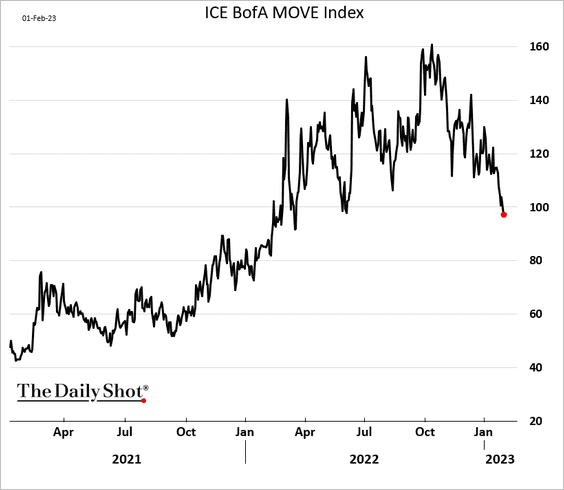
8. VIX dipped below 18 for the first time in over a year.
9. The decline in rates implied volatility (MOVE) could be a tailwind for stocks.
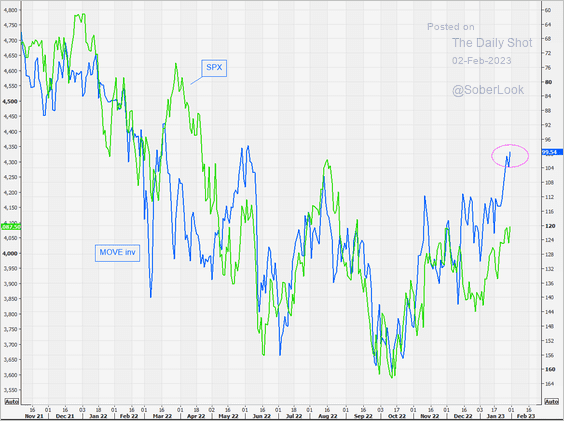 Source: @themarketear
Back to Index
Rates
1. Treasury implied vol continues to sink as inflation fears ease.
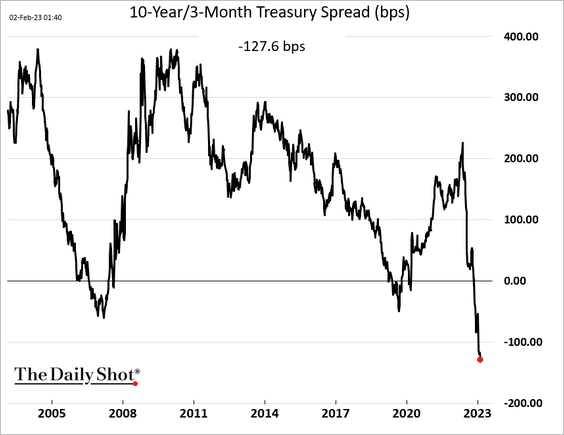
2. The Treasury curve inversion in this cycle has been remarkable.
Back to Index
Global Developments
1. Global inflationary pressures have reversed course. The main holdout has been a tight labor market across G7 nations.
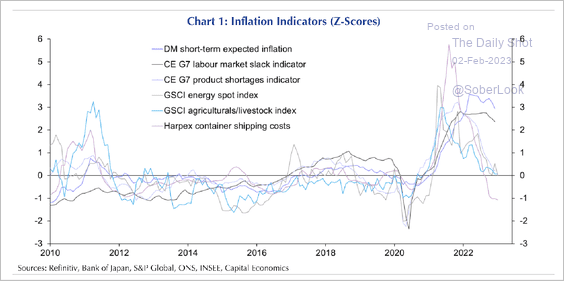 Source: Capital Economics
2. January was a strong month for global assets, following a challenging 2022.
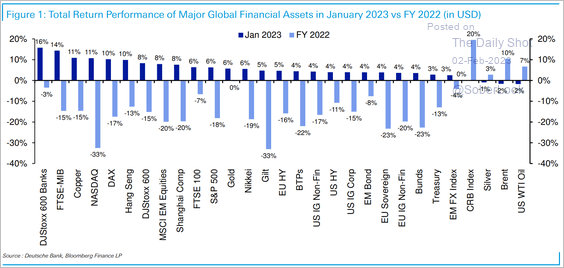 Source: Deutsche Bank Research
3. The rate of contraction in global manufacturing activity has slowed.
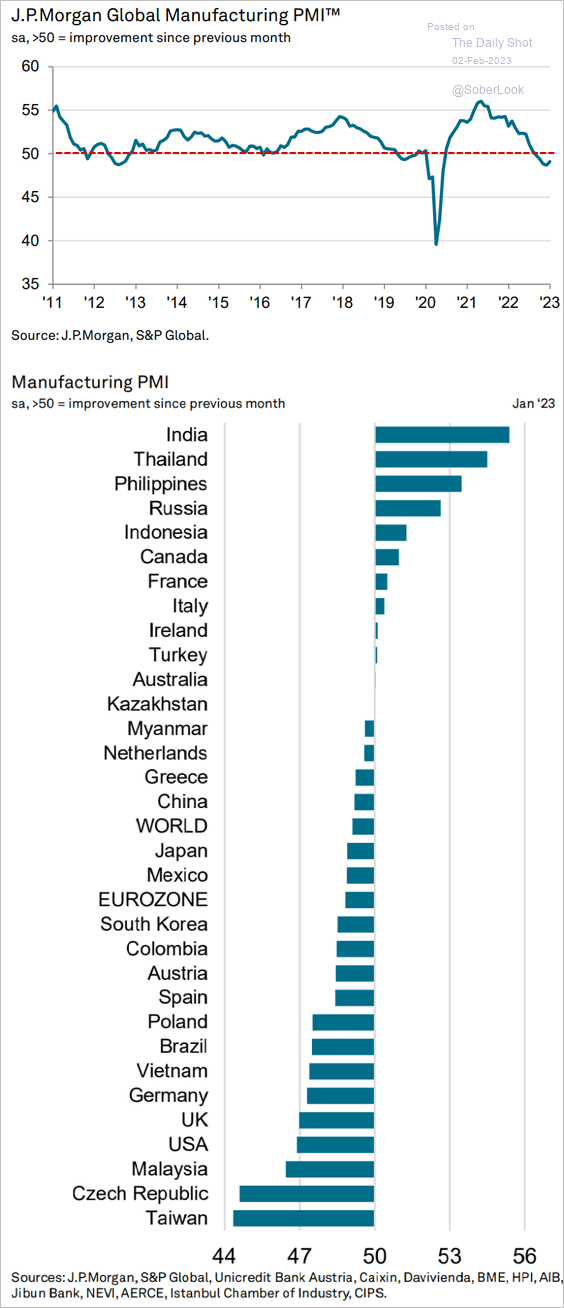 Source: S&P Global PMI
4. Trade as a share of GDP has not grown over the past decade.
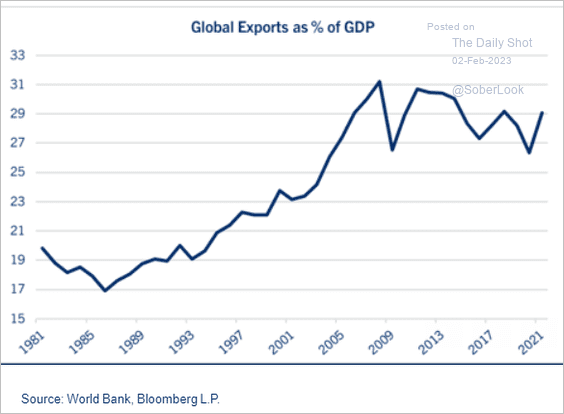 Source: John Lynch, Comerica Wealth Management
Here are the expected changes in global trade this year (from S&P Global Market Intelligence).
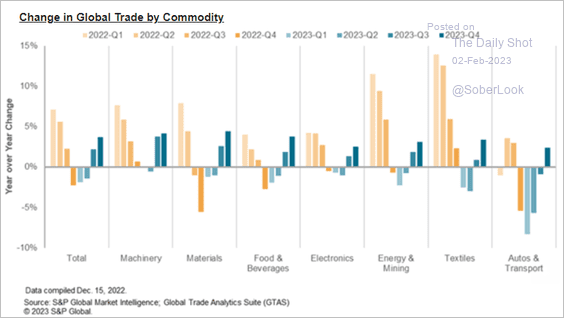 Source: S&P Global Market Intelligence
——————–
5. This chart compares World Bank ratings of public infrastructure in major economies.
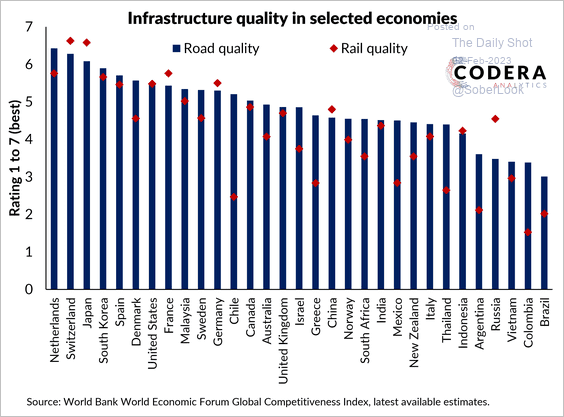 Source: Codera Analytics Read full article
——————–
Food for Thought
1. Cars with the longest potential lifespan:
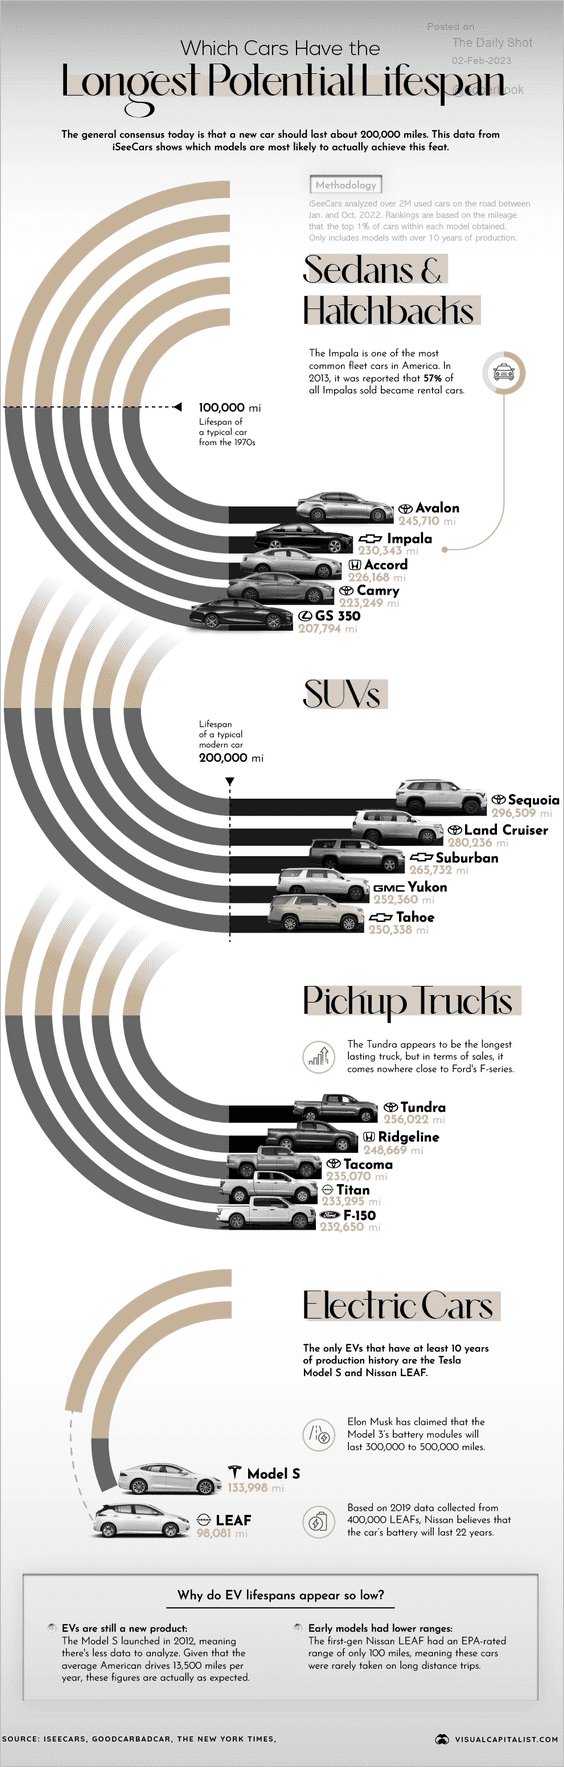 Source: Visual Capitalist Read full article
2. Tesla’s order backlog:
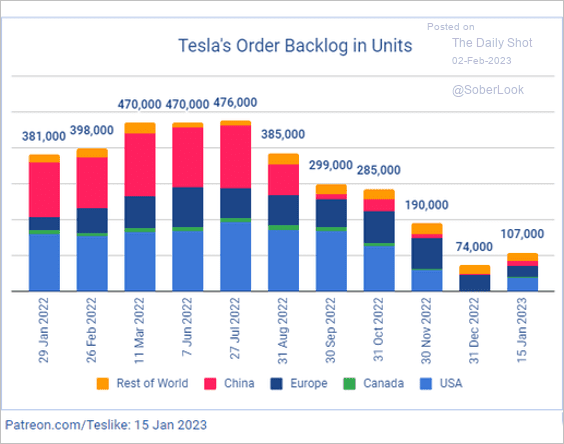 Source: @TroyTeslike Read full article
3. Boeing’s airplane deliveries:
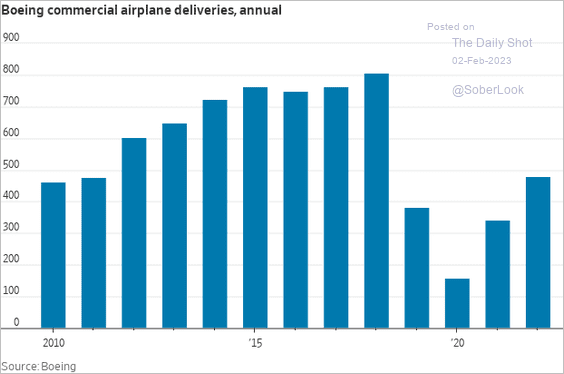 Source: @WSJ Read full article
4. US consumer price changes in key goods:
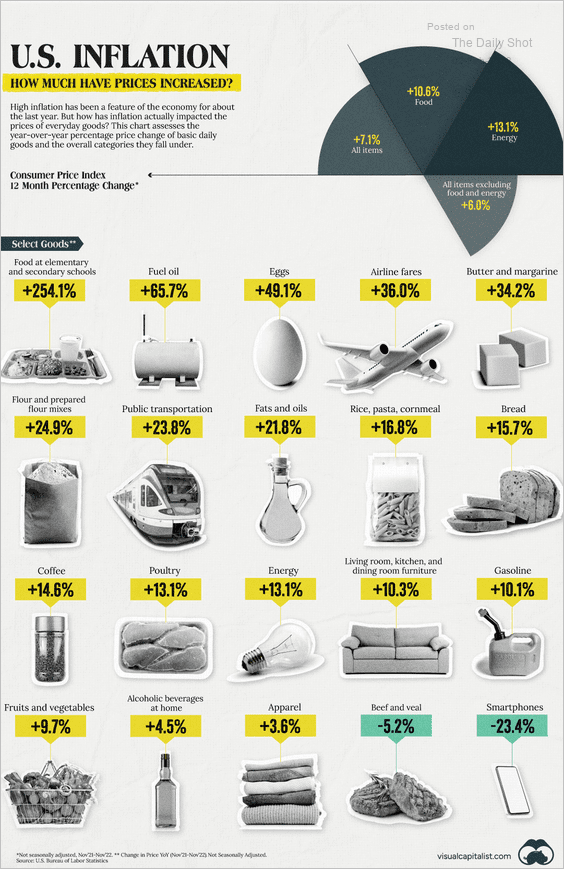 Source: Visual Capitalist Read full article
5. Individuals’ motives for mass attacks:
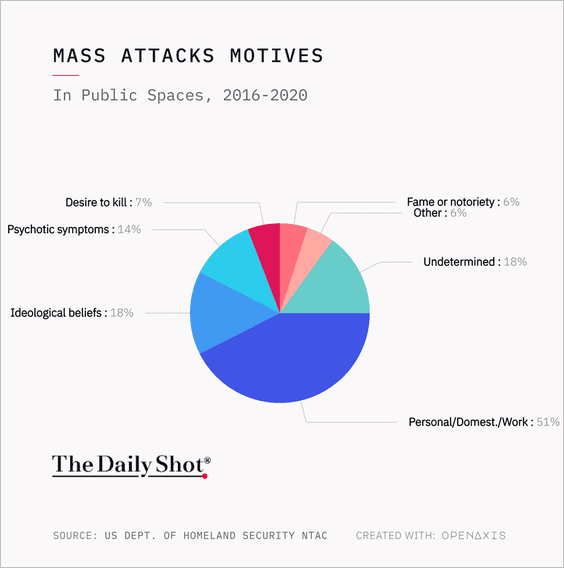 Source: @OpenAxisHQ
6. Percentage of in-state contributions to Senate campaigns:
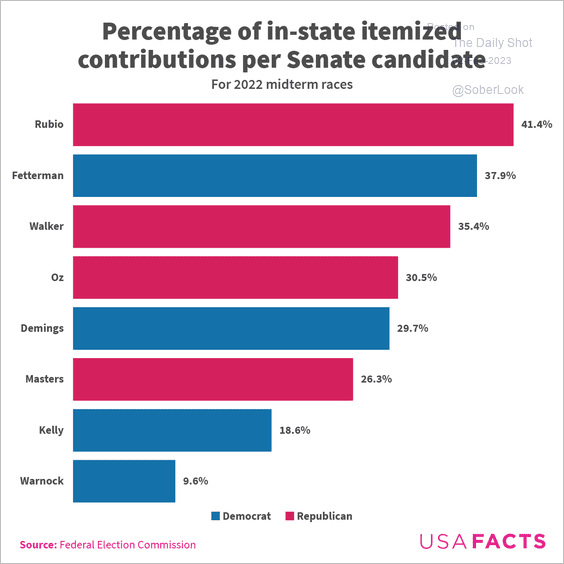 Source: USAFacts
7. It’s Groundhog Day. Here are some stats.
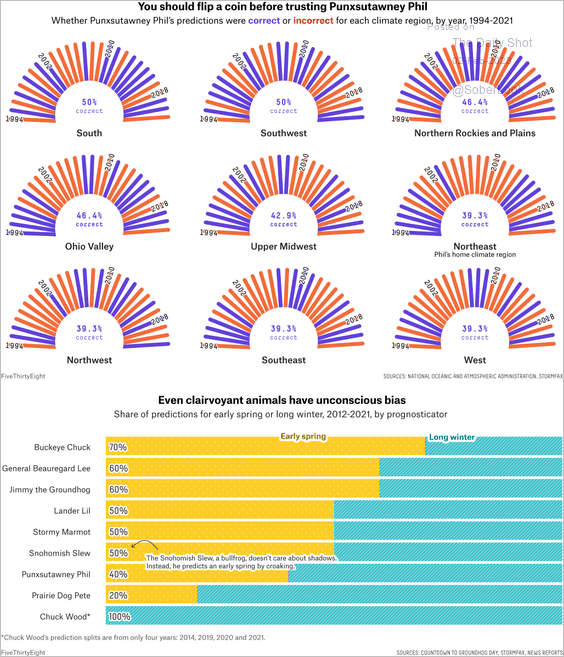 Source: FiveThirtyEight Read full article
——————–
Back to Index