
The Daily Shot: 03-Feb-23
• The United States
• Canada
• The United Kingdom
• The Eurozone
• China
• Emerging Markets
• Commodities
• Energy
• Equities
• Rates
• Food for Thought
The United States
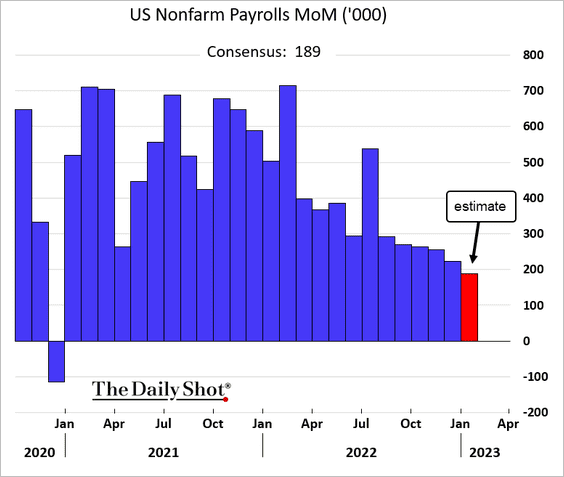
1. Let’s begin with some updates on the labor market.
• Forecasters expect to see another step-down in hiring last month but still a healthy gain by historical standards.
• Economists consistently underestimated US job gains last year.
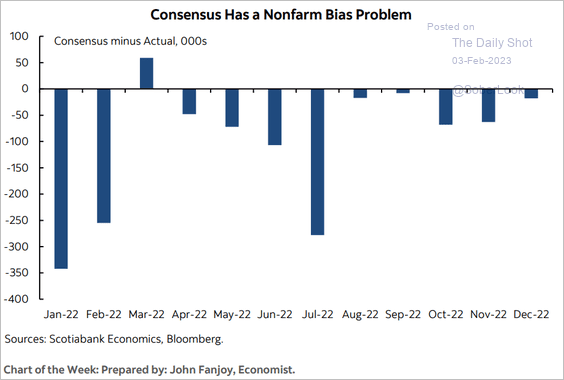 Source: Scotiabank Economics
• Employment growth has slowed the most in cycle-sensitive sectors.
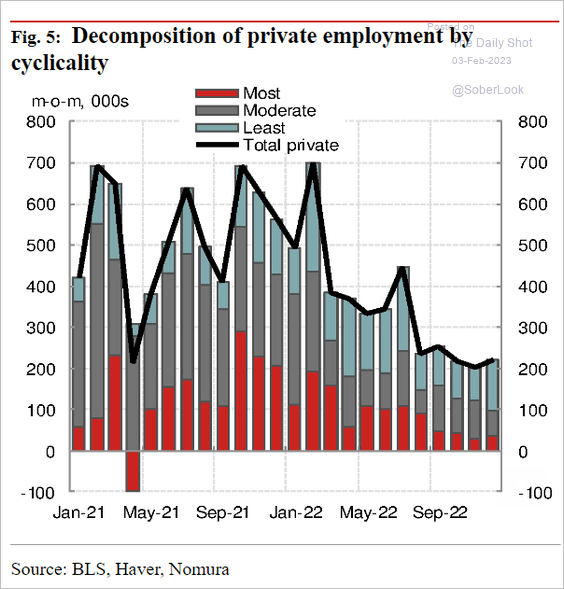 Source: Nomura Securities
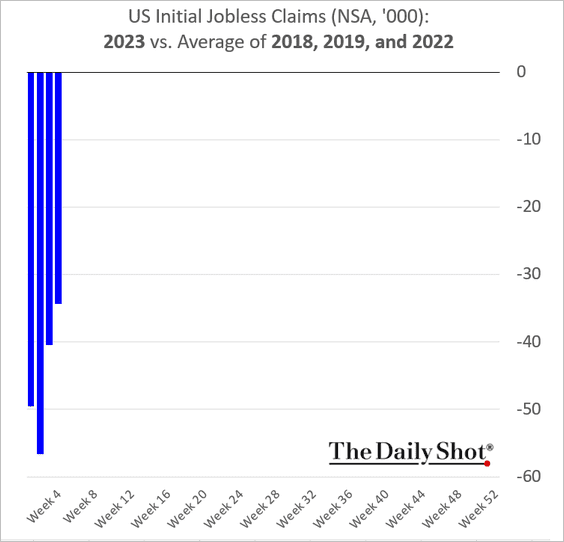
• Initial jobless applications remain low for this time of the year.
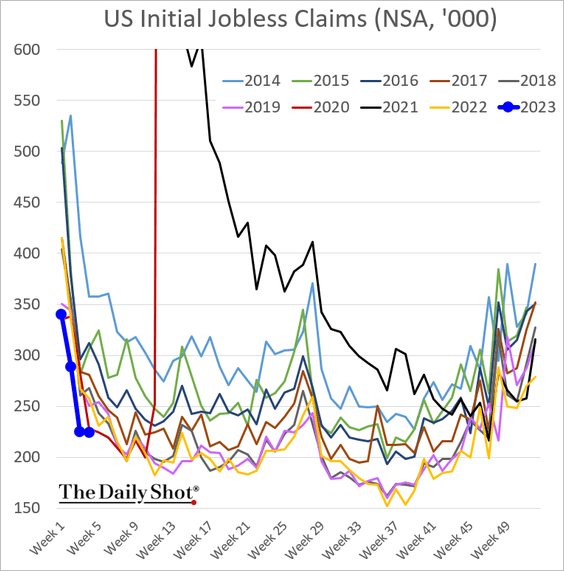
Here is the comparison with 2018, 2019, and 2022.
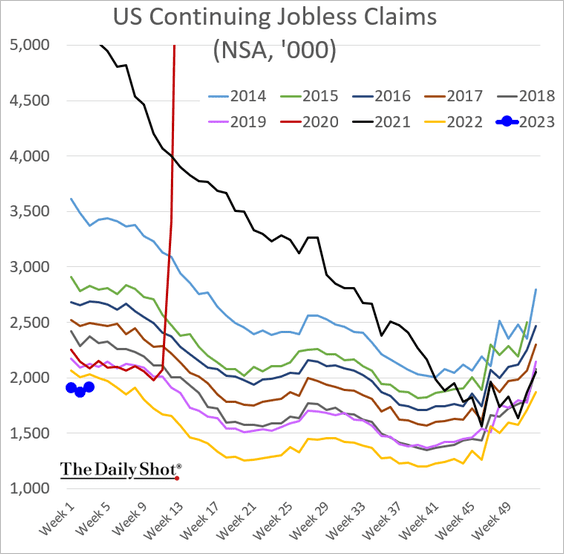
And this chart shows US continuing unemployment claims.
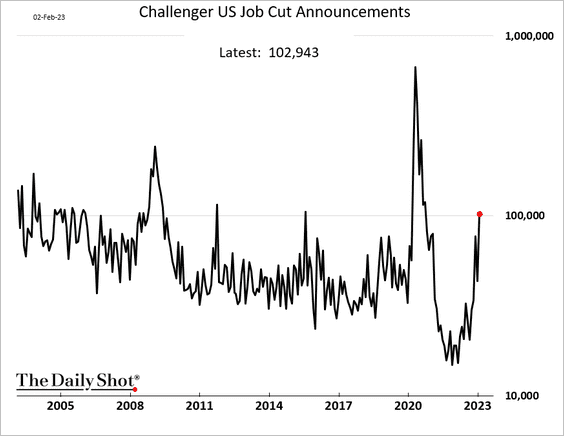
• Job cuts exceeded 100k in January. Many of these have been in the tech industry, with a number of tech workers quickly finding employment elsewhere (for example, in the automotive sector).
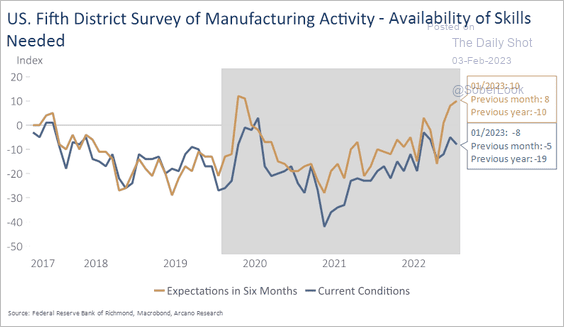
• Richmond Fed reported that the region’s manufacturers expect a boost in skilled labor availability in six months as the jobs market softens.
 Source: Arcano Economics
• Job openings should begin to ease in the months ahead.
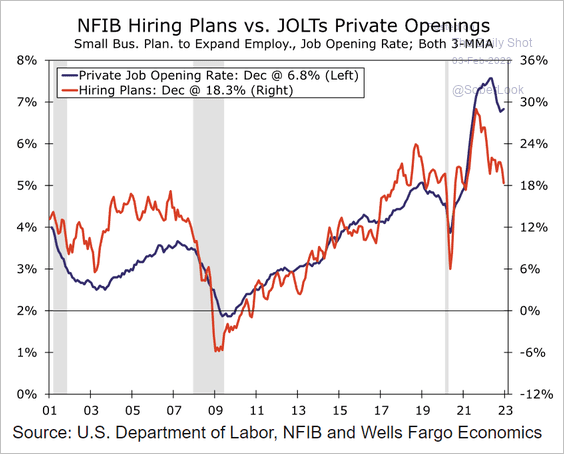 Source: Wells Fargo Securities
——————–
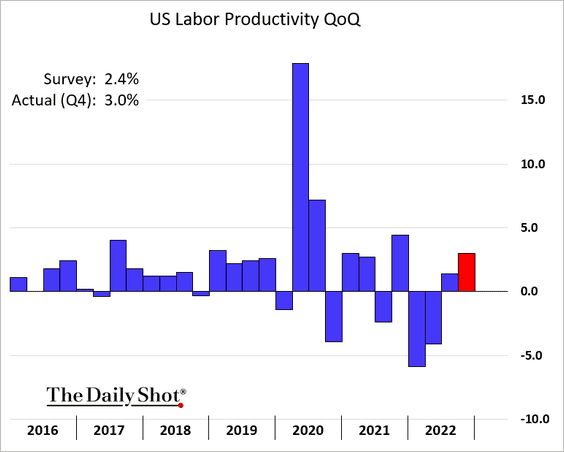
2. Unit labor costs increased less than expected last quarter, …
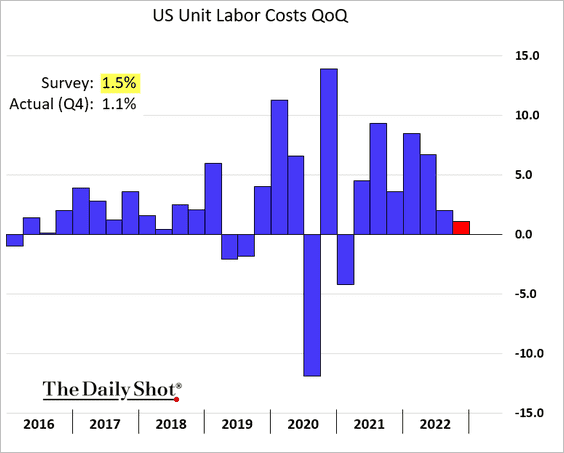
… while productivity improved. These trends should help ease inflation.
The chart below shows the level of labor productivity over time.
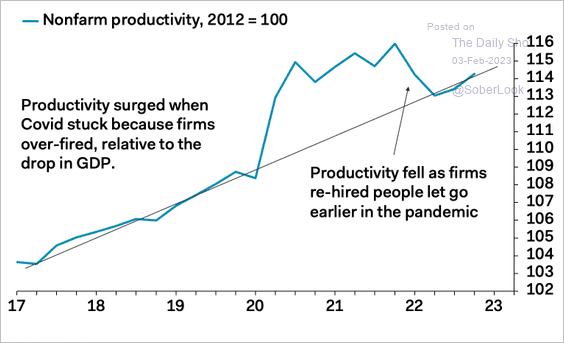 Source: Pantheon Macroeconomics
——————–
3. There has been a growing disconnect between consumption and real income.
 Source: Numera Analytics (@NumeraAnalytics)
4. Construction spending softened further in December.
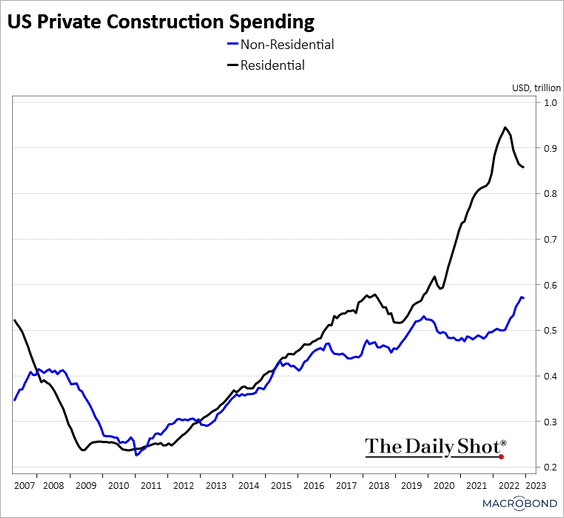 Source: Chart and data provided by Macrobond
 Source: MarketWatch Read full article
• Architecture billings have been soft.
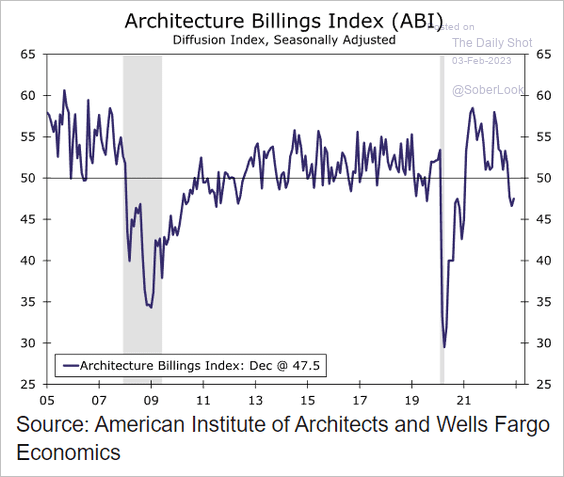 Source: Wells Fargo Securities
• Construction costs climbed 8% last year.
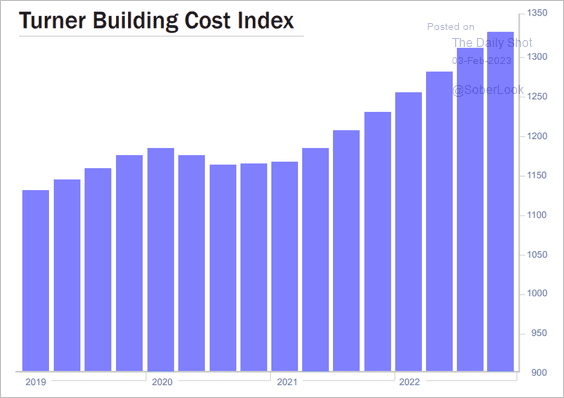 Source: Turner
——————–
5. Numera Analytics sees greater risk of a deeper recession – up to -2.7% GDP contraction. That’s equivalent to full-year losses in 2008 and 2020. There is only a 12% chance of above-trend GDP growth this year.
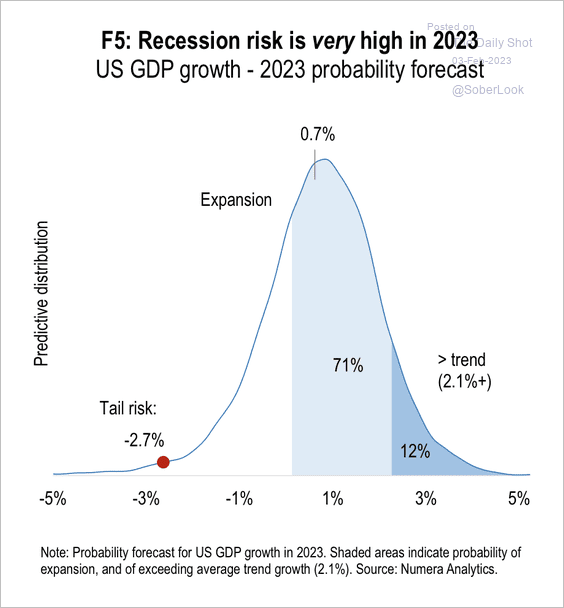 Source: Numera Analytics (@NumeraAnalytics)
• However, NBER indicators do not signal a recession for now.
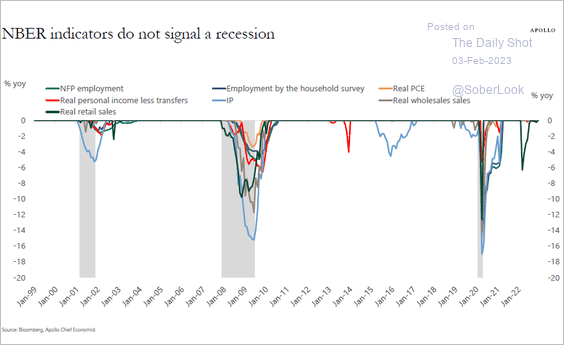 Source: Torsten Slok, Apollo
• Forecasters tend to overestimate US economic growth in recessions.
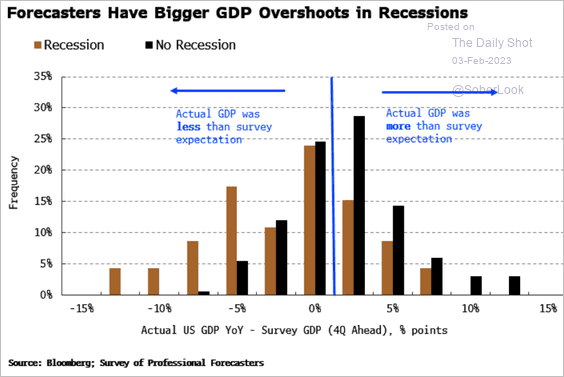 Source: Simon White, Bloomberg Markets Live Blog
——————–
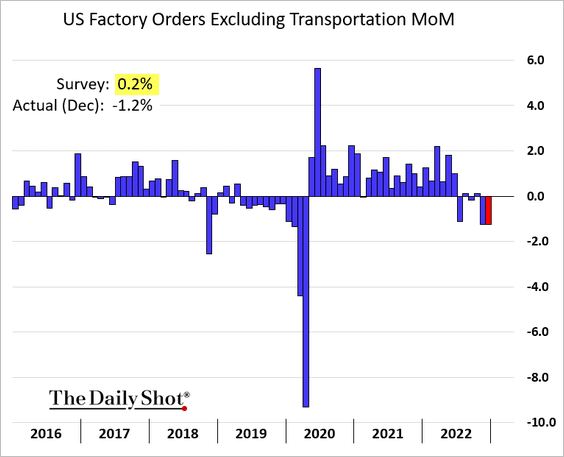
6. Factory orders continued to soften in December.
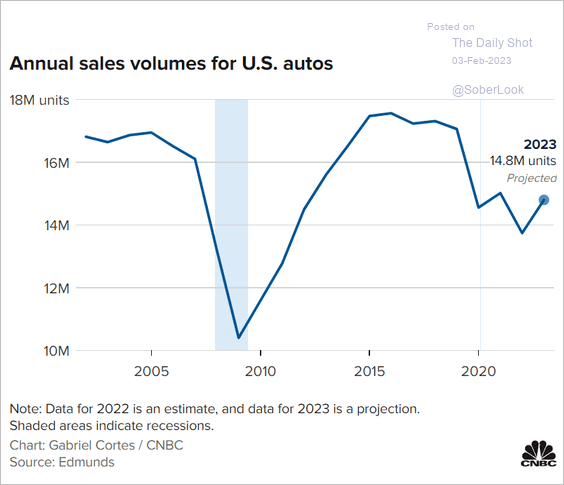
7. Automobile sales surprised to the upside in January.
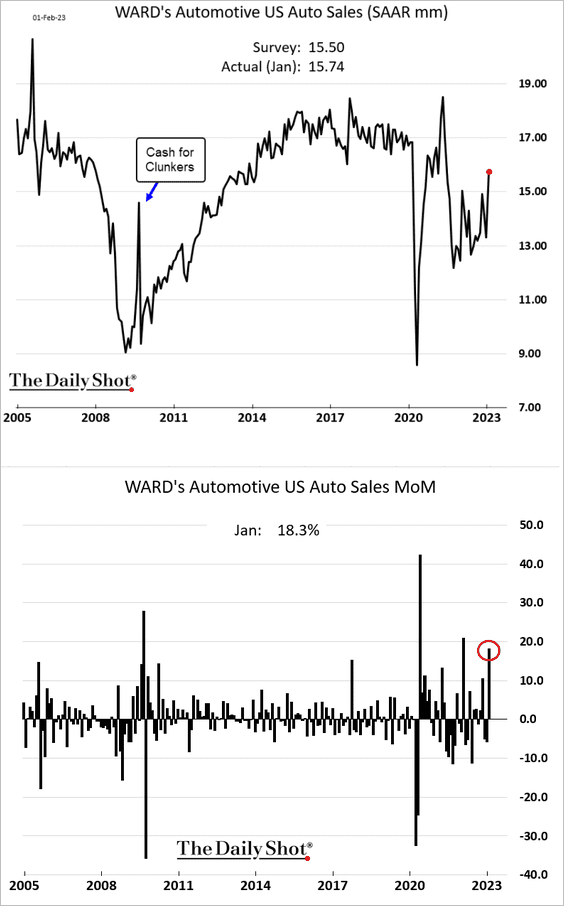
Analysts expect a rebound in sales this year (still below 2021 levels).
 Source: CNBC Read full article
Back to Index
Canada
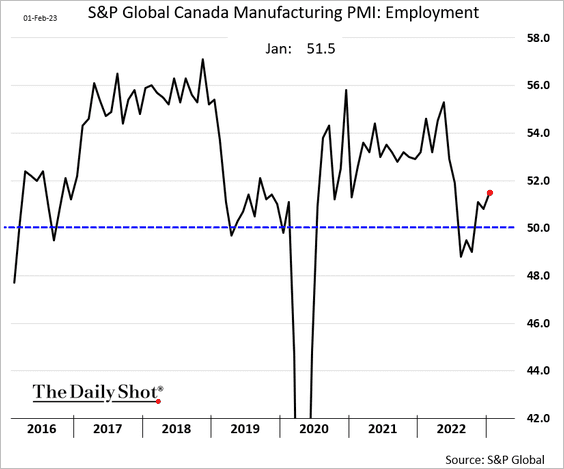
1. Canada’s manufacturing returned to growth last month, according to S&P Global.
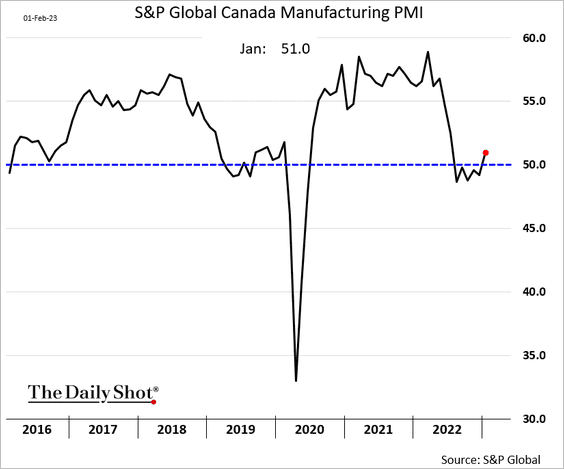
Factory hiring has picked up momentum.
——————–
2. Home sales will bottom at the end of the year, according to Oxford Economics.
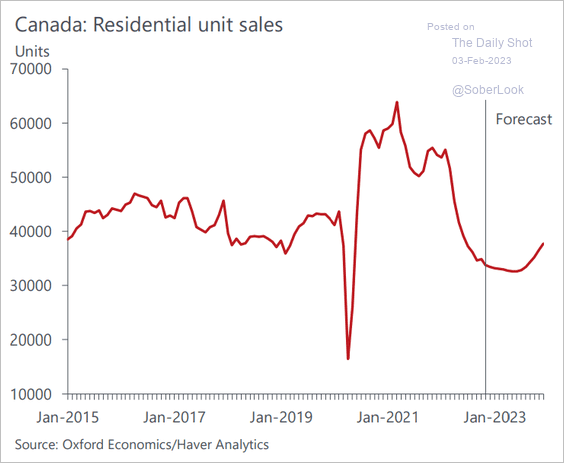 Source: Oxford Economics
• House prices will stabilize after a 30% drop from the peak.
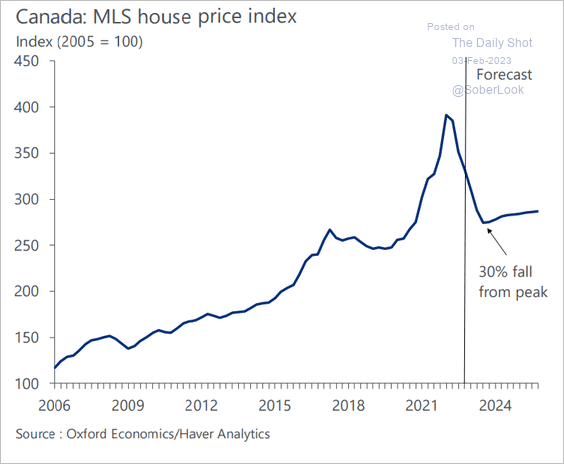 Source: Oxford Economics
• According to Capital Economics,
For several years, [property] investors have been willing to accept negative cash flows – with borrowing and other costs exceeding rental income – on the assumption that this would be more than offset by an increase in capital values.
Here is the situation in the Toronto metro area.
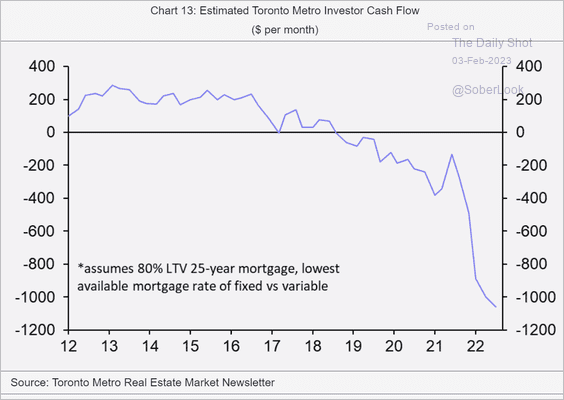 Source: Capital Economics
Back to Index
The United Kingdom
• The BoE hiked rates by 50 bps, …
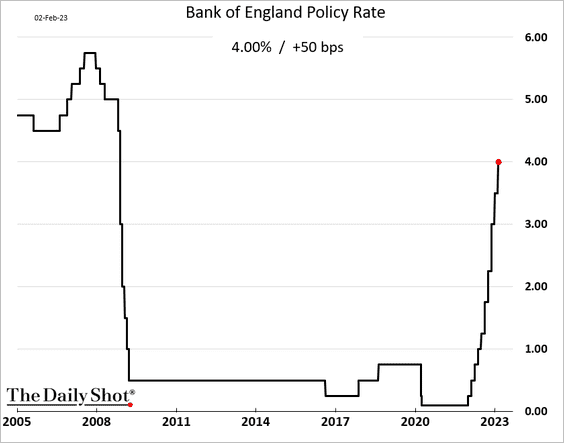
… amid elevated inflation and wage growth.
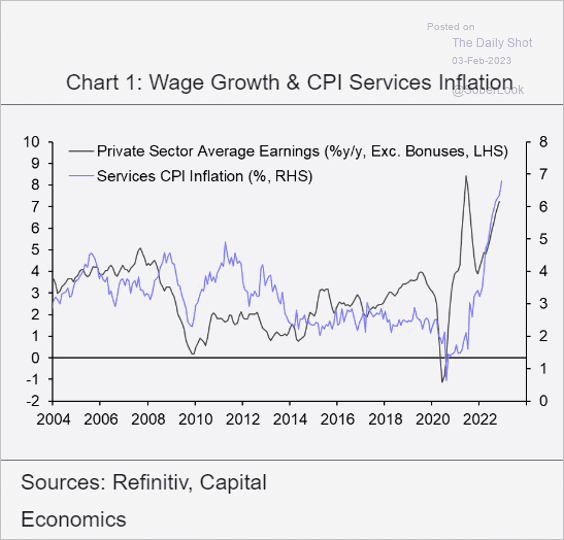 Source: Capital Economics
• Here is the MPC voting record.
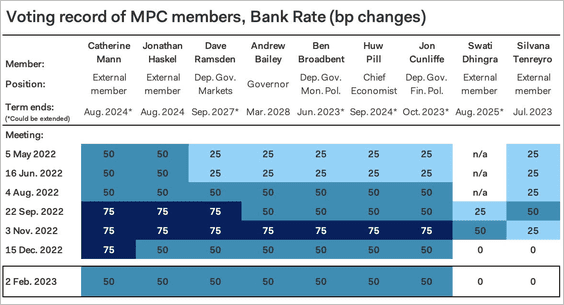 Source: Pantheon Macroeconomics
• The central bank significantly downgraded its inflation projections, …
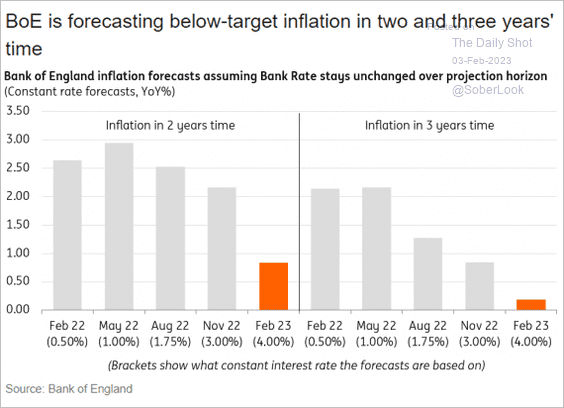 Source: ING
… amid recession concerns.
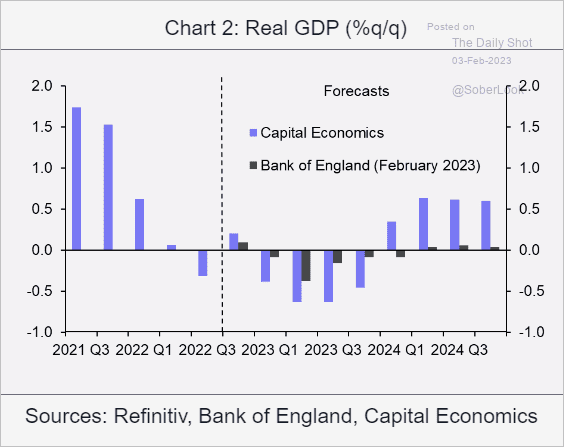 Source: Capital Economics
• Expectations for the short-term rate path downshifted meaningfully on Thursday, with the market sensing a dovish shift from the BoE.
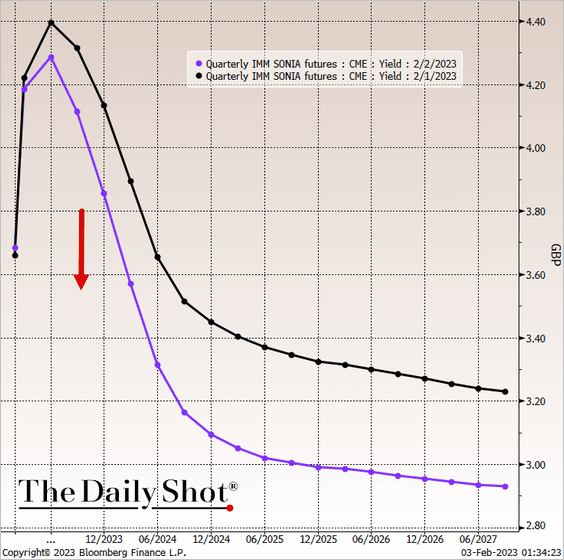 Source: @TheTerminal, Bloomberg Finance L.P.
Back to Index
The Eurozone
1. The ECB boosted rates by 50 bps.
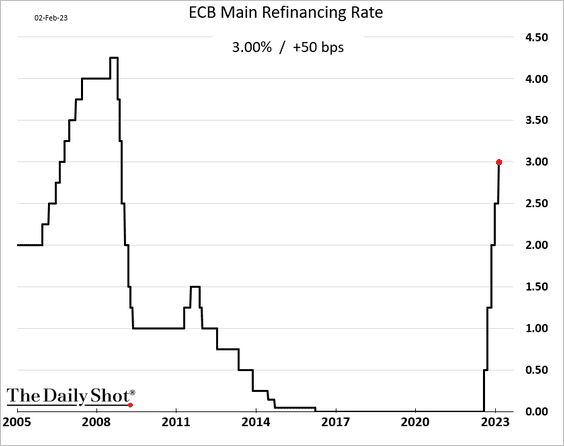
As in the UK, the market moved the expected rate path lower. However, unlike the BoE, the ECB gave no dovish signals.
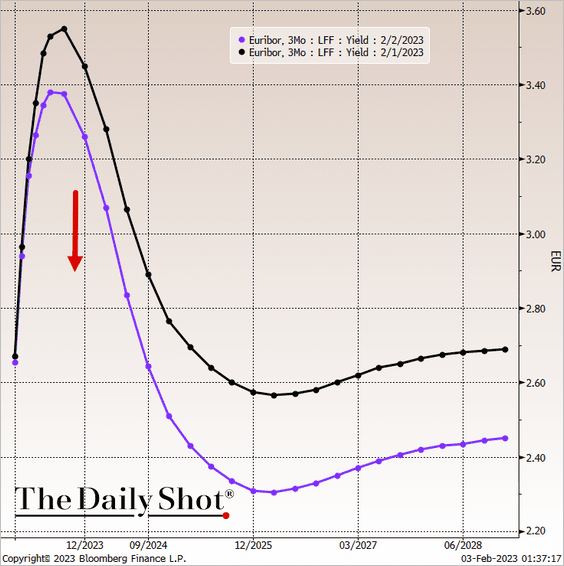 Source: @TheTerminal, Bloomberg Finance L.P.
More rate hikes are coming.
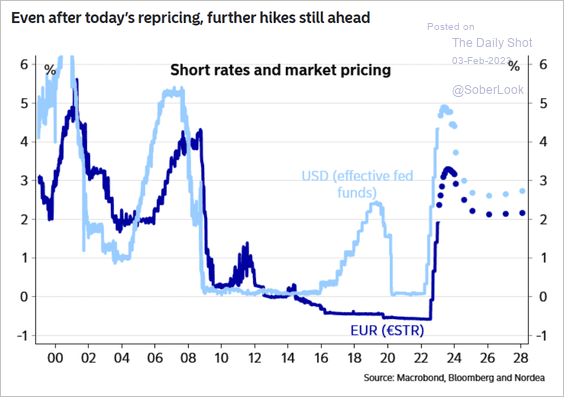 Source: Nordea Markets
——————–
2. Credit conditions have deteriorated over the past year.
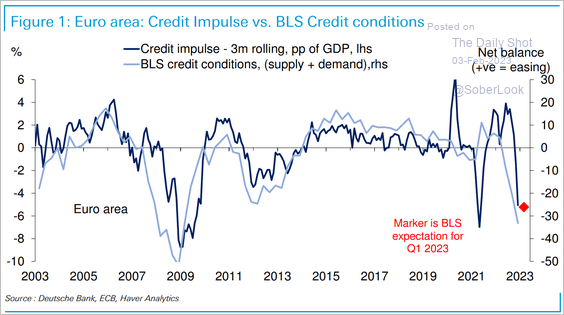 Source: Deutsche Bank Research
Credit demand has been soft.
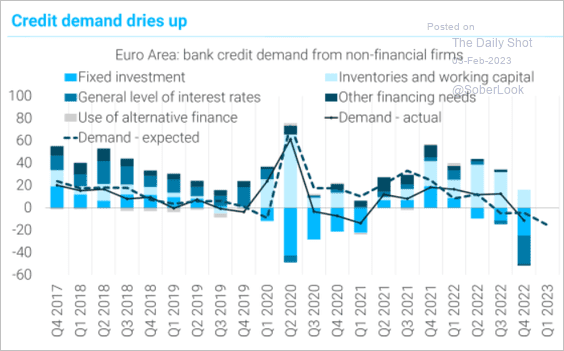 Source: TS Lombard
——————–
3. Households and businesses shifted cash to longer maturities as rates climbed.
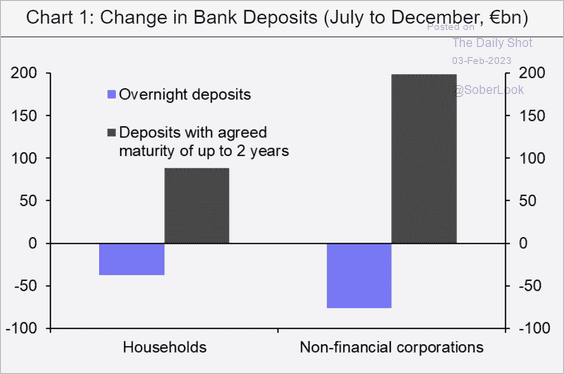 Source: Capital Economics
The saving rate continued to ease in Q3.
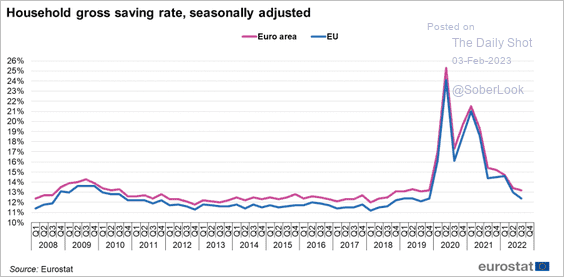 Source: Eurostat Read full article
——————–
4. German exports tumbled in December.
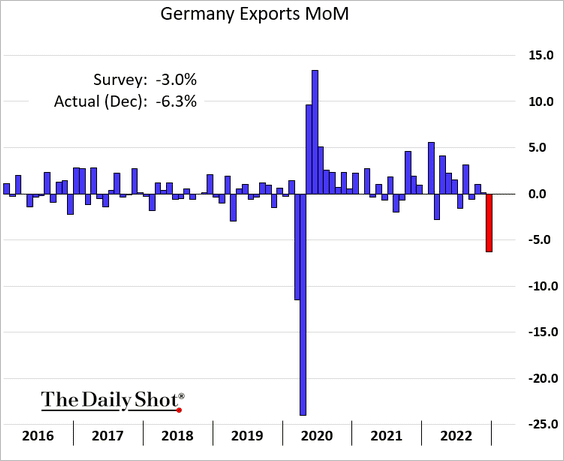
 Source: Reuters Read full article
This chart shows German online sales.
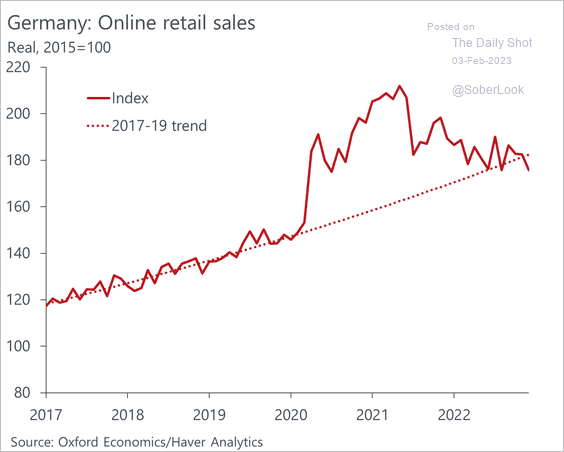 Source: Oxford Economics
——————–
5. The euro was under pressure from portfolio outflows over the past couple of years.
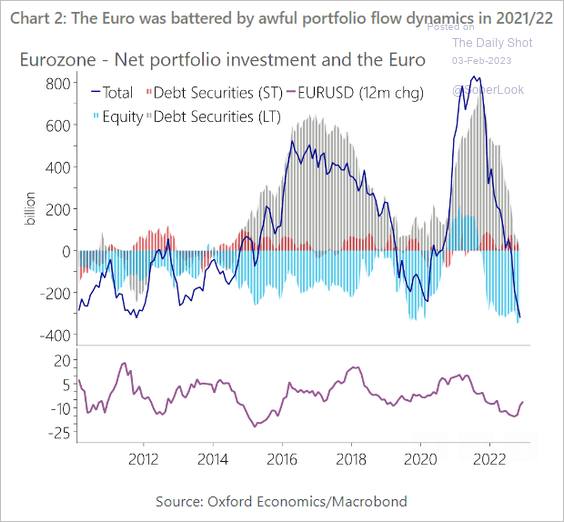 Source: Oxford Economics
The euro is back to fair value, according to Oxford Economics.
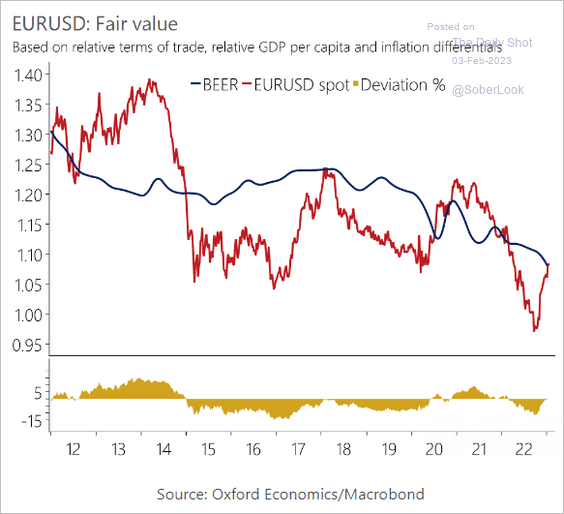 Source: Oxford Economics
——————–
6. The euro-area GDP outpaced the US and China last year.
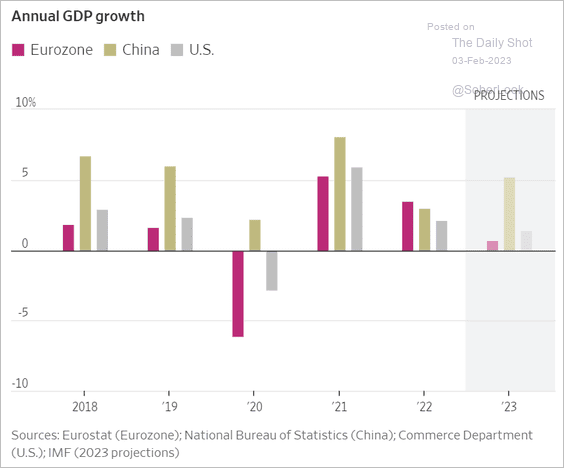 Source: @WSJ Read full article
Here is the GDP growth by country.
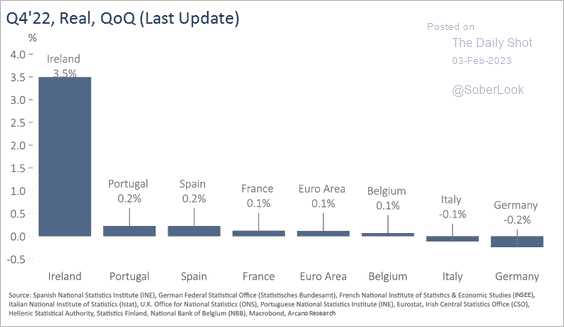 Source: Arcano Economics
• Tight liquidity will continue to be a drag on euro-area growth.
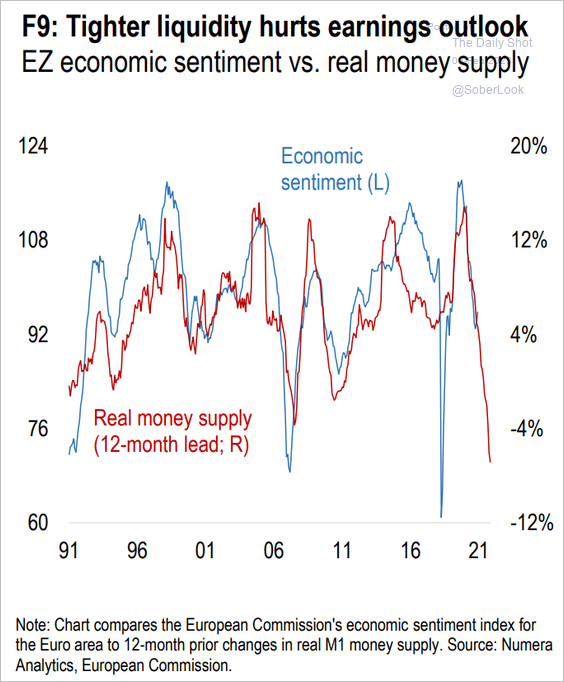 Source: Numera Analytics (@NumeraAnalytics)
• Growth in exports to China appears to have bottomed.
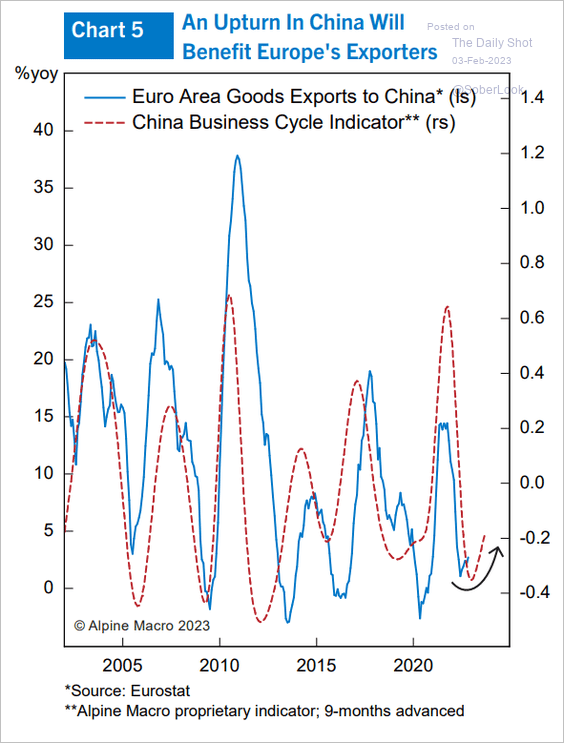 Source: Alpine Macro
Back to Index
China
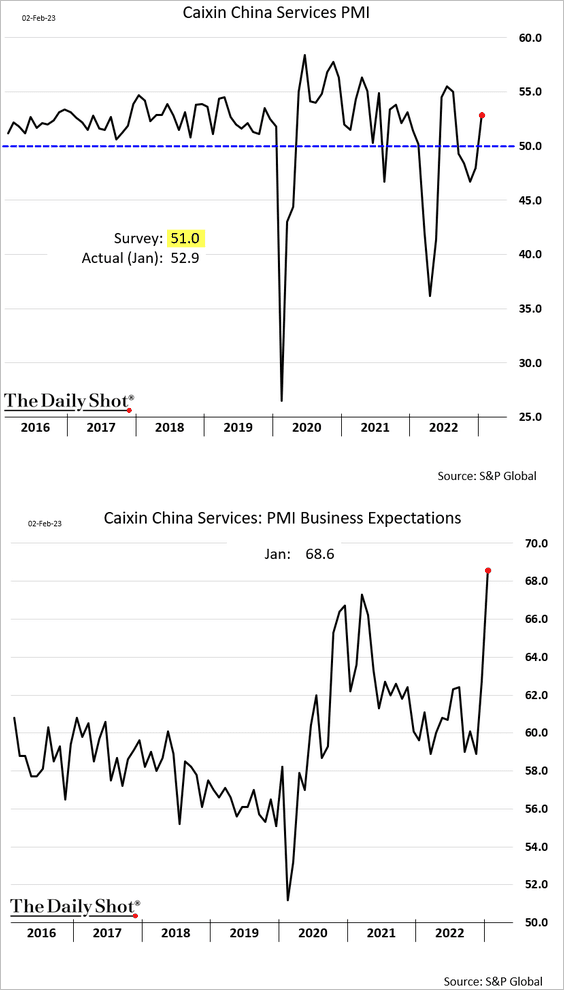
1. The PMI report from S&P Global showed services returning to growth last month. Companies haven’t been this optimistic in years (2nd panel) as China reopened.
2. Investment kept the Q4 GDP growth from going negative.
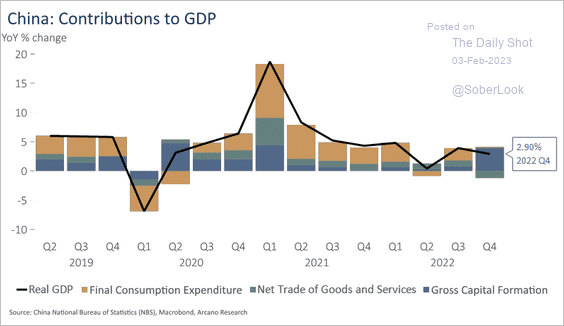 Source: Arcano Economics
3. This chart from China Beige Book shows the latest corporate borrowing trends.
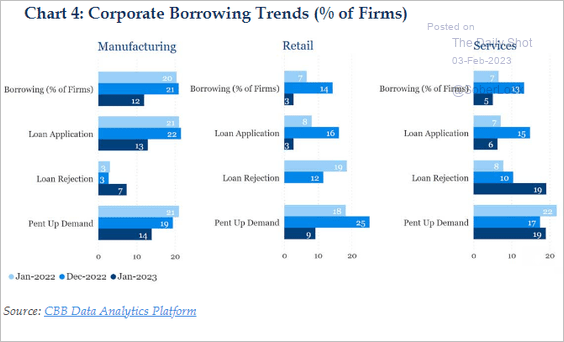 Source: China Beige Book
4. The working-age population is shrinking, which means companies will focus on boosting productivity.
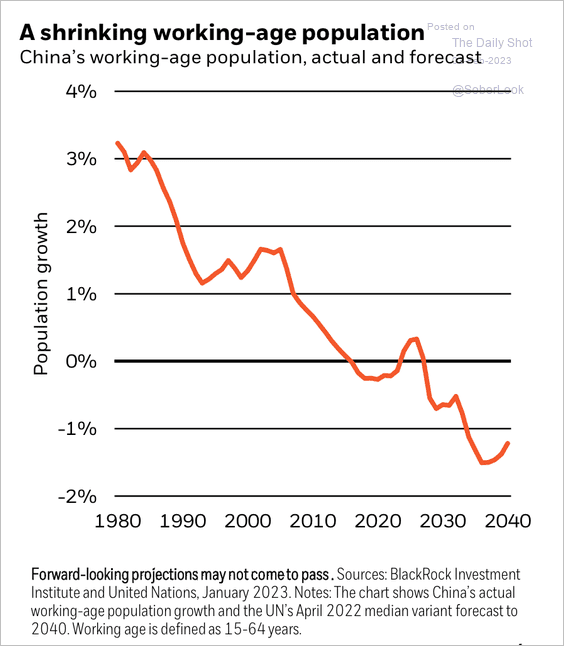 Source: BlackRock Investment Institute
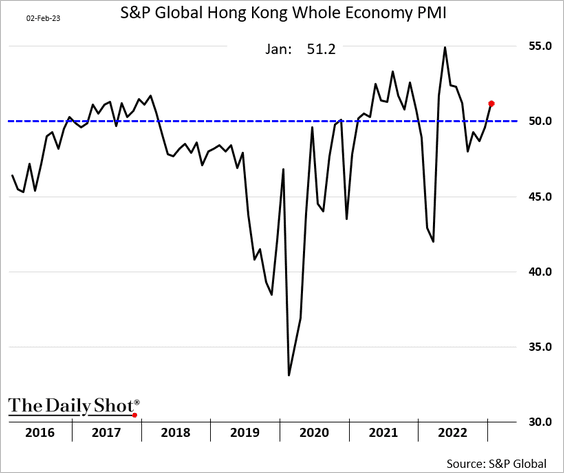
5. Hong Kong’s economy was flat in Q4 (a 2% gain was expected).
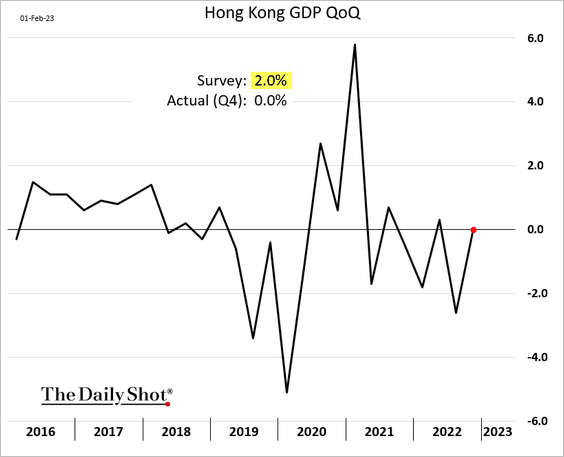
However, the January PMI report shows growth returning. Tourism should help Hong Kong’s recovery going forward.
Back to Index
Emerging Markets
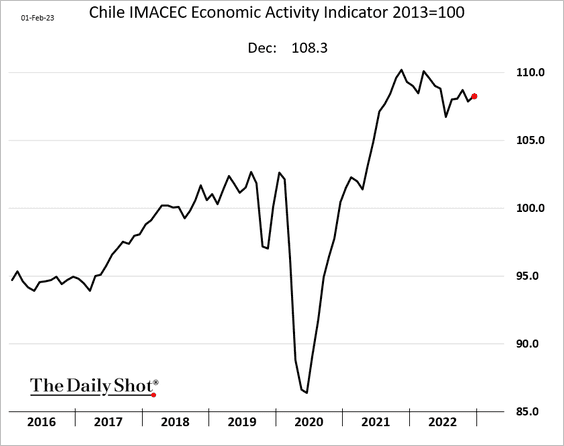
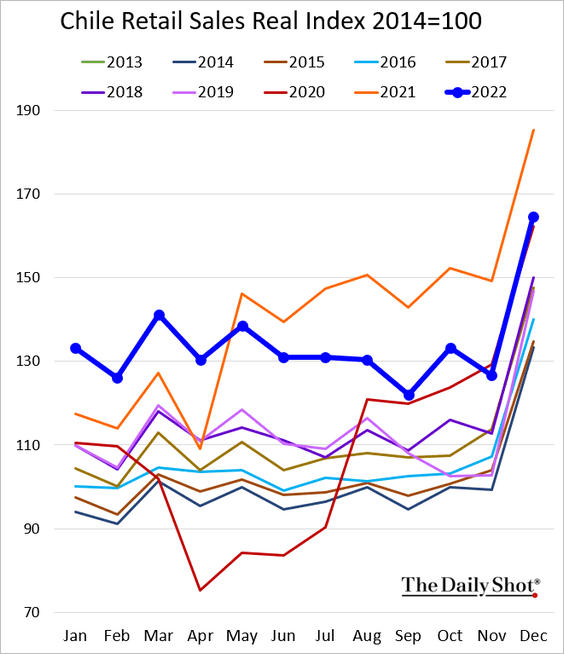
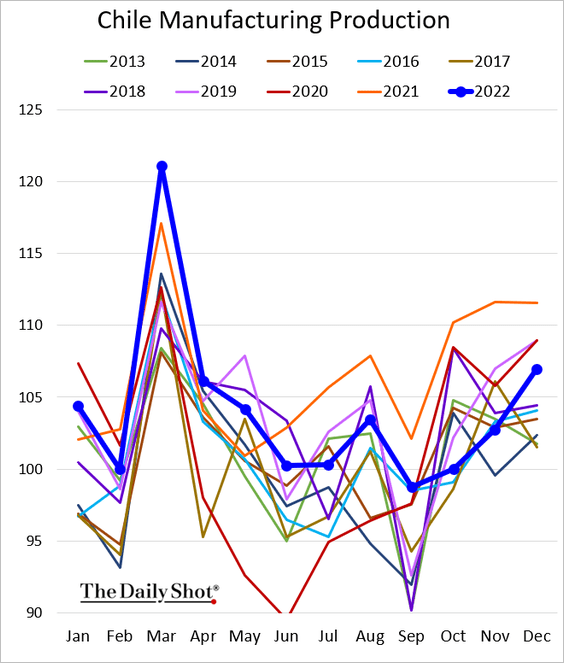
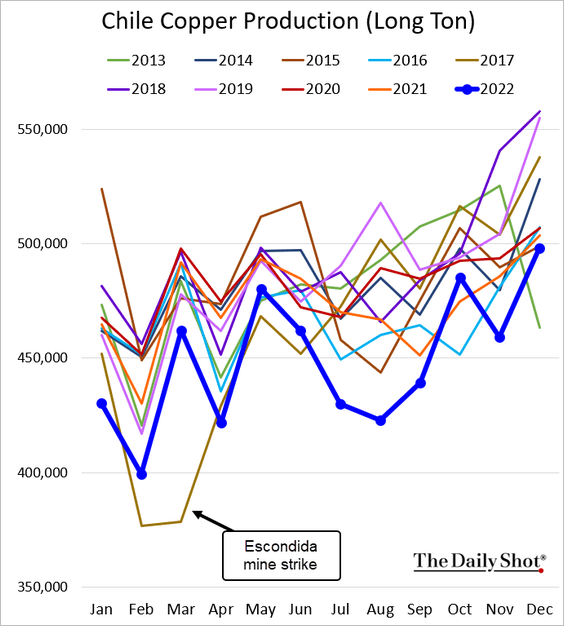
1. Chile’s economy is doing better than some economists feared.
• Economic activity:
• GDP by sector:
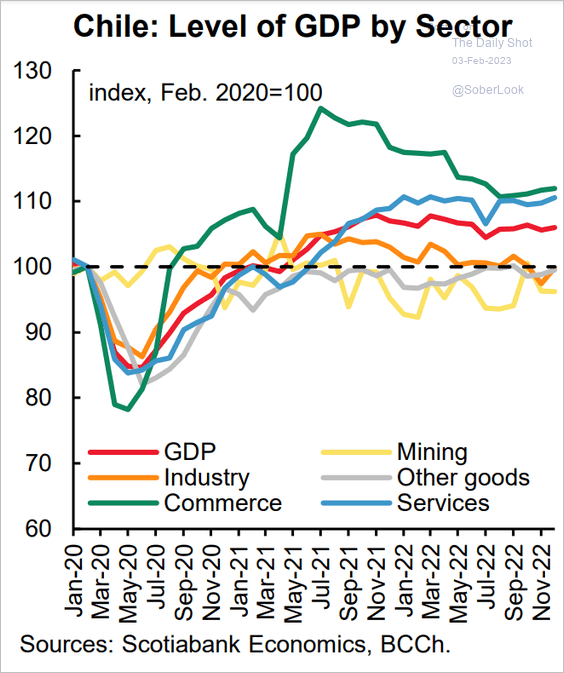 Source: Scotiabank Economics
• Retail sales:
• Industrial production (a strong close):
• Copper production:
——————–
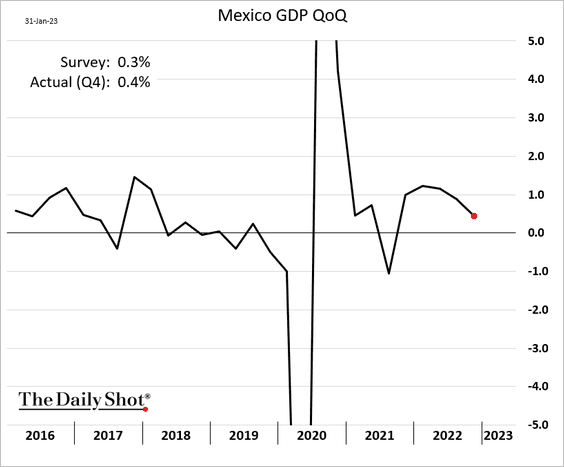
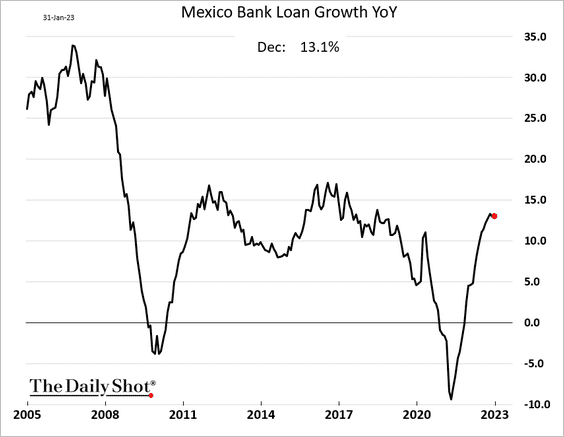
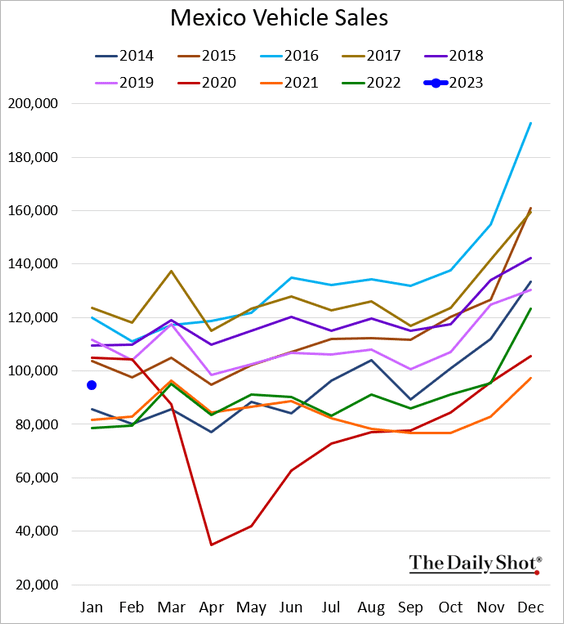
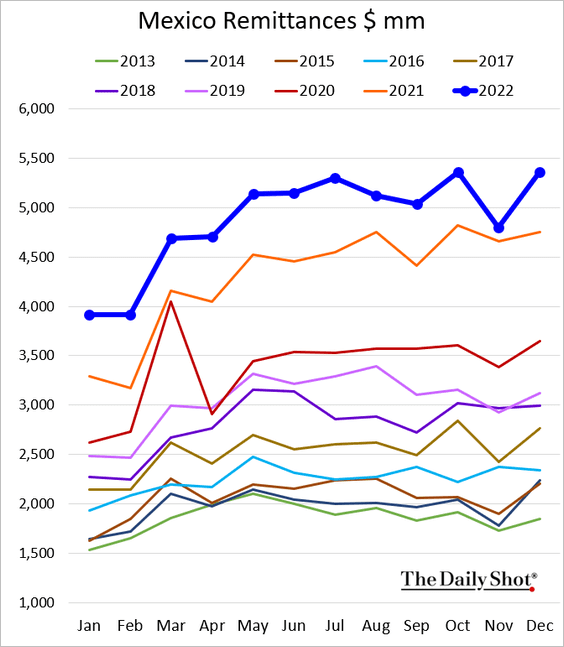
2. Next, we have some updates on Mexico.
• Q4 GDP (a bit stronger than expected):
• Manufacturing PMI (back in contraction):
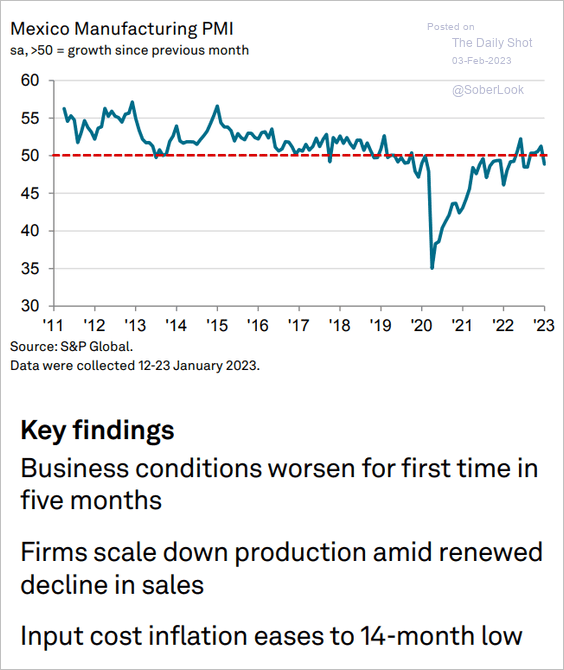 Source: S&P Global PMI
• Loan growth:
• Vehicle sales (a nice jump in January):
• Remittances:
——————–
3. EM fund inflows have accelerated.
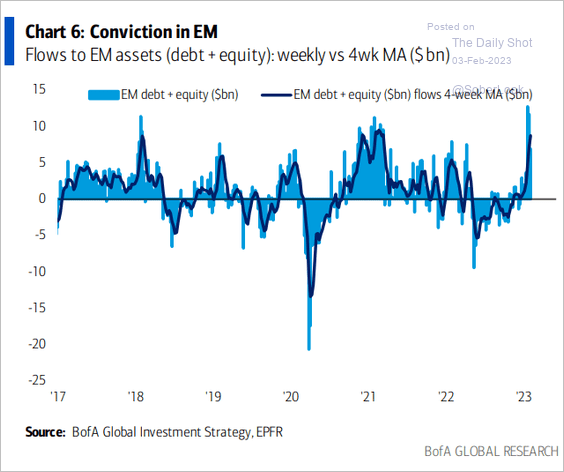 Source: BofA Global Research
4. Here is the EM heat map from Wells Fargo.
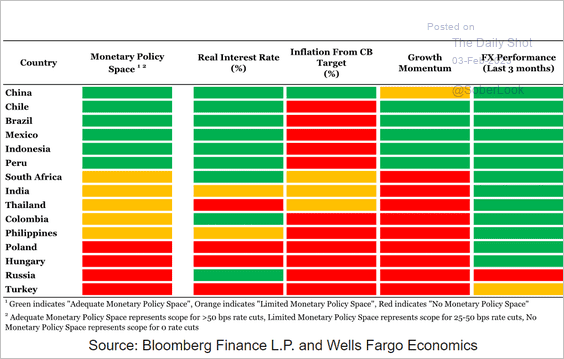 Source: Wells Fargo Securities
5. EM inflation leading indicators are rolling over, prompting markets to price in rate cuts later this year, according to Variant Perception.
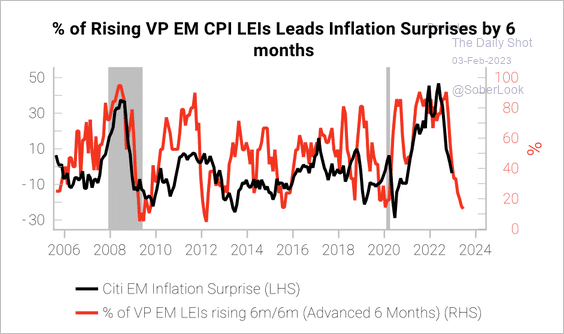 Source: Variant Perception
Back to Index
Commodities
1. Copper’s cash/3-month futures spread flipped into backwardation, indicating a tighter market.
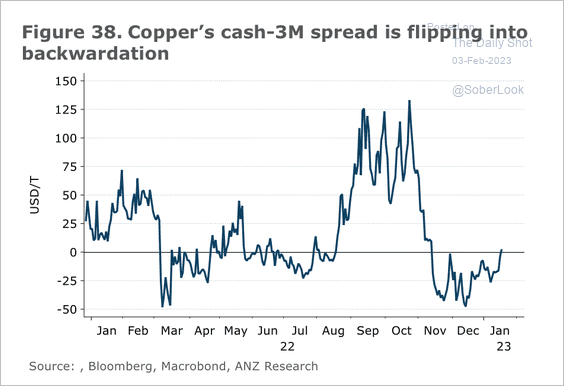 Source: @ANZ_Research
Shanghai copper inventories have increased. However, this year’s seasonal surge is muted relative to previous years.
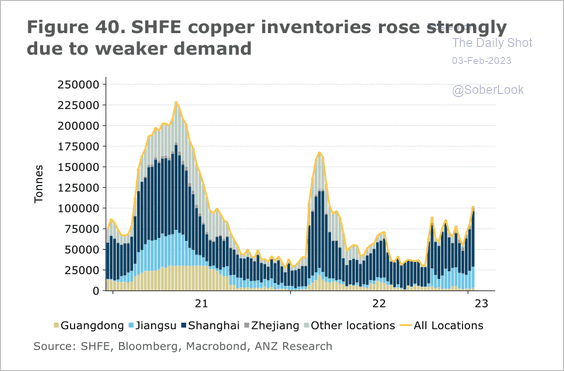 Source: @ANZ_Research Further reading
——————–
2. Gold purchases by central banks and institutions surged last year.
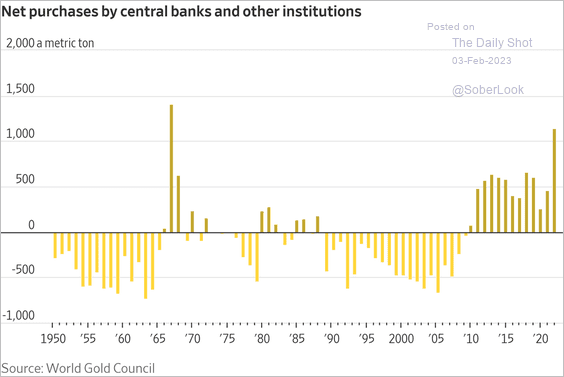 Source: @WSJ Read full article
The inverse correlation between gold and US real yields has weakened.
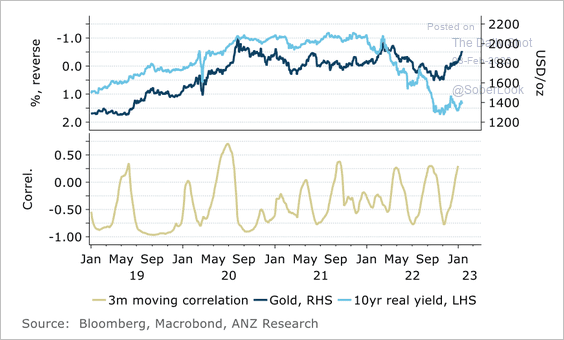 Source: @ANZ_Research
——————–
3. Commodity supply pressures continue to ease.
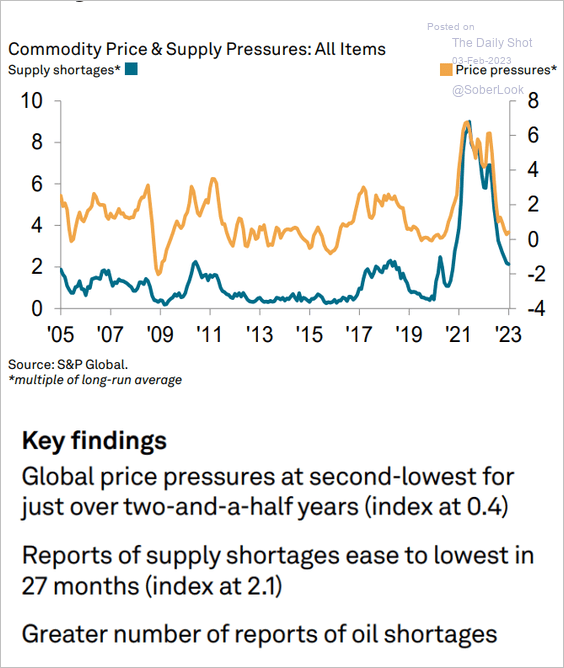 Source: S&P Global PMI
4. More pain ahead for memory chip prices?
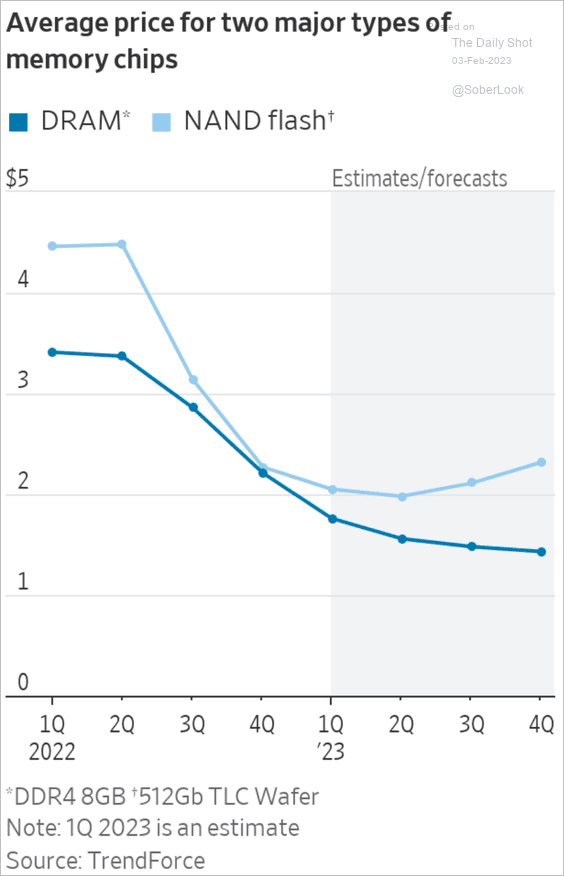 Source: @WSJ Read full article
Back to Index
Energy
1. US distillates inventories are very low.
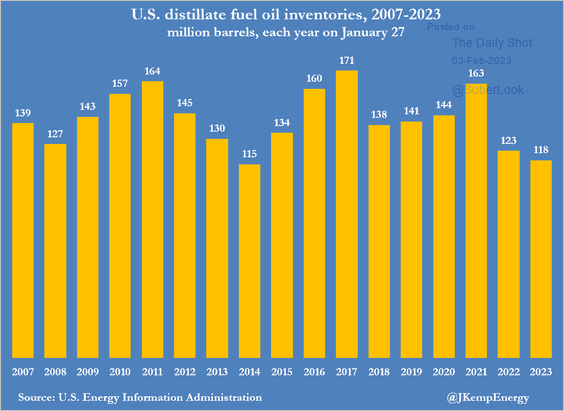 Source: @JKempEnergy
2. New York has been importing a lot of Indian gasoline and diesel, some of which is produced using Russian oil.
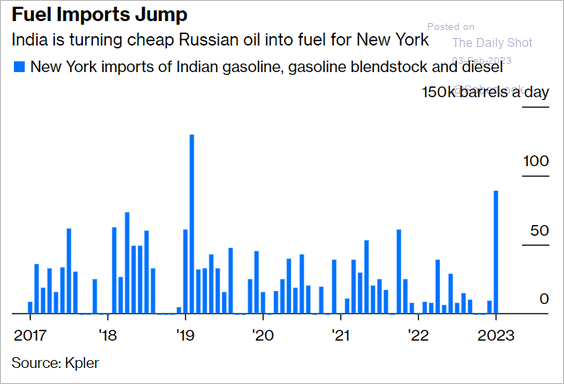 Source: @JLeeEnergy, @opinion Read full article
3. This chart shows US power generating capacity additions in 2022.
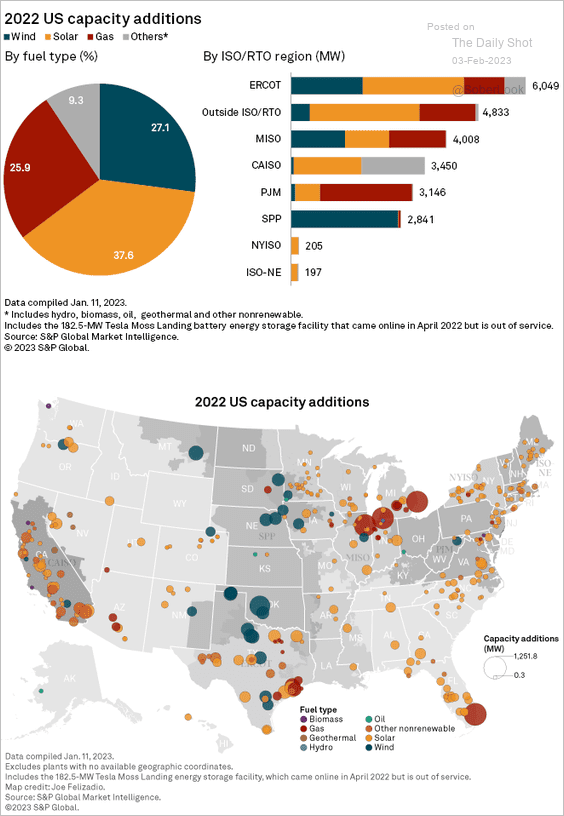 Source: S&P Global Market Intelligence
4. S&P 500 oil and gas exploration stocks are breaking down relative to global equities.
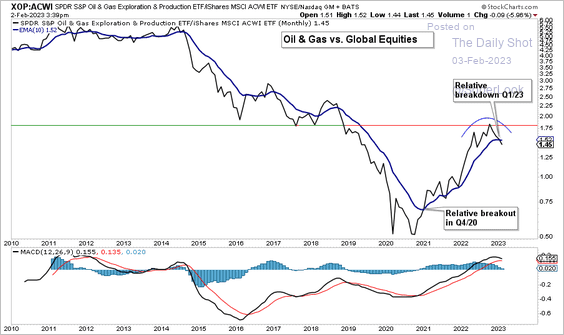 Source: Aazan Habib, Paradigm Capital
Back to Index
Equities
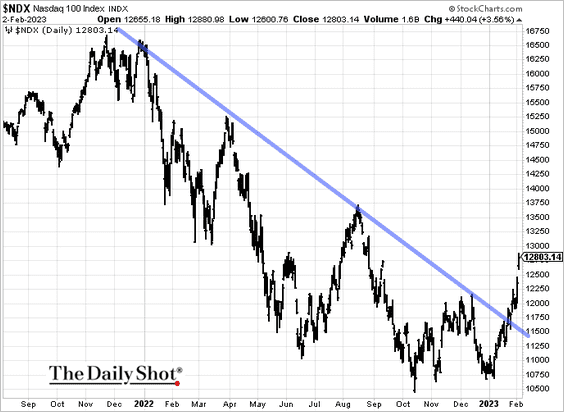
1. The Nasdaq 100 broke above the downtrend resistance.
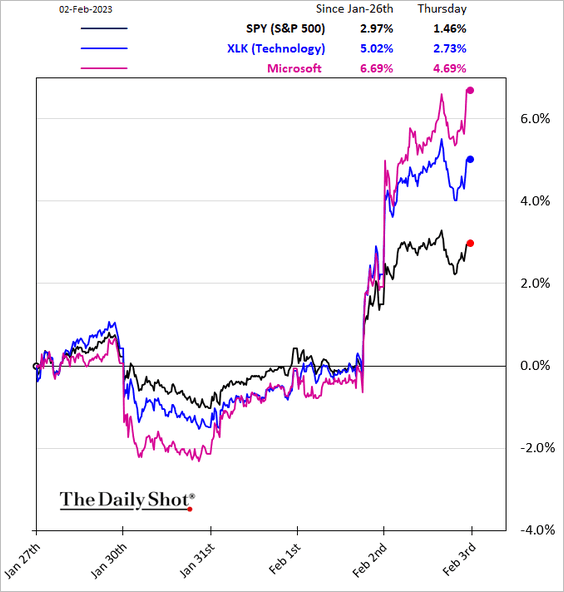
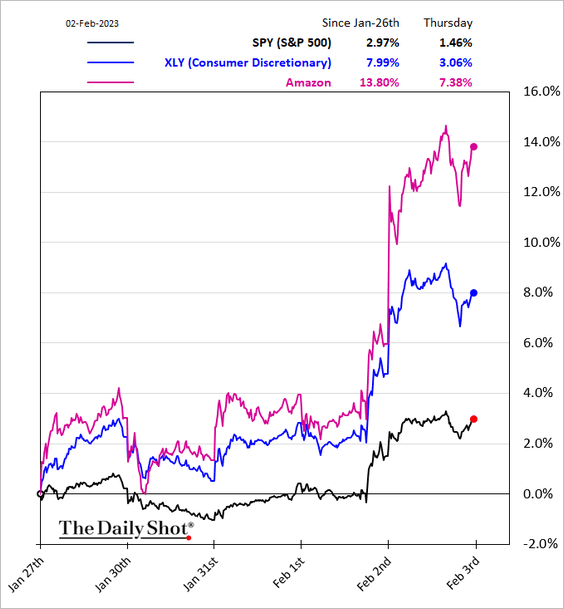
2. Tech shares drove outperformance in several sectors over the past few days.
• Tech:
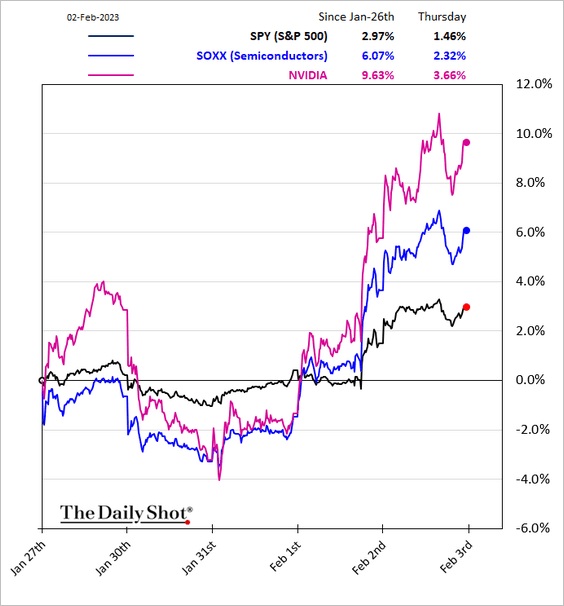
• Semiconductors:
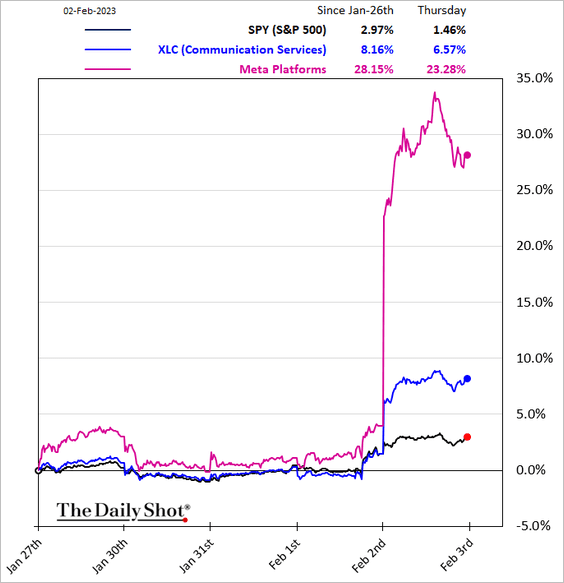
• Communication Services:
• Consumer Discretionary:
• Transportation:
![]()
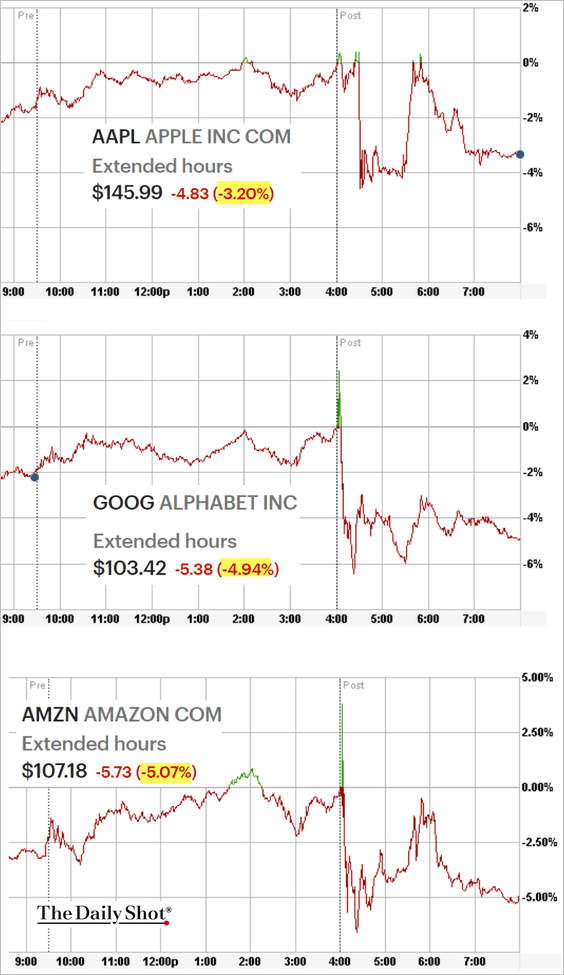
However, there was trouble after the close as earnings rolled in.
——————–
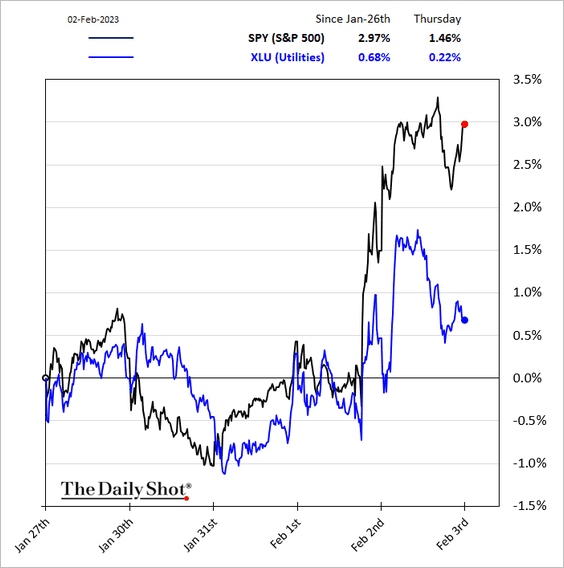
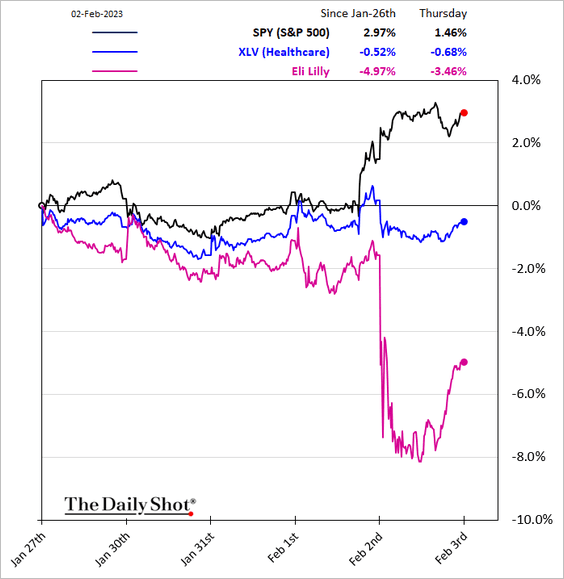
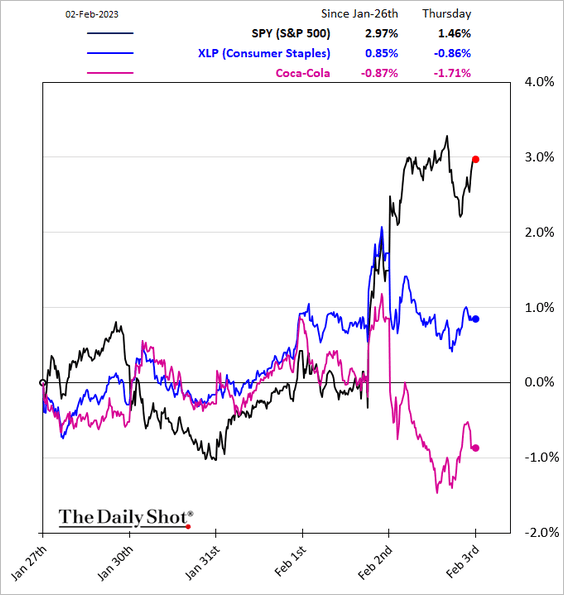
3. Defensive stocks underperformed.
• Utilities:
• Healthcare:
• Consumer Staples:
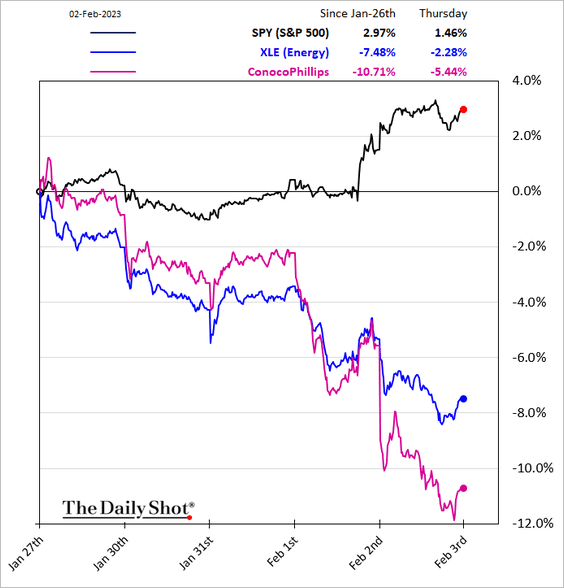
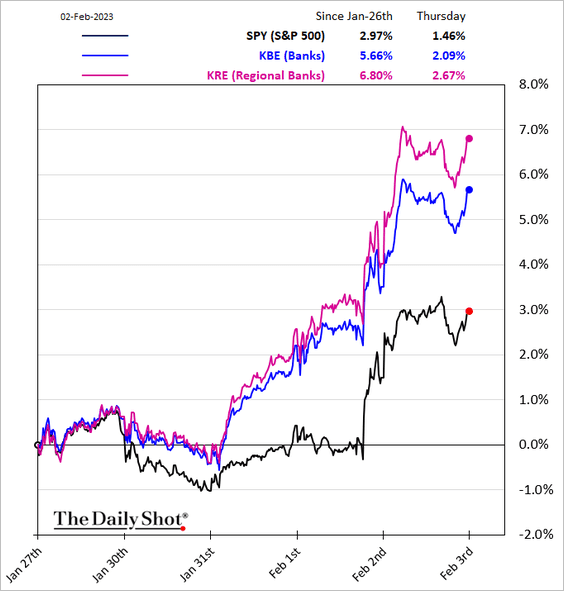
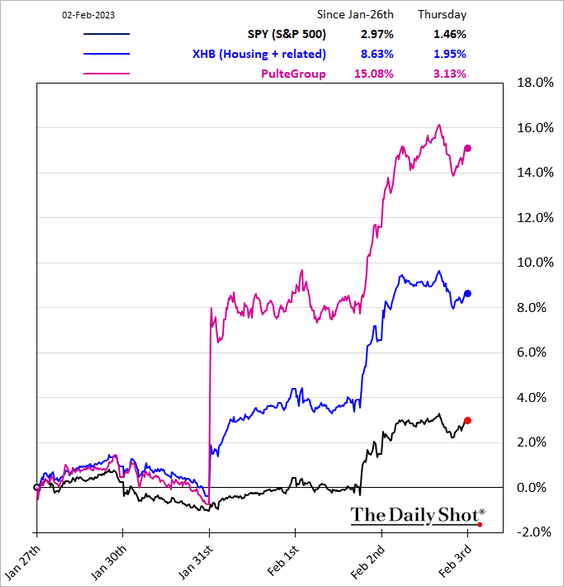
Below are three other sectors.
• Energy (which has been a drag on the Dow):
• Banks:
• Housing:
——————–
4. The momentum factor has been struggling.
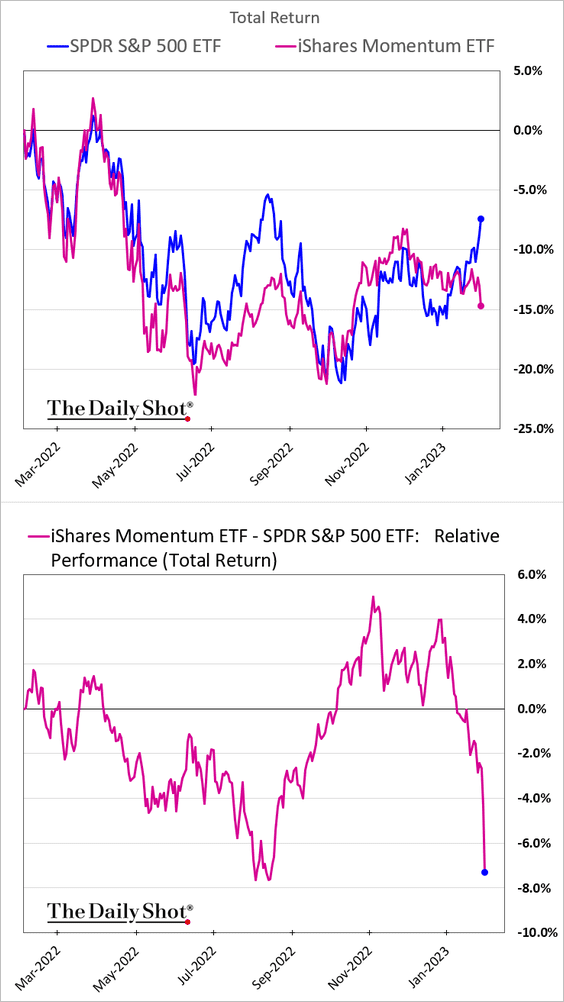
• Low-vol stocks have been underperforming the high-beta factor (2 charts).
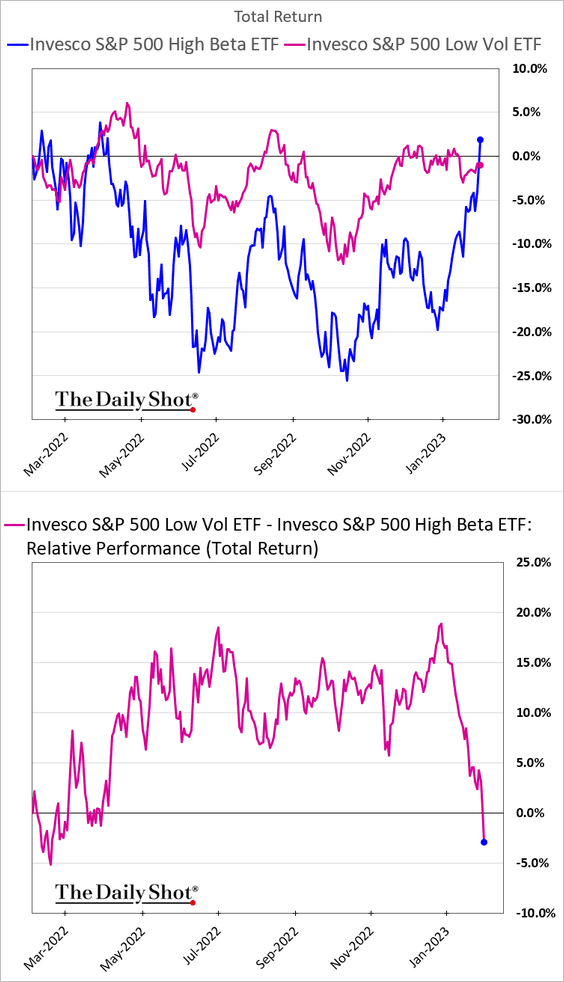
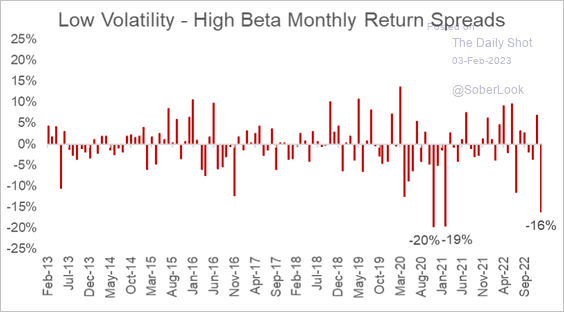 Source: S&P Dow Jones Indices
——————–
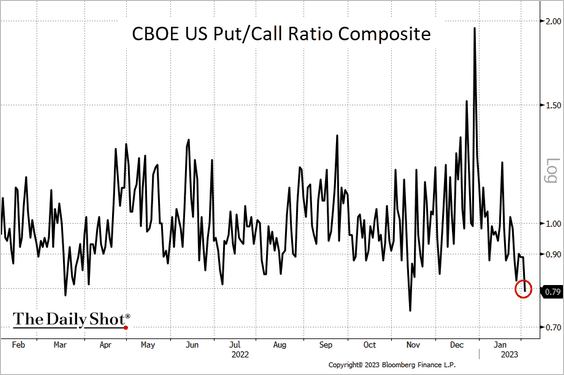
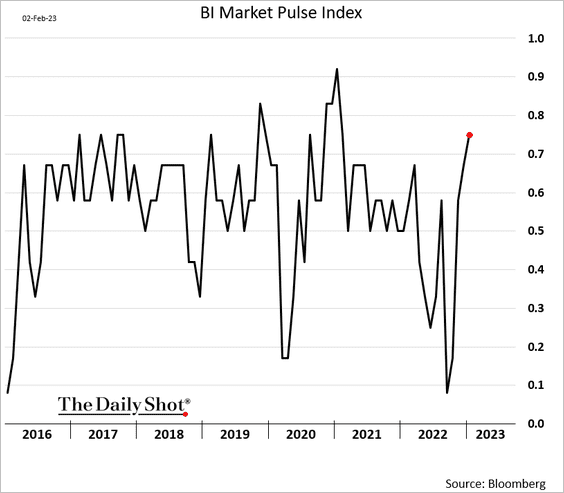
5. Investor sentiment has been turning bullish.
• The put/call ratio:
• The Bloomberg Intelligence Market Pulse Index:
——————–
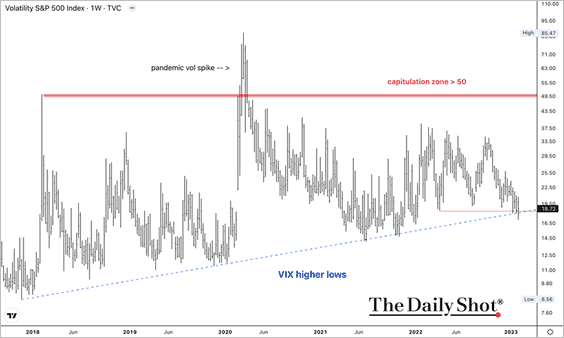
6. So far, VIX is holding support around 18. Typically, spikes toward 50 occur around bear market lows.
7. Equity rallies with declining leading economic indicators suggest negative expected returns on a six-month horizon, according to Variant Perception.
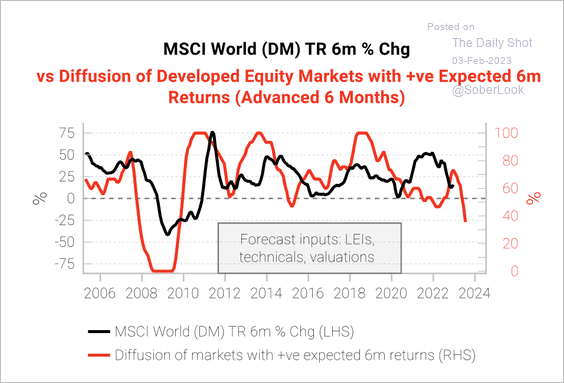 Source: Variant Perception
The US labor market has been the only positive economic signal.
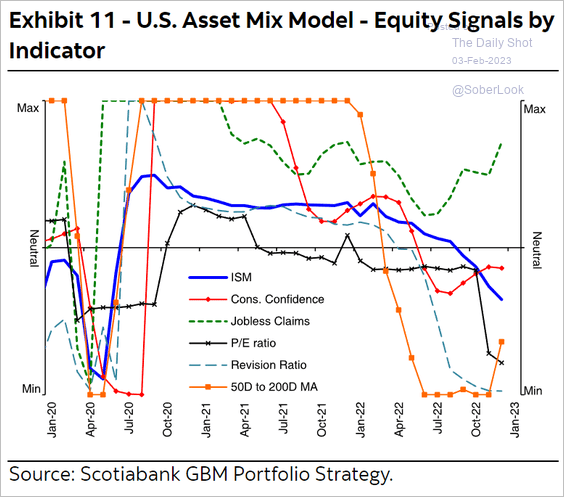 Source: Hugo Ste-Marie, Portfolio & Quantitative Strategy Global Equity Research, Scotia Capital
Back to Index
Rates
1. The fed funds rate is well above the market expectations for the long-run overnight rate, suggesting that the Fed’s policy is now restrictive.
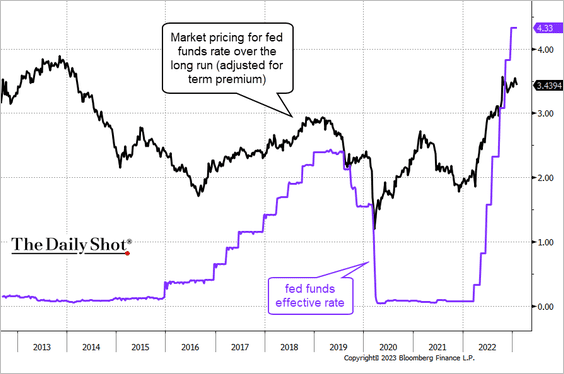 Source: @TheTerminal, Bloomberg Finance L.P.
The San Francisco Fed’s proxy funds rate indicates an even more restrictive policy.
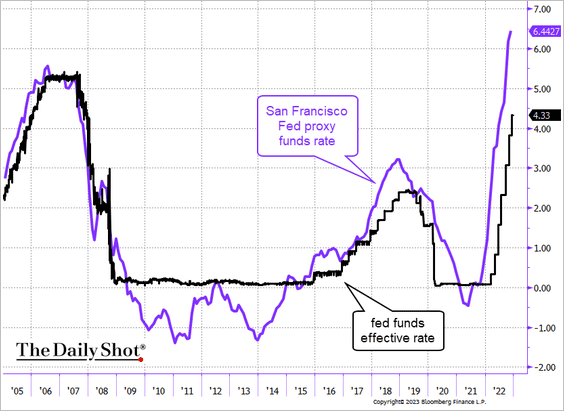 Source: @TheTerminal, Bloomberg Finance L.P.
——————–
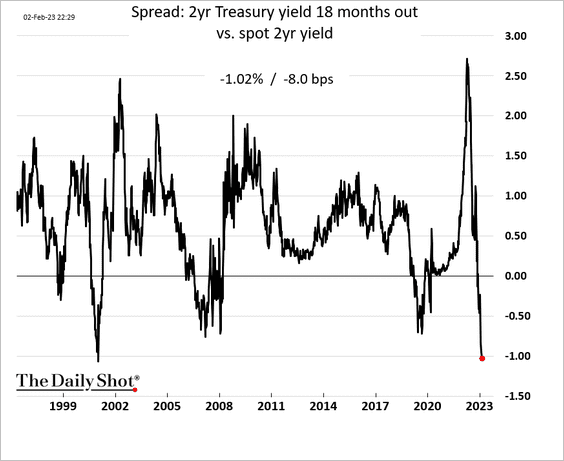
2. The Fed’s preferred yield curve measure (the short-end of the curve) hasn’t been this inverted since 2000.
3. Fund investors have been dumping inflation-linked Treasuries (TIPS) as inflation concerns ease (2 charts).
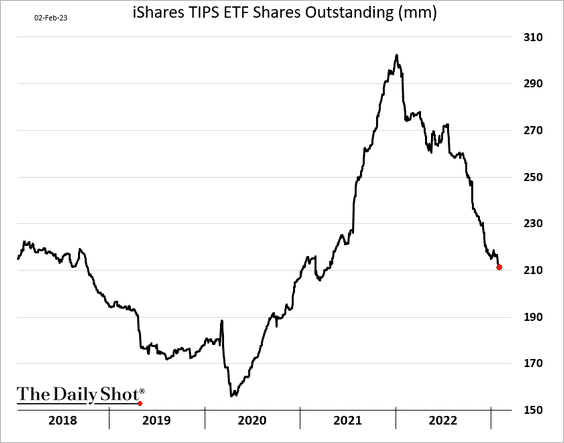
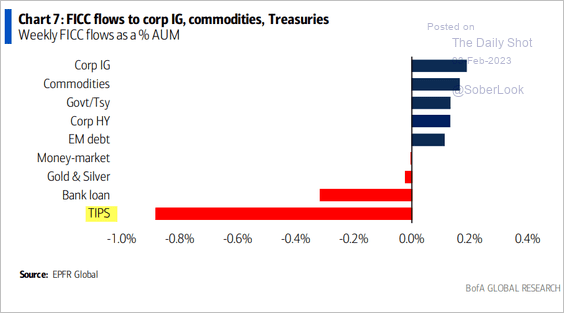 Source: BofA Global Research
——————–
4. A substantial component of the recent Treasury yield decline has been due to markets’ expectations of a more dovish Fed policy ahead.
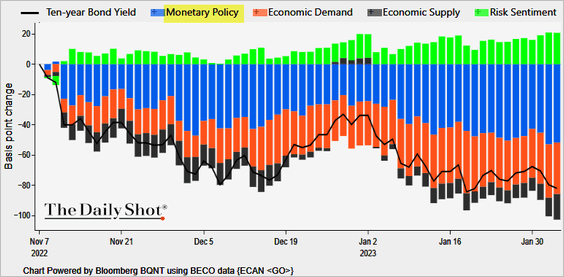 Source: @TheTerminal, Bloomberg Finance L.P., h/t Martin Ademmer
——————–
Food for Thought
1. US price trends over the past two decades:
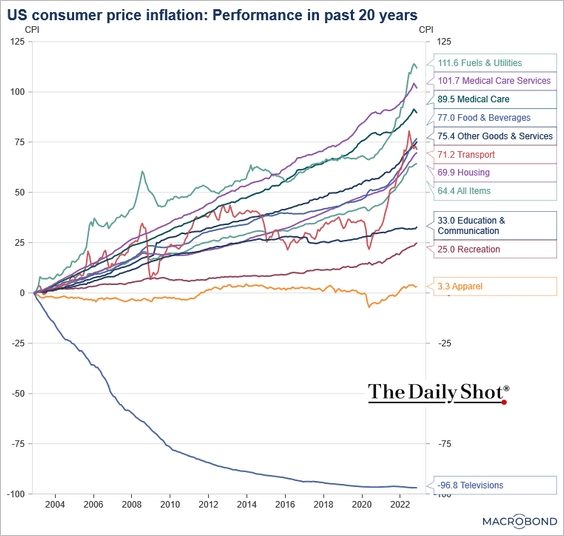 Source: Chart and data provided by Macrobond
2. US twin deficits:
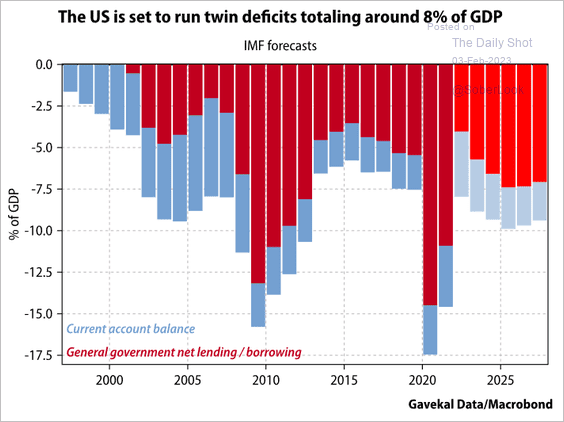 Source: Gavekal Research
3. Pedestrian deaths:
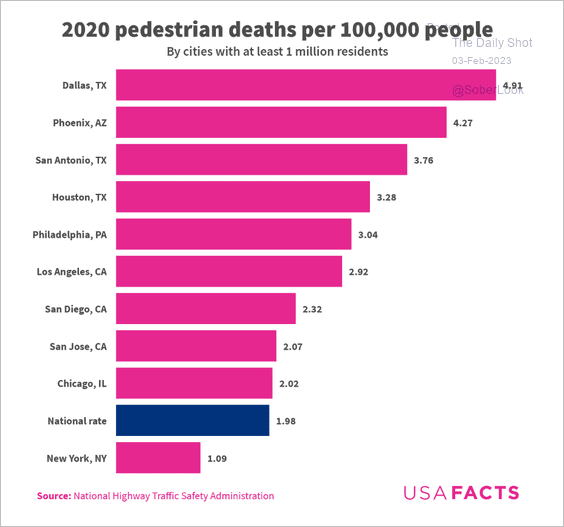 Source: USAFacts
4. Water quality violations:
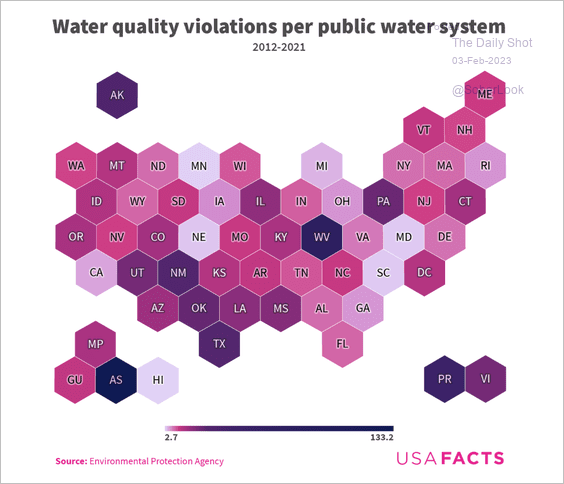 Source: USAFacts
5. Distance required for power generation facilities:
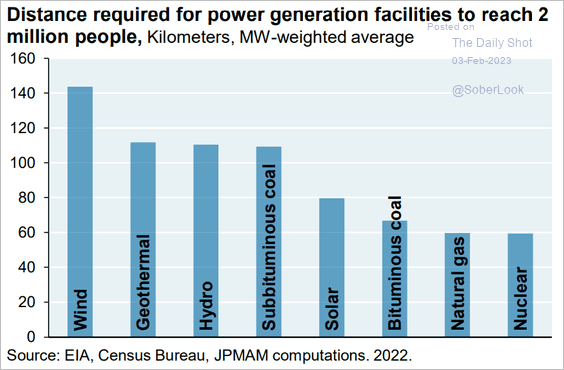 Source: J.P. Morgan Asset Management
6. Union workers’ wage premium:
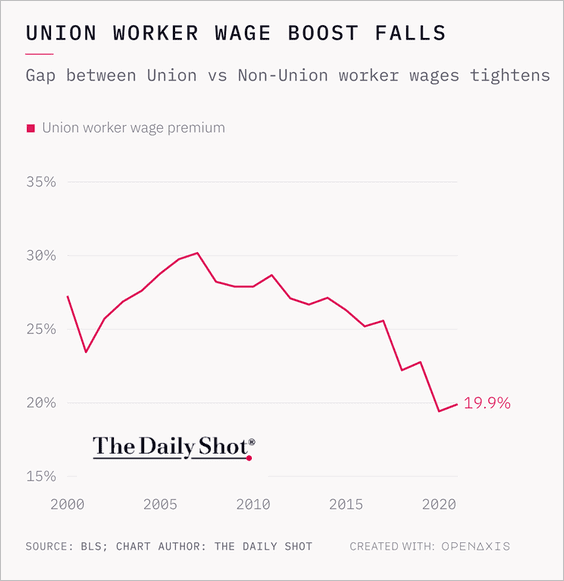 Source: @OpenAxisHQ
7. Preferred alcoholic beverage over time:
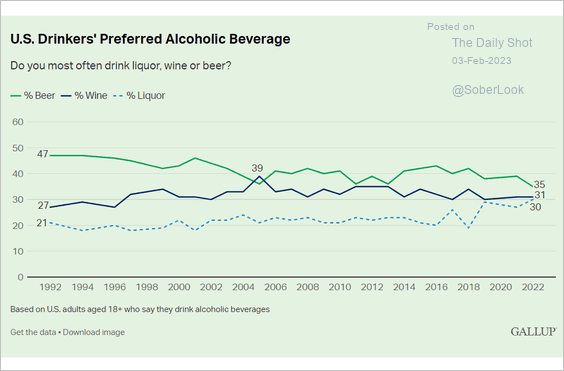 Source: Gallup Read full article
——————–
Have a great weekend!
Back to Index