
The Daily Shot: 06-Feb-23
• The United States
• The United Kingdom
• The Eurozone
• Europe
• Japan
• Asia – Pacific
• China
• Emerging Markets
• Commodities
• Energy
• Equities
• Credit
• Global Developments
• Food for Thought
The United States
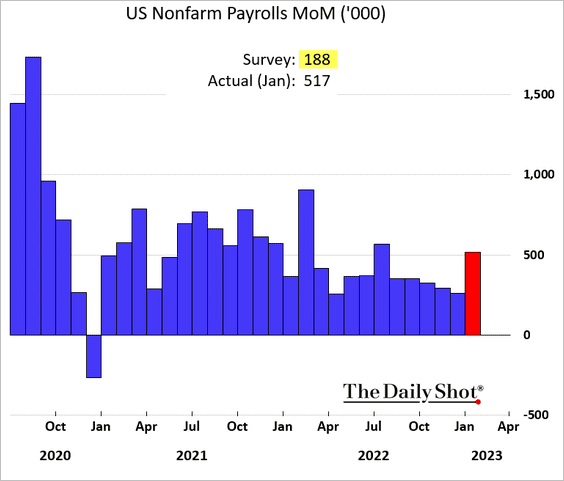
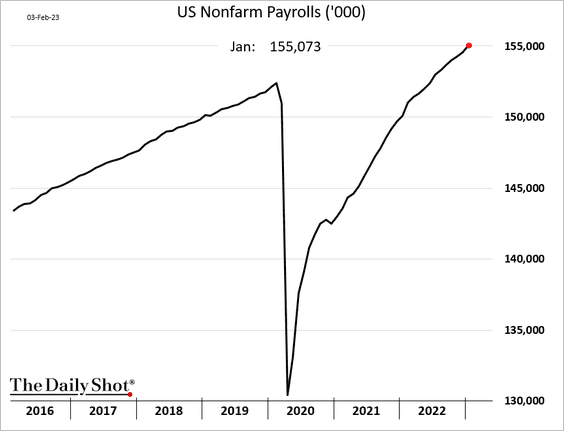
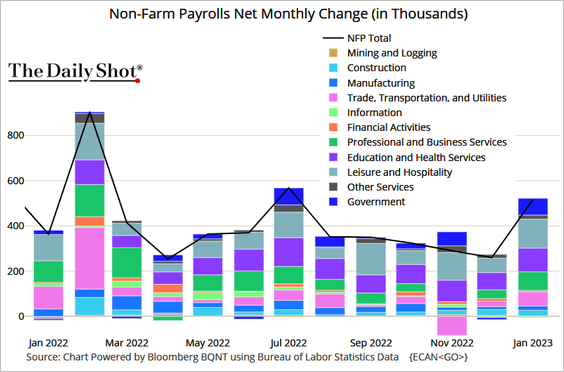
1. With over half a million jobs created, the January jobs report far surpassed economists’ expectations. The labor market is far from signaling a recession.
• Revisions remain positive.
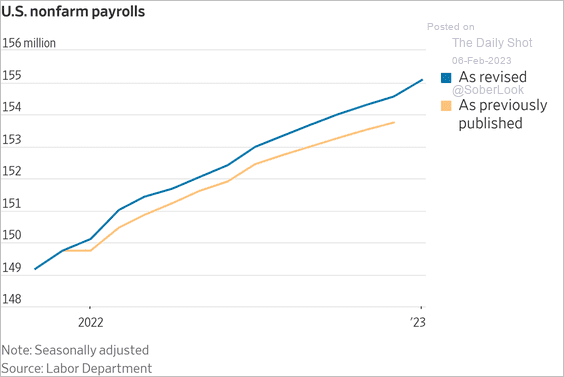 Source: @WSJ Read full article
• Results from the household survey were even stronger.
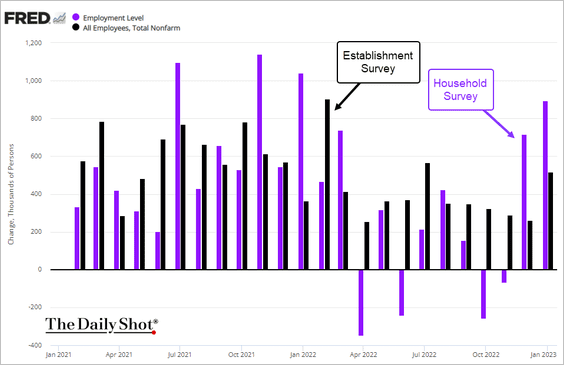
• Job gains were broad.
 Source: @TheTerminal, Bloomberg Finance L.P.
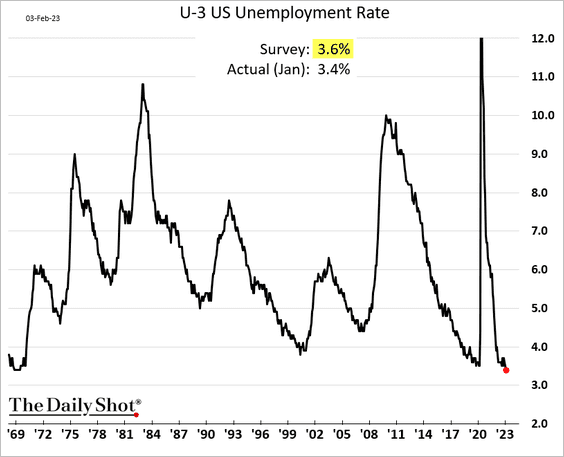
• The unemployment rate hit its lowest level since 1969.
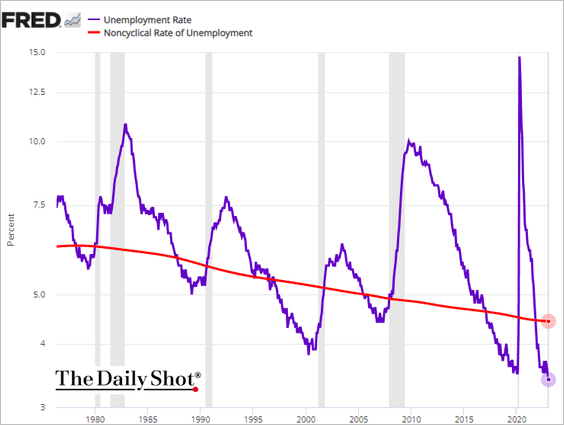
– The unemployment rate is now well below NAIRU, signaling tightness in the labor market.
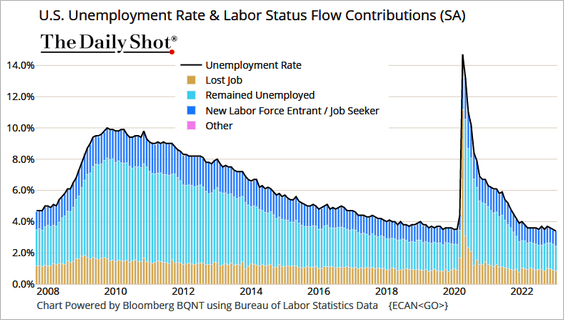
– This chart shows the contributions to the unemployment rate based on labor flows.
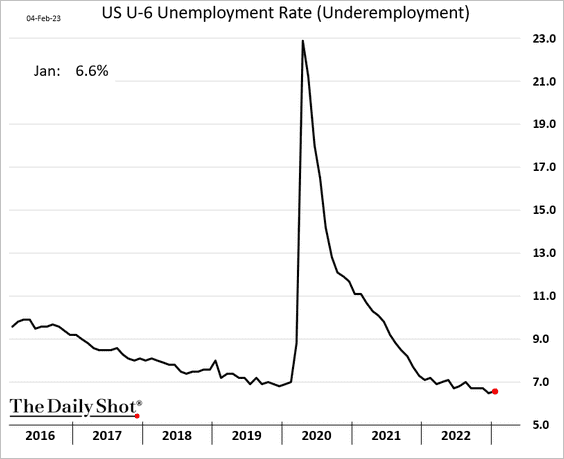
• Underemployment edged higher.
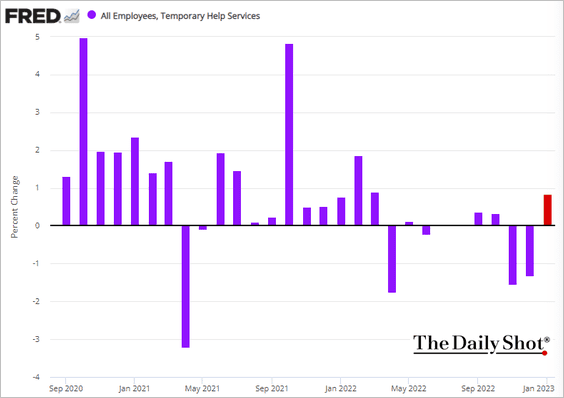
• After two months of declines, temp employment jumped.
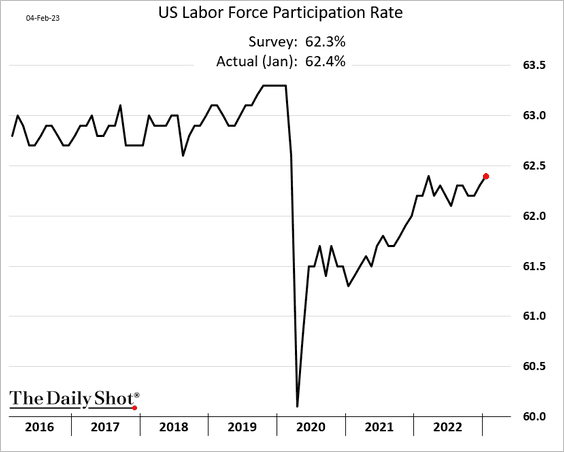
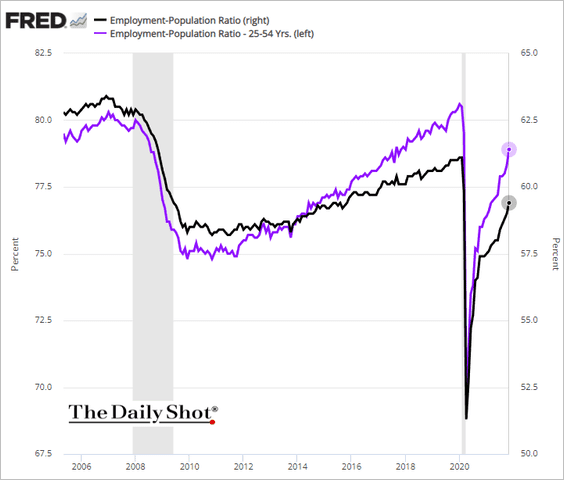
• Labor force participation improved.
 Source: Chart and data provided by Macrobond
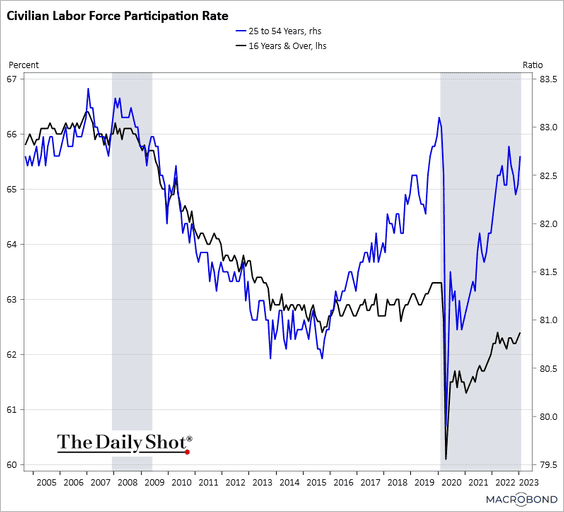
Here is the employment-to-population ratio.
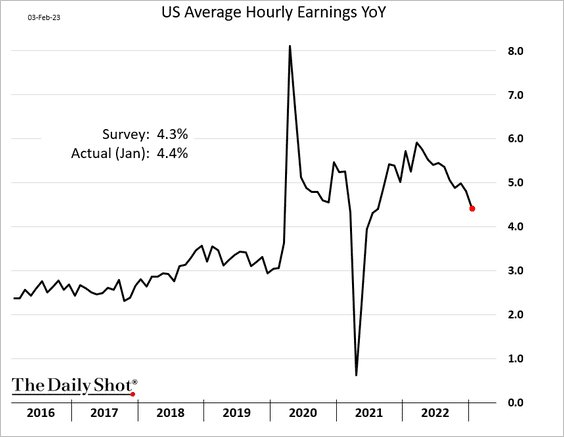
• Wage growth has been moderating but remains elevated.
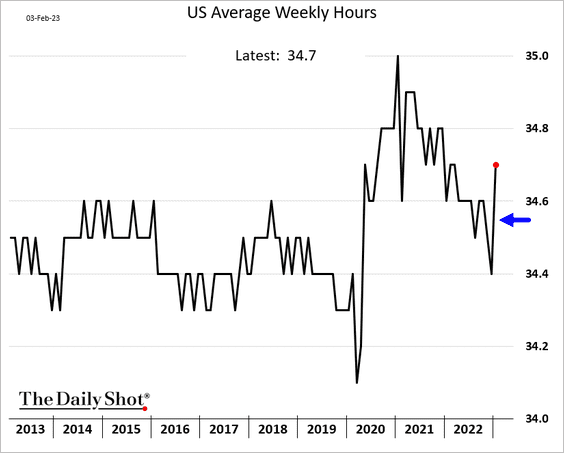
• Average weekly hours worked jumped in January.
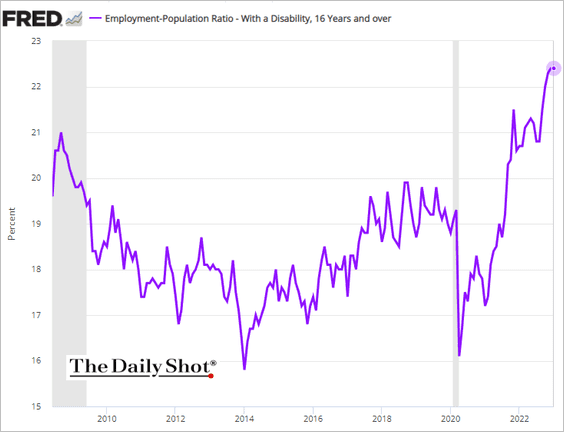
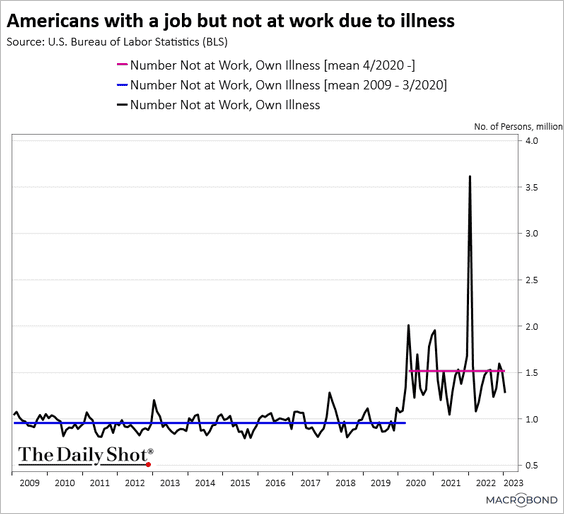
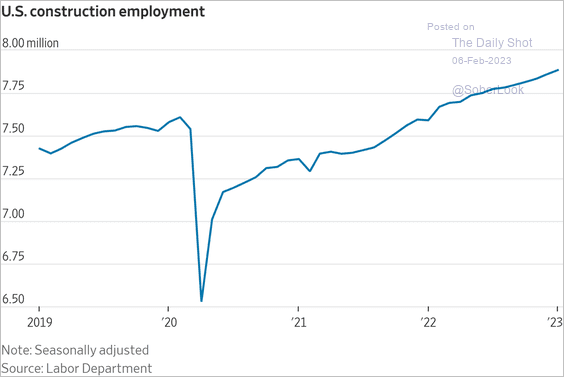
• Below are some additional trends from the jobs report.
– Workers with a disability:
– Not at work due to illness:
 Source: Chart and data provided by Macrobond
– Construction employment:
 Source: @WSJ Read full article
——————–
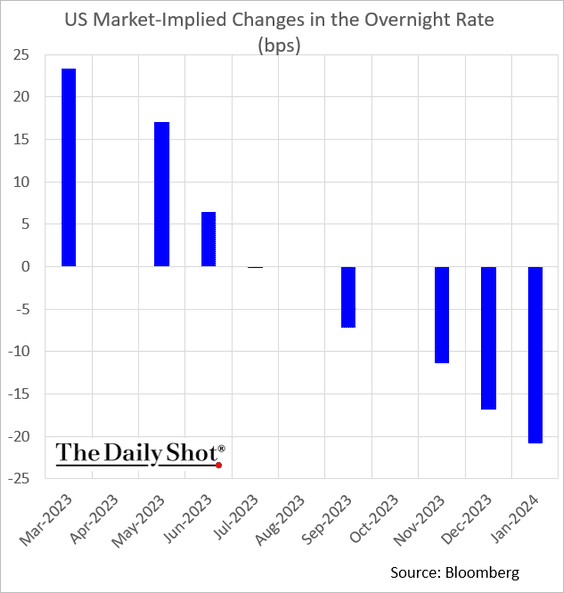
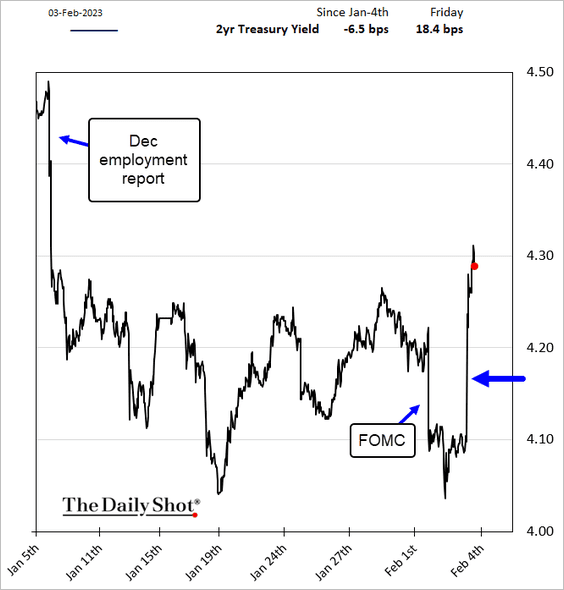
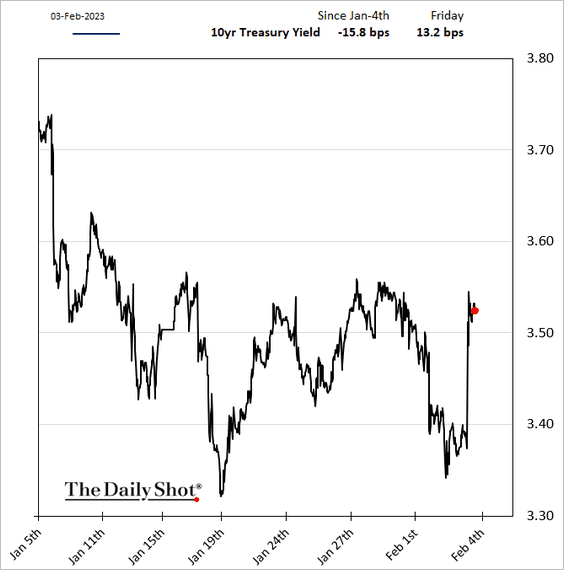
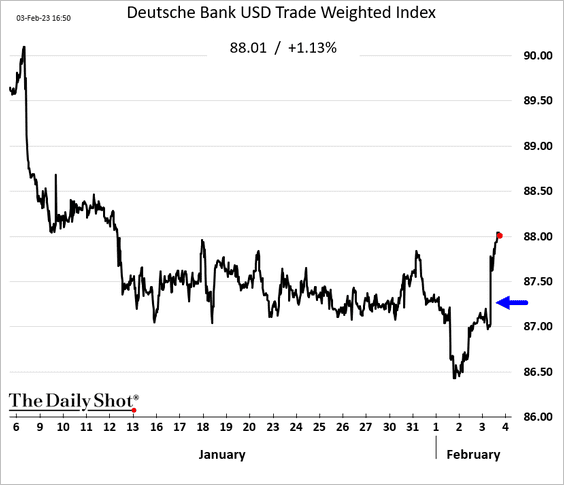
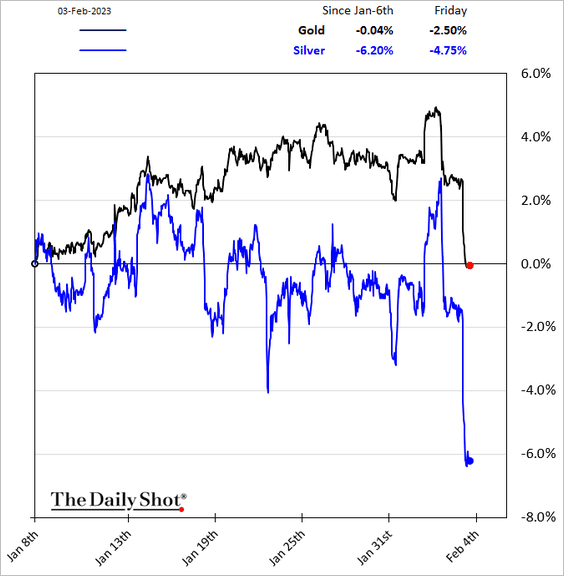
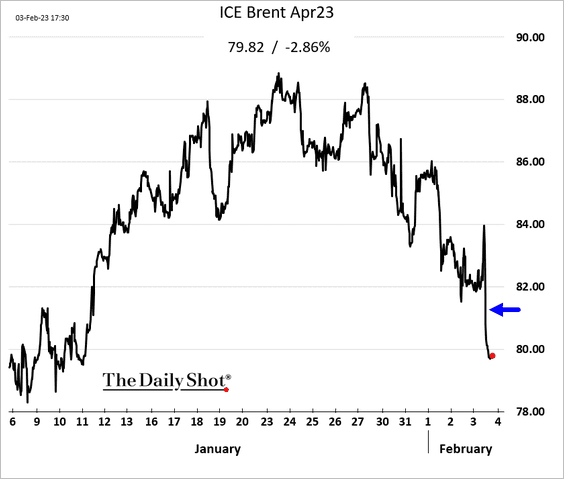
2. The jobs report shocker boosted rate hike expectations, with the terminal rate back above 5%.
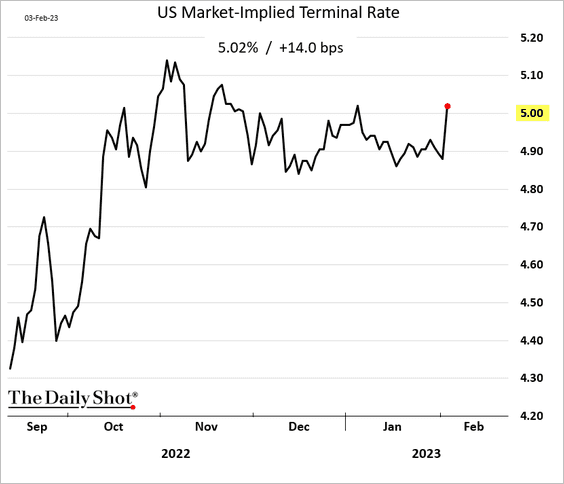
Two more rate hikes?
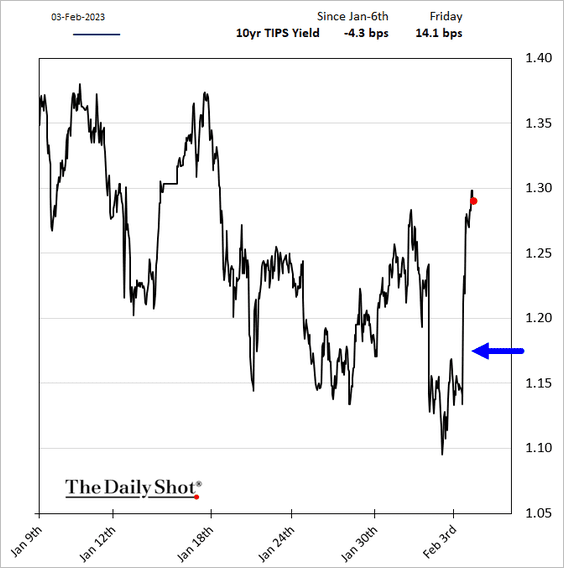
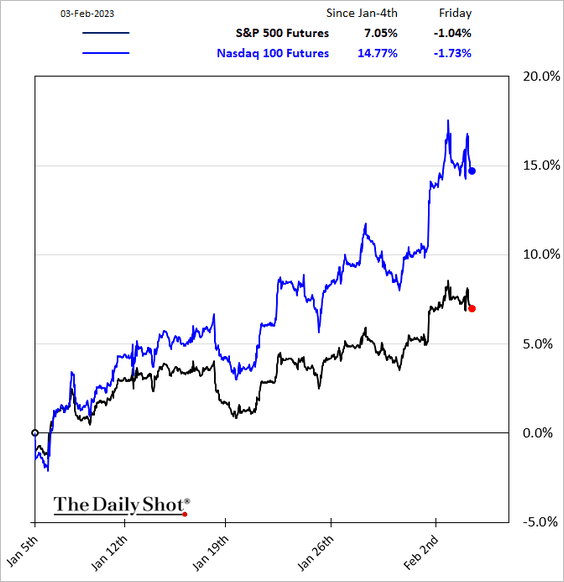
Below, we have other market responses to the employment report.
• Treasury yields:
• Real yields:
• Stocks (remarkably stable):
• The US dollar:
• Precious metals:
• Crude oil:
 Source: Reuters Read full article
——————–
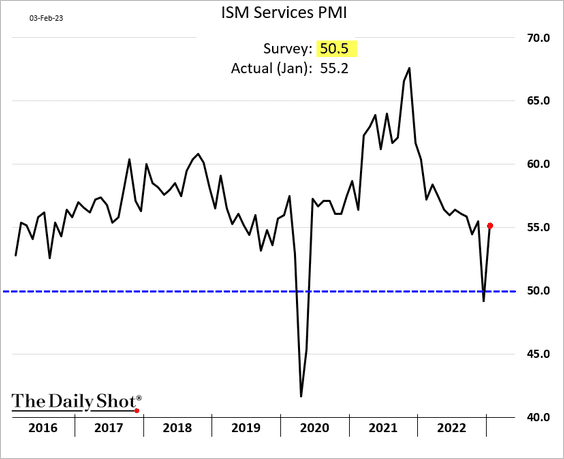
3. The ISM Services PMI jumped back into growth territory, also topping forecasts.
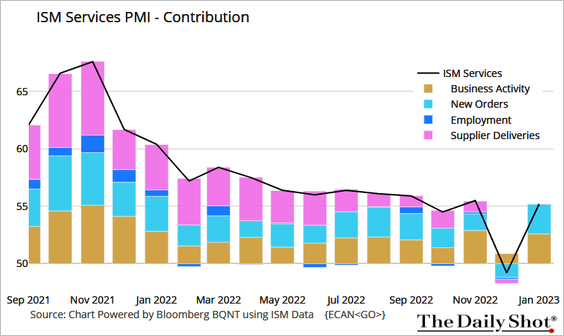 Source: @TheTerminal, Bloomberg Finance L.P.
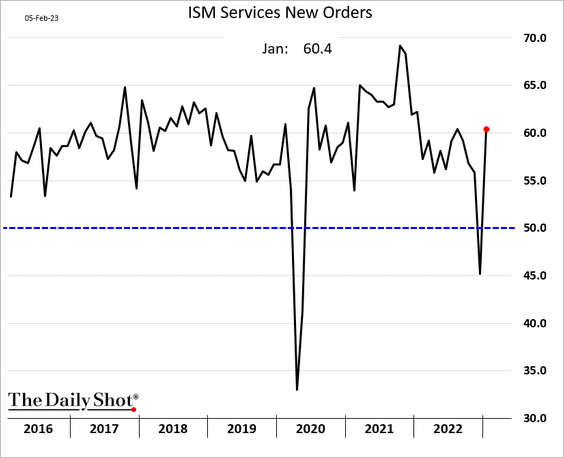
• New orders surged.
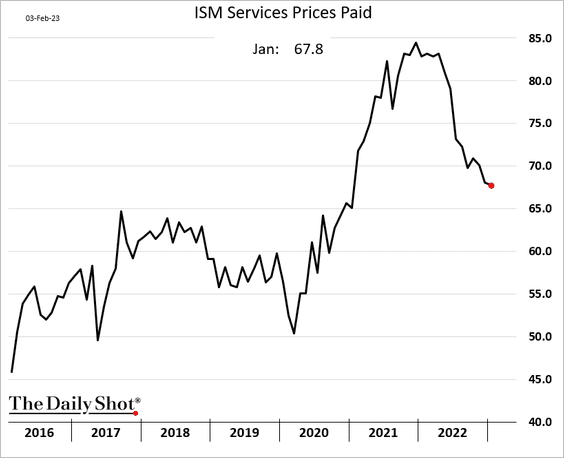
• Price pressures persist:
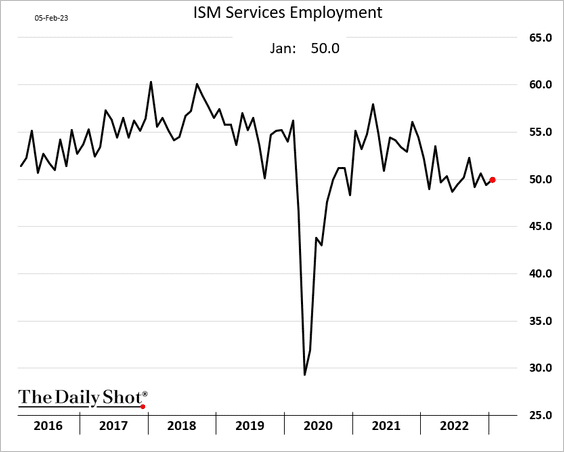
• Employment remains stable.
——————–
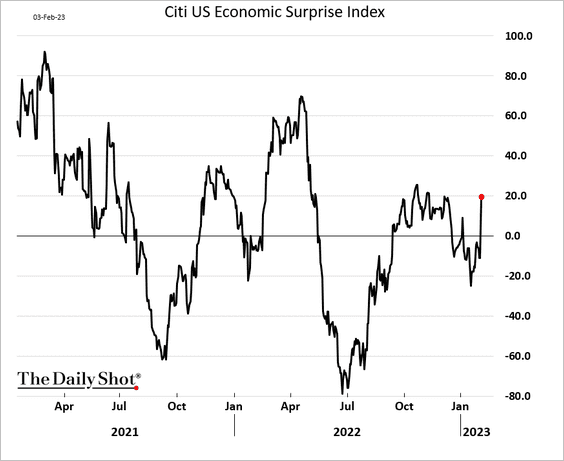
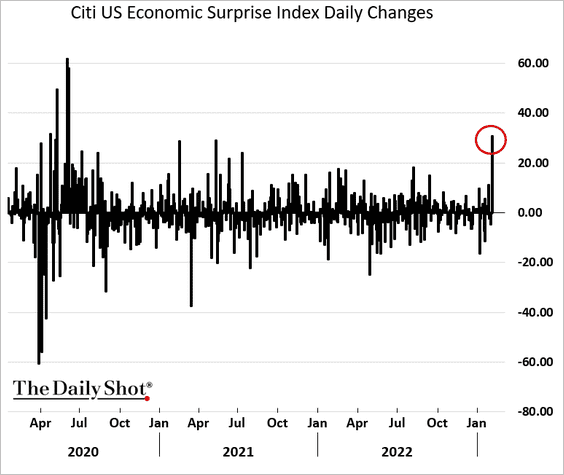
4. The Citi Economic Surprise Index rebounded sharply due to the employment and ISM reports.
——————–
5. Is the crash in residential investment signaling weakness for broader CapEx?
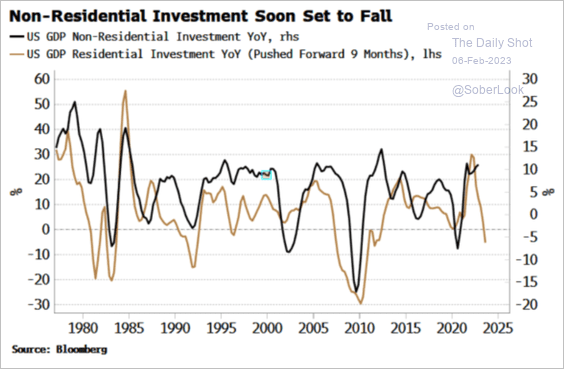 Source: Simon White, Bloomberg Markets Live Blog
Back to Index
The United Kingdom
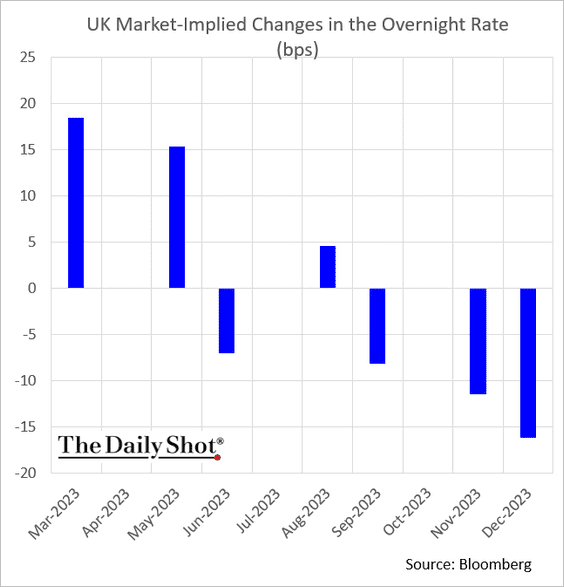
1. The post-BoE rally in gilts held on Friday.
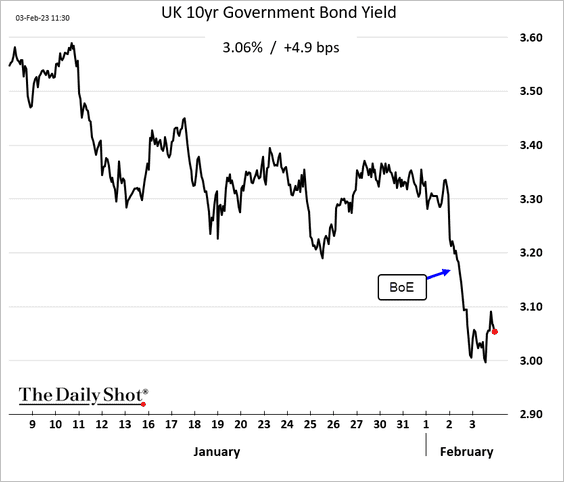
One or two more rate hikes?
Wells Fargo sees juts one.
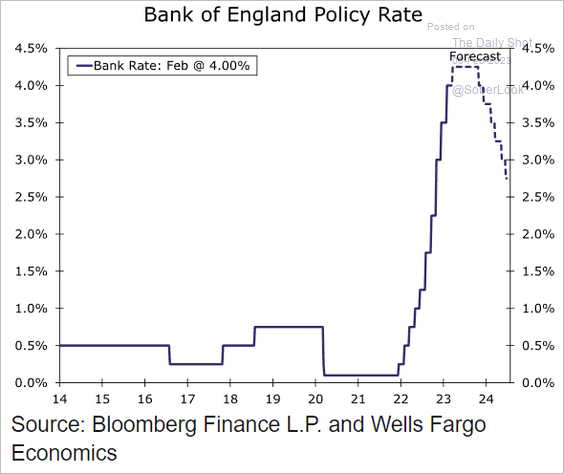 Source: Wells Fargo Securities
——————–
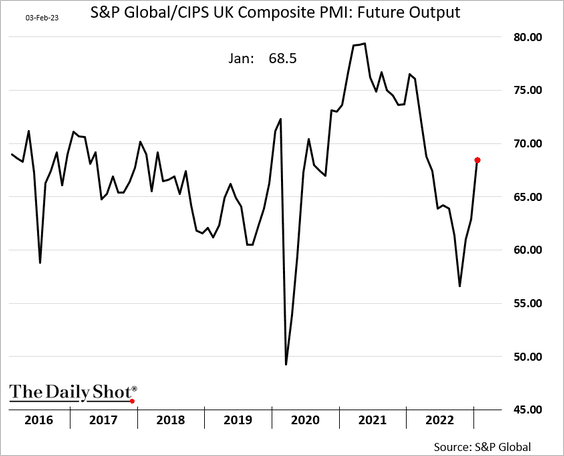
2. The S&P Global PMI report shows businesses becoming more upbeat about the future.
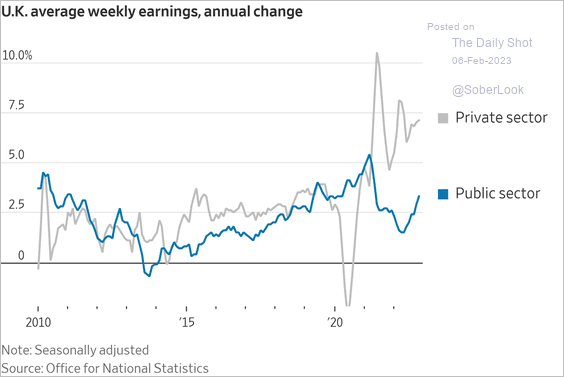
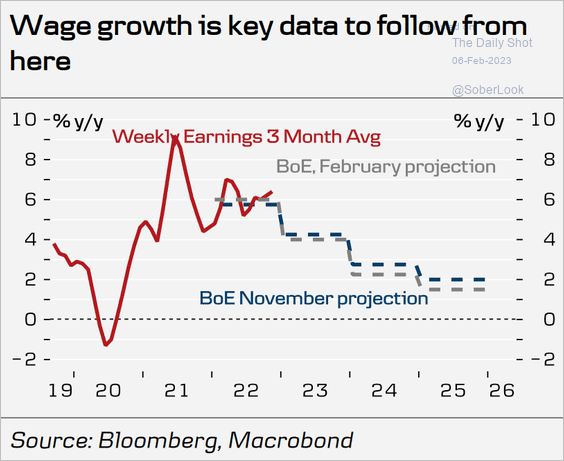
3. Public employee wage growth has been lagging.
 Source: @WSJ Read full article
The BoE sees wage growth moderating over the next couple of years.
 Source: Danske Bank
Back to Index
The Eurozone
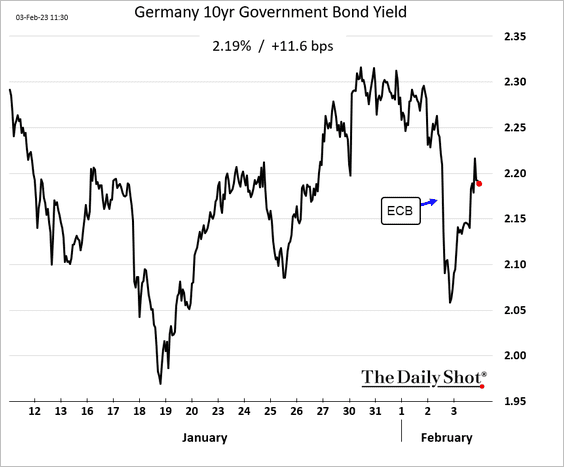
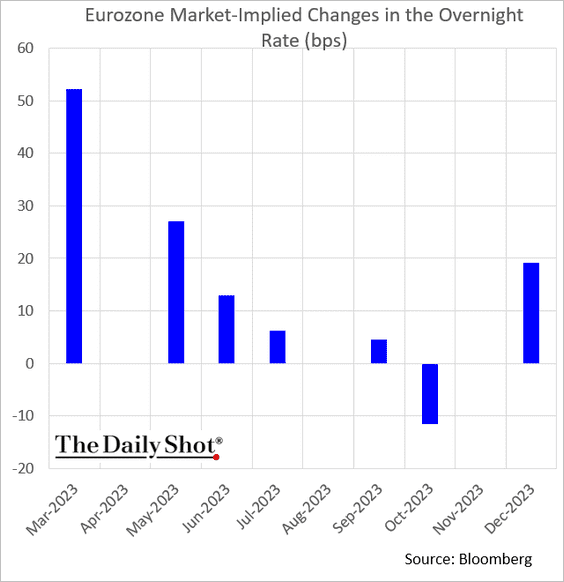
1. The post-ECB euphoria subsided after the realization that there was no dovish message from the central bank. The US employment shocker exacerbated the bond market gloom.
• The market sees another 50 bps increase followed by one or two 25 bps hikes.
Here is a forecast from Pantheon Macroeconomics.
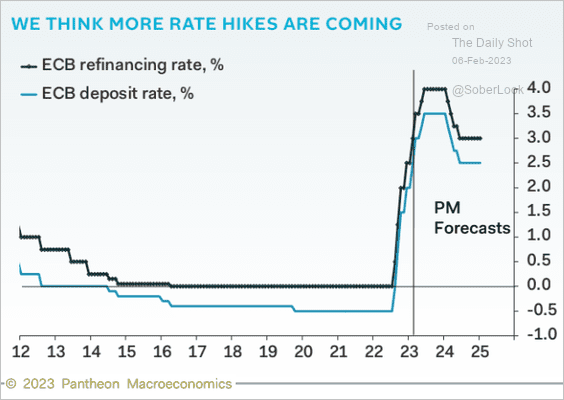 Source: Pantheon Macroeconomics
• Combining the ECB’s rate changes with that of the Bundesbank (prior to the euro) makes the current tightening the second highest over an eight-month period.
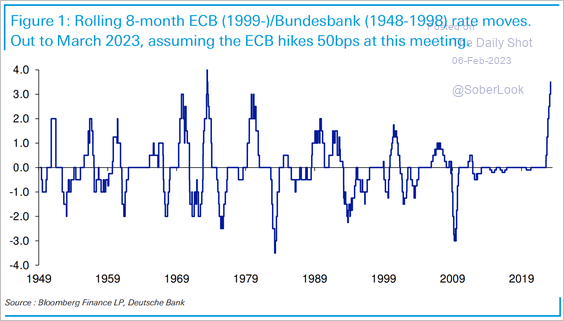 Source: Deutsche Bank Research
——————–
2. Despite its recent rally, the euro is still undervalued by about 15%.
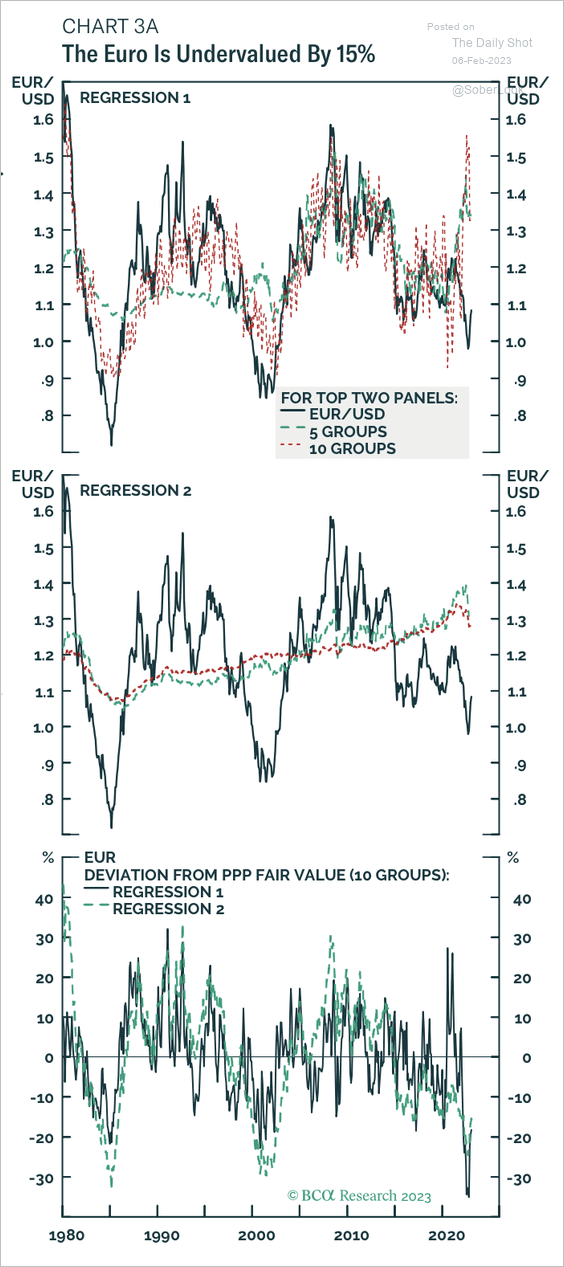 Source: BCA Research
3. Professional forecasters boosted their inflation estimates for 2023 and 2024.
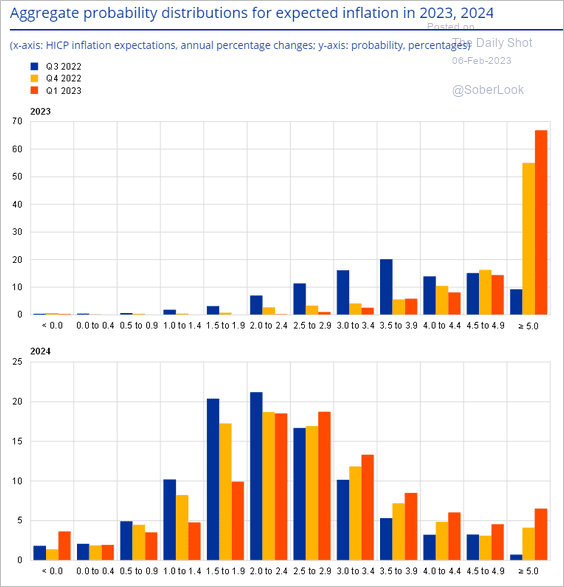 Source: ECB
They also increased their 2023 growth projections relative to the previous survey, amid a pullback in energy prices.
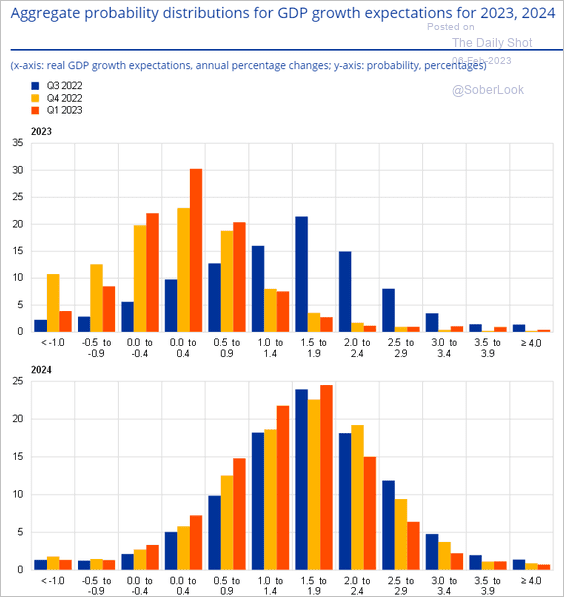 Source: ECB
——————–
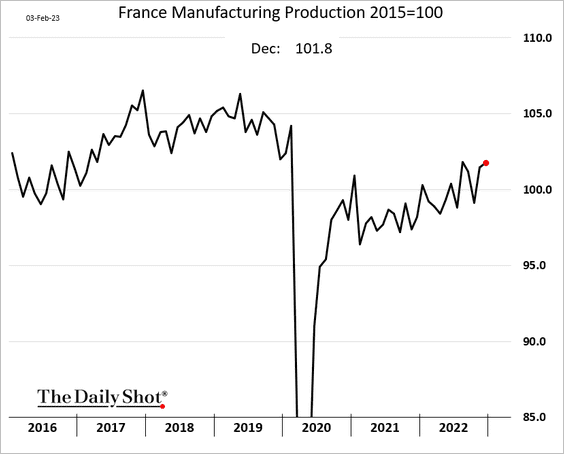
4. French manufacturing output continues to trend higher.
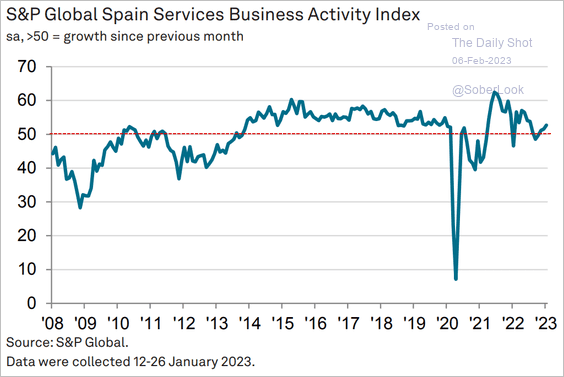
5. Service industries reported an improvement last month, with Italy and Spain now in growth territory.
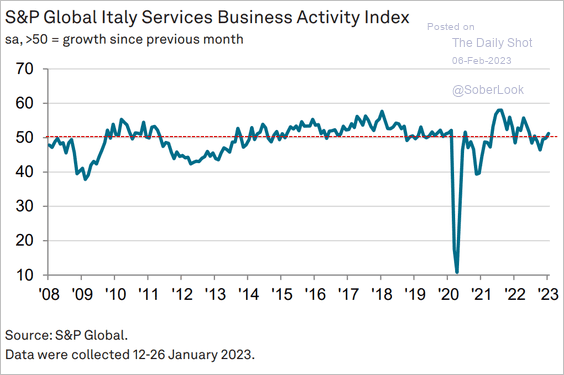 Source: S&P Global PMI
 Source: S&P Global PMI
——————–
6. Input price pressures should moderate further as supply chain stress eases.
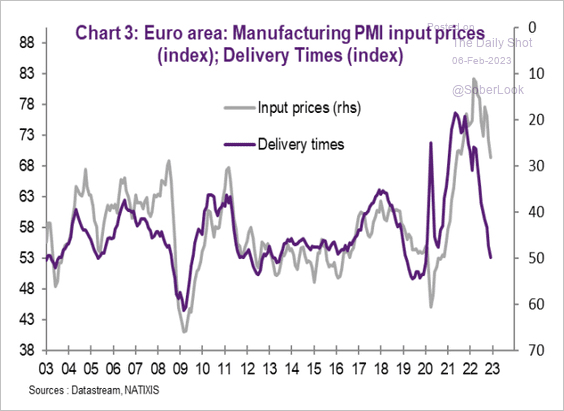 Source: Natixis
7. Public debt reductions have been exceeding the pace required by current fiscal rules.
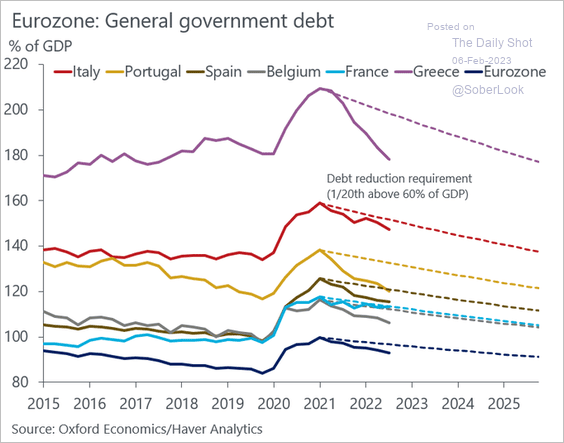 Source: @DanielKral1
Back to Index
Europe
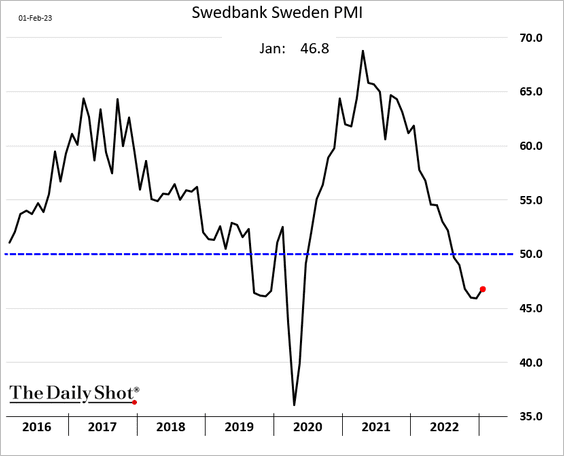
1. Sweden’s manufacturing activity continued to contract last month.
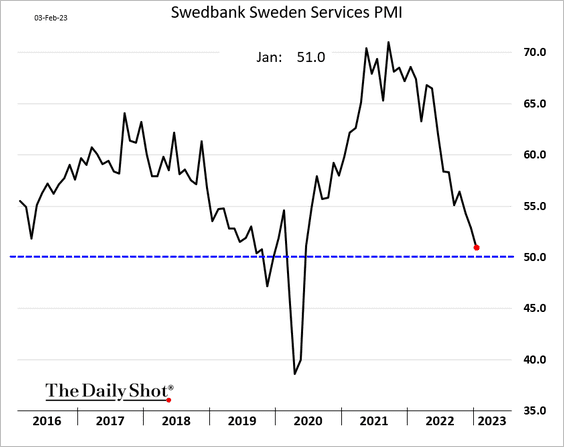
And services growth has slowed markedly.
——————–
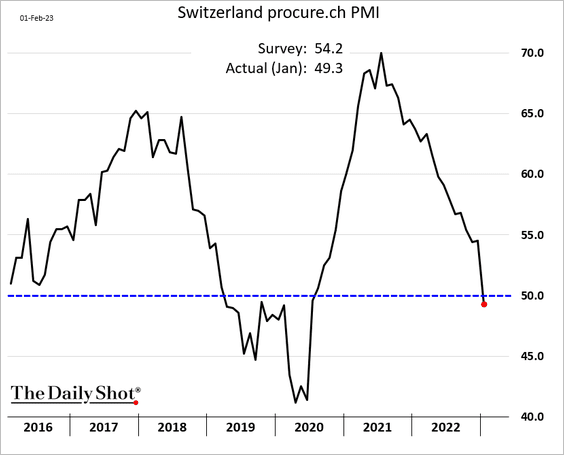
2. Swiss manufacturing is shrinking for the first time since 2020.
3. Poland’s manufacturing contraction is slowing.
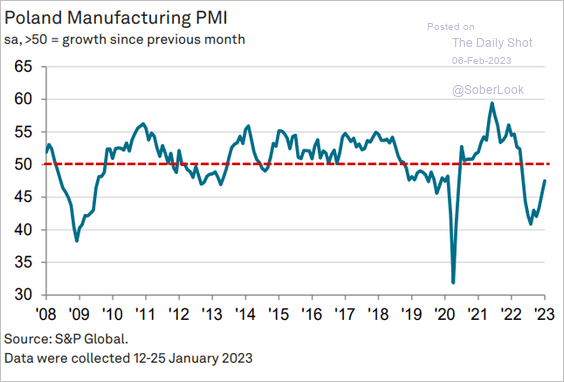 Source: S&P Global PMI
4. Public sector hiring advanced in recent years.
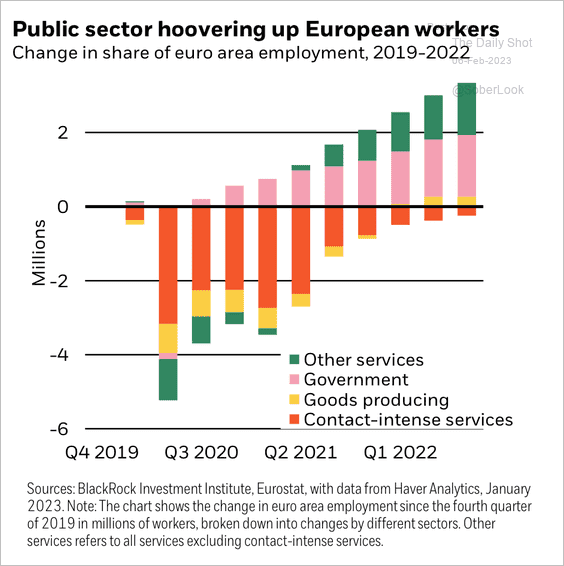 Source: BlackRock Investment Institute
5. Next, we have data on the EU’s renewables situation.
• Renewables overtaking natural gas:
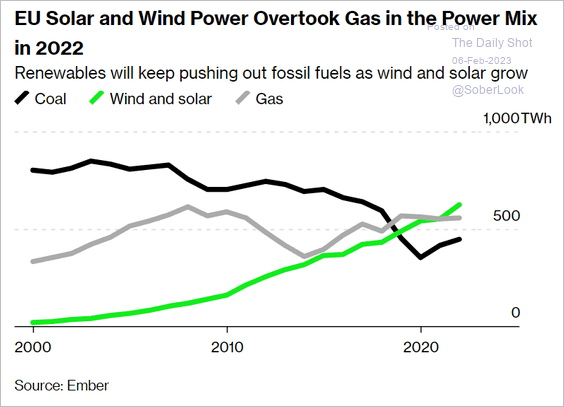 Source: @MathisWilliam, @business Read full article
• Wind and solar by country:
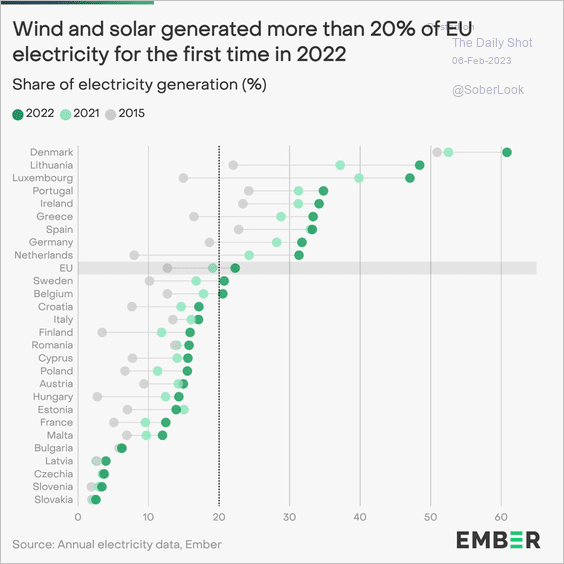 Source: @EmberClimate Read full article
• Solar growth:
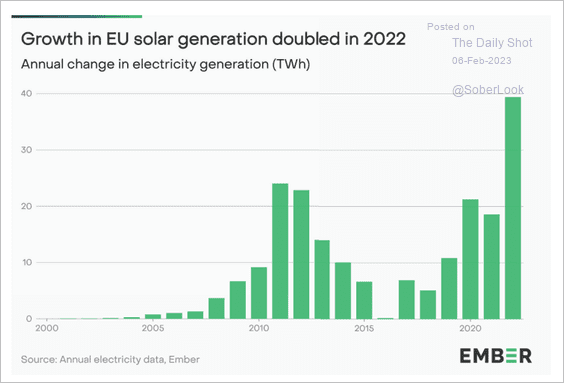 Source: @EmberClimate Read full article
——————–
6. Below are some trends in asylum applications.
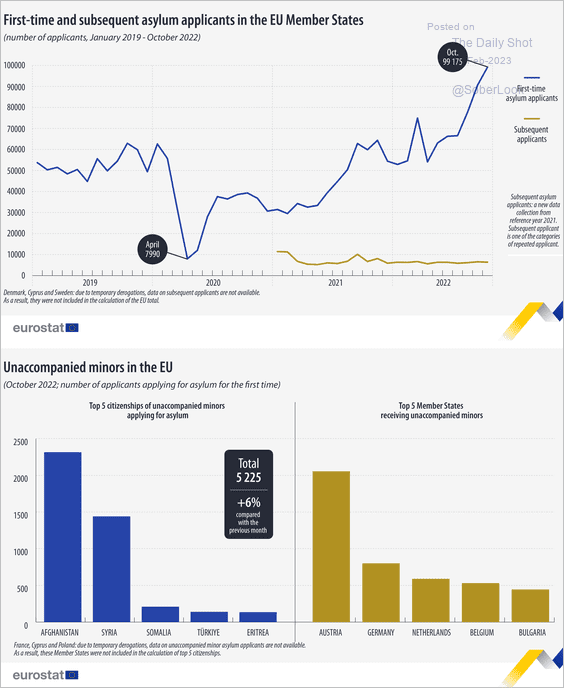 Source: Eurostat Read full article
7. Finally, here is a look at cash usage.
• Cash usage has declined since the start of the pandemic.
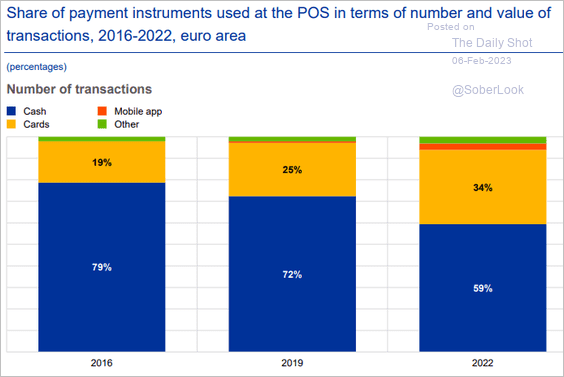 Source: ECB Read full article
• How do different countries view the importance of having cash as a payment option?
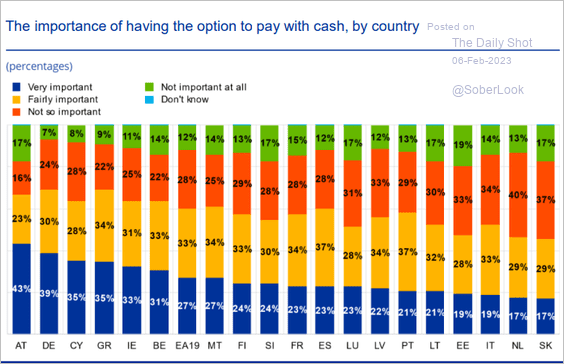 Source: ECB Read full article
Back to Index
Japan
1. Long-term growth forecasts continue to move lower.
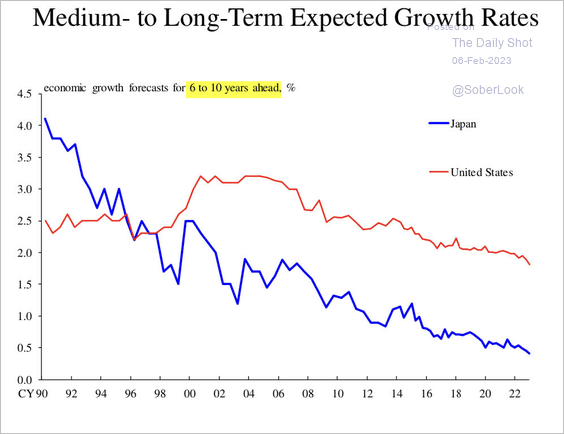 Source: BoJ
2. The yen is significantly undervalued.
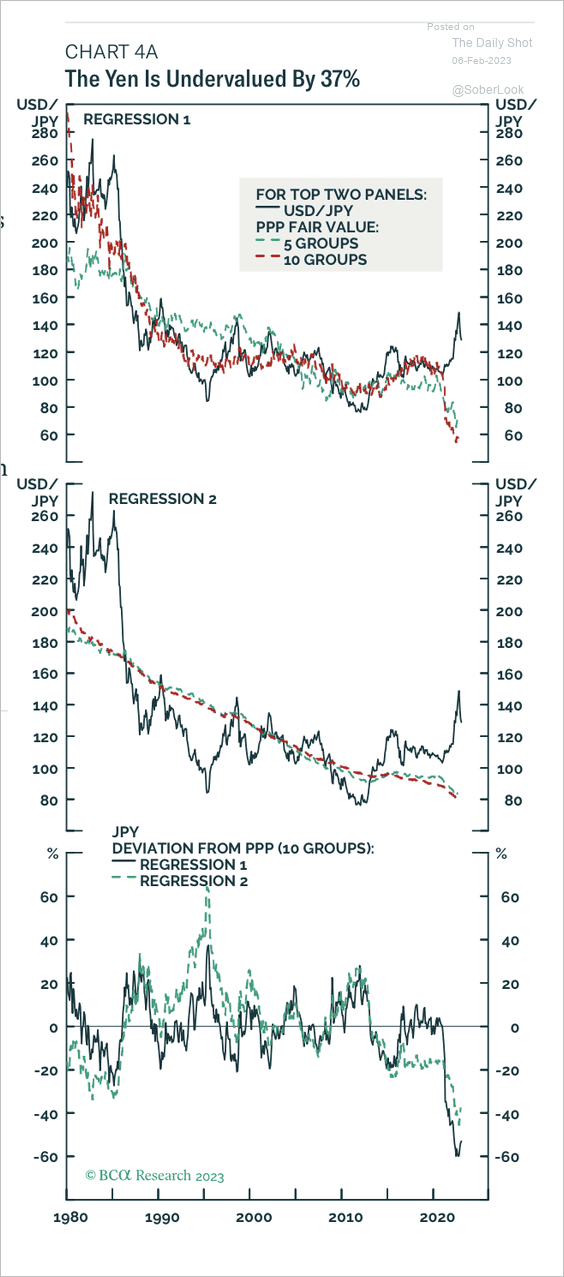 Source: BCA Research
Back to Index
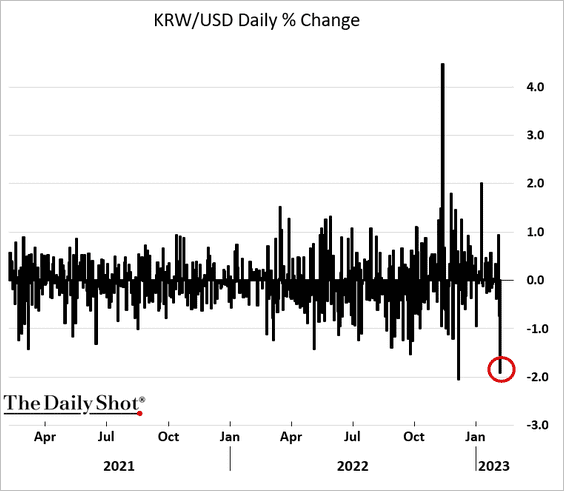
Asia – Pacific
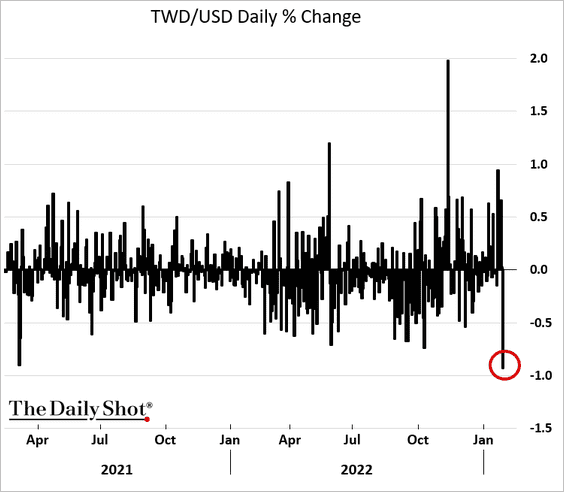
1. Asian currencies declined sharply in response to the US jobs report shocker.
• The South Korean won:
• The Taiwan dollar:
——————–
2. New Zealand’s labor market imbalance remains severe.
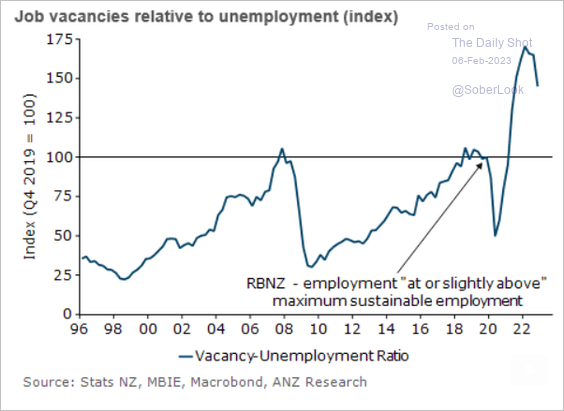 Source: @ANZ_Research
3. The RBA terminal rate is priced at around 3.75%.
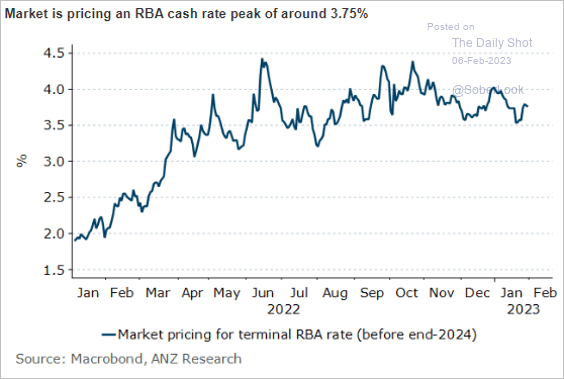 Source: @ANZ_Research
Back to Index
China
1. The rise in A-shares has been relatively mild, possibly indicating subdued mainland sentiment relative to foreign sentiment.
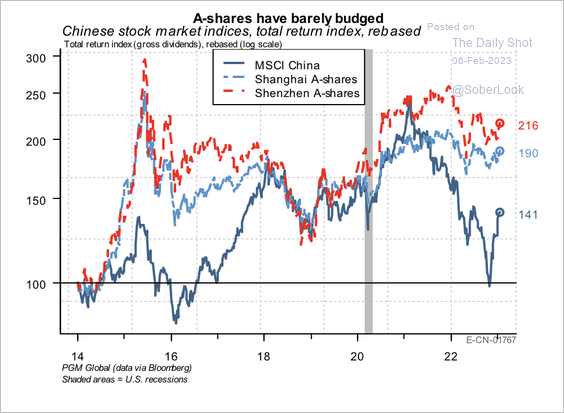 Source: PGM Global
2. The credit impulse remains weak, which could stall a meaningful economic recovery.
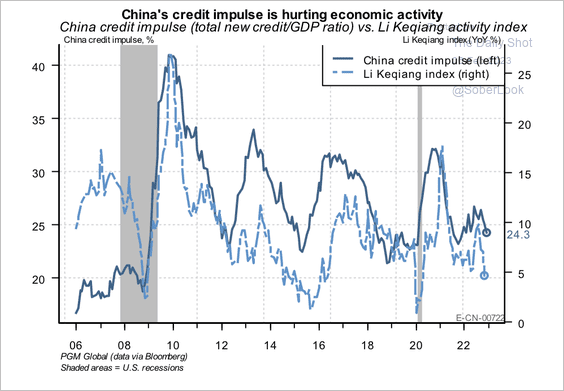 Source: PGM Global
Back to Index
Emerging Markets
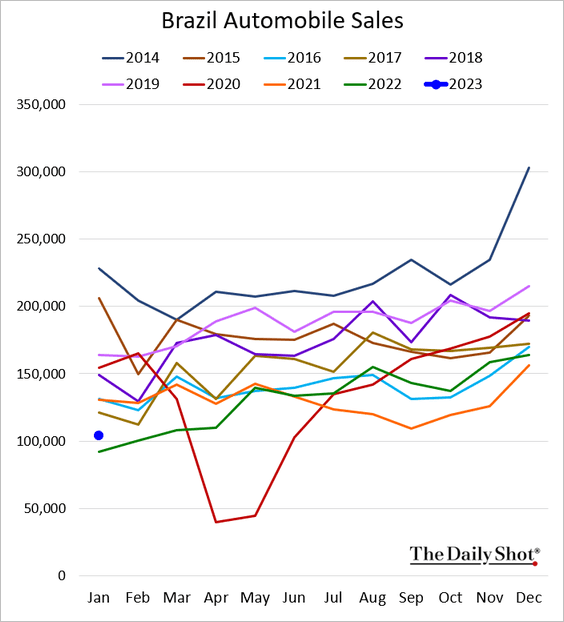
1. Let’s begin with Brazil.
• Manufacturing (still in contraction mode):
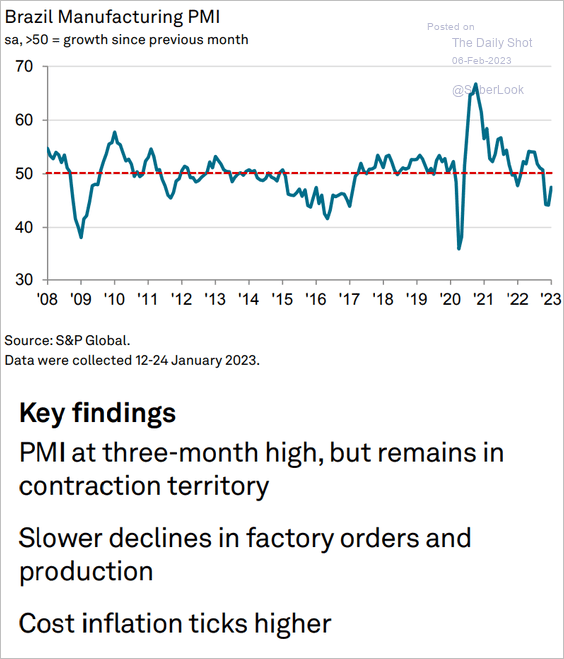 Source: S&P Global PMI
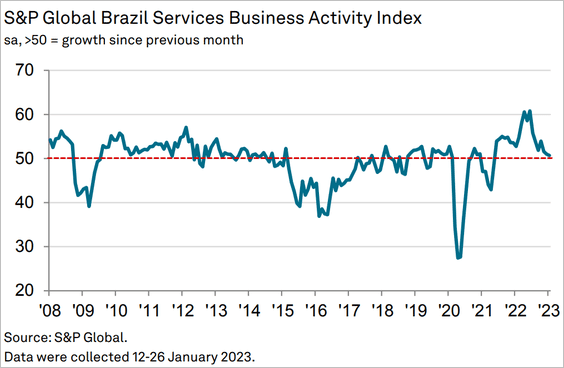
• Services PMI (growth stalling):
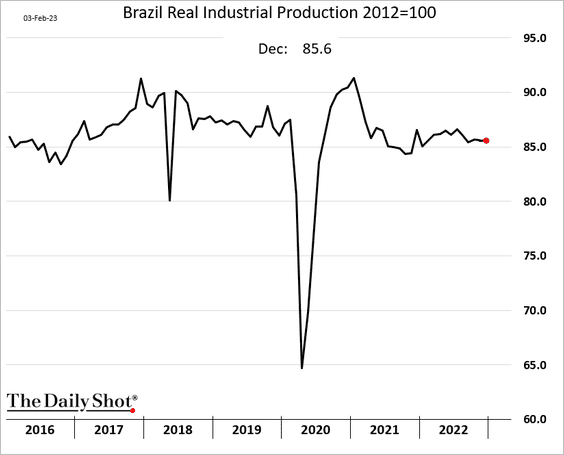
• Industrial production (holding steady, despite weak signals from the PMI data):
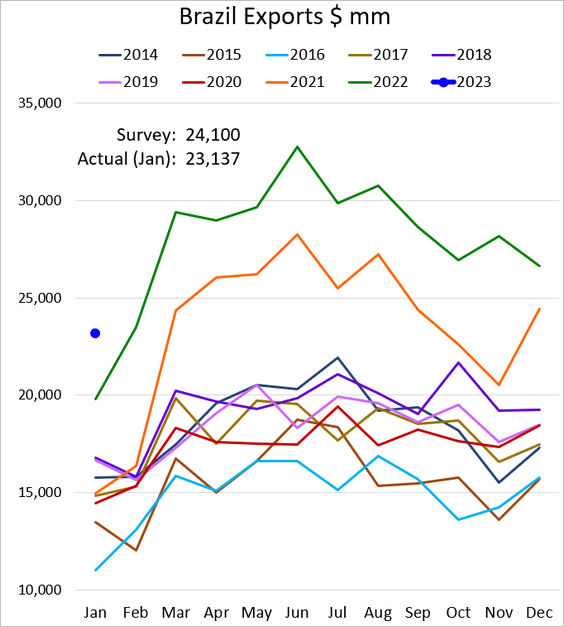
• Exports (strong start):
• Auto sales (above last year’s level but still soft):
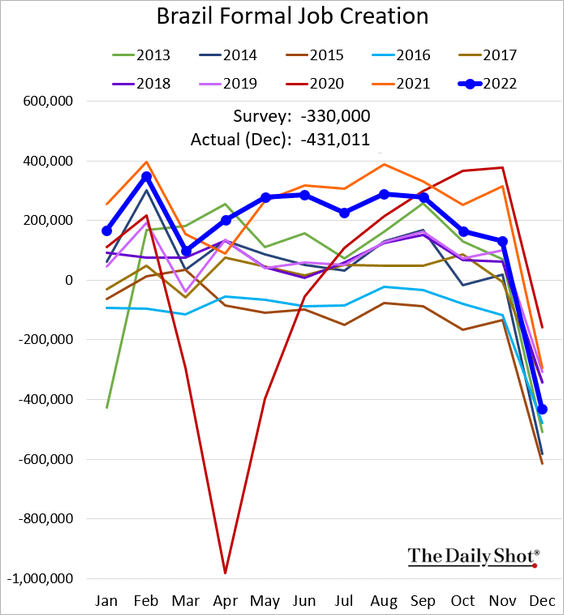
• Formal job creation:
——————–
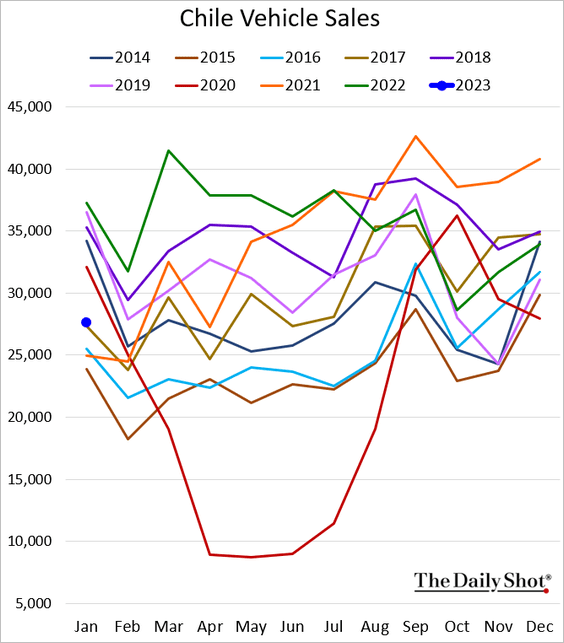
2. Chile’s vehicle sales were well below 2022 levels last month.
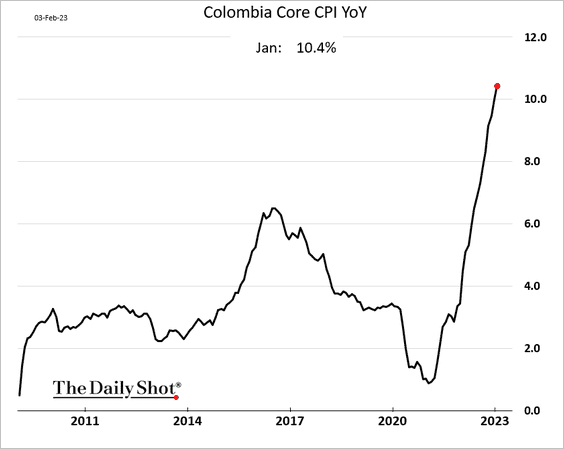
3. Colombia’s core CPI continues to surge.
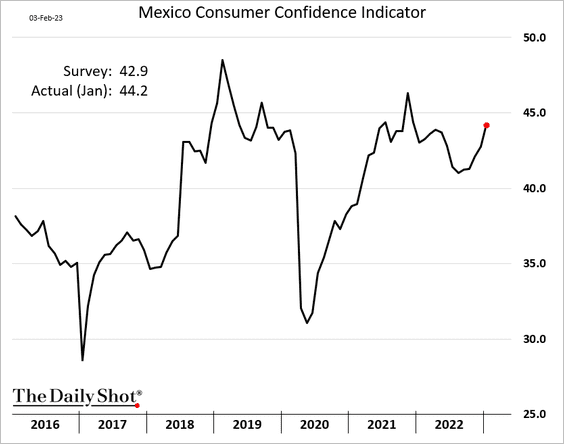
4. Mexico’s consumer confidence keeps rising.
——————–
5. South Africa’s business activity slipped into contraction, according to S&P Global.
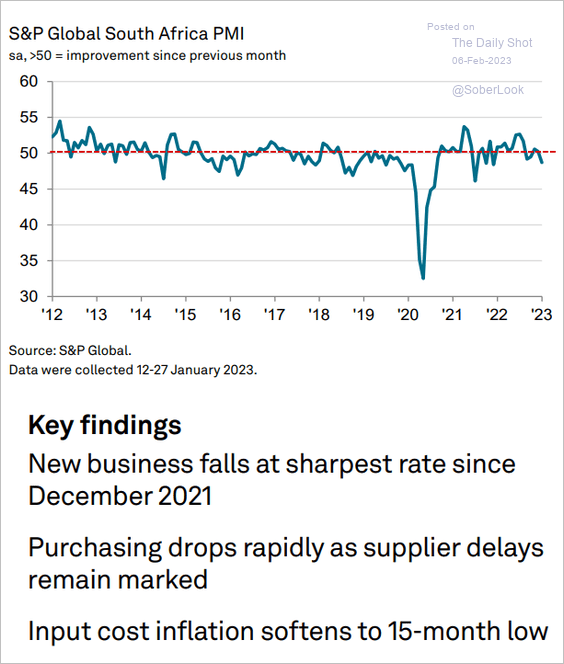 Source: S&P Global PMI
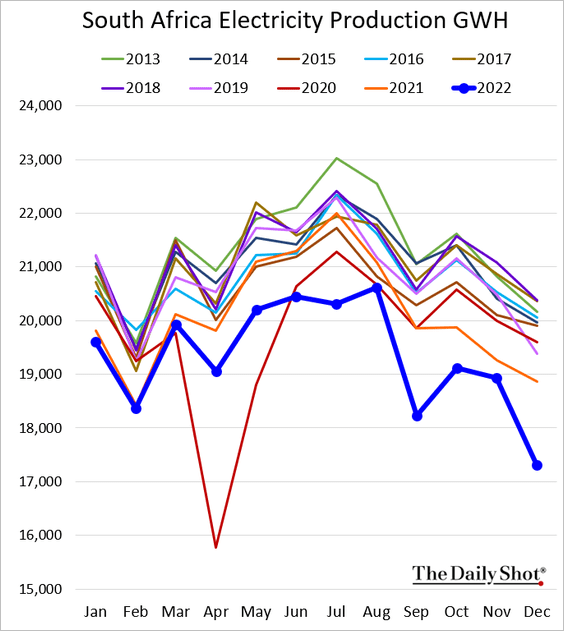
Electricity output tumbled in December.
——————–
6. Saudi business activity is surging amid elevated energy prices.
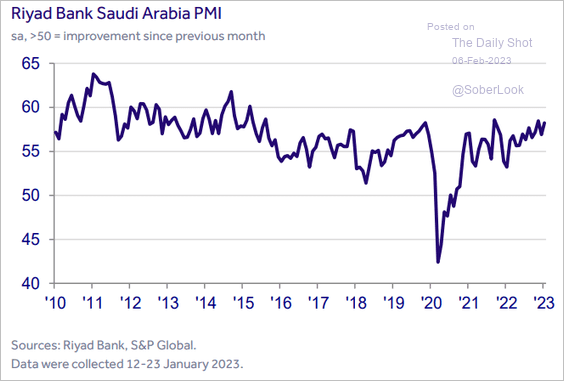 Source: S&P Global PMI
7. Qatar’s business activity slows as the FIFA World Cup boost wanes.
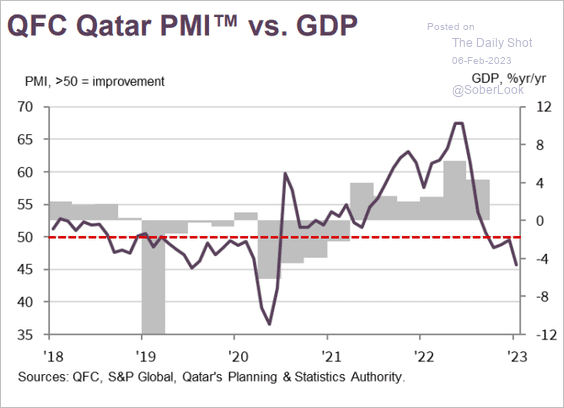 Source: S&P Global PMI
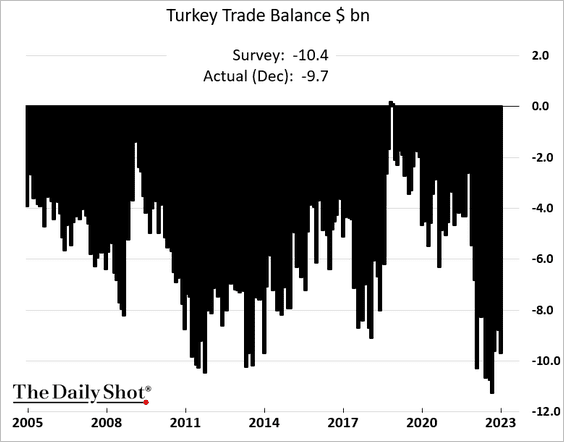
8. Turkey’s trade deficit remains wide.
• Manufacturing has returned to growth.
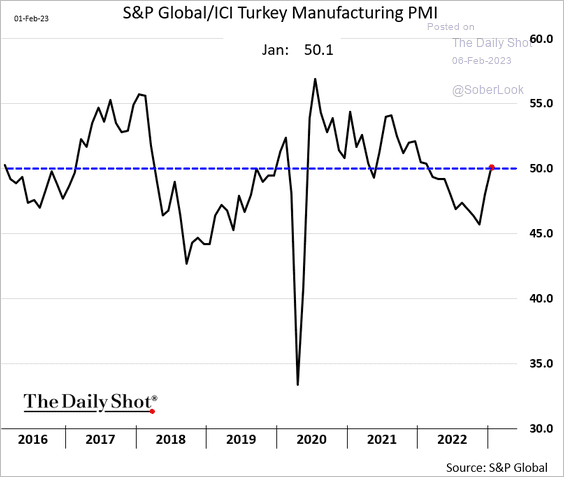 Source: S&P Global PMI
• This chart shows foreign ownership of Turkish assets.
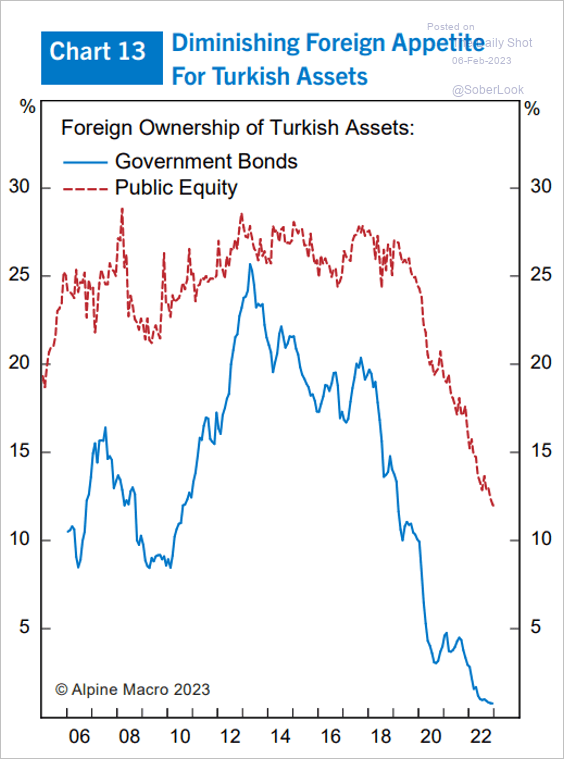 Source: Alpine Macro
——————–
9. India’s service sector growth remains robust.
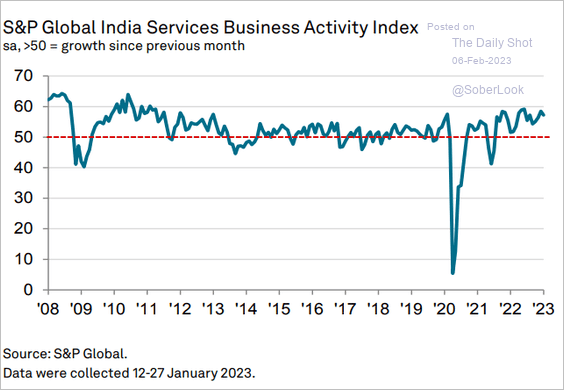 Source: S&P Global PMI
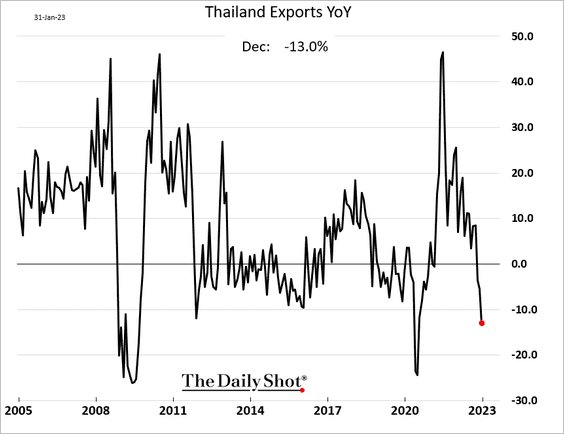
10. Thai exports declined further in December on a year-over-year basis.
11. EM market-based inflation expectations remain elevated relative to DM.
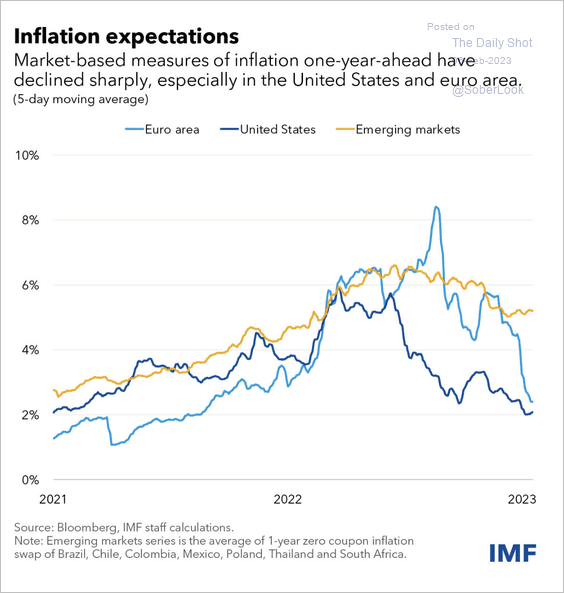 Source: IMF
12. Real wage growth has been negative in many EM economies.
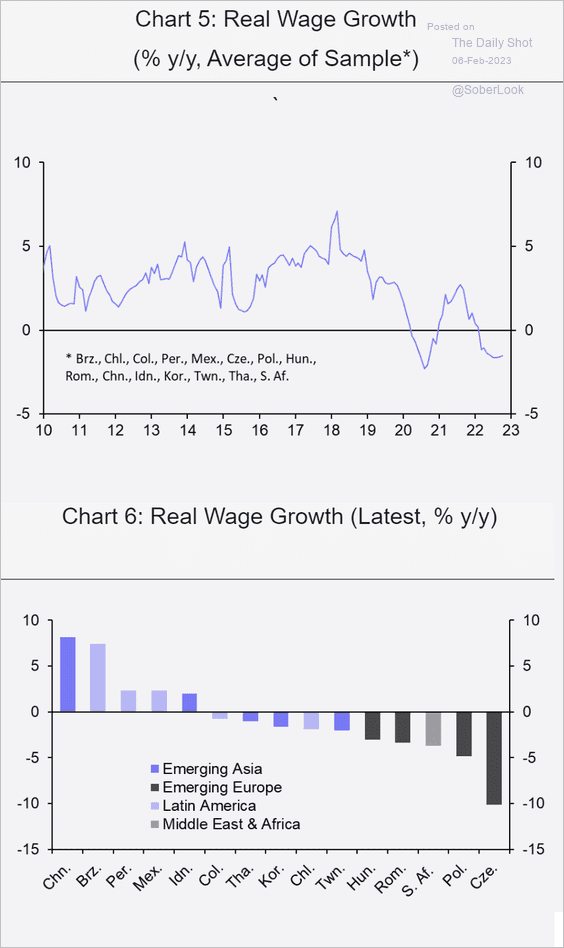 Source: Capital Economics
13. This chart shows 10-year bond term premia in select economies.
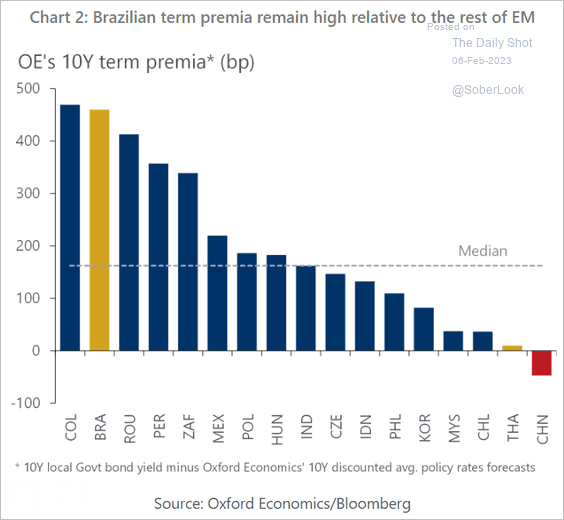 Source: Oxford Economics
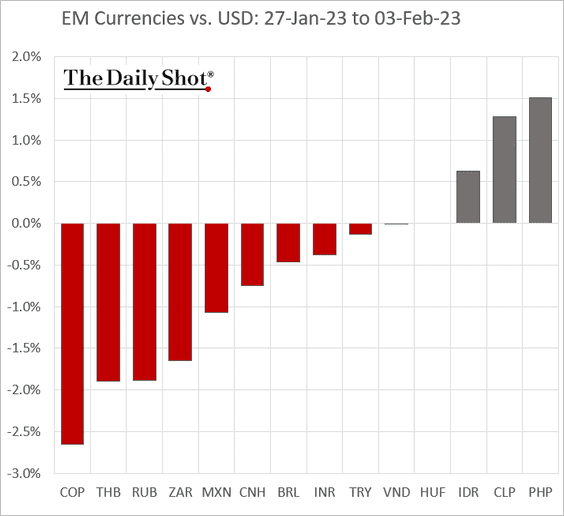
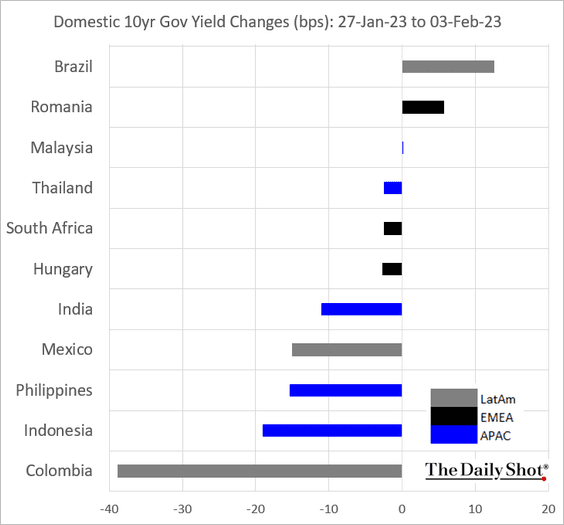
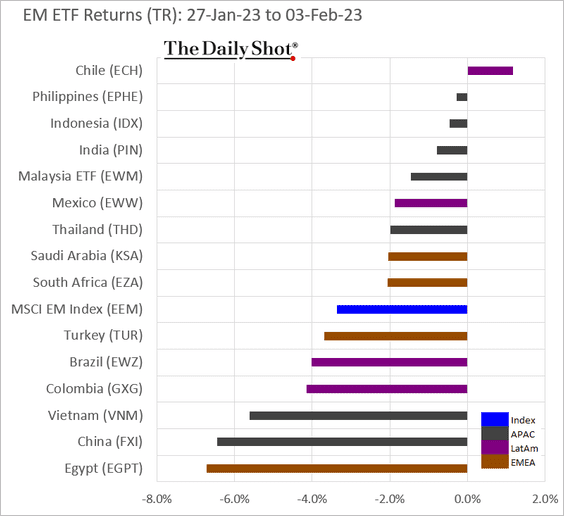
14. Finally, we have last week’s performance.
• Currencies:
• Bond yields:
• Equity ETFs:
Back to Index
Commodities
1. This chart shows the cereal crop production mix changes since 1981.
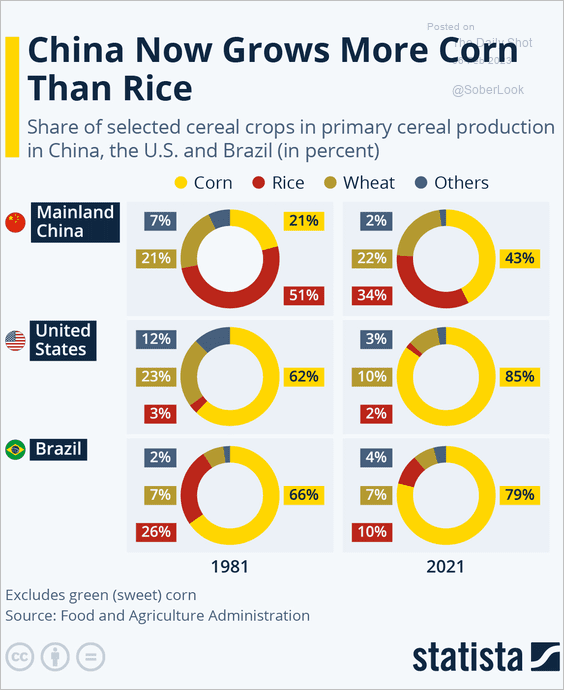 Source: Statista
2. US orange juice futures hit a record high.
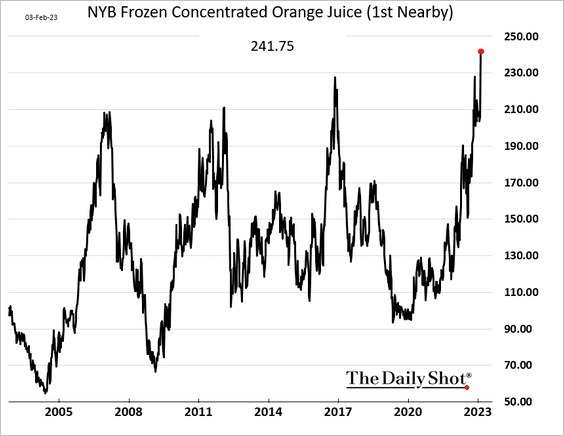
 Source: @WSJ Read full article
——————–
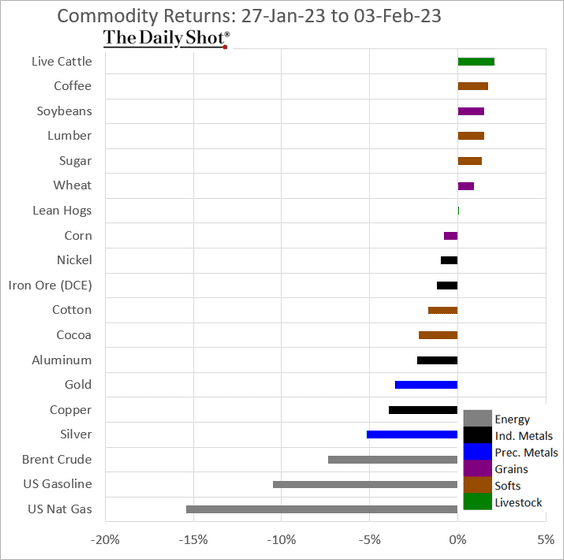
3. Here is last week’s performance across key commodity markets.
Back to Index
Energy
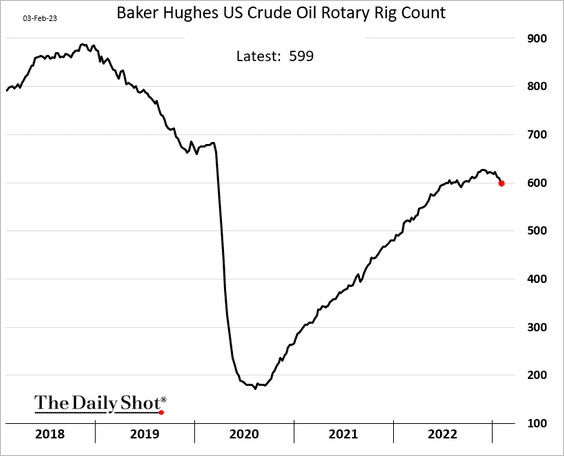
1. The US oil rig count dipped back below 600 last week.
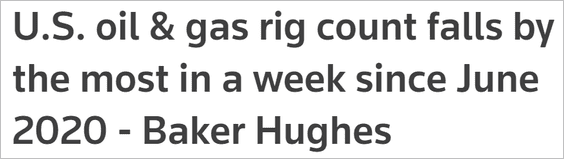 Source: Reuters Read full article
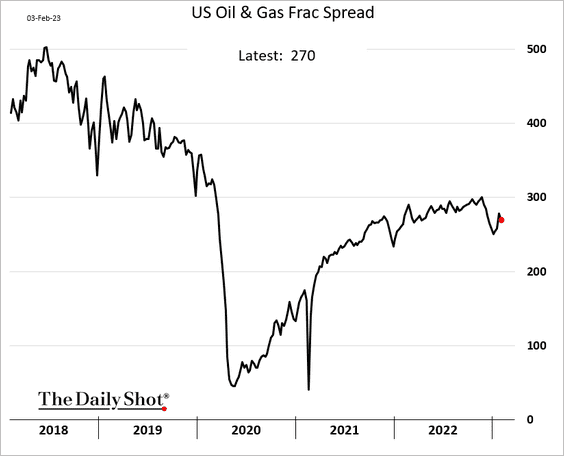
Fracking activity remains well below the 2022 peak.
——————–
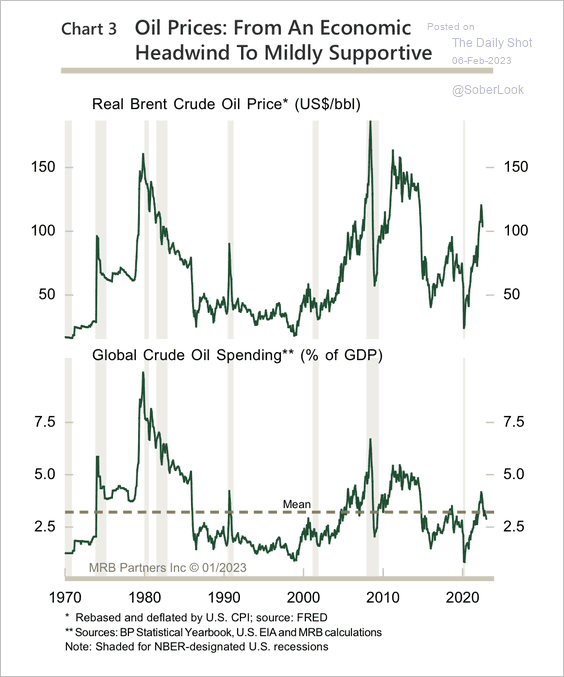
2. Global crude oil spending dipped below its long-term average during the recent price drop. Spending has been relatively weak during this cycle.
 Source: MRB Partners
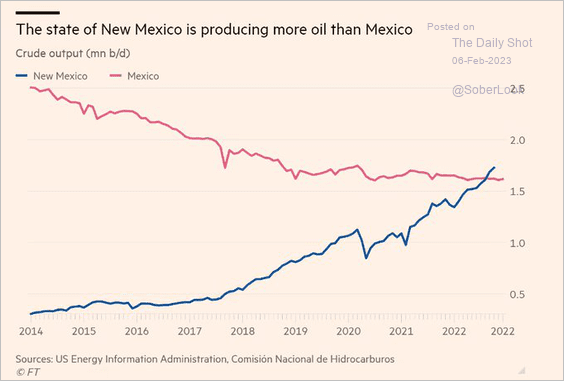
3. The state of New Mexico produces more oil than Mexico.
 Source: @OilSheppard, @FR Read full article
4. Next, we have some updates on renewable energy.
• Offshore wind installations:
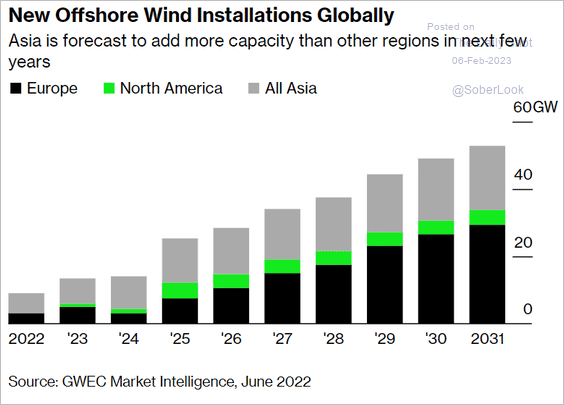 Source: @messageannkoh, @business Read full article
• Solar capacity vs. solar generation in the US and China:
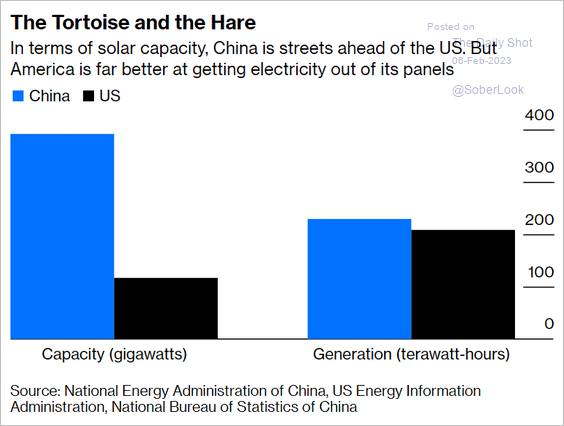 Source: @davidfickling, @opinion Read full article
• US renewable diesel capacity projections:
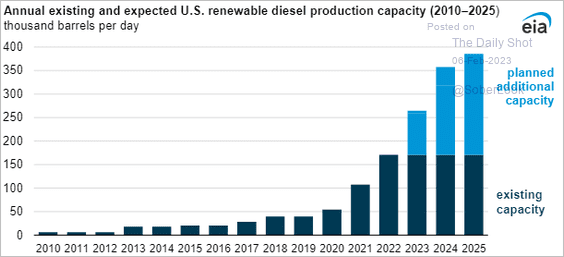 Source: @EIAgov
• Wind turbines’ rotor diameter:
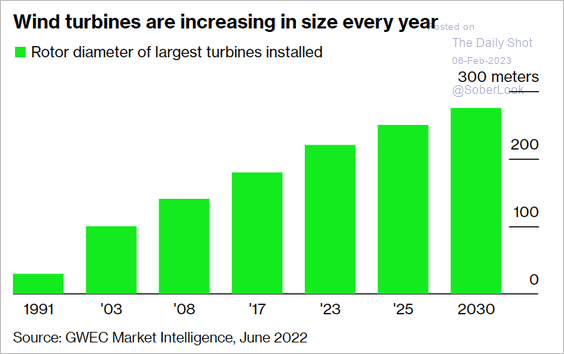 Source: @messageannkoh, @business Read full article
Back to Index
Equities
1. It’s decision time with respect to the 2008 analog.
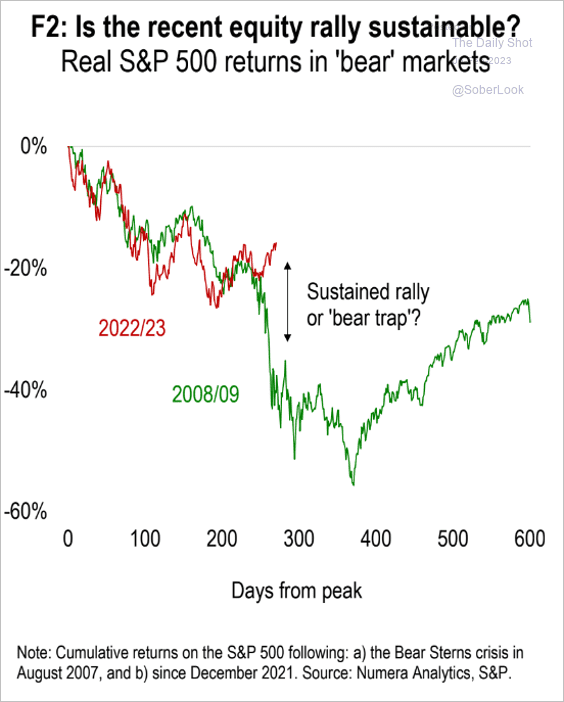 Source: Numera Analytics (@NumeraAnalytics)
2. Morgan Stanley’s model points to a deep earnings recession.
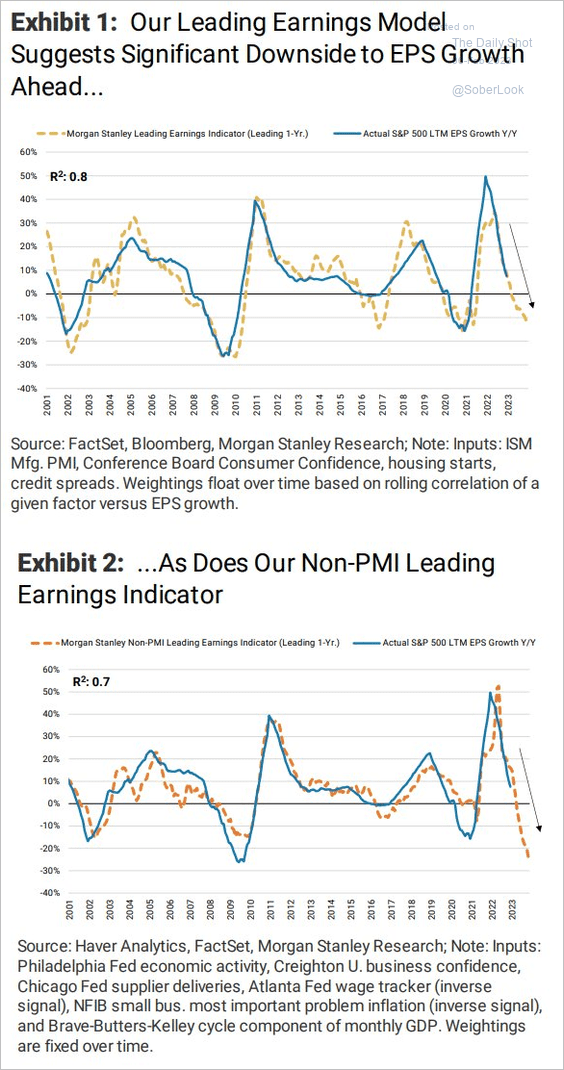 Source: Morgan Stanley Research; @dlacalle_IA
3. Net revenue surprises have been low relative to historical levels.
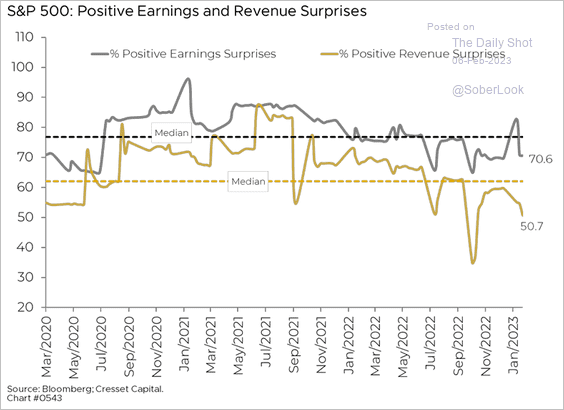 Source: Jack Ablin, Cresset Wealth Advisors
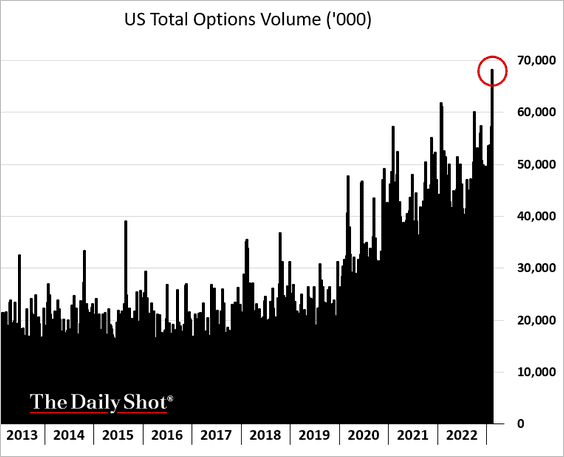
4. Options volume surged at the end of last week.
5. It was a strong week for retail market orders.
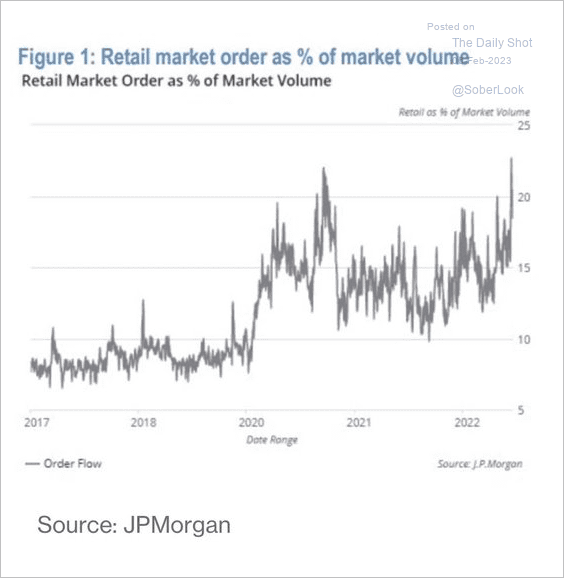 Source: JP Morgan Research; @business, @luwangnyc Read full article
6. The NYSE New Highs/New Lows indicator reached its best reading since 2021.
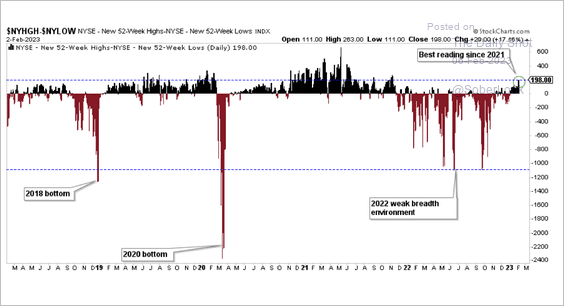 Source: Aazan Habib, Paradigm Capital
7. A majority of S&P 500 tech stocks are trading above their 200-day moving average.
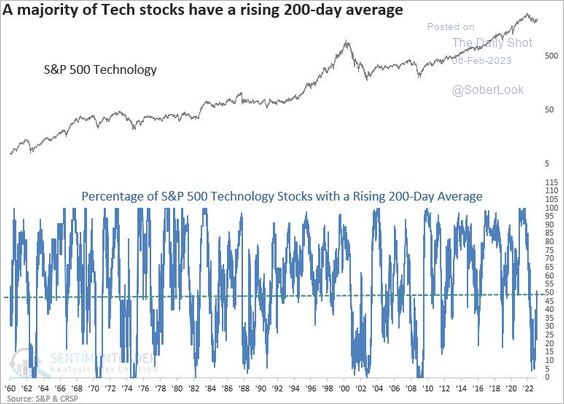 Source: @DeanChristians
• Most S&P 500 consumer discretionary stocks are no longer in a bear market.
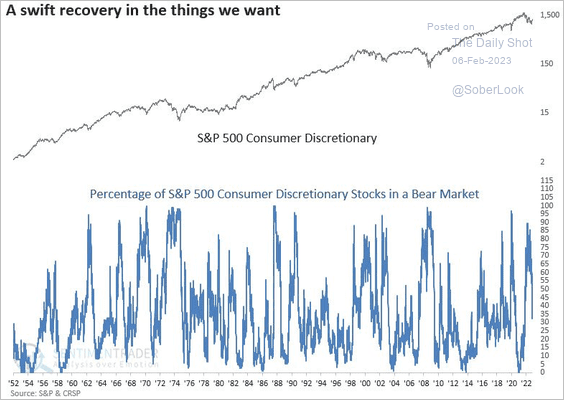 Source: @DeanChristians
——————–
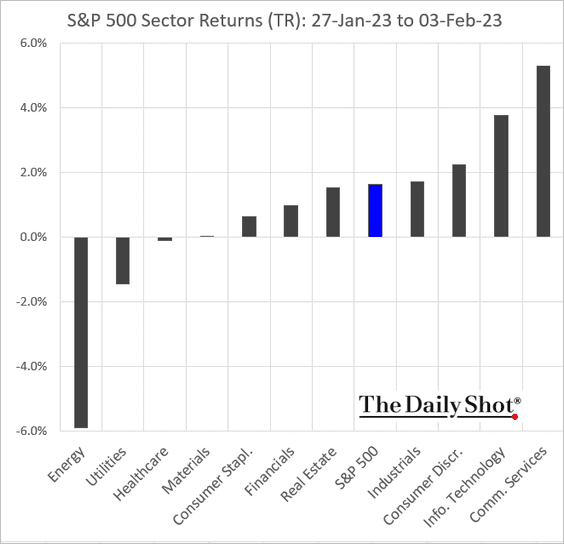
9. Finally, we have some performance data from last week.
• Sectors:
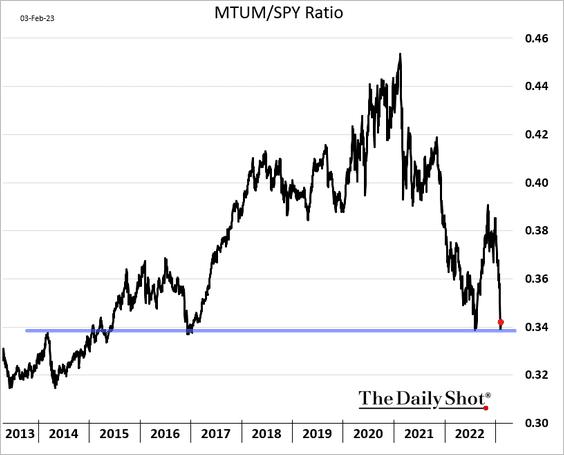
• Equity factors:
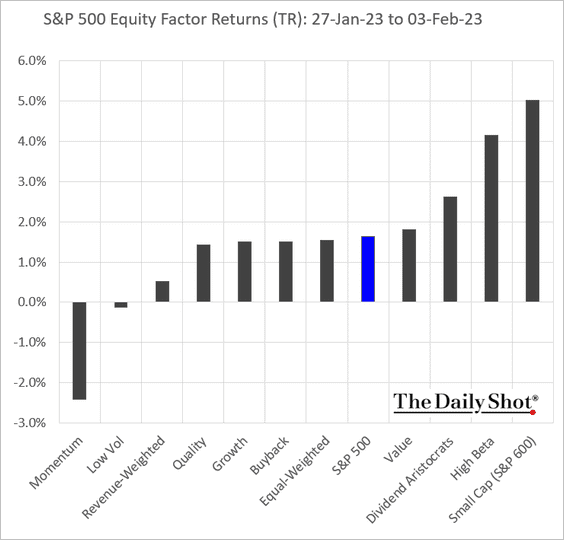
Has the momentum factor found support relative to the S&P 500?
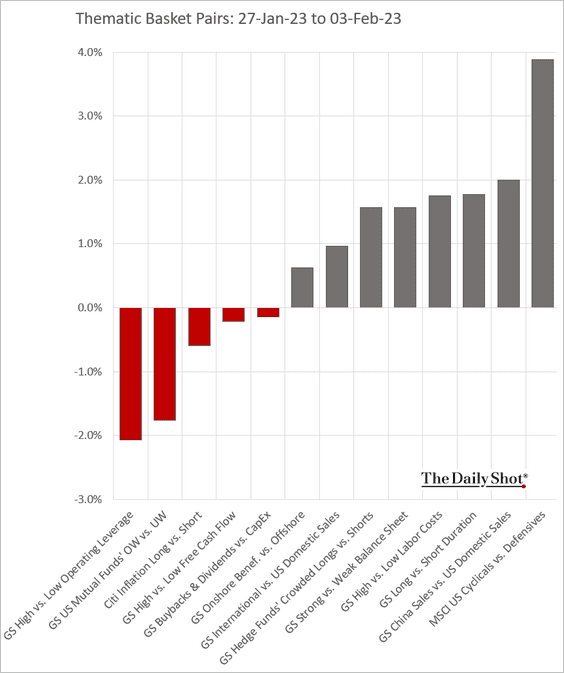
• Macro basket pairs:
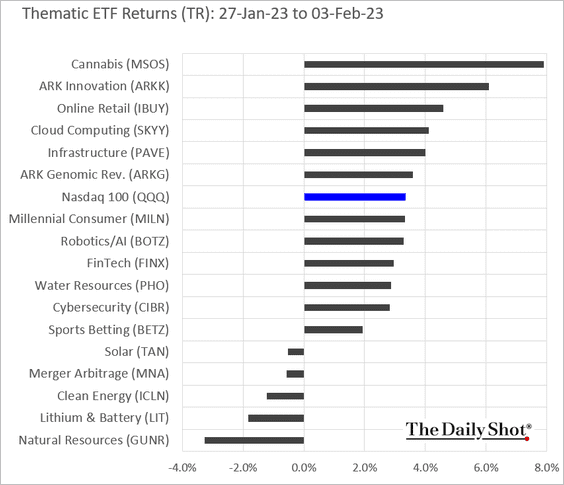
• Thematic ETFs:
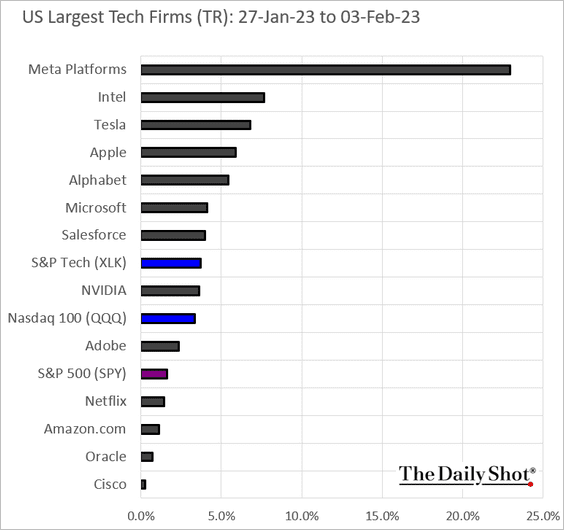
• Largest US tech firms:
Back to Index
Credit
1. Key economic indicators continue to flash warning signals for credit.
• ISM vs. high-yield:
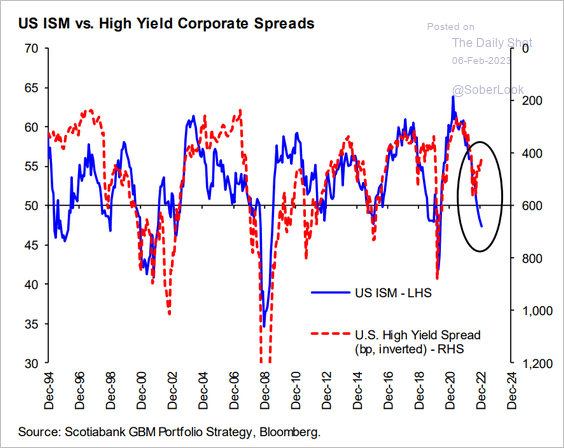 Source: Hugo Ste-Marie, Portfolio & Quantitative Strategy Global Equity Research, Scotia Capital
• The leading index vs. investment-grade:
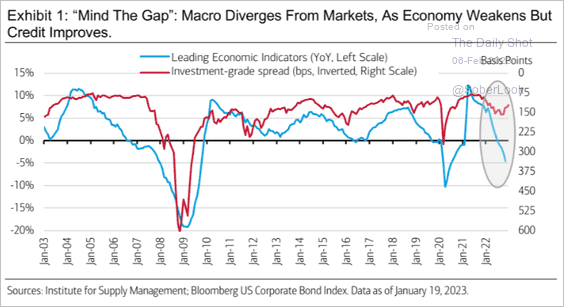 Source: Merrill Lynch
——————–
2. Bankraptices picked up in January.
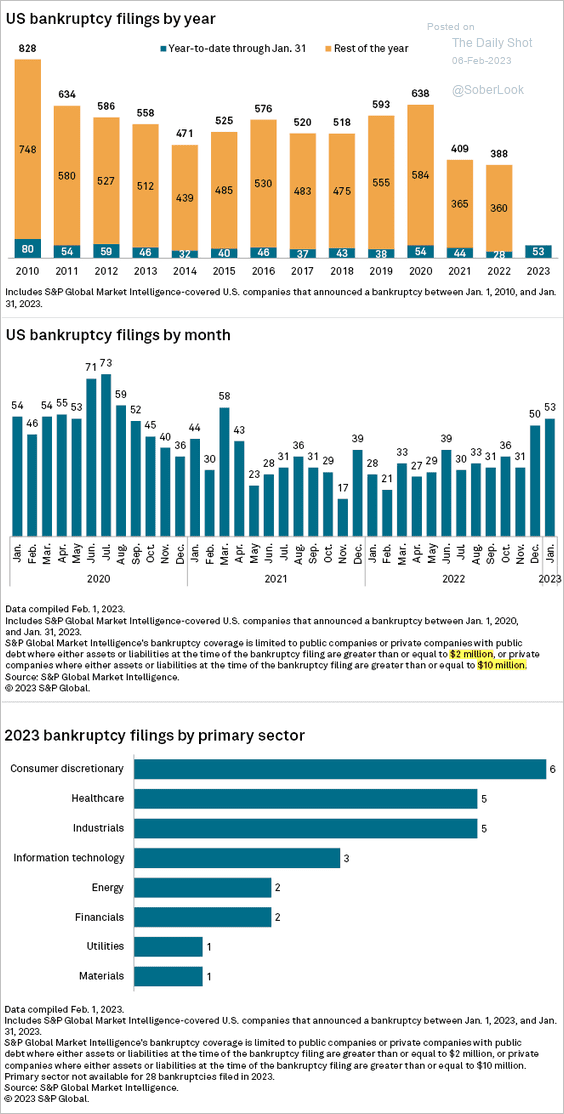 Source: S&P Global Market Intelligence
3. Muni issuance slowed at the end of last year.
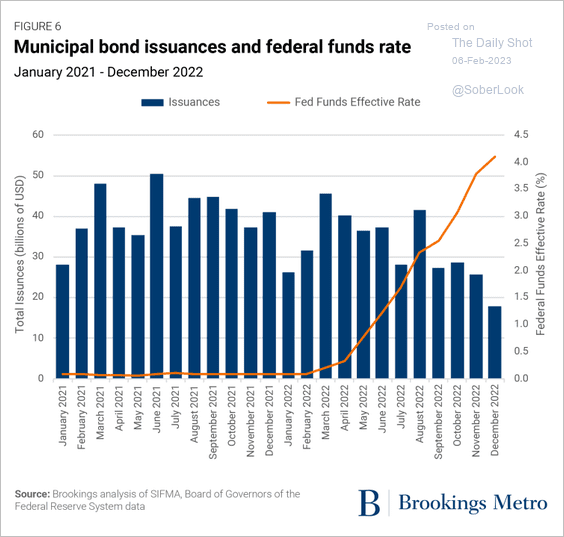 Source: Brookings Read full article
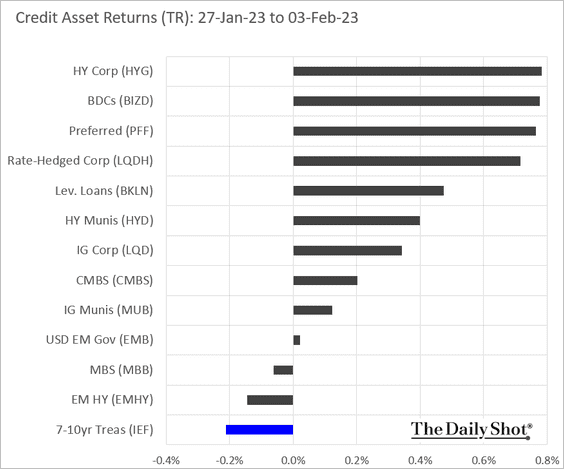
4. This chart shows last week’s performance by asset class.
Back to Index
Global Developments
1. There is a positive relationship between R&D and long-term productivity growth, although the magnitude of the productivity gains is a topic of debate amongst economists.
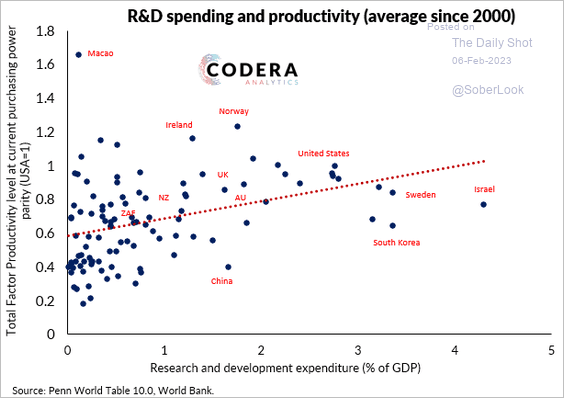 Source: Codera Analytics
2. Here is the increase in household leverage since 1999 in select economies.
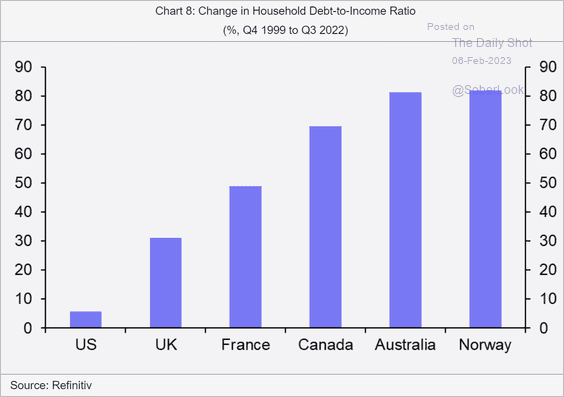 Source: Capital Economics
3. How did the manufacturing PMIs change over the past month?
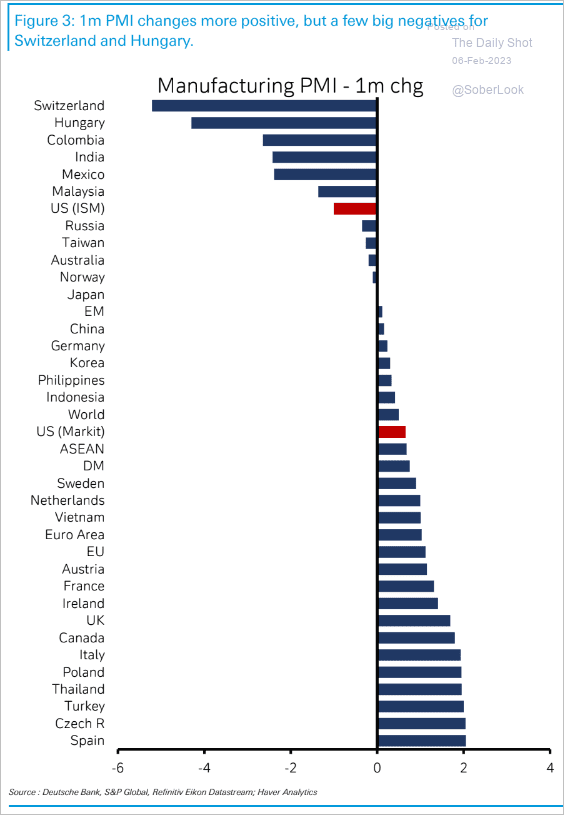 Source: Deutsche Bank Research
4. This chart shows the number of housing units per one thousand people in select economies.
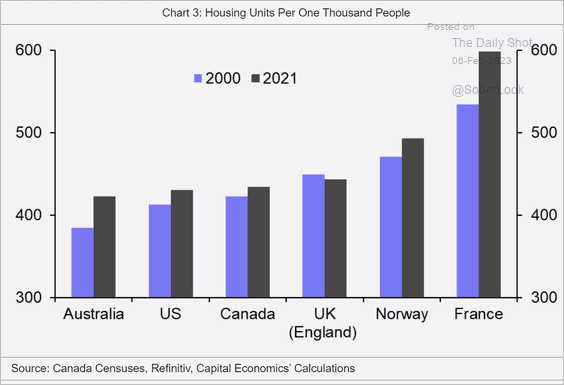 Source: Capital Economics
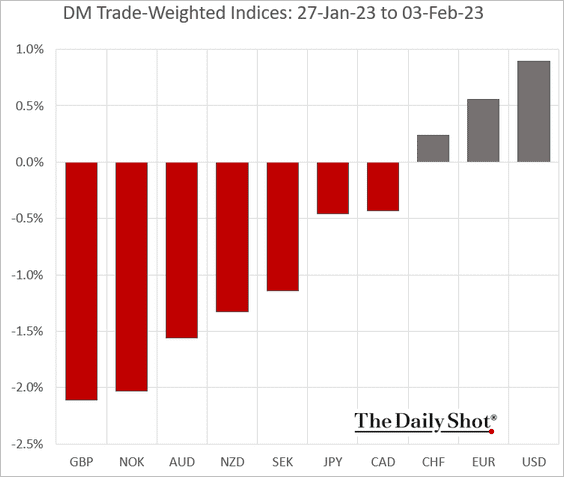
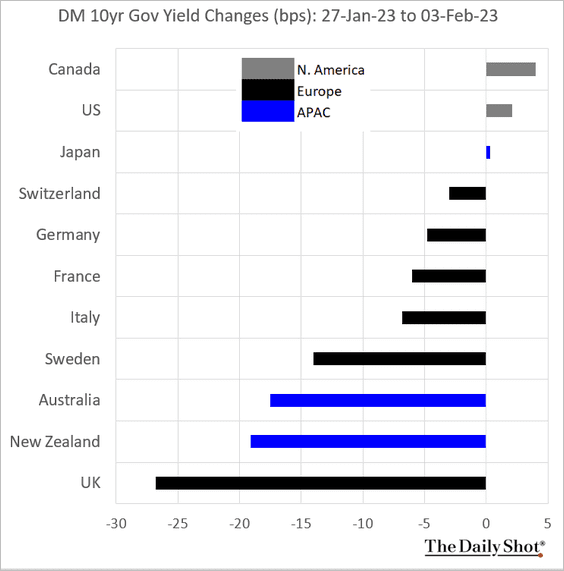
5. Finally, we have some performance data for advanced economies.
• Trade-weighted currency indices:
• Bond yields:
——————–
Food for Thought
1. Largest media companies:
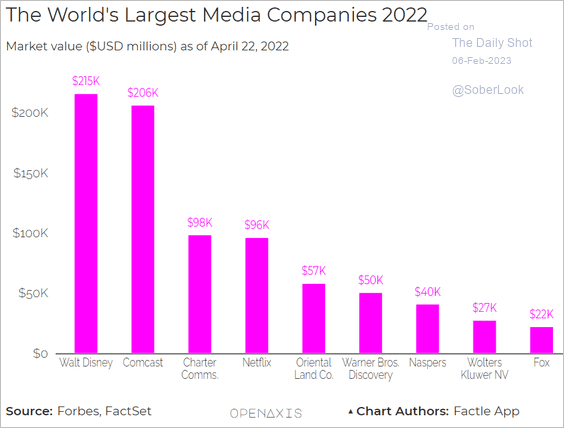 Source: @OpenAxisHQ
2. Online gambling markets:
 Source: Statista
3. US corporate profit margins since 1950:
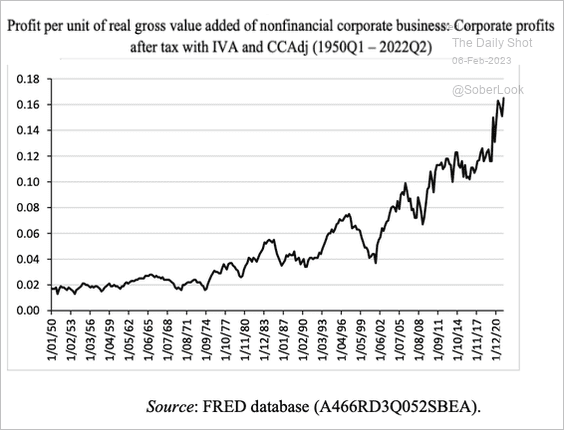 Source: @heimbergecon
4. Top pizza chains:
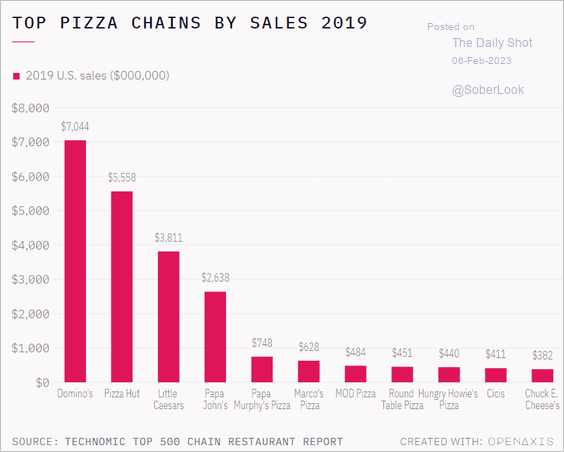 Source: @OpenAxisHQ
5. Box-office revenue in the US and Canada:
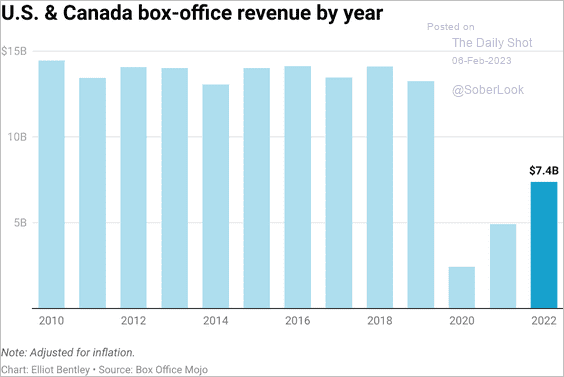 Source: @Datawrapper, @elliot_bentley
6. Aid to Ukraine:
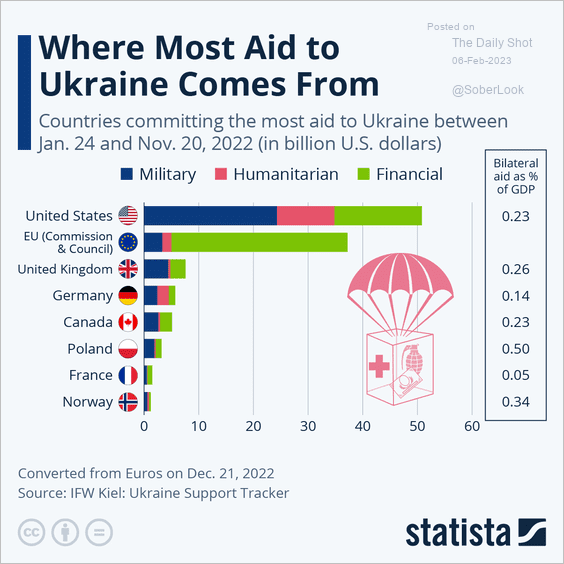 Source: Statista
7. Long COVID:
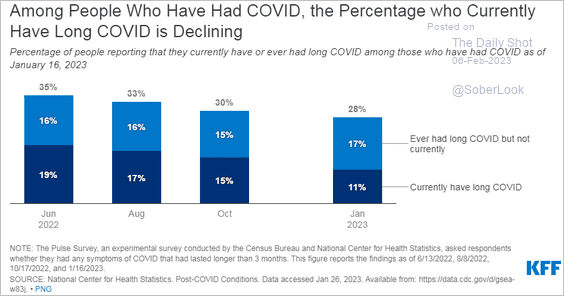 Source: KFF Read full article
8. US issuance of work visas:
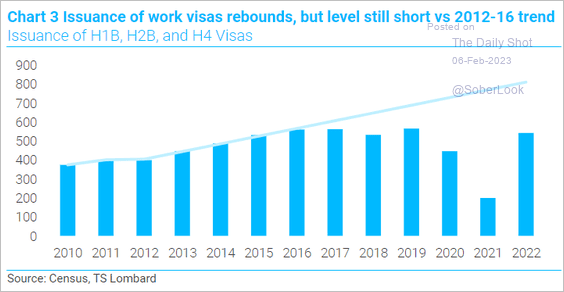 Source: TS Lombard
9. Jonathan, the world’s oldest known land animal (190 years old):
 Source: CBS News Read full article
 Source: St Helena Tourism Read full article
——————–
Back to Index