
The Daily Shot: 08-Feb-23
• The United States
• Canada
• The United Kingdom
• The Eurozone
• Europe
• Asia – Pacific
• China
• Emerging Markets
• Commodities
• Energy
• Equities
• Alternatives
• Credit
• Rates
• Global Developments
• Food for Thought
The United States
1. In his speech, Chair Powell commented on the robust January jobs report, suggesting that the Fed has much more work ahead to get inflation under control.
It kind of shows you why we think this will be a process that takes a significant period of time.
The stock market saw the speech as sufficiently “benign” to send share prices higher.
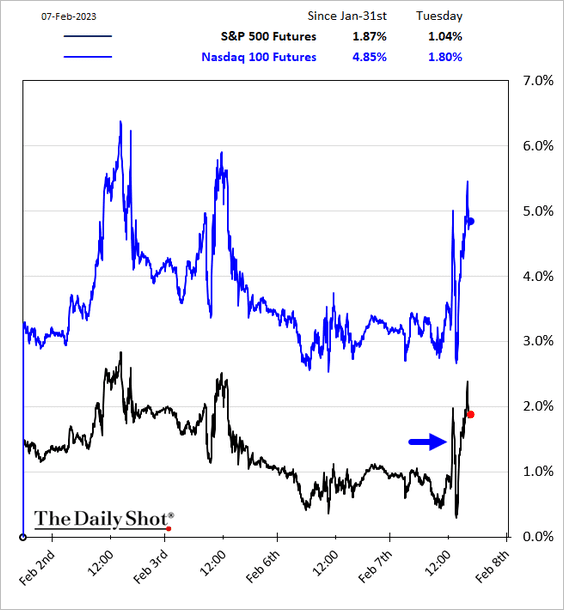
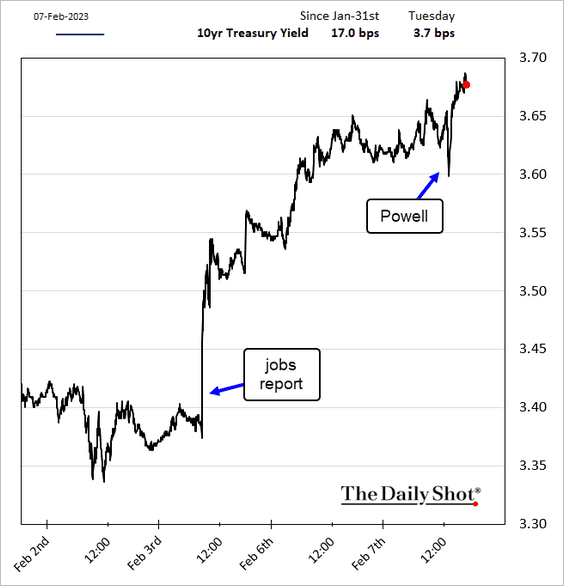
But bond yields edged up.
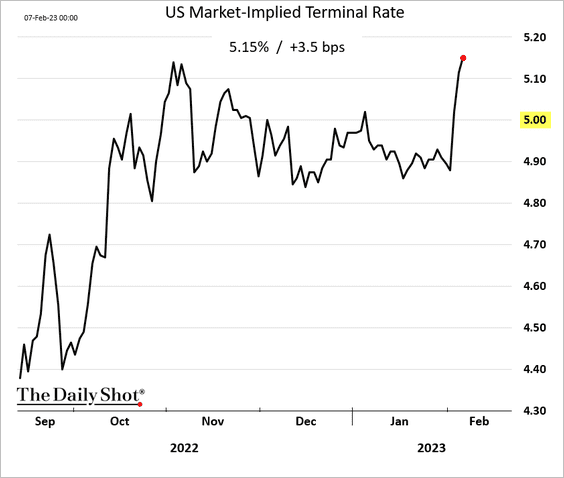
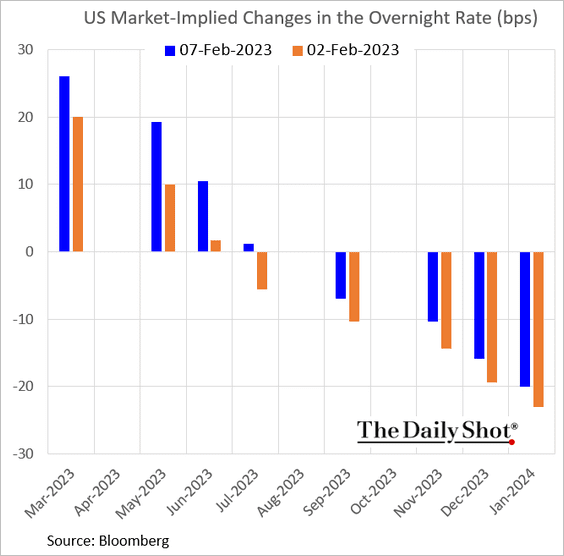
The market has sharply repriced the fed funds rate trajectory over the past few days, …
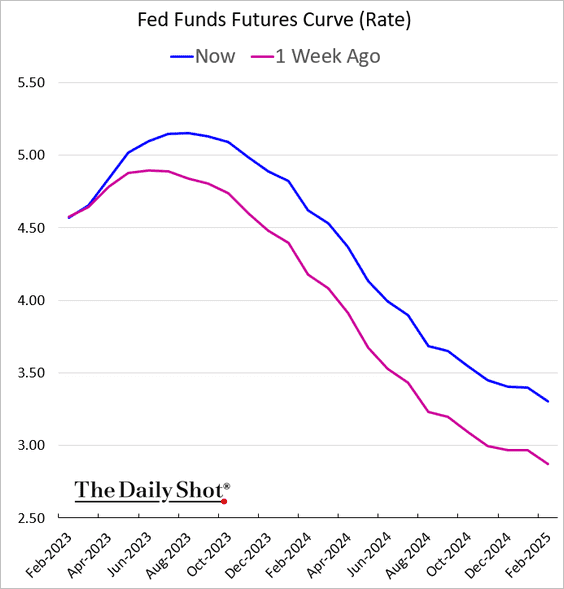
… sending the terminal rate to a new high. That’s why the equity market’s upbeat response was a surprise.
This chart shows the changes in rate hike expectations since last Thursday.
——————–
2. Next, we have some updates on consumer credit.
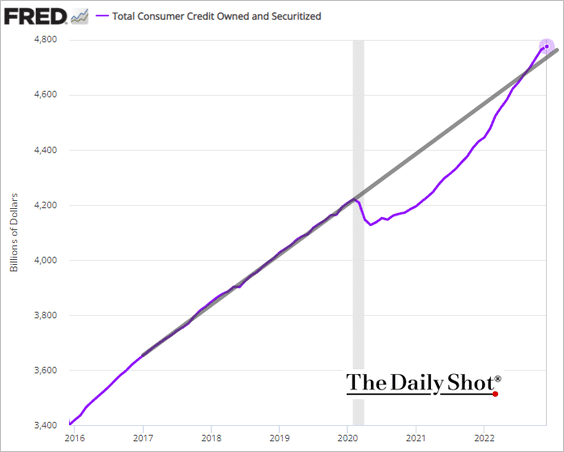
• Growth in total consumer credit slowed in December.
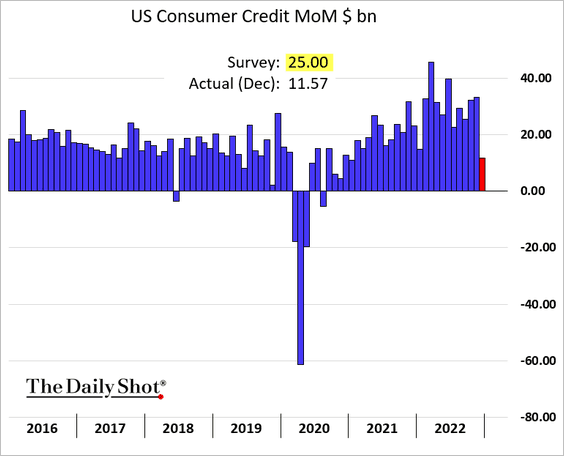
• The level remains above the pre-COVID trend.
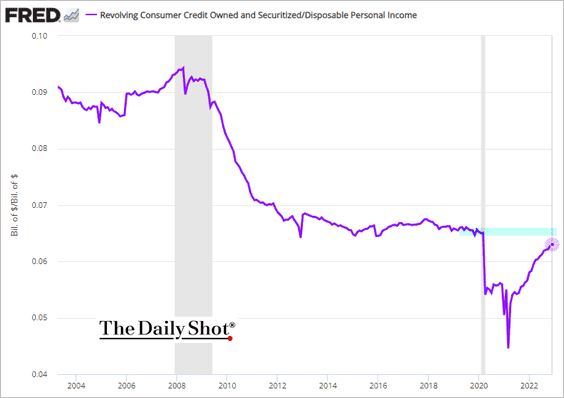
• Credit card debt continues to climb.
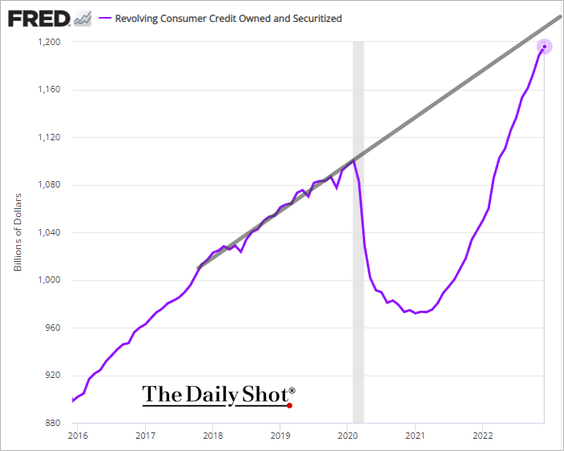
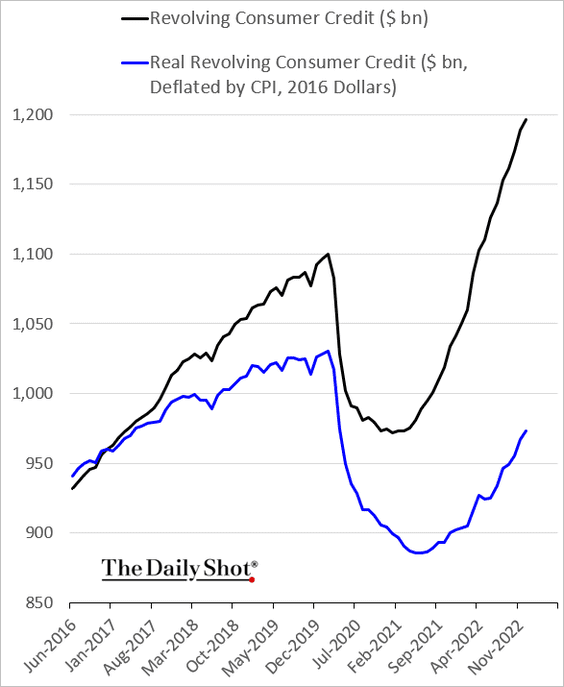
– Credit card debt as a share of disposable personal income remains below pre-COVID levels.
– Borrowed cash doesn’t go very far when we take price gains into account.
• Auto loans as a share of disposable income are well above pre-COVID levels.
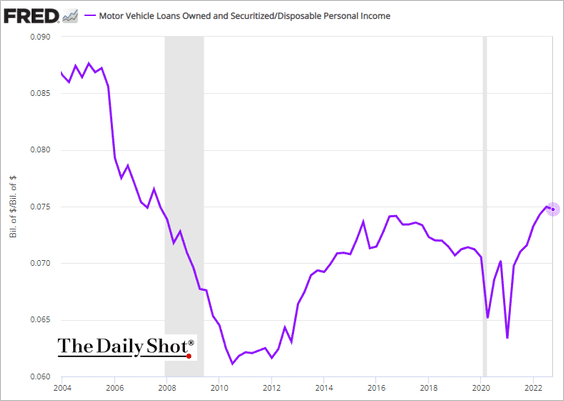
– Auto loan demand has been waning as banks tighten lending standards.
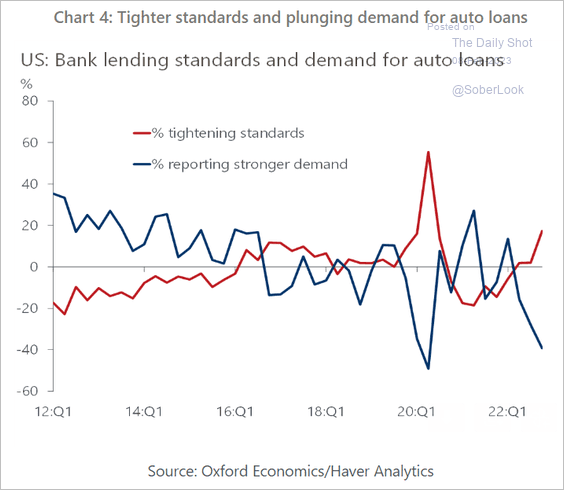 Source: Oxford Economics
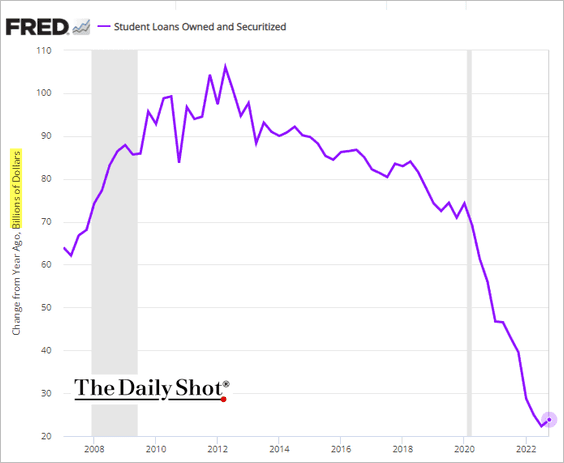
• Student loan growth slowed substantially since the start of the pandemic.
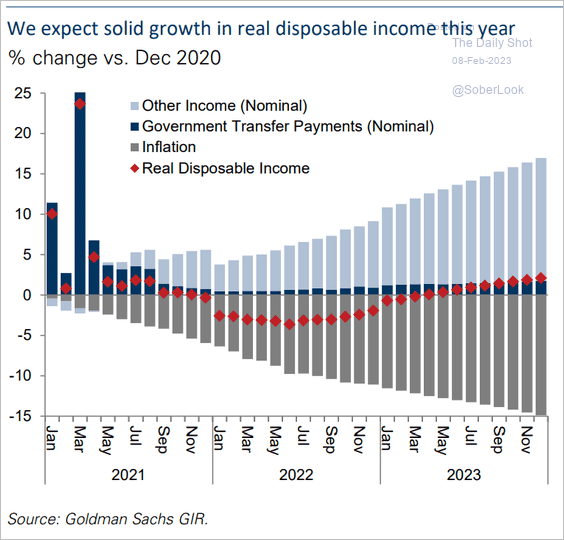
• Goldman expects real disposable income to grow this year.
 Source: Goldman Sachs
——————–
3. The Atalanta Fed’s GDPNow model forecast for Q1 growth is holding above 2% (annualized), …
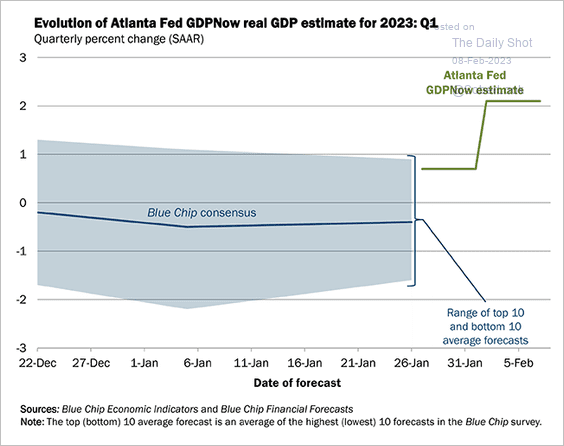 Source: @AtlantaFed Read full article
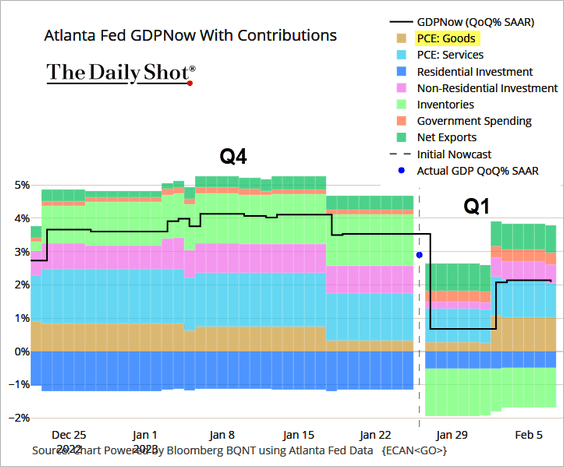
… boosted by expectations of robust consumer spending on goods.
 Source: @TheTerminal, Bloomberg Finance L.P.
——————–
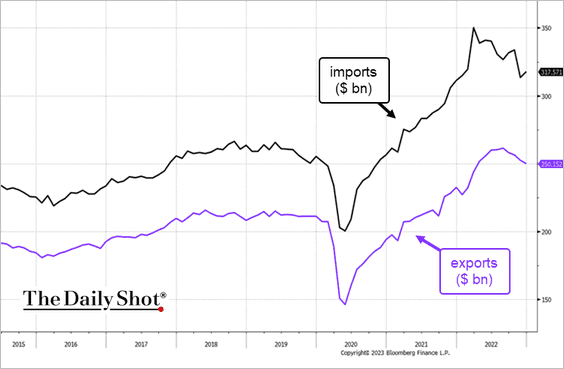
4. The trade deficit widened in December, …
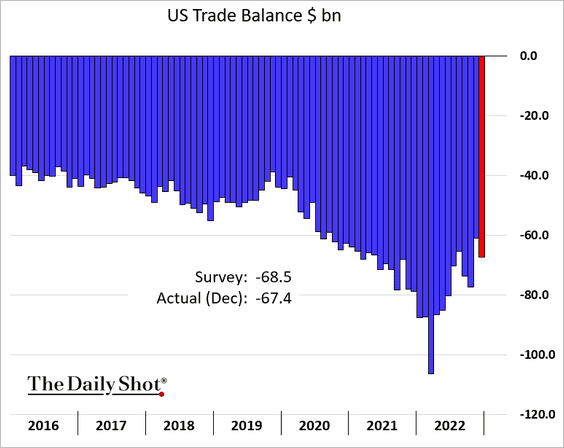
… as imports edged higher.
 Source: @TheTerminal, Bloomberg Finance L.P.
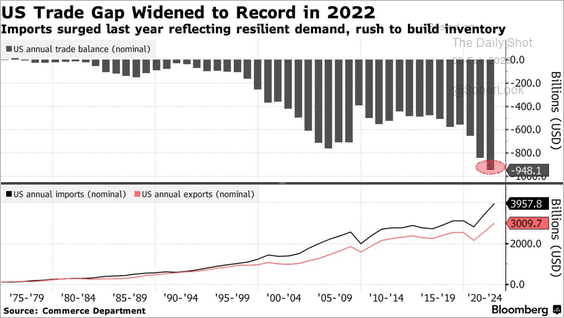
On a yearly basis, the trade gap hit a new record in 2022.
 Source: @gutavsaraiva, @economics Read full article
——————–
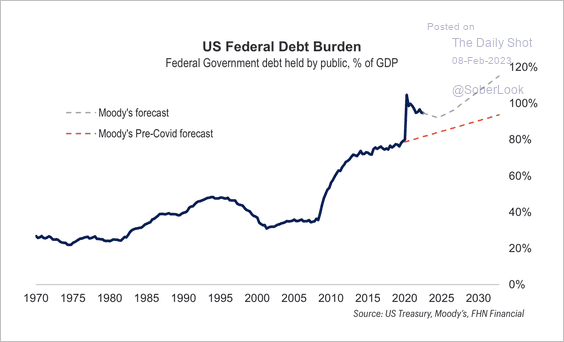
5. Moody’s projects the federal debt burden to grow from rising entitlement liabilities and slowing working-age population growth over the next decade.
 Source: FHN Financial
Back to Index
Canada
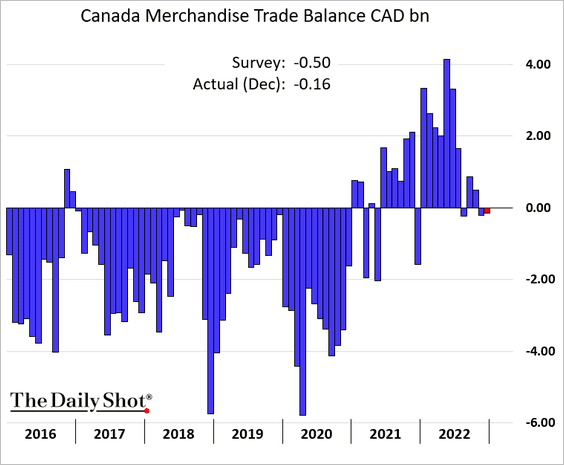
1. The trade gap was narrower than expected in December.
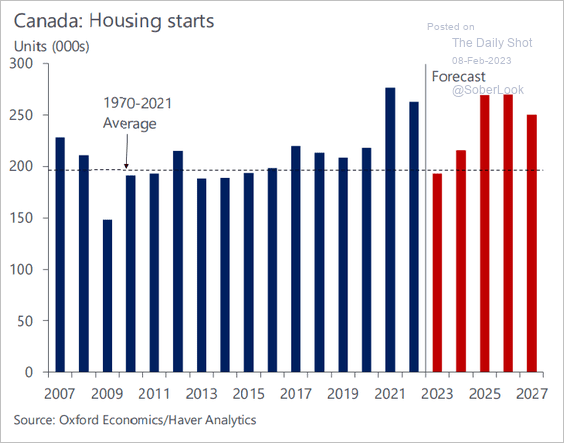
2. According to Oxford Economics, residential construction will dip to the lowest level since 2014 this year.
 Source: Oxford Economics
Back to Index
The United Kingdom
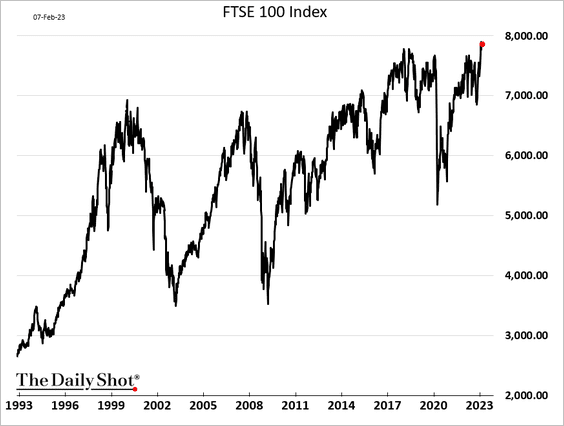
1. UK large caps are trading near record highs.
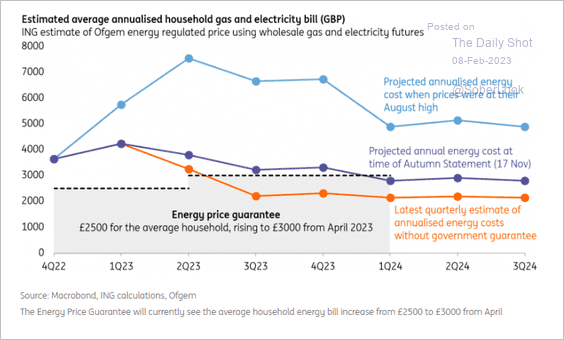
2. This chart shows household energy costs as projected in November as well as estimates based on current wholesale prices.
 Source: ING
3. Will soft consumer confidence put pressure on car sales?
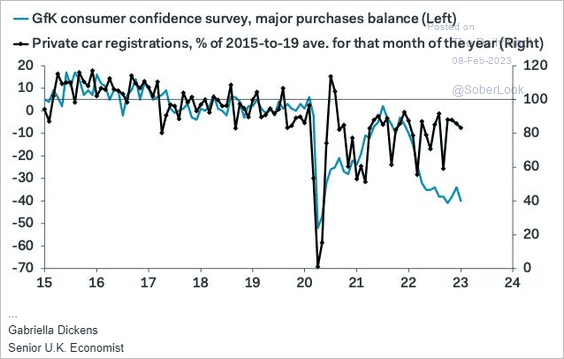 Source: Pantheon Macroeconomics
Back to Index
The Eurozone
1. German industrial production in energy-intensive sectors is sharply lower, which helped ease the demand for natural gas.
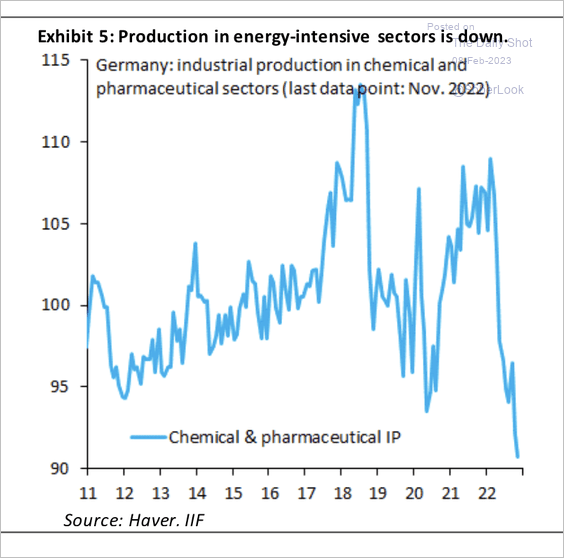 Source: IIF
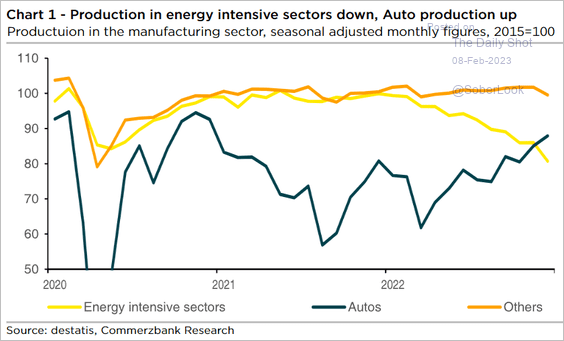 Source: Commerzbank Research
——————–
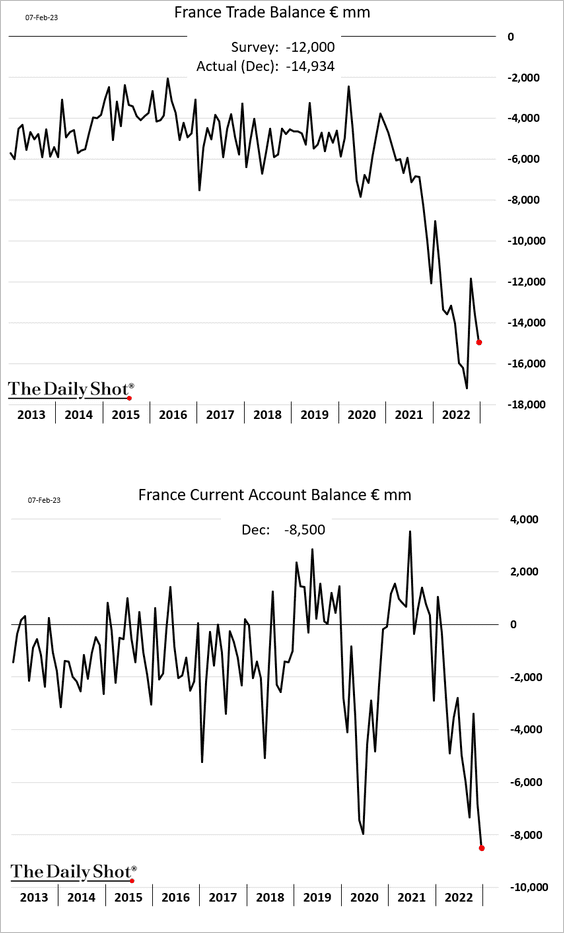
2. French current account deficit hit a record high, driven by deep trade deficit.
3. Speculators boosted net-long euro positions. However, IIF expects EUR/USD to return to parity as ECB rate hikes will be hard to justify during a recession.
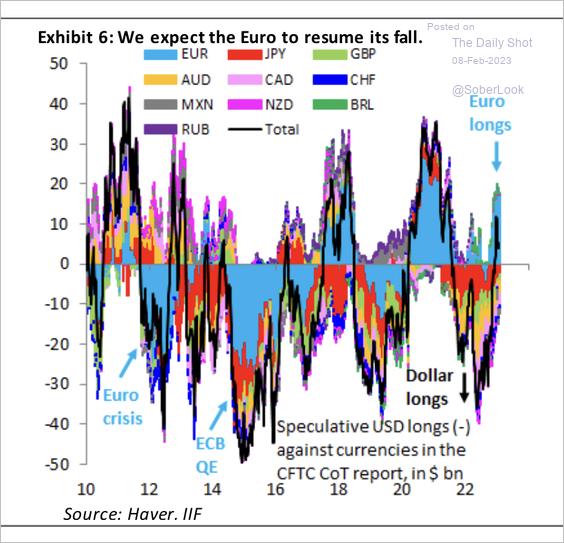 Source: IIF
4. Euro-area core inflation is expected to be more persistent than in the US.
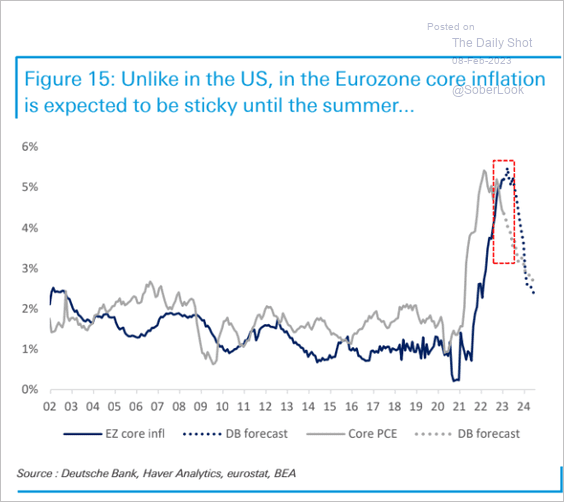 Source: Deutsche Bank Research
Back to Index
Europe
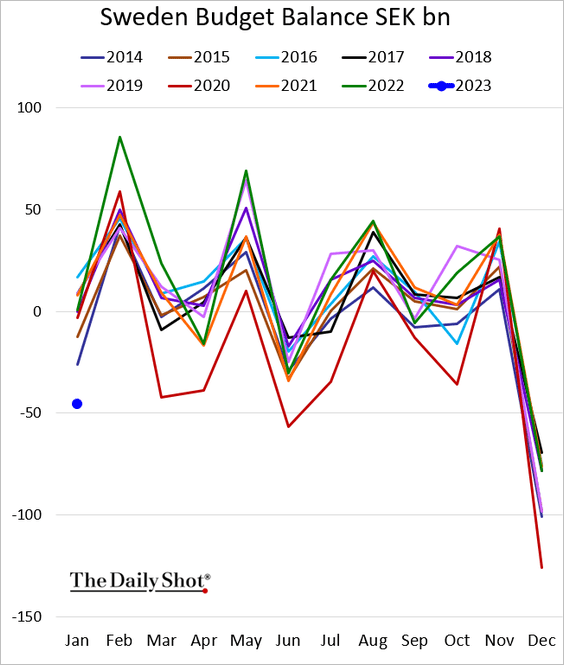
1. Sweden’s budget deficit hit a multi-year high (for January).
2. Warm temperatures ahead?
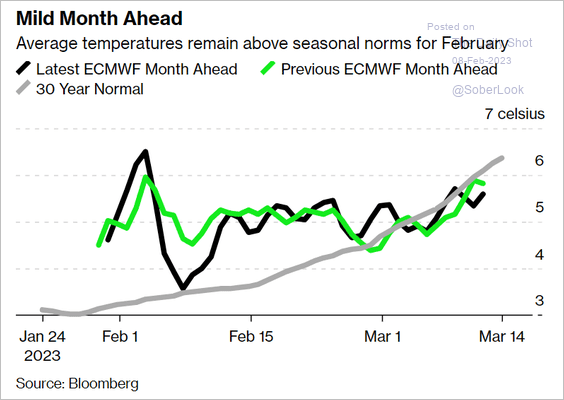 Source: @CeliaBergin, @josefinefokuhl, @business Read full article
3. Battery-only EVs keep rising.
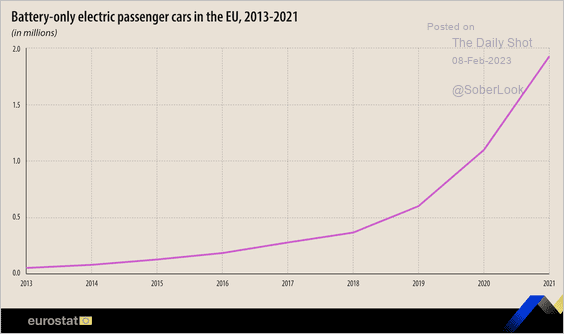 Source: Eurostat Read full article
Back to Index
Asia – Pacific
1. Will the BoJ continue to ignore Japan’s inflation problem? (2 charts)
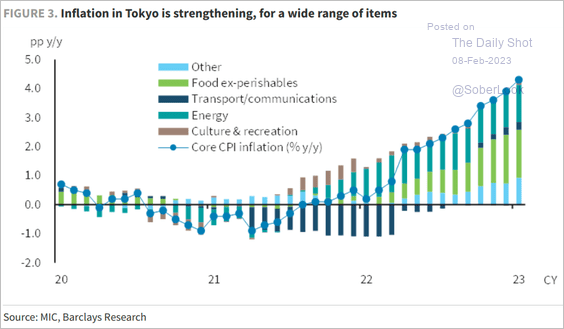 Source: Barclays Research
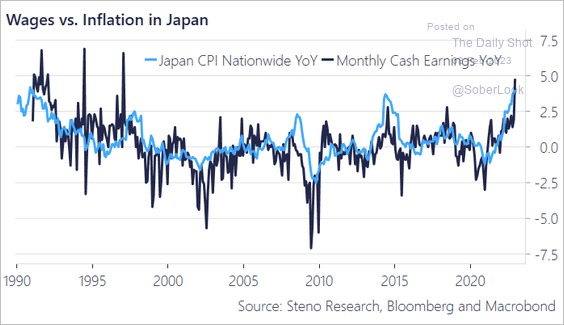 Source: @AndreasSteno
——————–
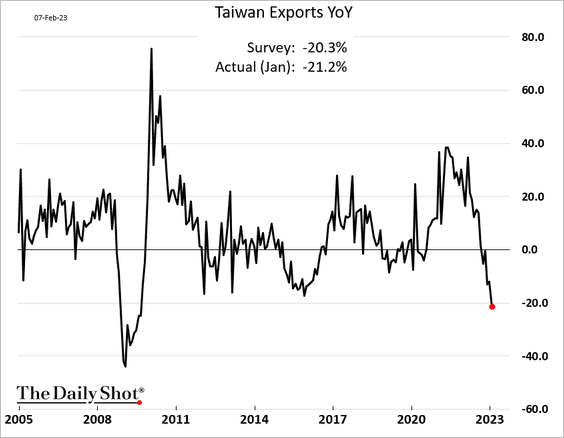
2. Taiwan’s exports were down 21% last month on a year-over-year basis.
Back to Index
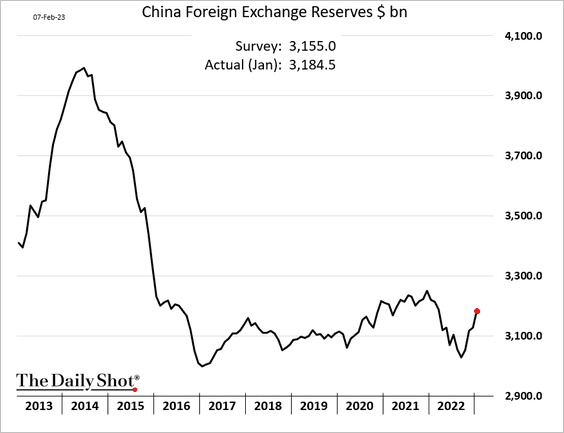
China
1. F/X reserves are rebounding.
2. A rise in China’s credit impulse is needed to sustain the market recovery.
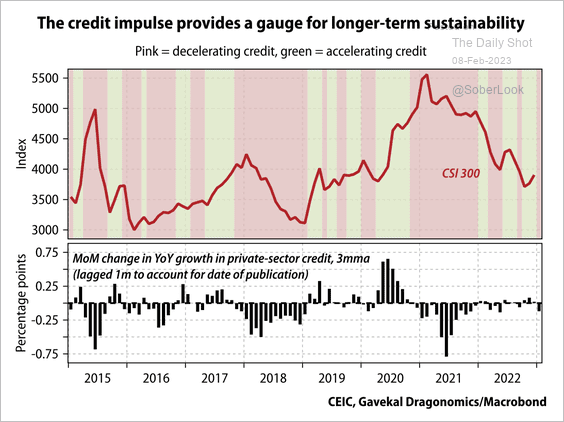 Source: Gavekal Research
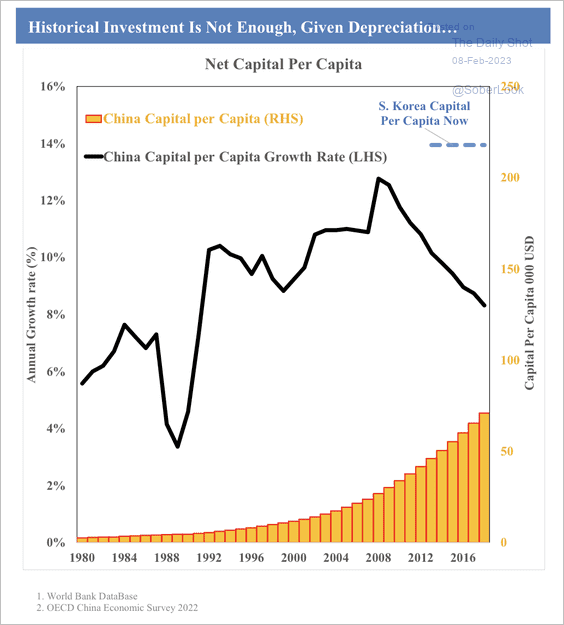
3. China’s net capital per capita growth rate has declined over the past 20 years.
 Source: SOM Macro Strategies
More capital is required to boost production.
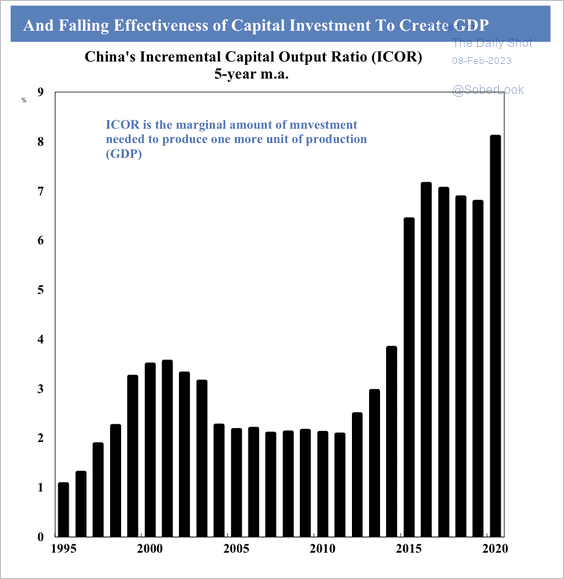 Source: SOM Macro Strategies
4. Housing investment dwarfs traditional asset investment.
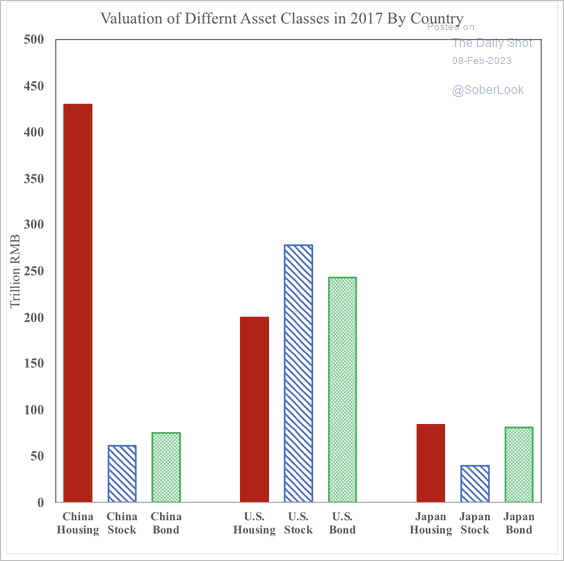 Source: SOM Macro Strategies
5. Chinese investors are trading less copper futures in Shanghai, while copper prices are trading at premiums in Chicago and London.
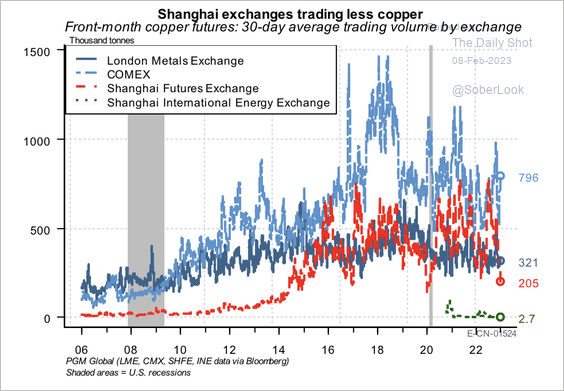 Source: PGM Global
6. Local government revenues from land sales remain depressed.
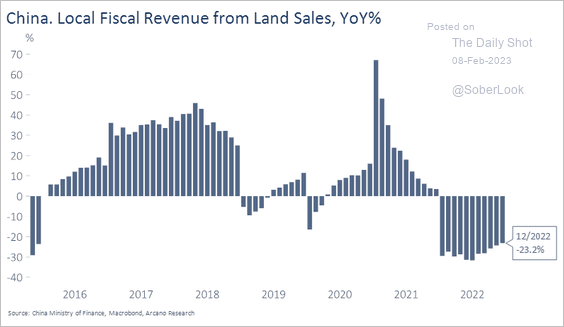 Source: Arcano Economics
Back to Index
Emerging Markets
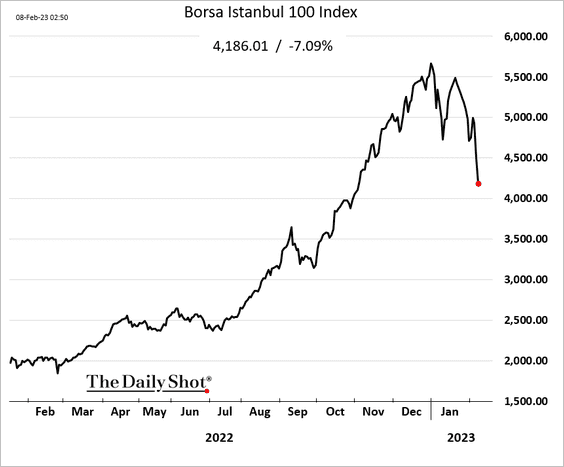
1. Turkish stocks are in bear market after the devastating earthquake.
2. Banxico will begin easing before the Fed, according to Wells Fargo, …
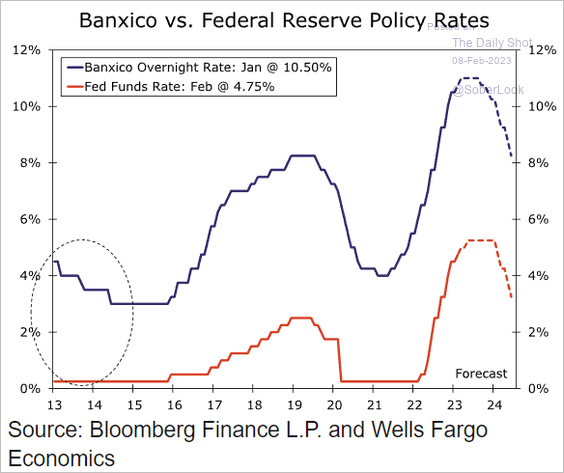 Source: Wells Fargo Securities
… as inflation slows.
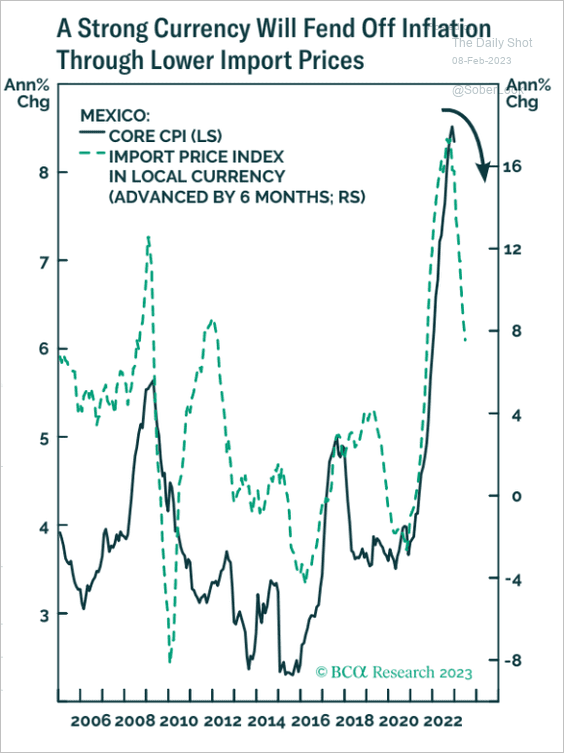 Source: BCA Research
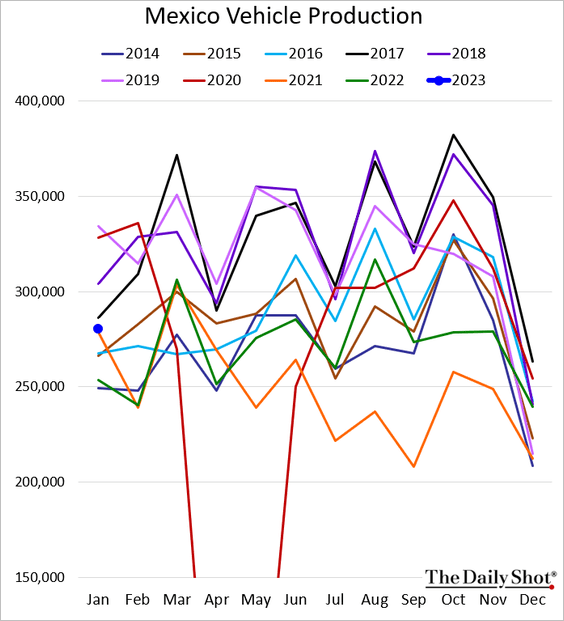
Separately, Mexican vehicle production was well above last year’s levels in January.
——————–
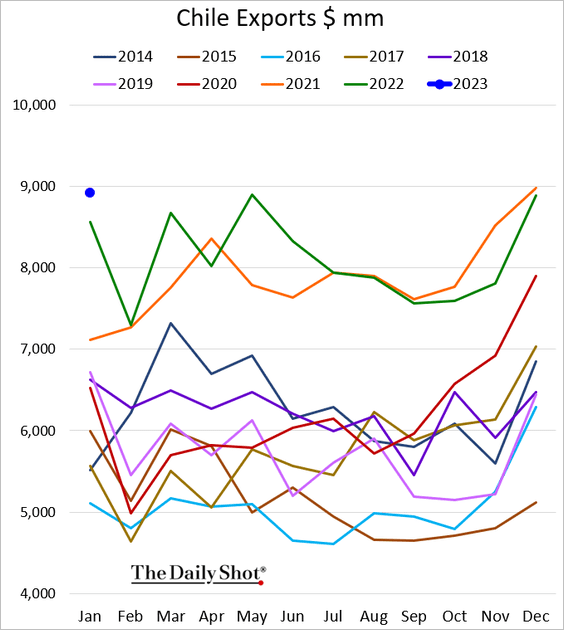
3. Chile’s exports hit a new high (for January).
4. EM inflation surprises have been fading.
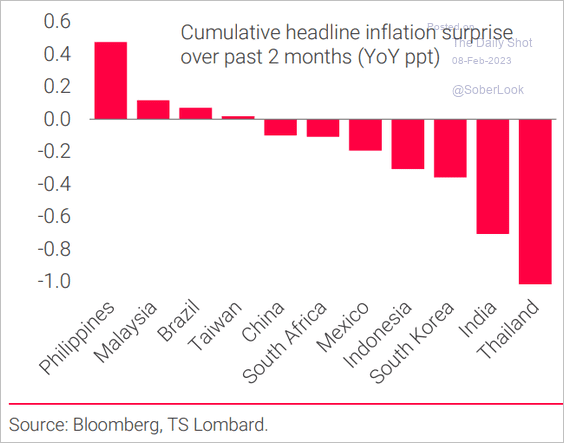 Source: TS Lombard
Back to Index
Commodities
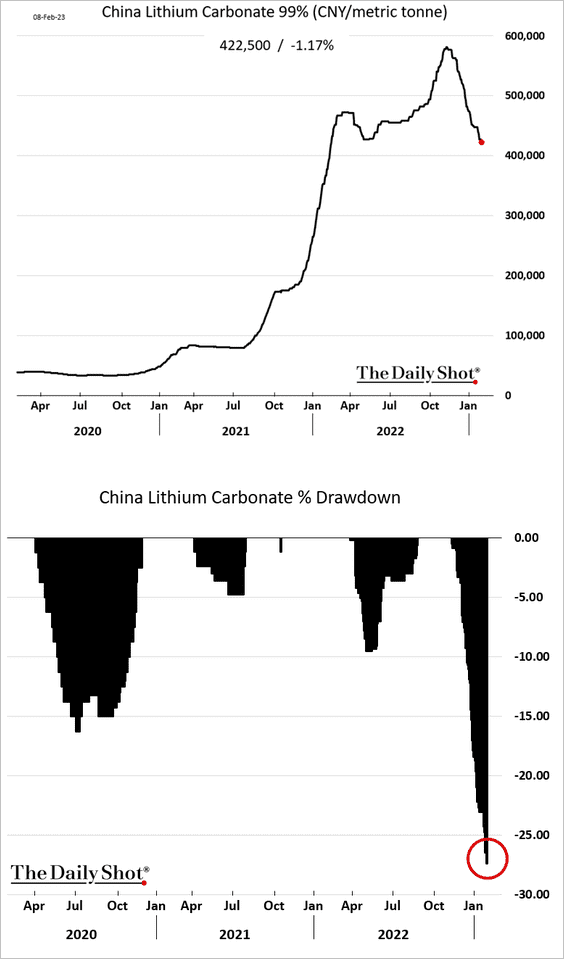
1. Lithium prices are down sharply from the peak.
2. This chart shows the evolution of gold production by country.
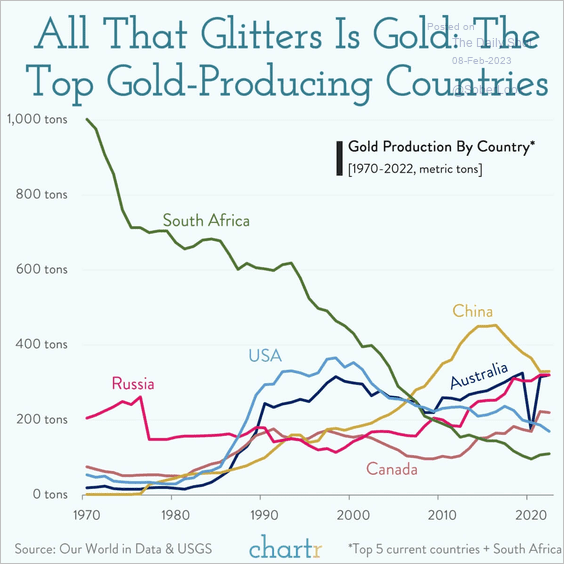 Source: @chartrdaily
Back to Index
Energy
1. Oil prices jumped this week.
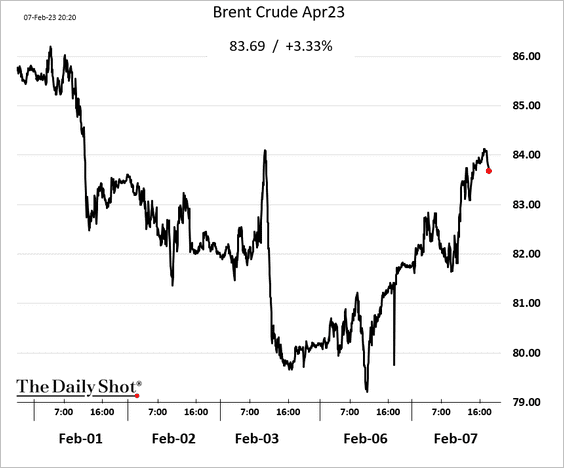
 Source: Barron’s Read full article
——————–
2. This chart shows the contributions to cumulative changes in global oil production since 2005.
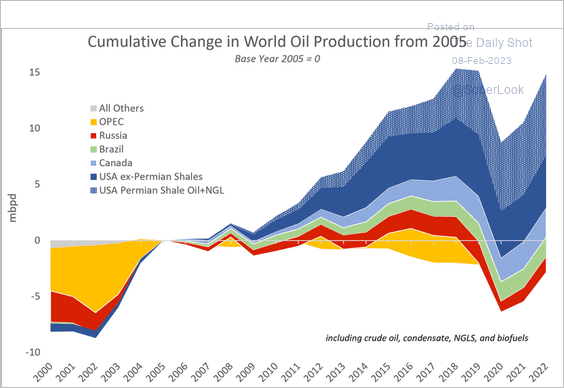 Source: Princeton Energy Advisors
Back to Index
Equities
1. Q4 margins were less than stellar relative to expectations.
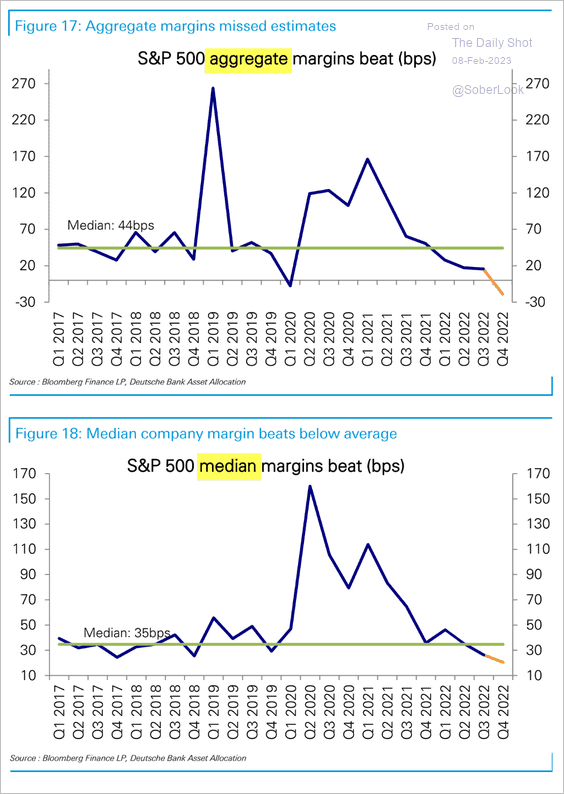 Source: Deutsche Bank Research
Rising prices initially boost top-line revenue growth and margins, but eventually, cost inflation reduces profit growth, especially when sales growth slows.
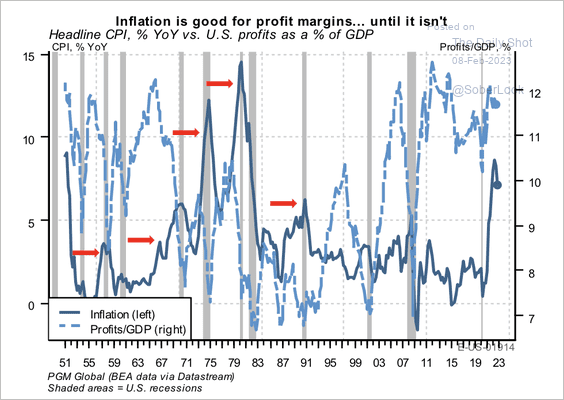 Source: PGM Global
——————–
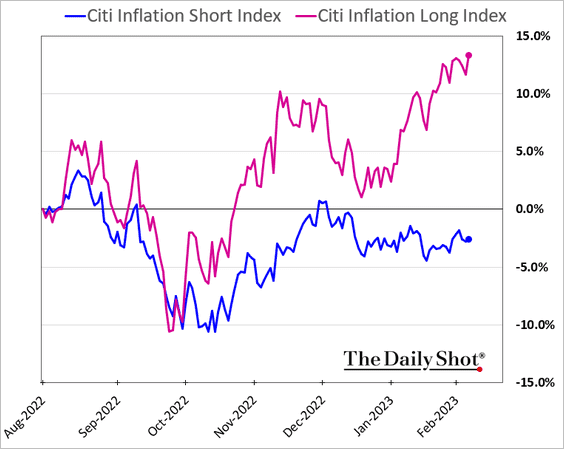
2. Despite slowing inflation, companies that benefit from higher prices have been outperforming.
3. Which sectors saw the largest earnings downgrades in January?
• Q1:
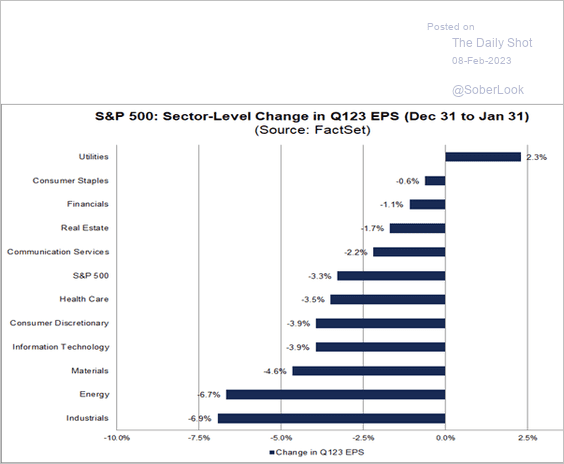 Source: @FactSet Read full article
• Calendar-year 2023:
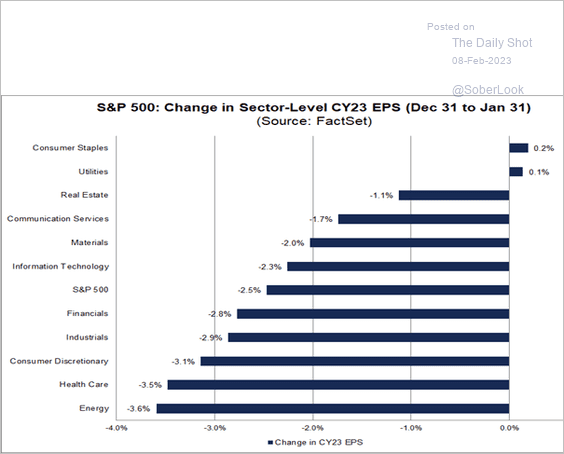 Source: @FactSet Read full article
——————–
4. The recent developed-markets non-US share outperformance has been remarkable.
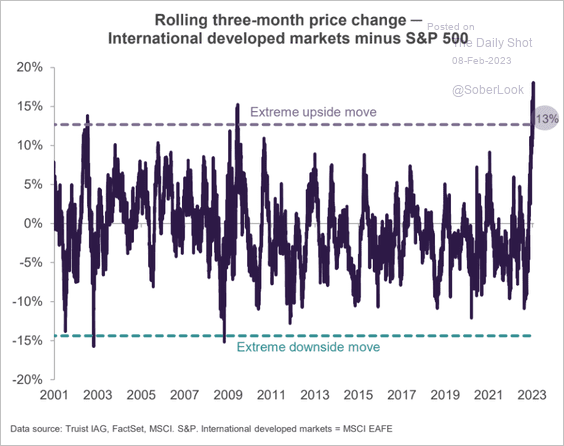 Source: Truist Advisory Services
5. S&P 500 valuations remain above their long-term average.
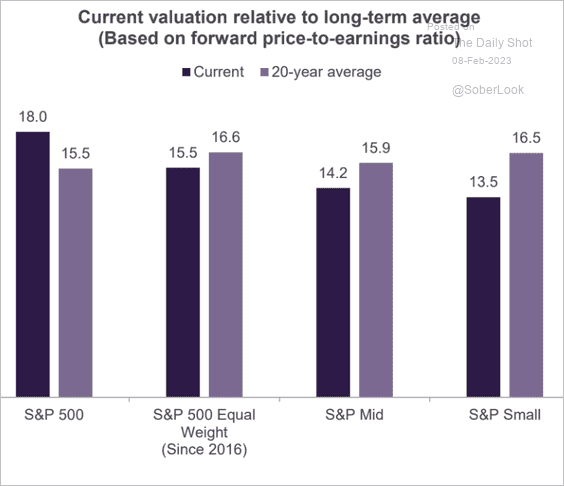 Source: Truist Advisory Services
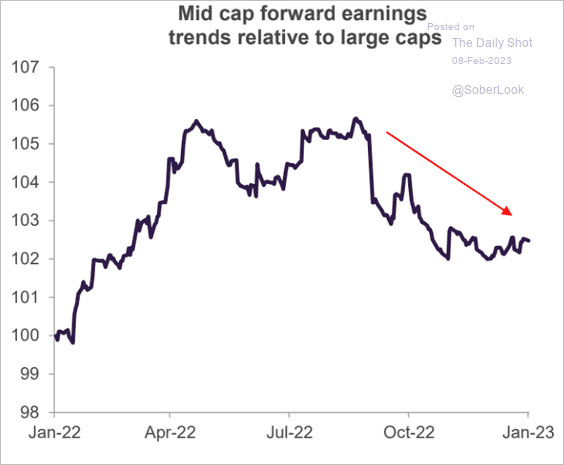
6. Mid-cap shares have been outperforming, …
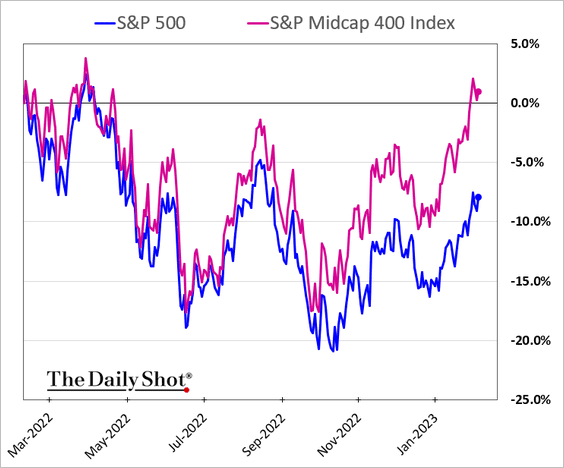
… amid improved valuations.
 Source: Truist Advisory Services
——————–
7. AI and robotics stocks have been rallying.
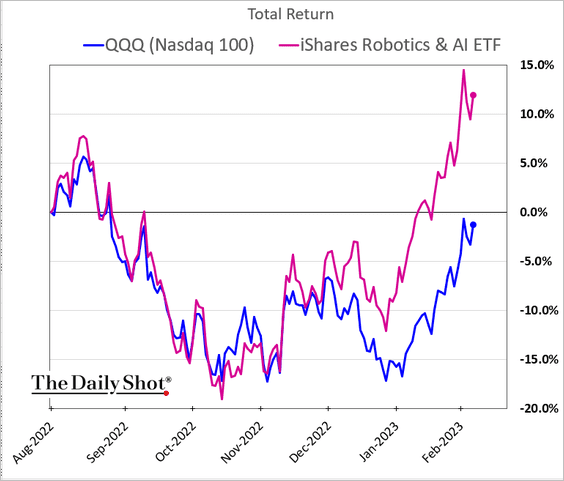
 Source: Reuters Read full article
——————–
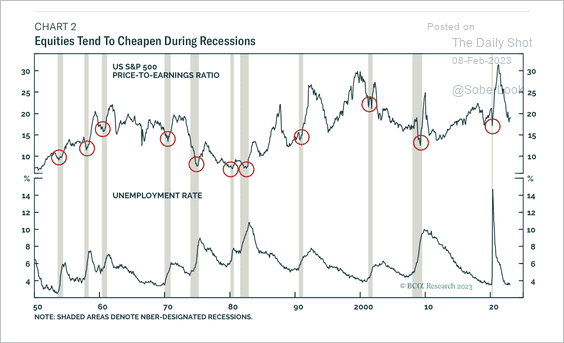
8. Stocks tend to do best when the unemployment rate is high. This is possibly due to the mean reverting nature of the unemployment rate and lower valuations during recessions. (2 charts)
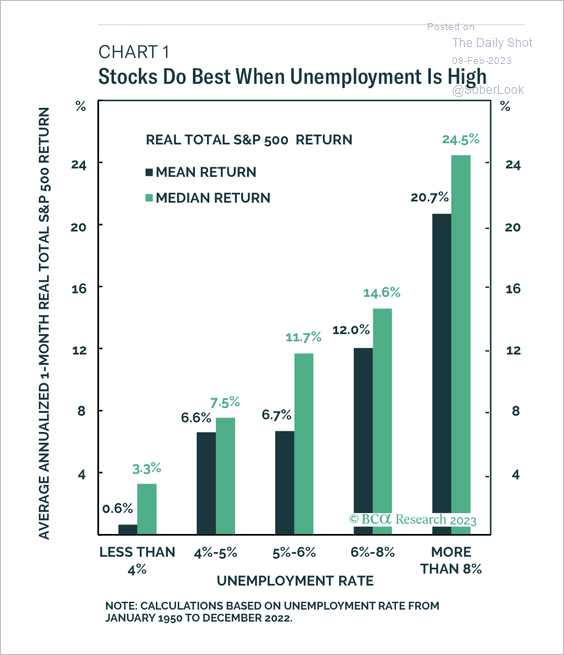 Source: BCA Research
 Source: BCA Research
Back to Index
Alternatives
1. Preliminary Q3 2022 data shows US private equity and venture capital performance in the red.
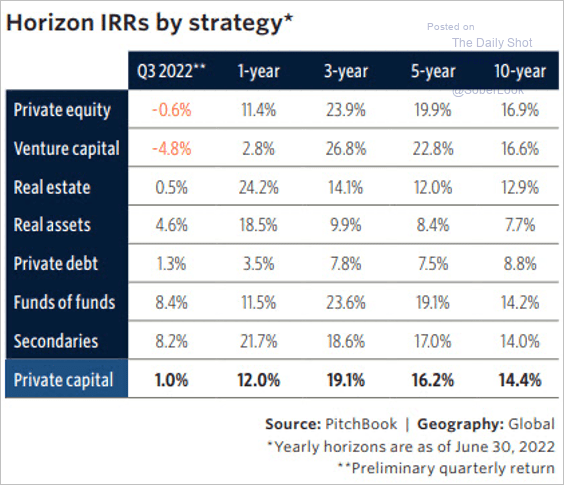 Source: PitchBook
2. Pitchbook expects private capital assets under management to decline this year before gradually recovering.
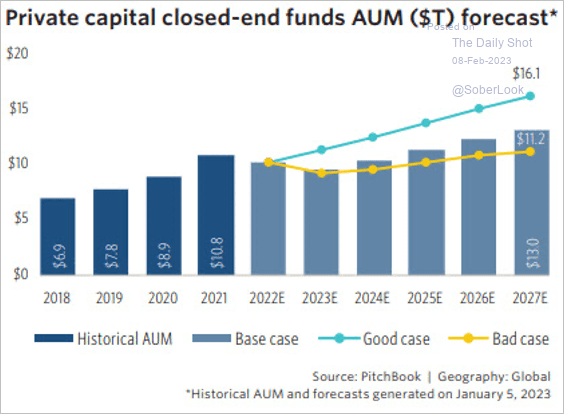 Source: PitchBook
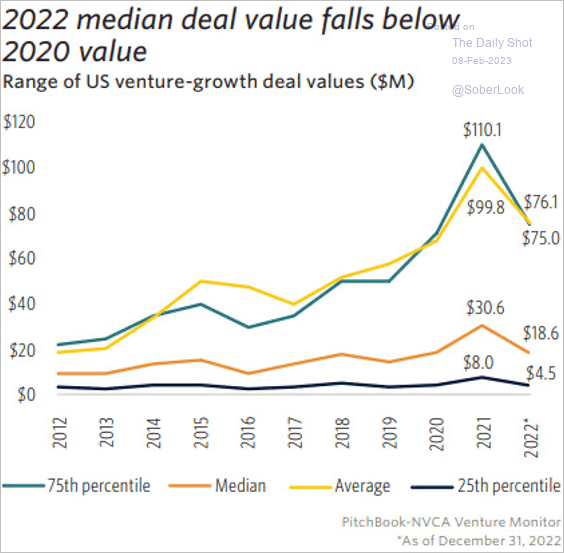
3. US startups demanded more than twice as much capital as venture capitalists supplied last quarter. The imbalance is especially extended in later stage deals.
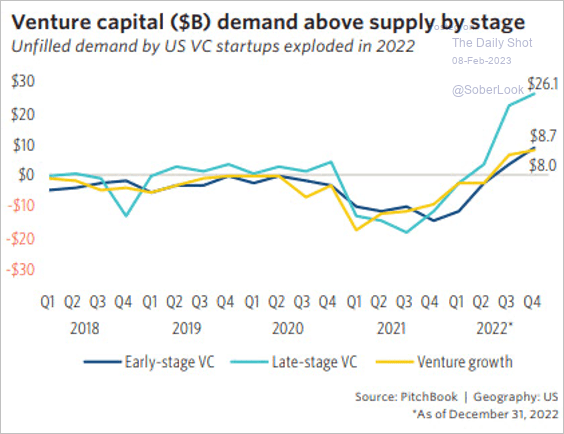 Source: PitchBook
US venture-growth deal values fell below 2020 levels.
 Source: PitchBook
——————–
4. Private credit yields are attractive relative to broadly syndicated loans.
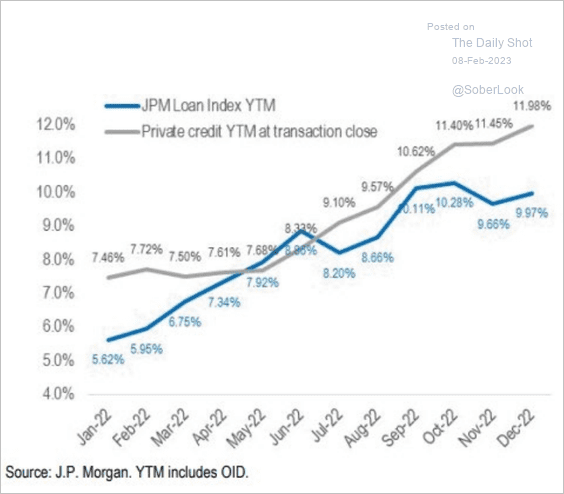 Source: JP Morgan Research; III Capital Management
Back to Index
Credit
1. Tighter business lending standards signal slower loan growth ahead …
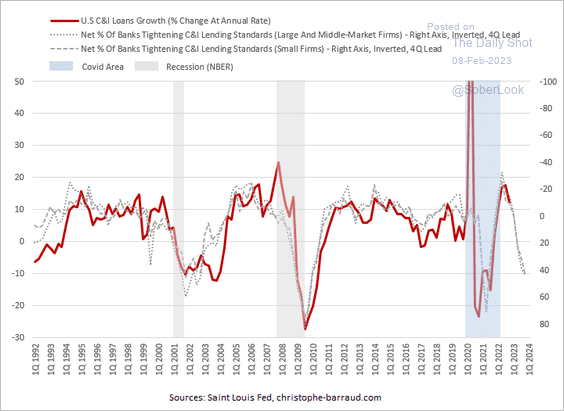 Source: @C_Barraud Read full article
… and an increase in US high-yield defaults, which typically occurs during recessions.
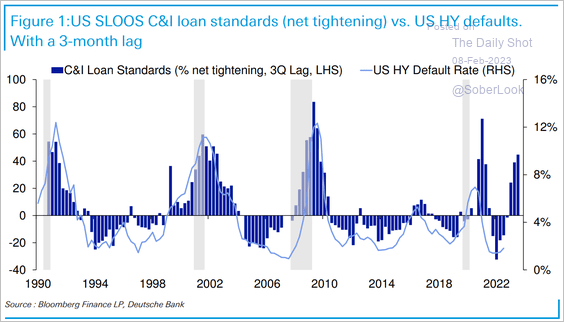 Source: Deutsche Bank Research
2. The high yield market appears to be mispriced, …
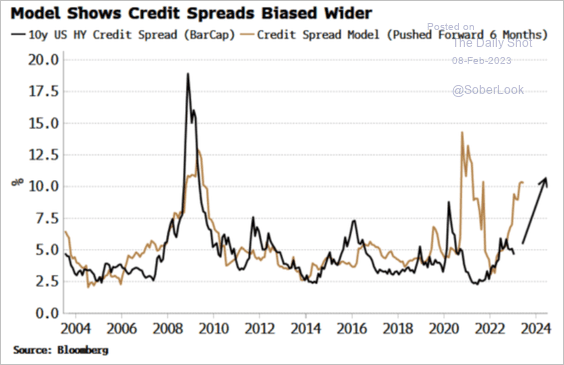 Source: Simon White, Bloomberg Markets Live Blog
… with only negligible recession risk priced in.
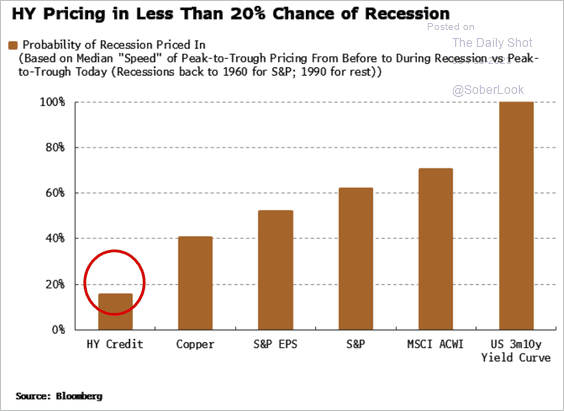 Source: Simon White, Bloomberg Markets Live Blog
——————–
3. Banks are tightening lending standards on commercial rel estate loans, while demand for credit deteriorates.
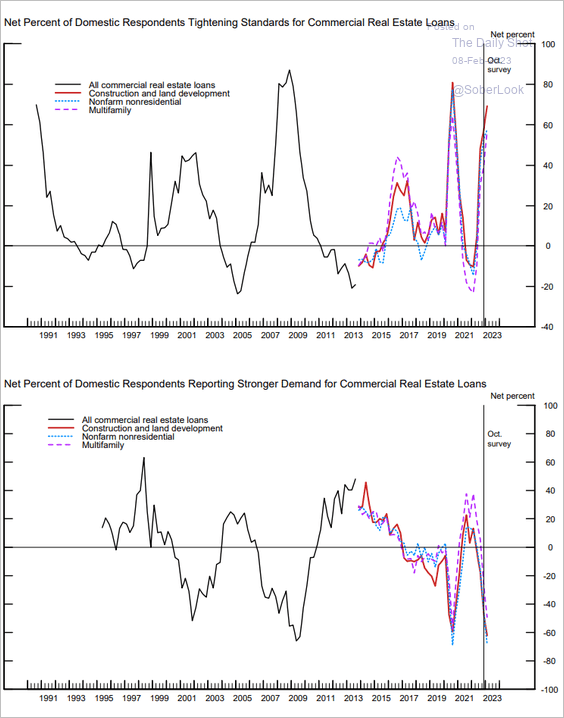 Source: FRB
Back to Index
Rates
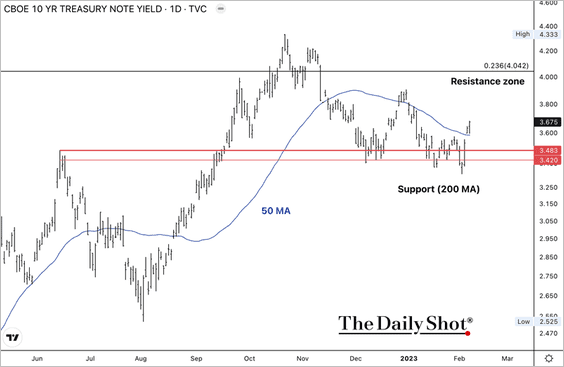
1. The 10-year Treasury yield held support at 3.3% and returned above its 50-day moving average. Resistance is around 4%.
2. This chart shows Treasury returns during different economic regimes.
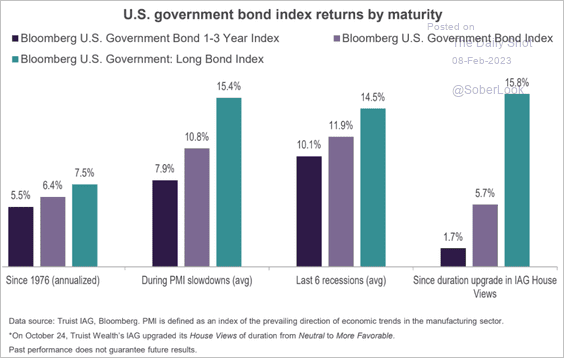 Source: Truist Advisory Services
Back to Index
Global Developments
1. Inflation surprises have declined while economic surprises increased. (2 charts)
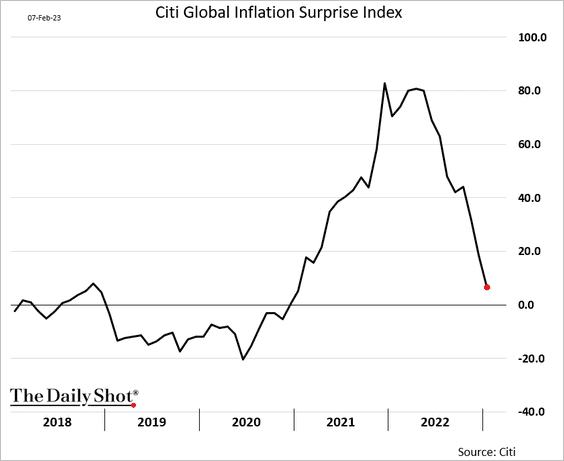
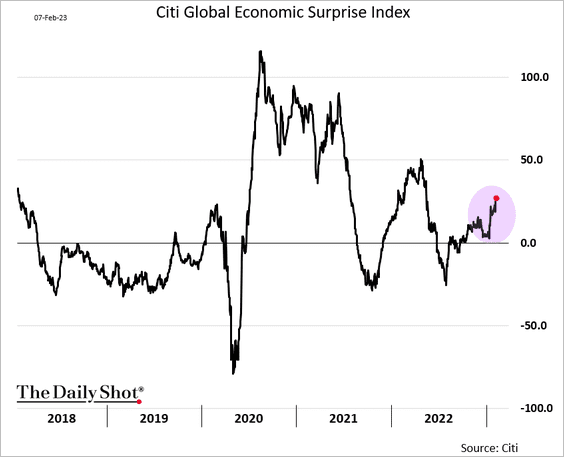
However, global growth indicators are mostly neutral.
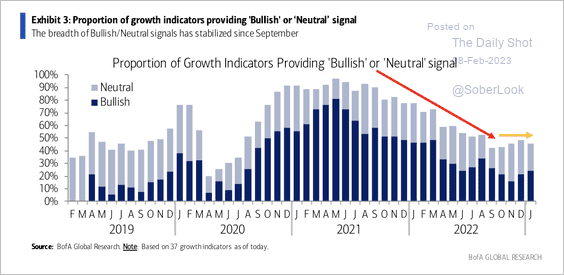 Source: BofA Global Research
——————–
2. Here is a look at monetary overhangs in the US, the Eurozone, and the UK.
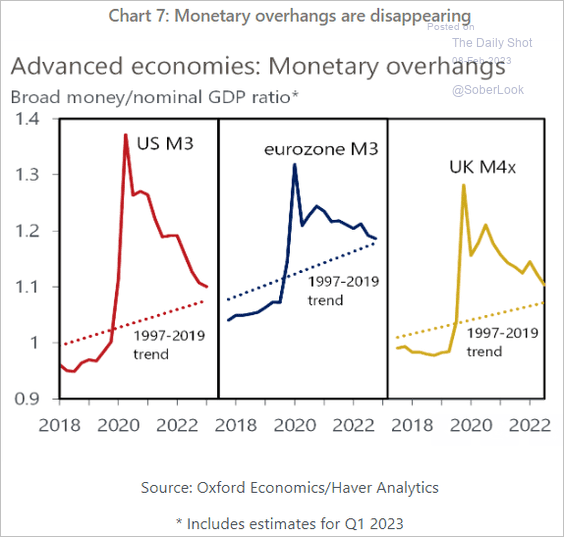 Source: Oxford Economics
3. Numera Analytics sees a 35% chance of above-average returns in a 60% stock/40% bond portfolio during a stagflation environment this year.
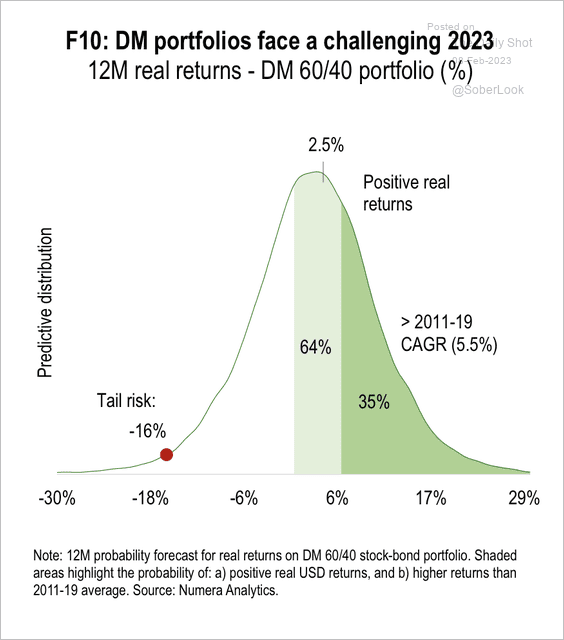 Source: Numera Analytics (@NumeraAnalytics)
——————–
Food for Thought
1. A rebound in mall visits?
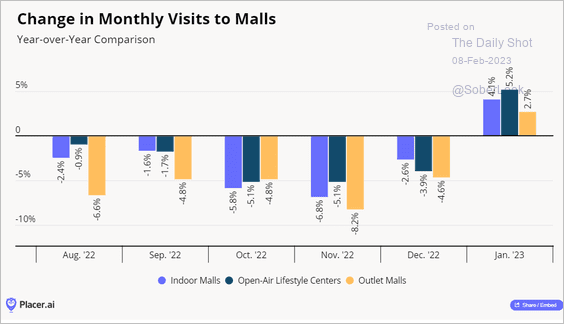 Source: Placer.ai
2. AIG shares’ overnight vs. intraday cumulative returns since 1990:
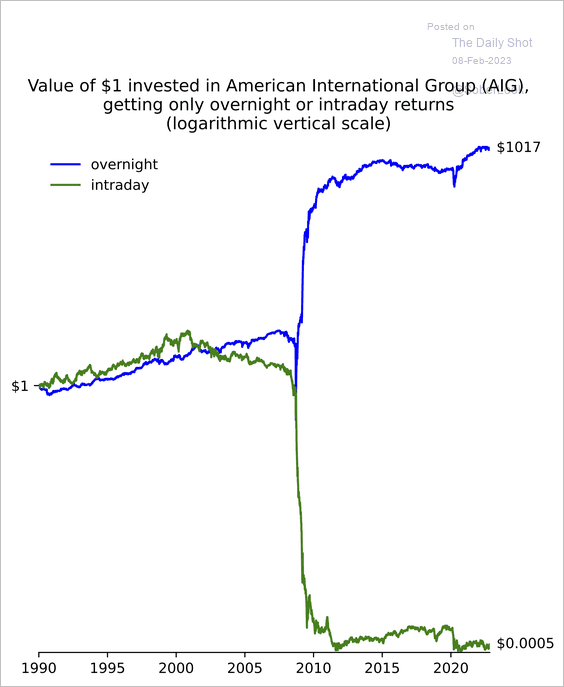 Source: Statistical Modeling, Causal Inference, and Social Science Read full article
3. Global population growth projections made in 2017 and 2022:
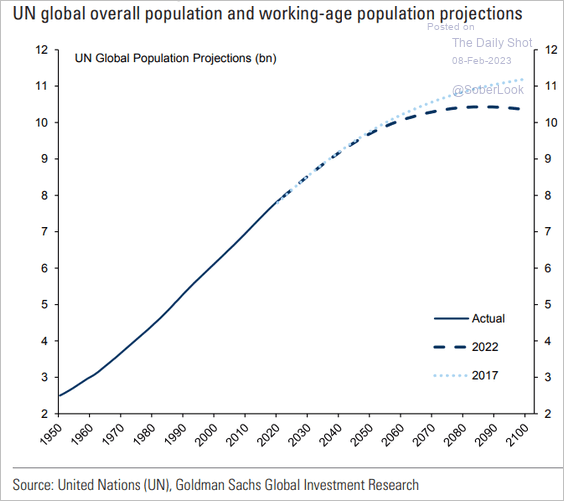 Source: Goldman Sachs
4. US net domestic migration (2 charts):
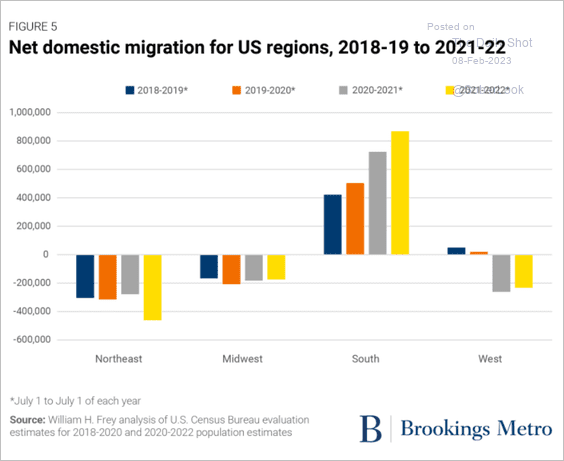 Source: Brookings Read full article
 Source: @chartrdaily
——————–
5. Changes in public-school enrollment:
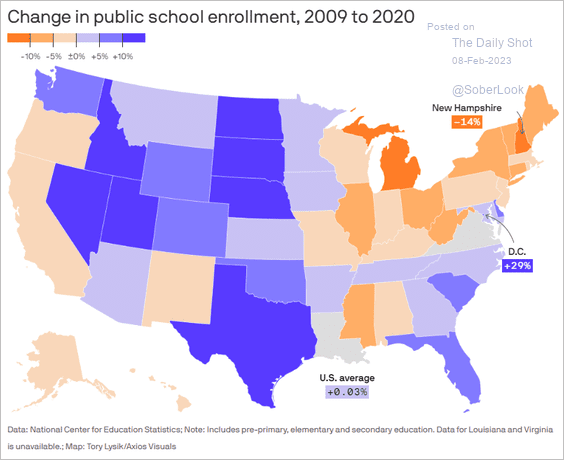 Source: @axios Read full article
6. Areas affected by the earthquake in Turkey and Syria:
 Source: The New York Times Read full article
7. Hospitalized COVID patients:
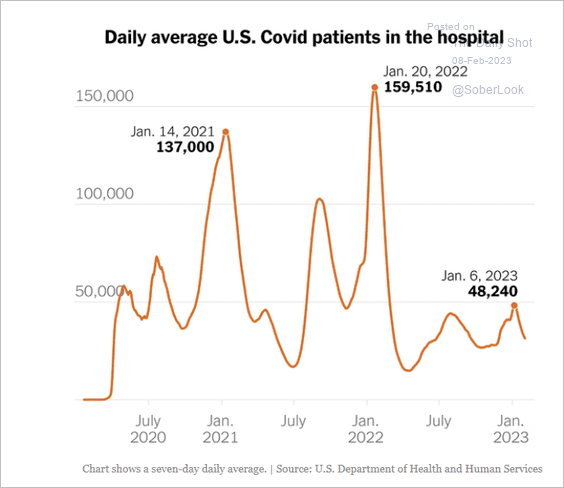 Source: The New York Times Read full article
8. Percent of the adult European population that does not speak a foreign language:
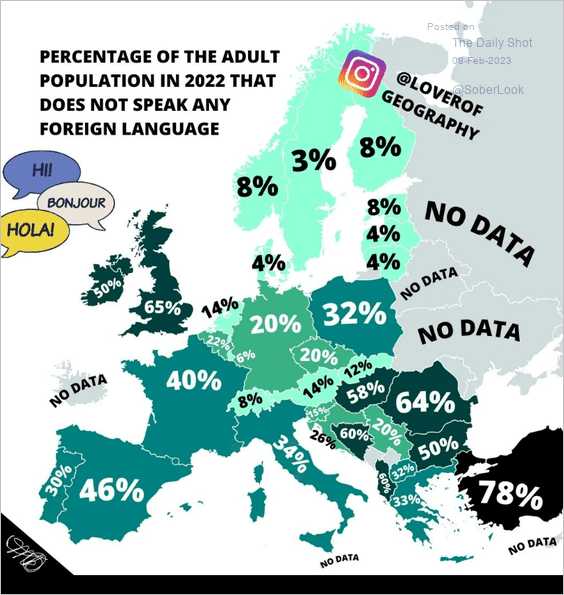 Source: @loverofgeography
——————–
Back to Index