
The Daily Shot: 16-Feb-23
• The United States
• Canada
• The United Kingdom
• The Eurozone
• Europe
• Asia – Pacific
• Emerging Markets
• Cryptocurrency
• Energy
• Equities
• Rates
• Food for Thought
The United States
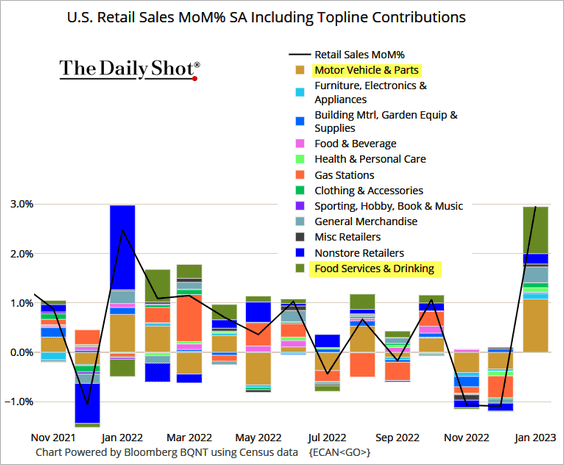
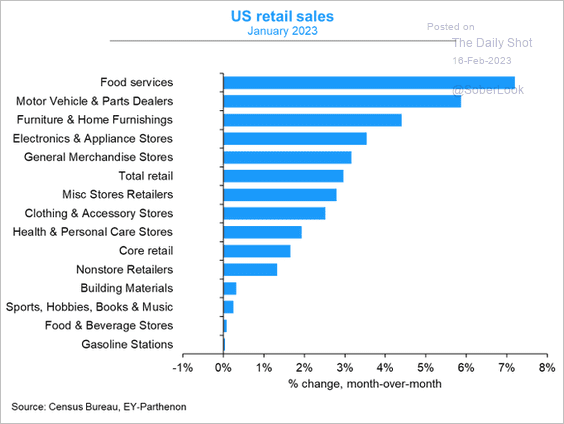
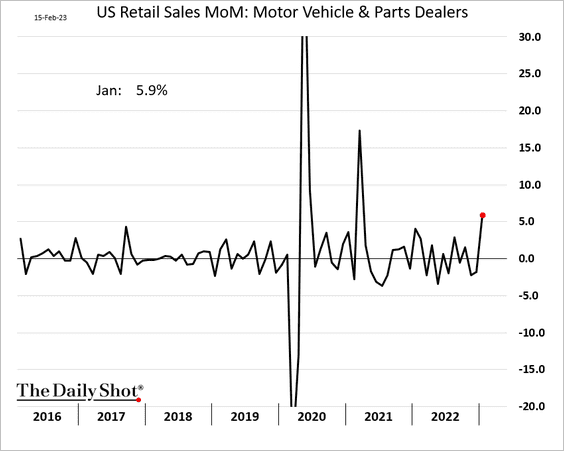
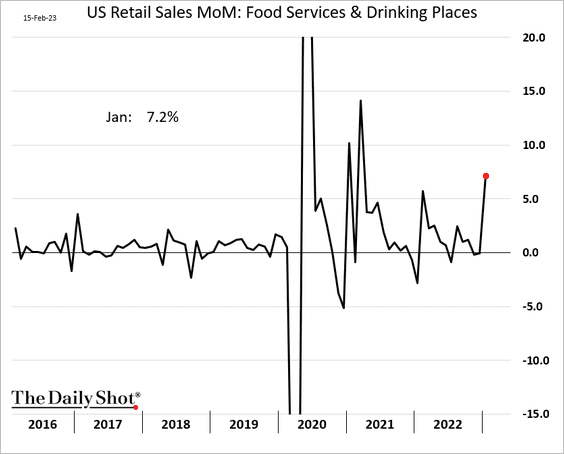
1. US retail sales topped expectations as warm weather boosted spending after weak activity in December.
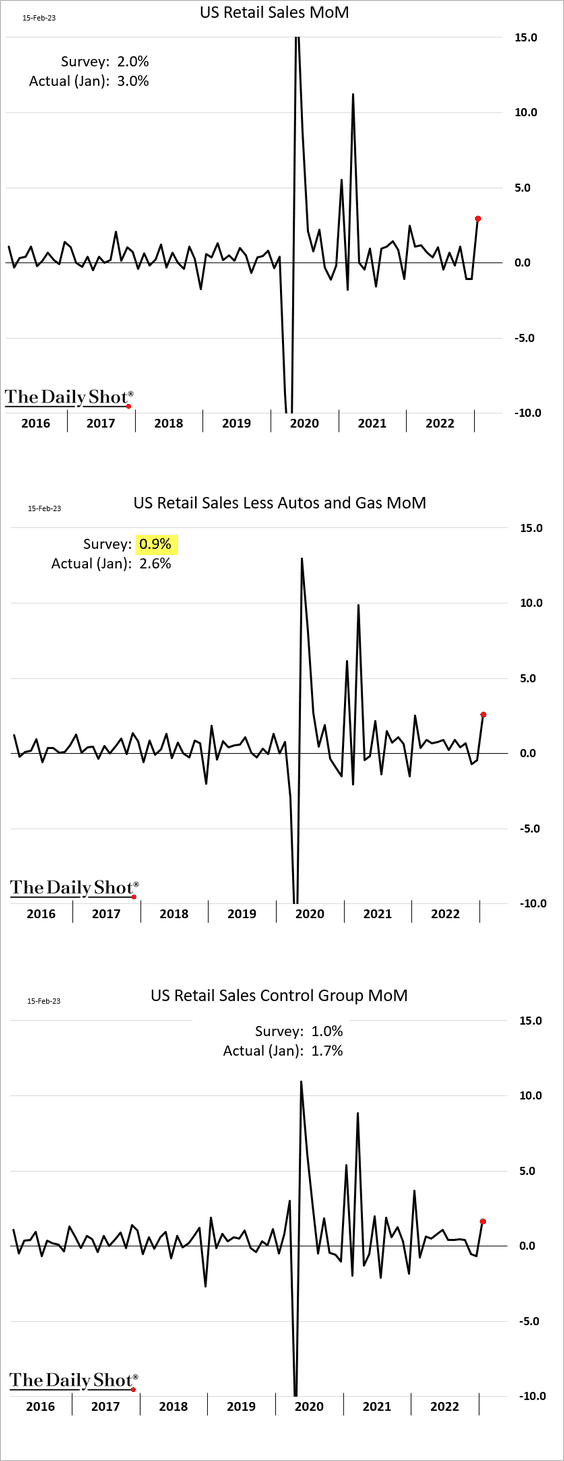
• Improvements were broad, with autos and restaurants/bars seeing the biggest gains (4 charts).
 Source: @TheTerminal, Bloomberg Finance L.P.
 Source: @GregDaco
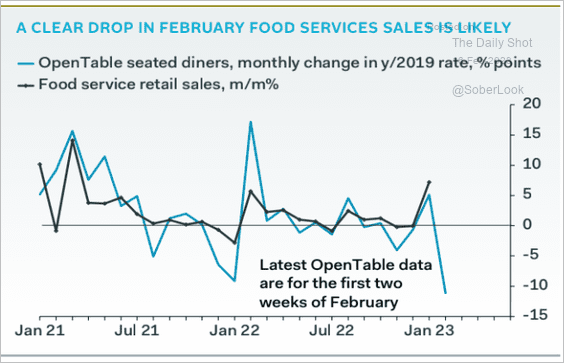
But OpenTable data suggests that food services sales have more than reversed this month.
 Source: Pantheon Macroeconomics
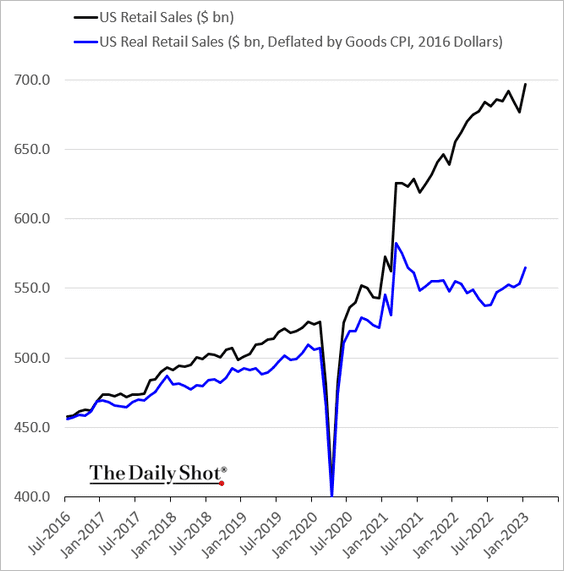
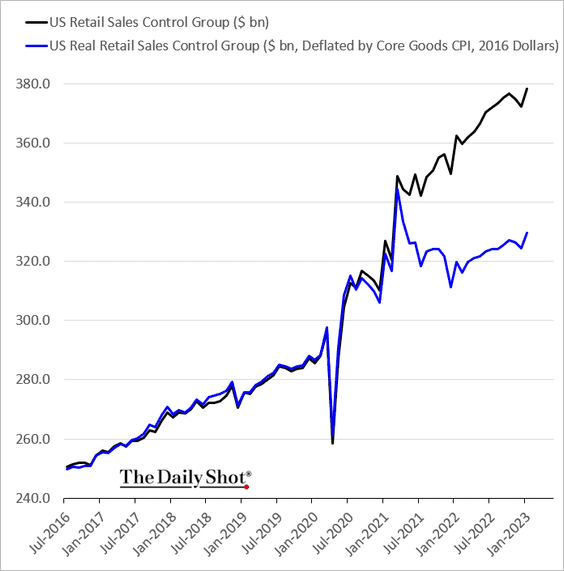
• Real retail sales gained as well (2 charts).
The “control group” excludes autos, building materials, gasoline, office supplies, mobile homes, and tobacco.
• Retail sales face significant headwinds this year.
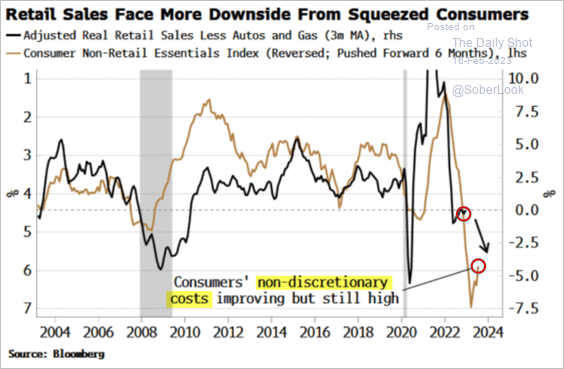 Source: Simon White, Bloomberg Markets Live Blog
——————–
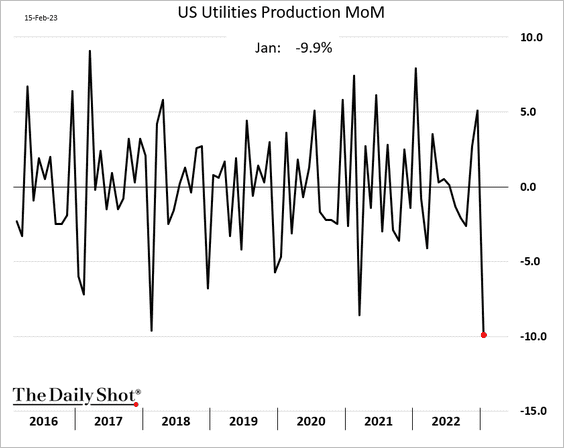
2. Industrial production was flat last month, but manufacturing output jumped.
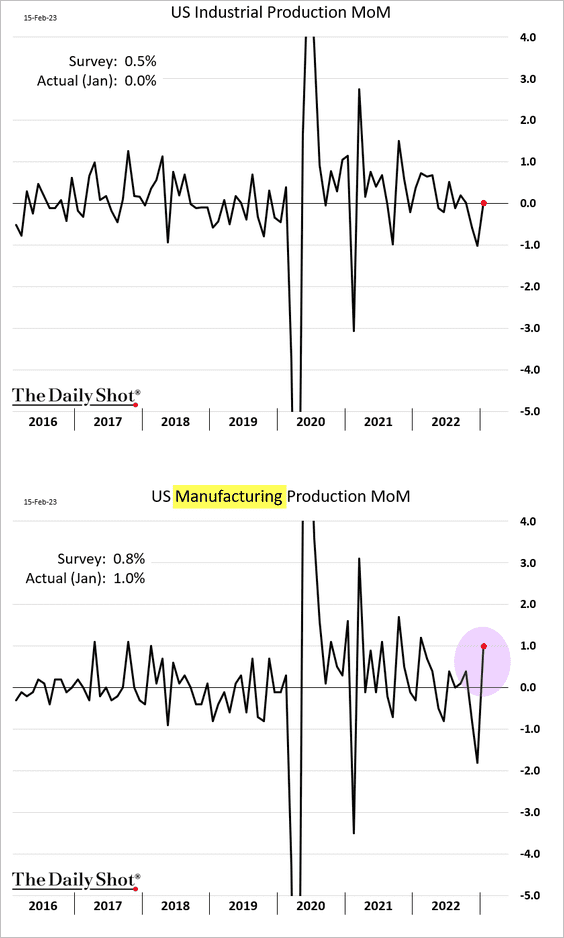
The weakness was in utilities’ output amid warm weather.
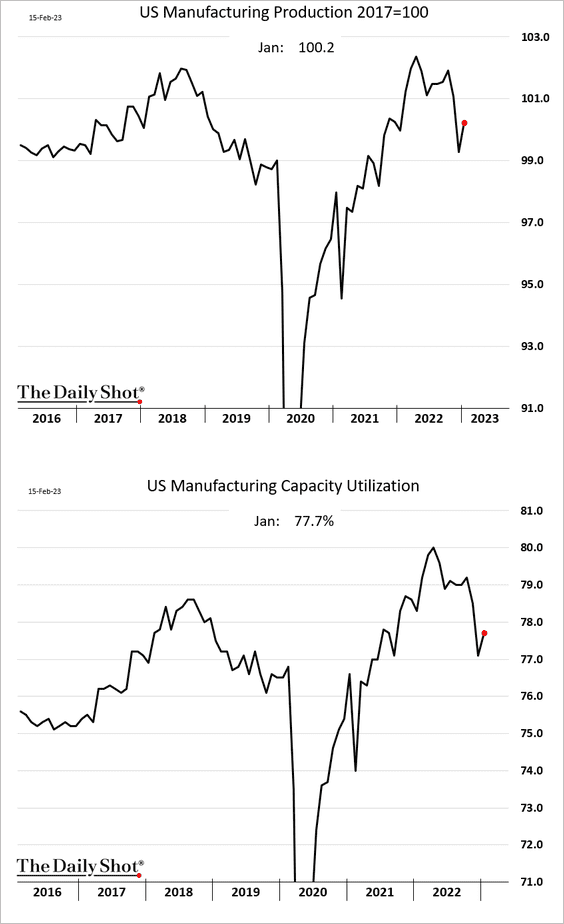
Nonetheless, factory output and capacity utilization remain well below the 2022 peak.
——————–
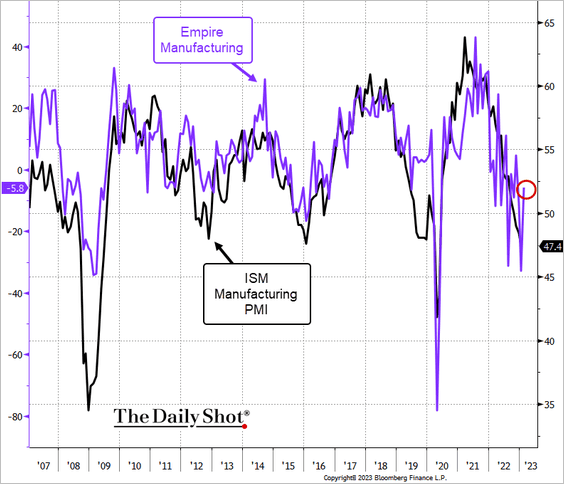
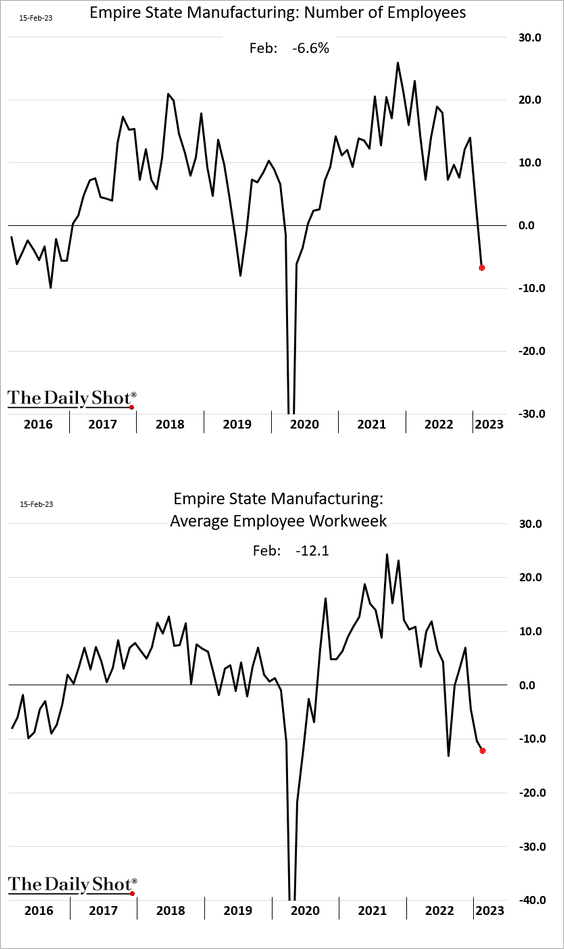
3. The first regional factory report of the month (from the NY Fed) showed an improvement, …
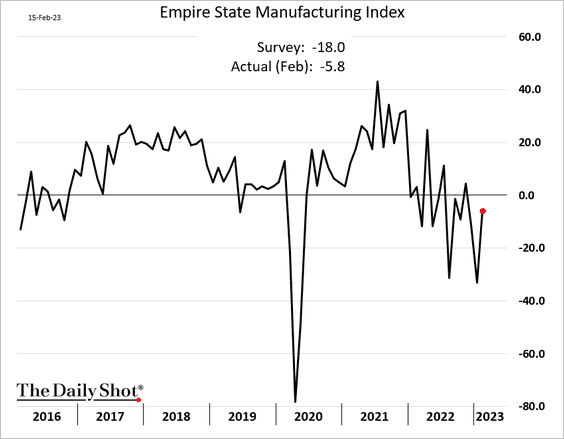
… suggesting that the contraction at the national level (ISM manufacturing) may be easing.
• The reopening in China should help.
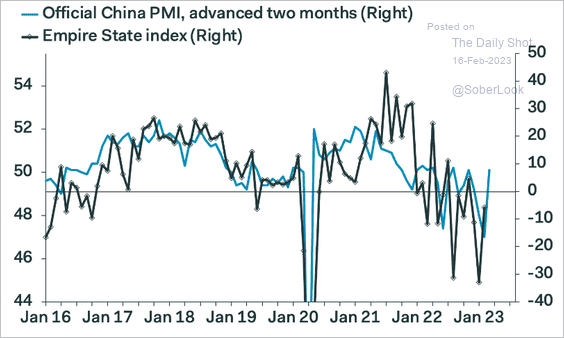 Source: Pantheon Macroeconomics
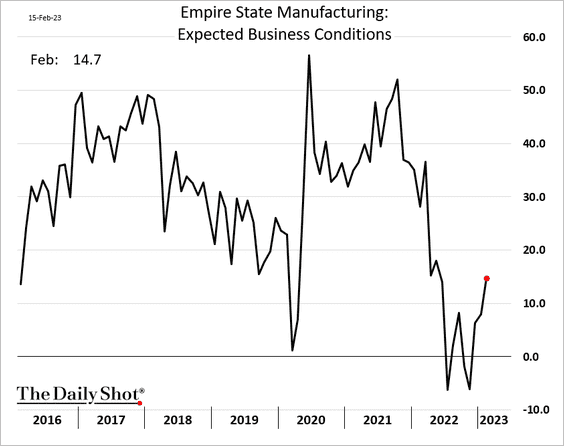
• Manufacturers are becoming more optimistic.
• But the region’s factories are cutting workers’ hours and shedding jobs.
——————–
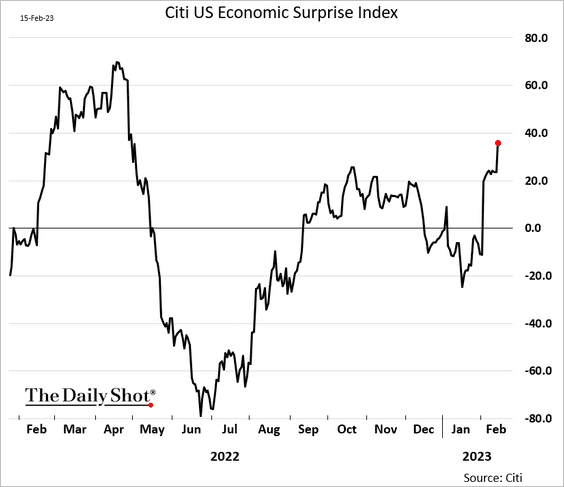
4. The Citi Economic Surprise Index got a boost from robust economic data in January (jobs, retail sales, industrial production).
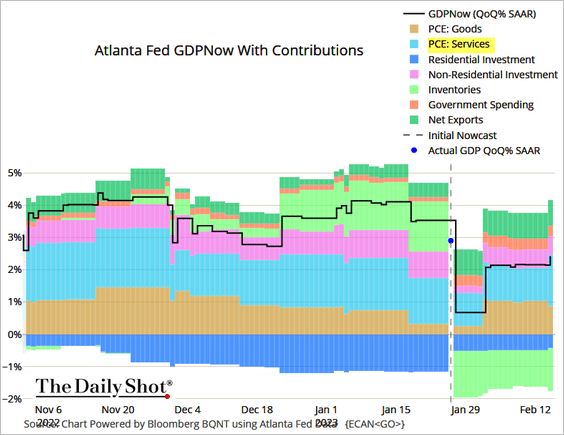
• The Atlanta Fed’s GDPNow model estimate for Q1 growth moved higher, …
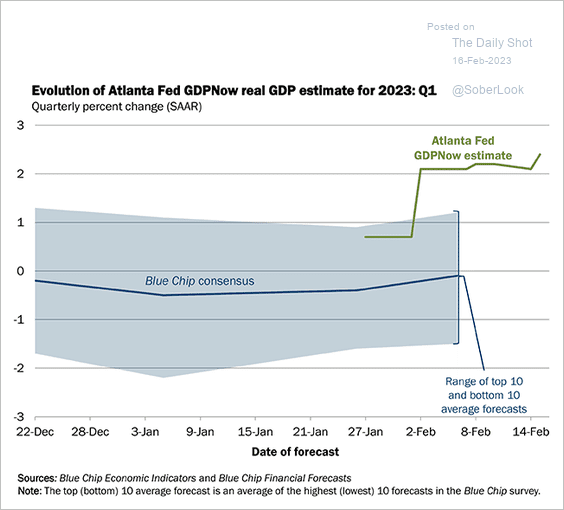 Source: @AtlantaFed Read full article
… driven by stronger consumer spending on services.
 Source: @TheTerminal, Bloomberg Finance L.P.
——————–
5. Next, we have some updates on the housing market.
• Mortgage applications and rate locks dropped to multi-year lows last week (2 charts).
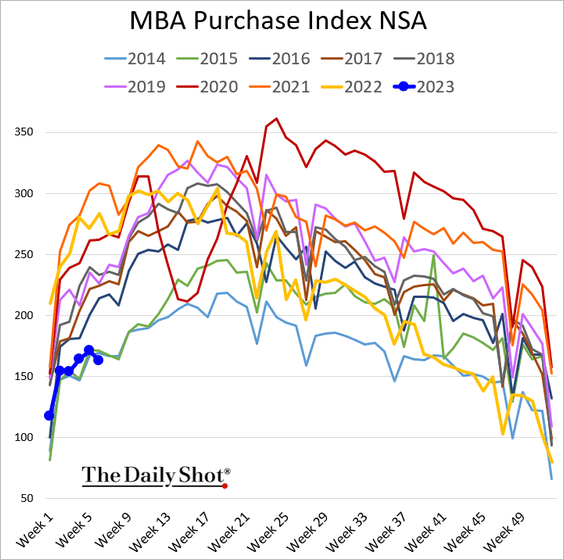
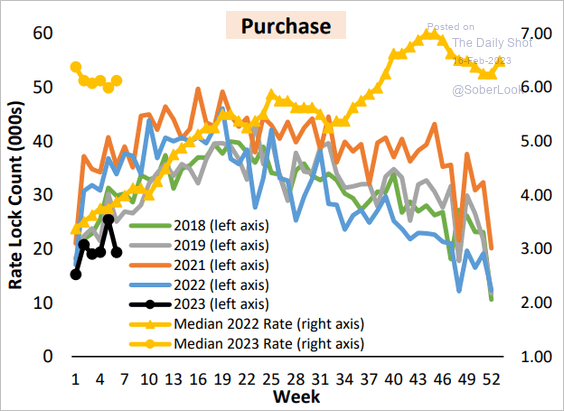 Source: AEI Housing Center
• Homebuilder sentiment improved again, exceeding forecasts.
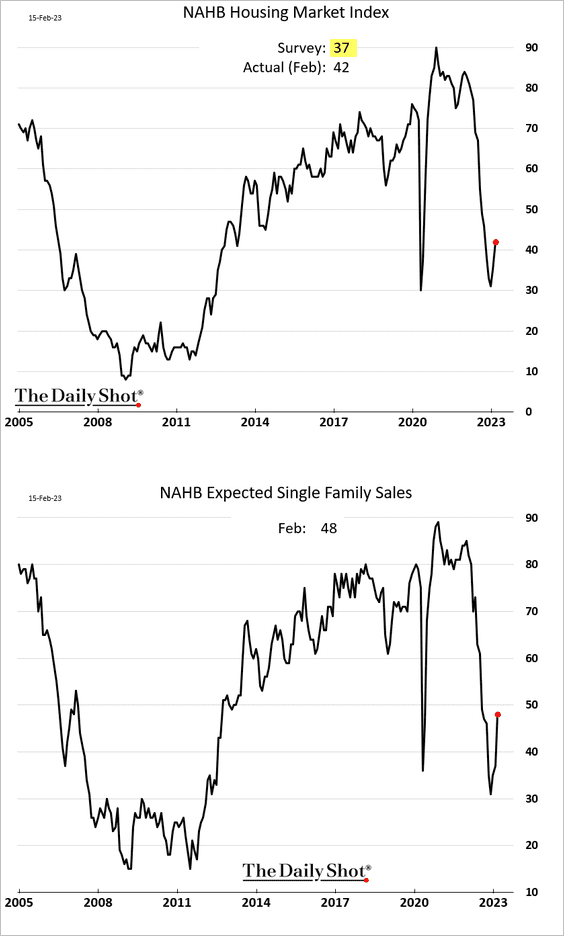
 Source: Reuters Read full article
• This chart shows new home sales compared to previous housing downturns.
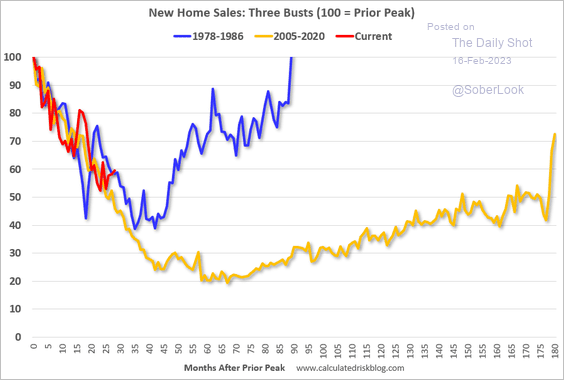 Source: Calculated Risk
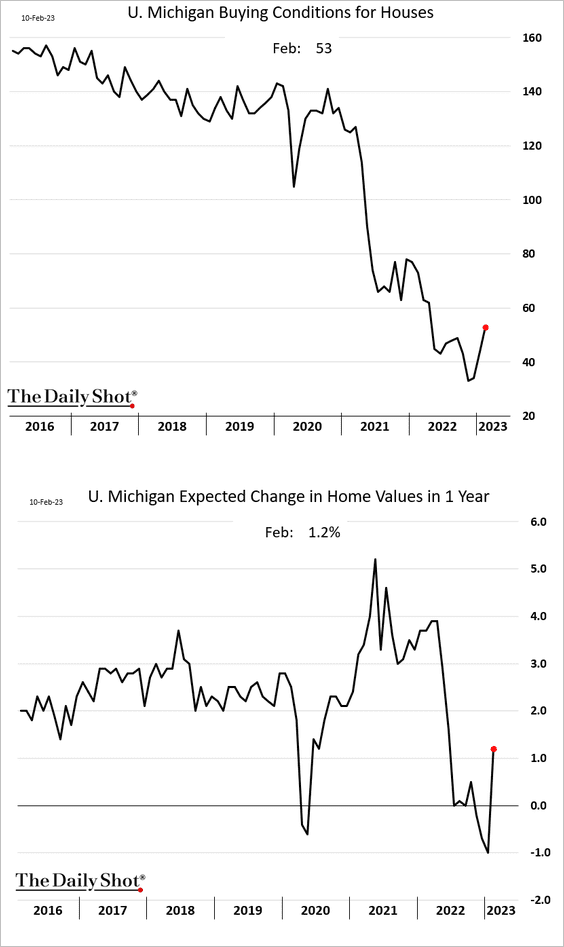
• Consumers’ views on house price appreciation and buying conditions for homes improved this month.
• Weakness in the housing market will be a drag on retail sales.
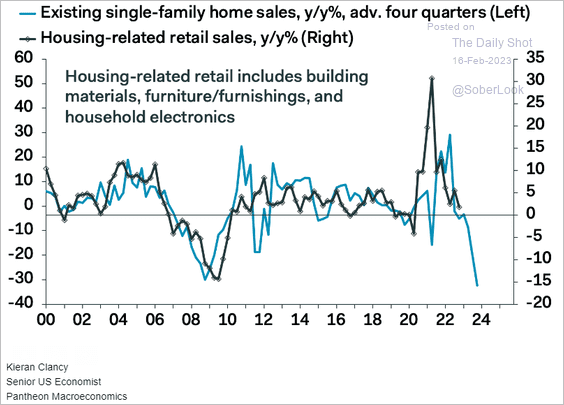 Source: Pantheon Macroeconomics
• We may soon see a sharp drop in construction jobs.
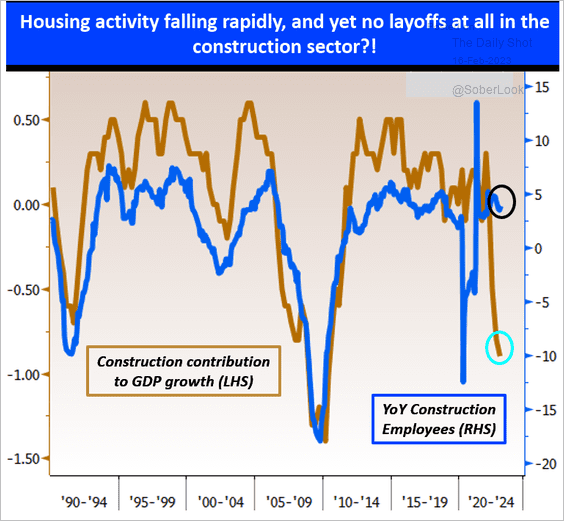 Source: @MacroAlf
• This chart shows soft/hard economic landings during previous housing cycles.
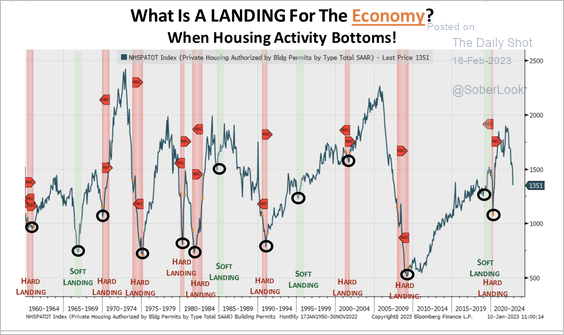 Source: Piper Sandler
——————–
6. Finally, we have some additional updates on inflation.
• Inflation breadth remains elevated (2 charts).
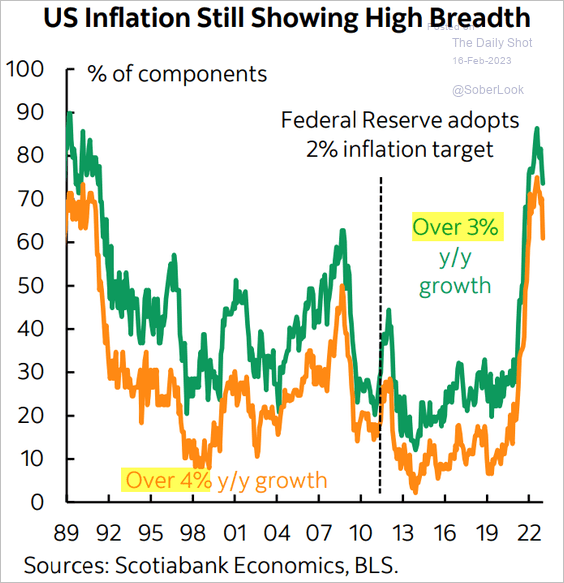 Source: Scotiabank Economics
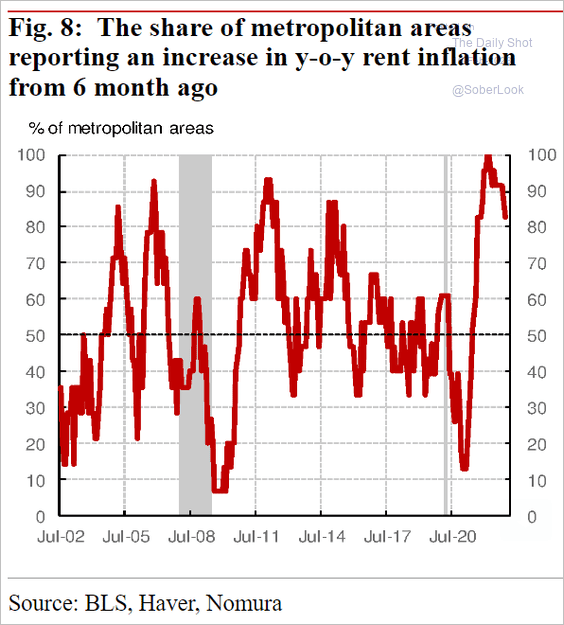 Source: Nomura Securities
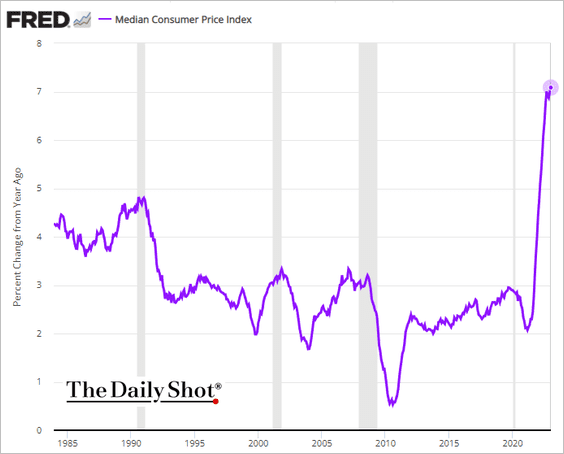
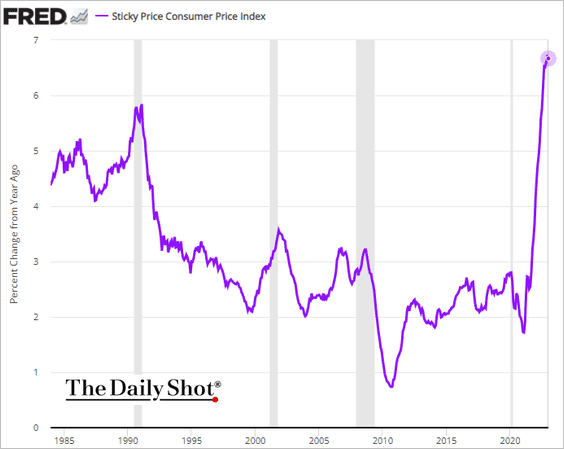
• The trimmed-mean CPI measure is off the highs (on a year-over-year basis), …
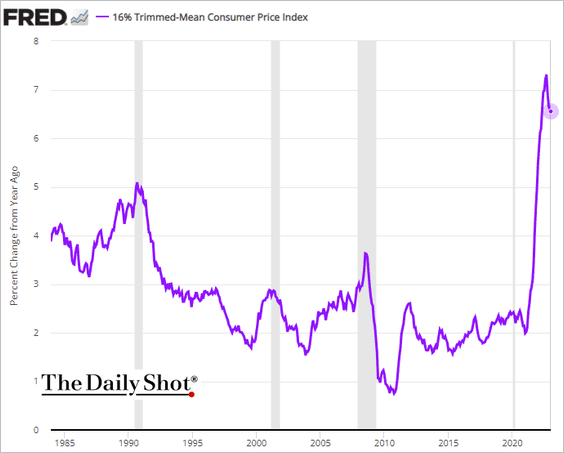
… but other alternative core inflation measures haven’t budged. The median CPI is above 7% for the first time in decades.
Here is the Sticky CPI:
The core Flexible CPI is at zero.
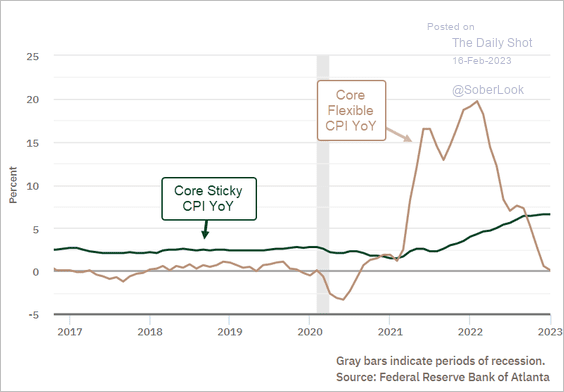 Source: @AtlantaFed Read full article
• Business inflation expectations have been moderating.
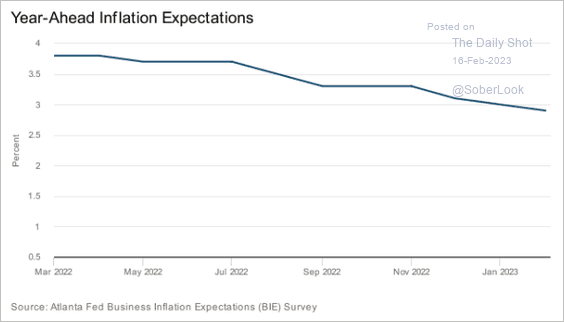 Source: @AtlantaFed
Back to Index
Canada
1. Housing starts weakened sharply last month.
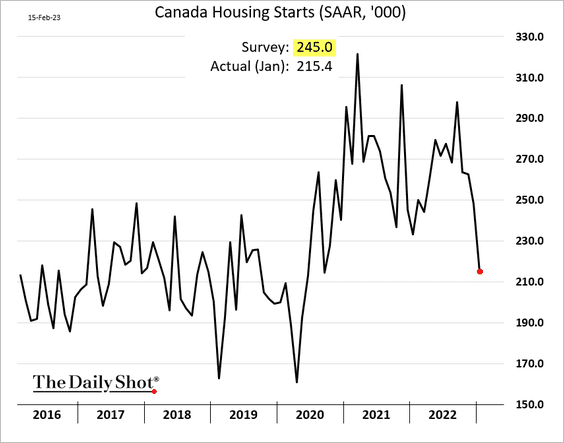
 Source: MarketWatch Read full article
Unsold inventories of new single-family homes are rising.
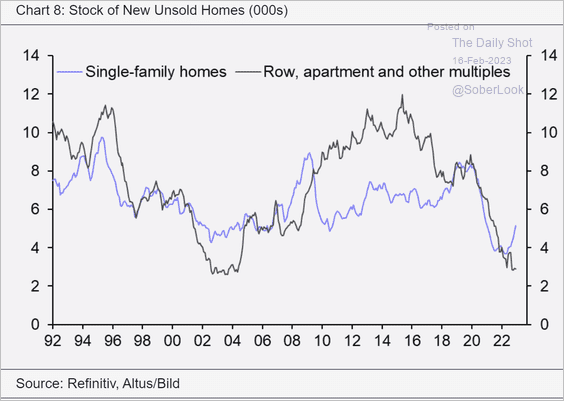 Source: Capital Economics
——————–
2. What occurs in the following month after a significant increase in employment, like the one observed in January?
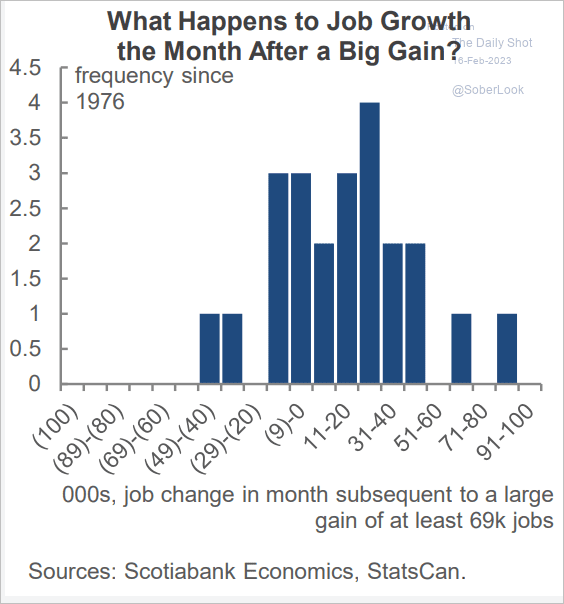 Source: Scotiabank Economics
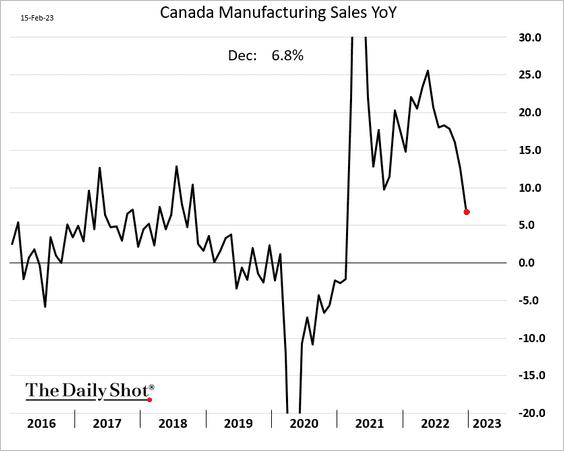
3. Manufacturing sales finished the year on a soft note.
4. Firms’ inflation expectations have shifted lower.
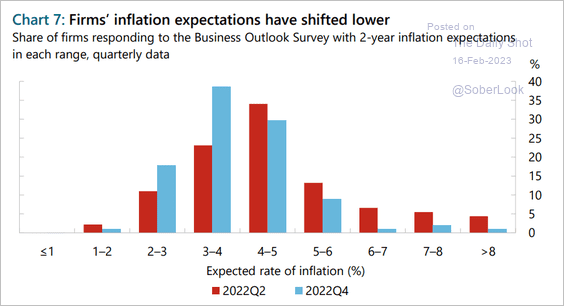 Source: BoC Read full article
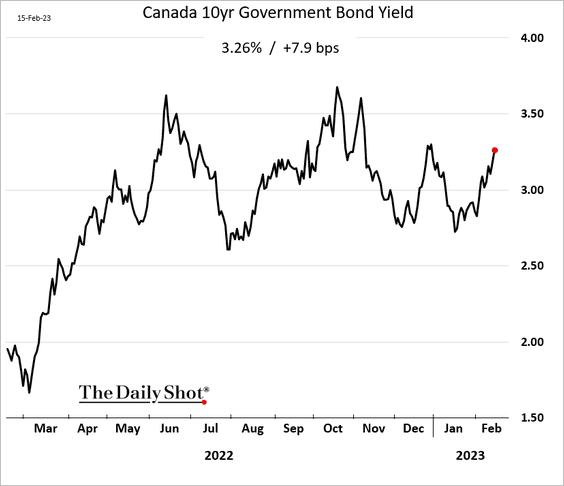
5. Bond yields are rising again.
Back to Index
The United Kingdom
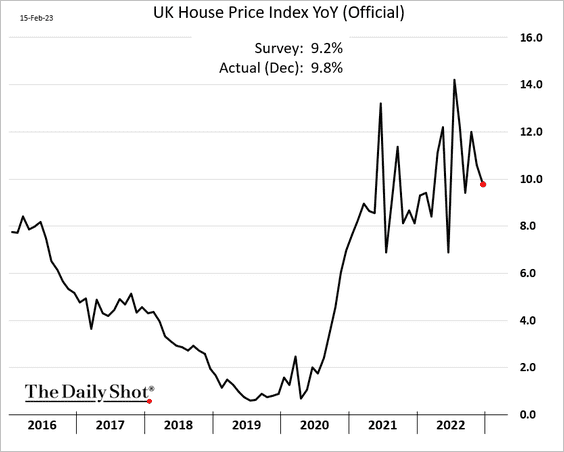
1. The official index of home price appreciation eased but was higher than expected.
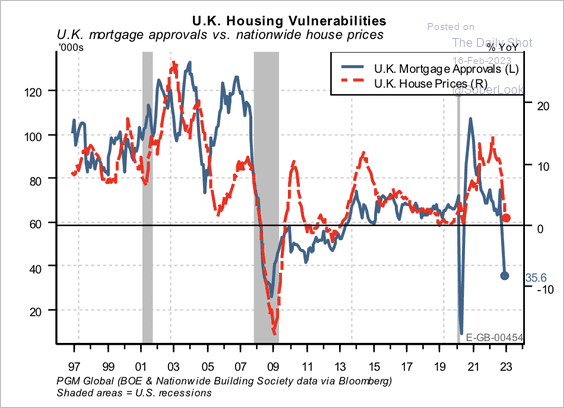
Sharp declines in mortgage approvals suggest that additional house price weakness is likely to follow. According to PGM Global, roughly 42% of UK mortgages are at variable rates or fixed rates that expire or reset within 24 months.
 Source: PGM Global
——————–
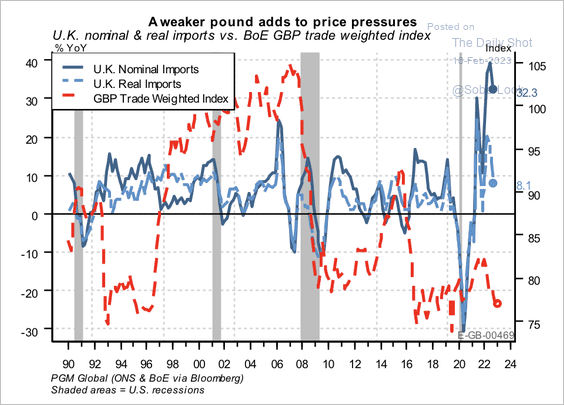
2. The weak pound exacerbated import inflation.
 Source: PGM Global
Back to Index
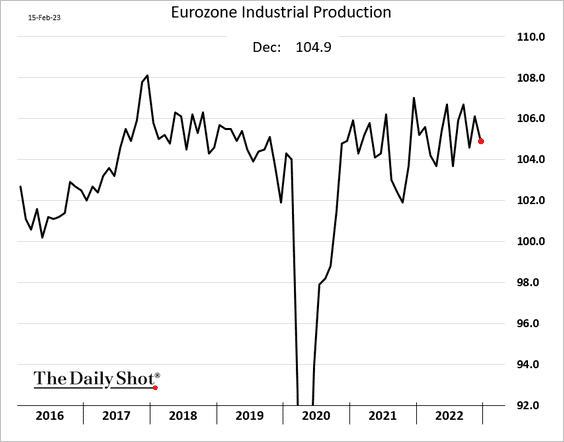
The Eurozone
1. Euro-area industrial production declined in December.
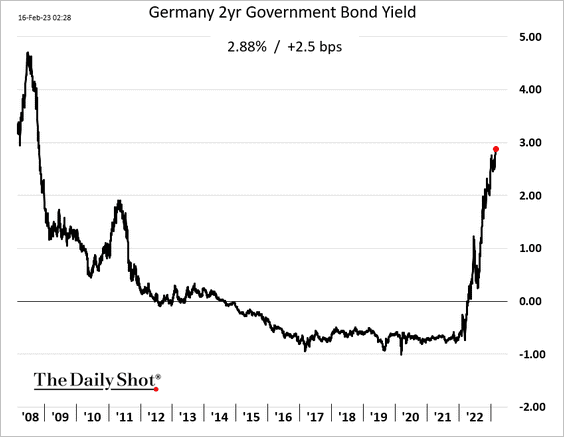
2. Bund yields continue to climb.
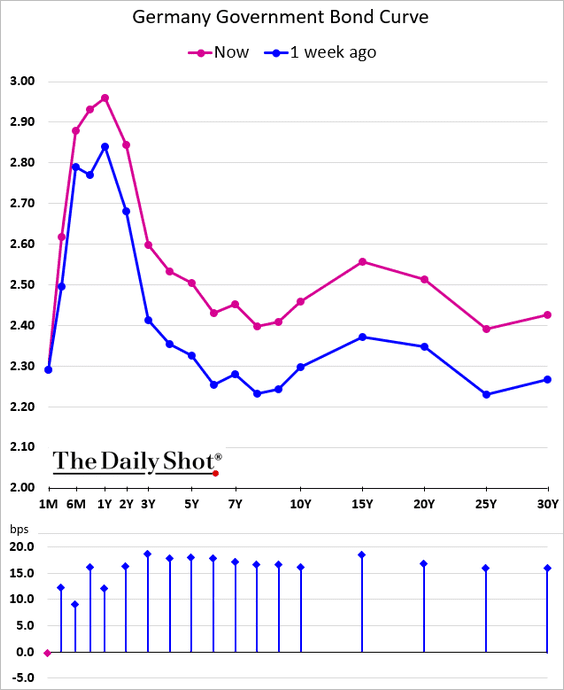
Here is the yield curve.
——————–
3. The Eurozone stock/bond ratio appears overbought.
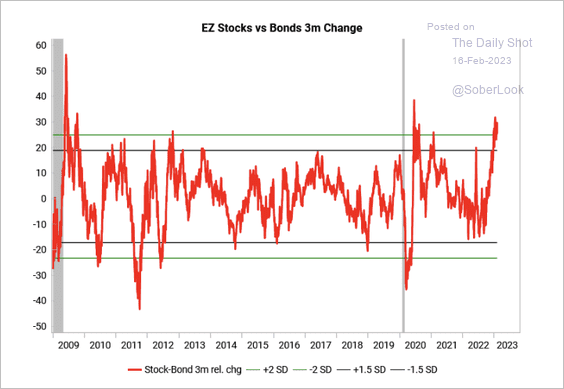 Source: Variant Perception
Back to Index
Europe
1. Norway’s GDP continued to grow in Q4.
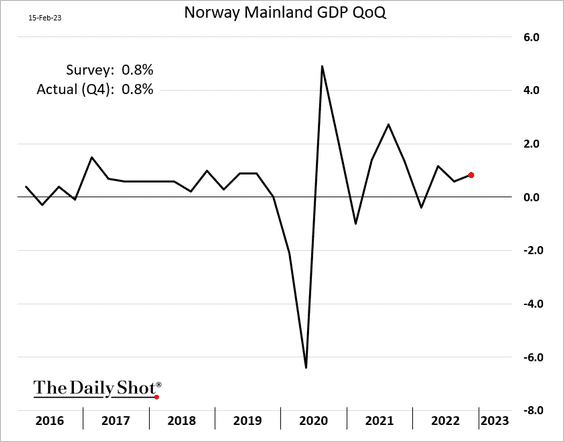
 Source: @economics, @ottummelas Read full article
——————–
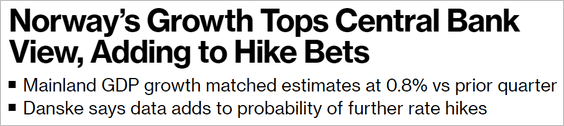
2. This scatterplot from BofA shows how European investors view sector valuation vs. allocations.
 Source: BofA Global Research
Back to Index
Asia – Pacific
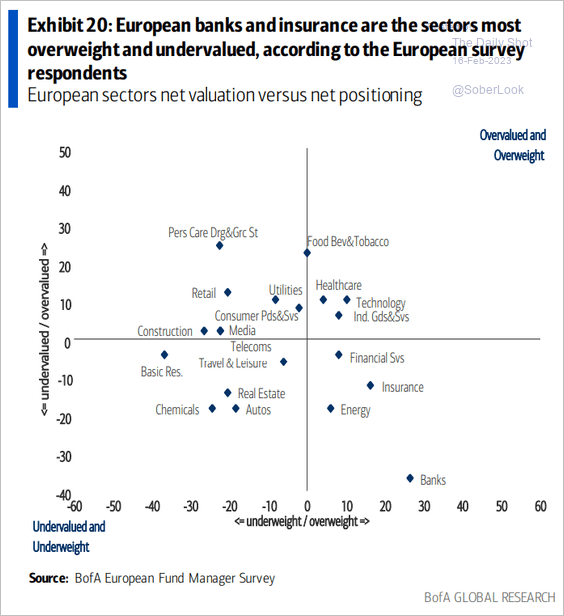
1. Japanese investors are reversing their foreign stock buying binge at the beginning of the year.
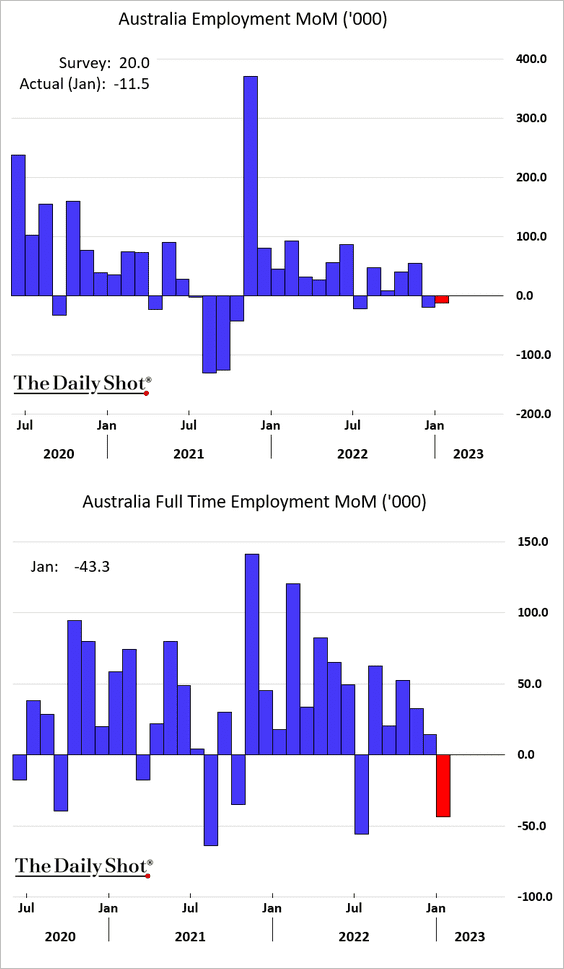
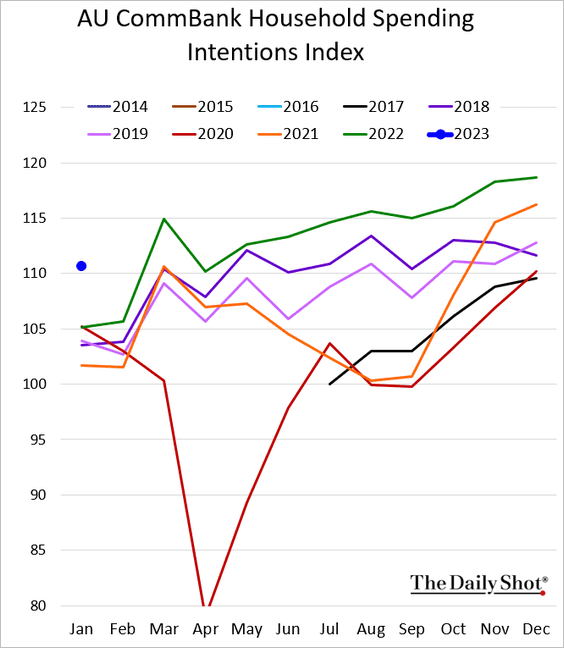
2. Next, we have some updates on Australia.
• The January employment report was disappointing, showing a job loss for the second consecutive month.
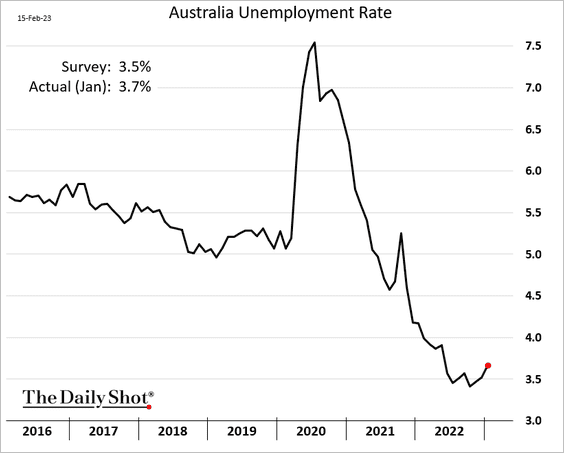
– The unemployment rate was higher than expected.
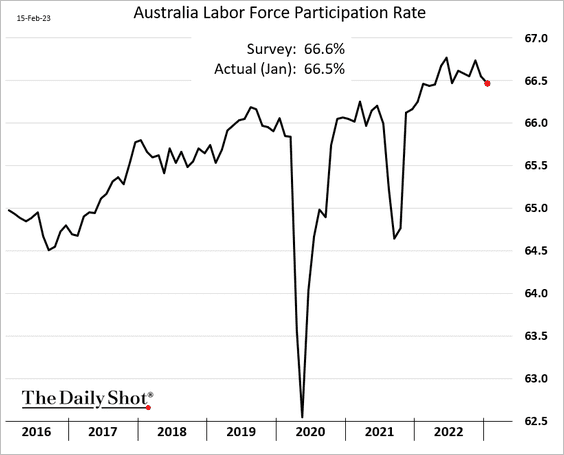
– Labor force participation declined again.
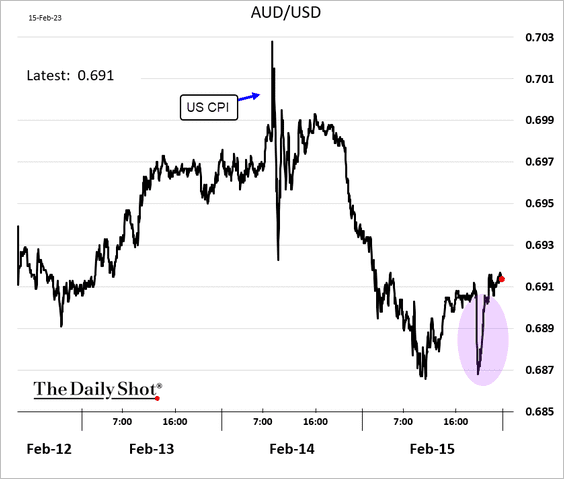
– The Aussie dollar shrugged off the soft employment report.
• Household spending intentions jumped in January.
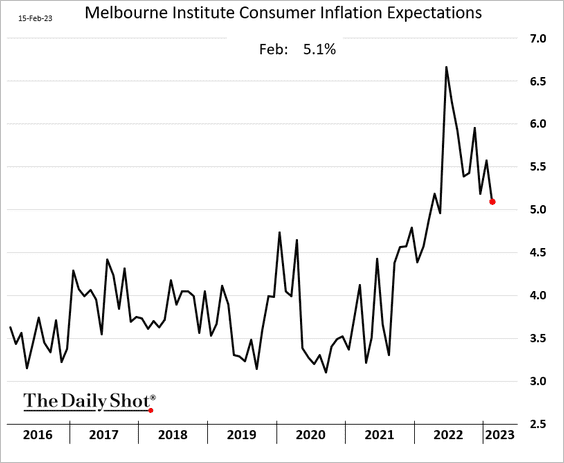
• Inflation expectations continue to ease.
Back to Index
Emerging Markets
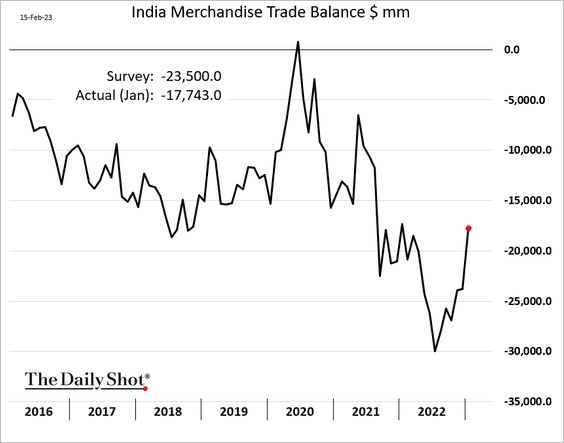
1. India’s trade deficit narrowed more than expected last month.
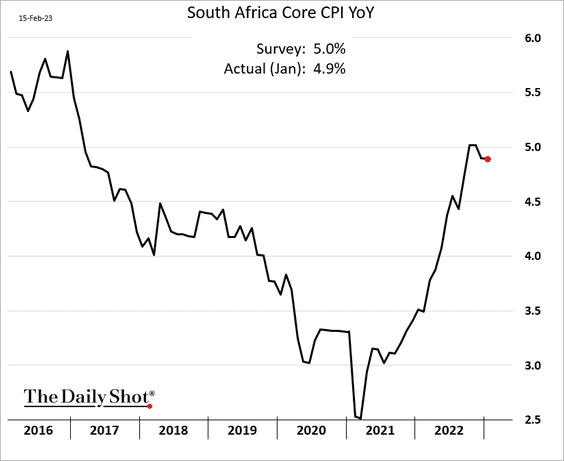
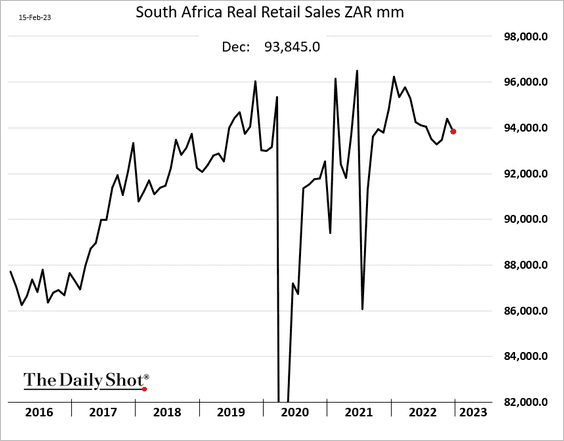
2. South Africa’s core inflation seems to have peaked.
• Retail sales declined in December.
• South Africa’s sovereign CDS spread is almost twice its level at the start of 2010.
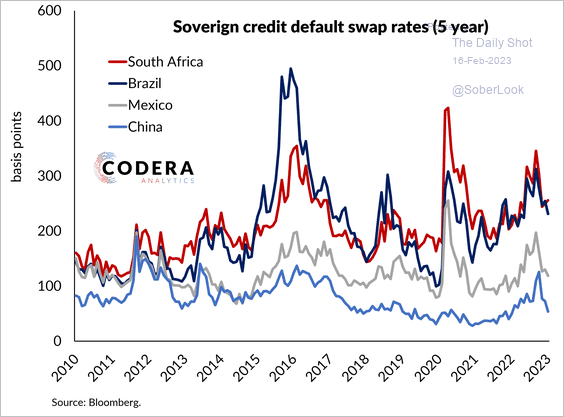 Source: Codera Analytics
——————–
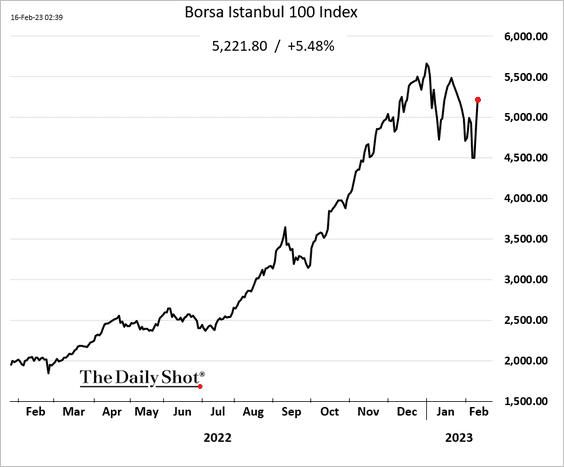
3. Turkey’s stock market continues to rebound.
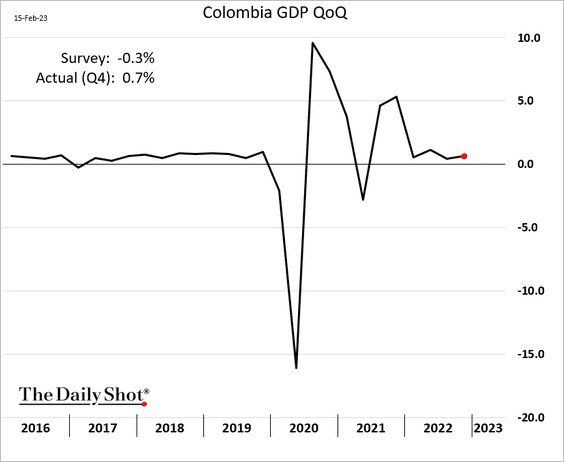
4. Colombia’s GDP growth held in positive territory in Q4.
5. EM portfolio inflows have been exceptionally strong.
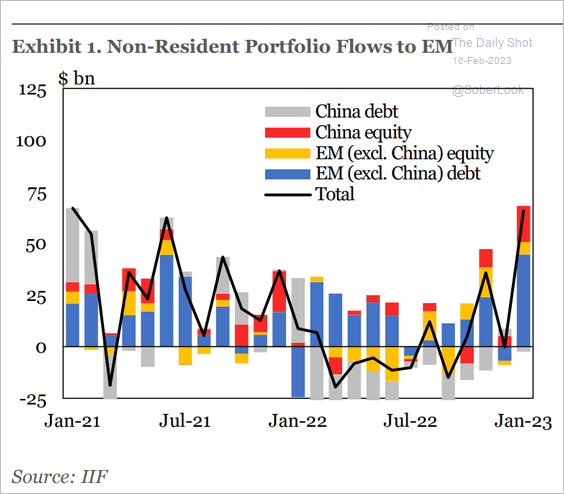 Source: IIF
Back to Index
Cryptocurrency
1. Cryptos surged this week.
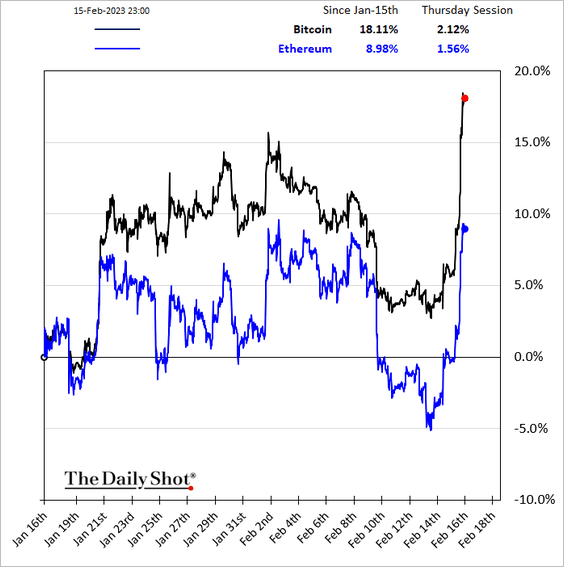
 Source: @olgakharif, @crypto Read full article
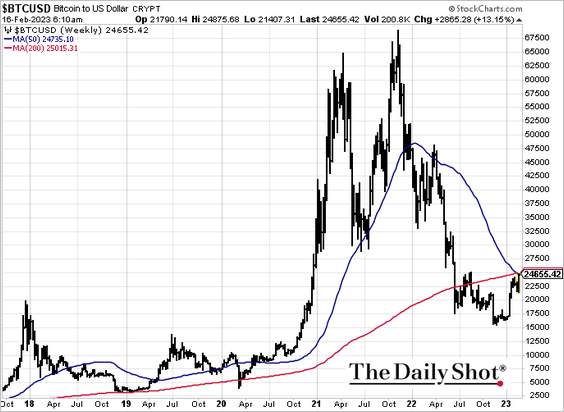
2. Bitcoin is testing resistance at $25k, …
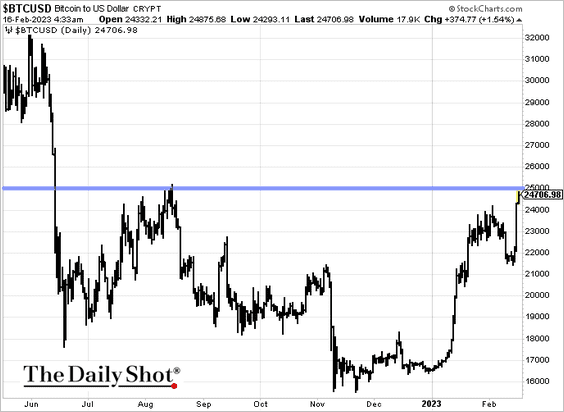
… with death cross forming, based on weekly moving averages.
——————–
3. NFT sales have collapsed.
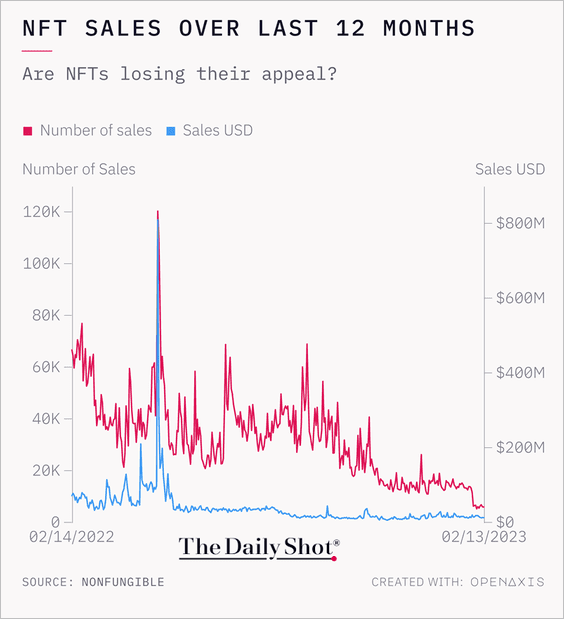 Source: @OpenAxisHQ
Back to Index
Energy
1. US crude oil inventories climbed above their 5-year range last week.
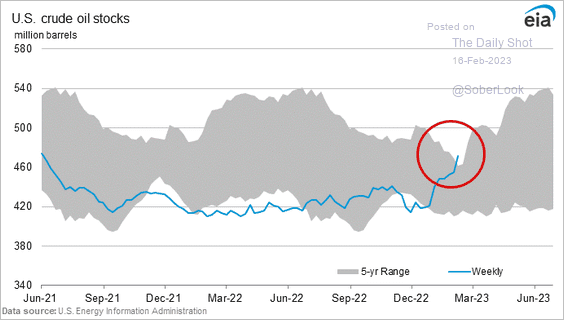
Refined product inventories are still very low, …
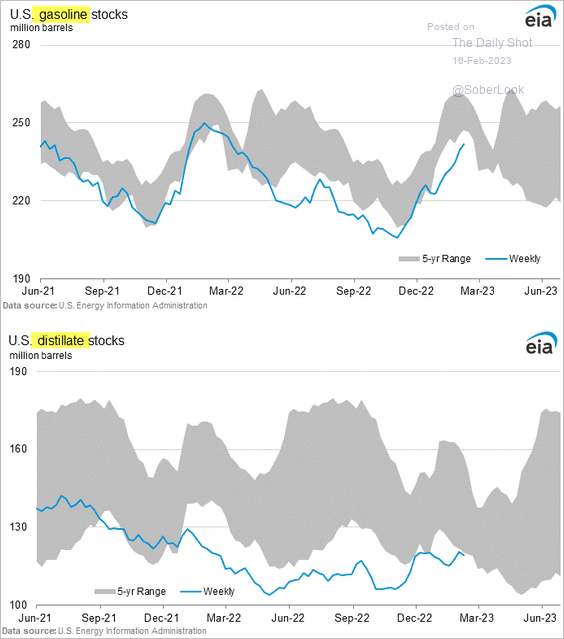
… but are now above last year’s levels when measured in days of supply.
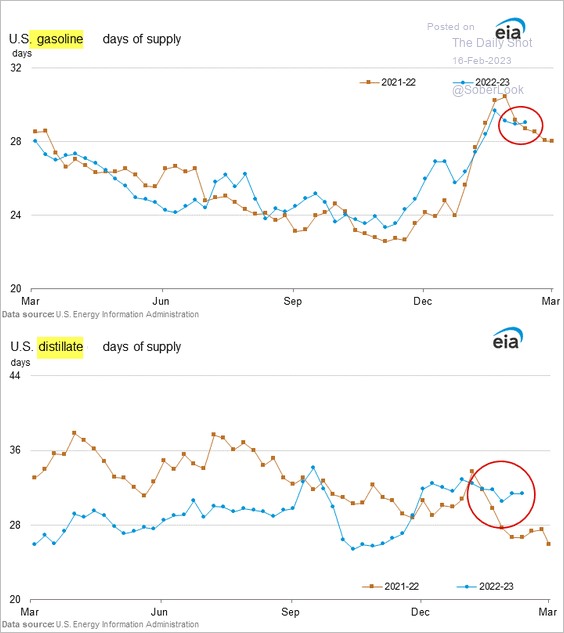
The divergence is due to softer demand (2 charts).
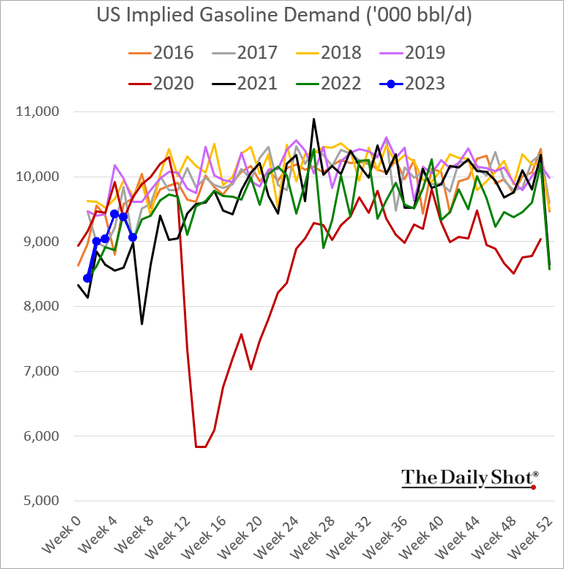
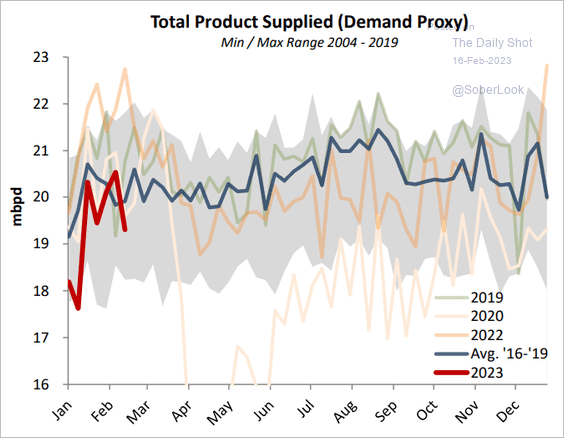 Source: Princeton Energy Advisors
——————–
2. US net crude oil imports hit the lowest level in years.
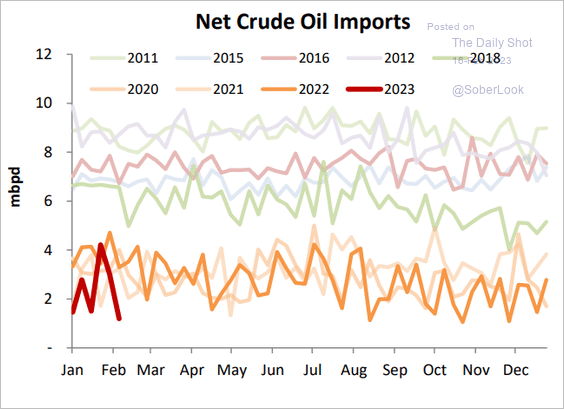 Source: Princeton Energy Advisors
3. The IEA predicts a surge in crude oil demand as China reopens.
 Source: @WSJ Read full article
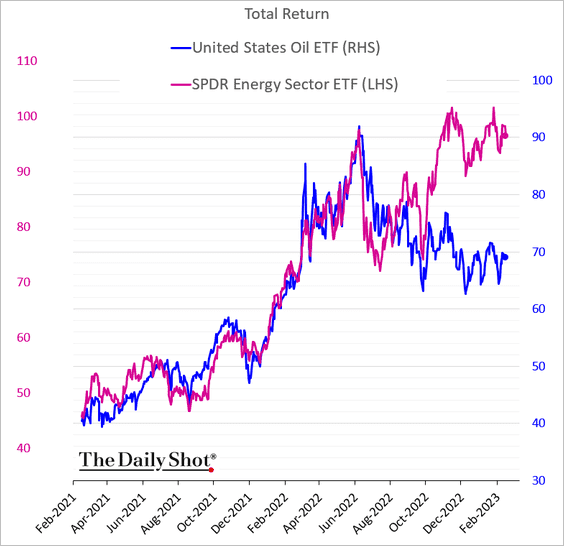
4. The divergence between energy shares and oil prices persists.
Back to Index
Equities
1. The stock/bond correlation is negative again.
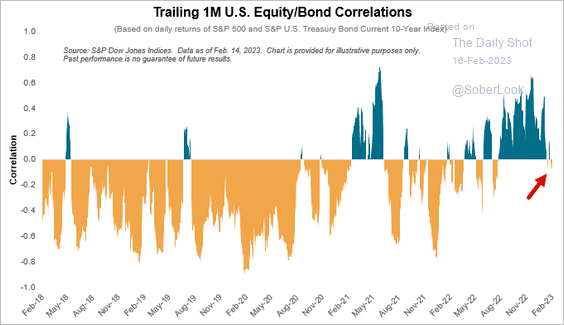 Source: S&P Dow Jones Indices
2. Fund managers have been rotating into cyclicals.
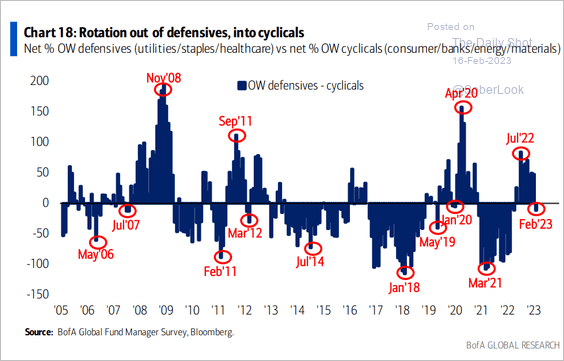 Source: BofA Global Research
3. Breadth across global equities improved during the latest rally. However, breadth signals can whipsaw during persistent downtrends, similar to the early 2000s.
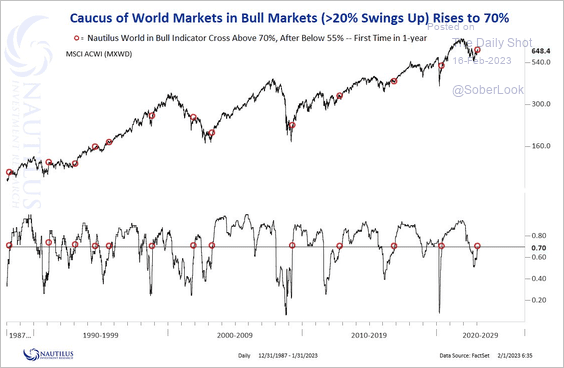 Source: @NautilusCap
4. This chart shows earnings season beats relative to the five-year average for the US, Europe, and emerging markets.
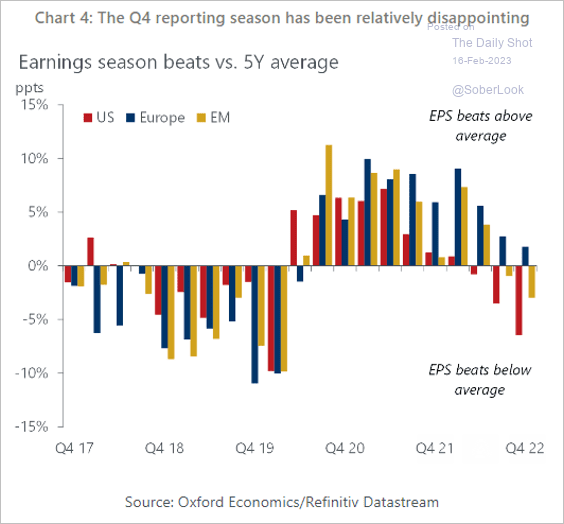 Source: Oxford Economics
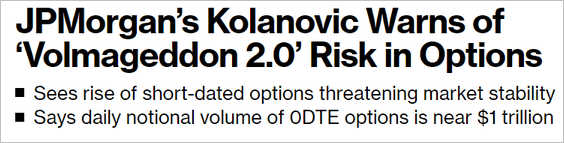
5. Nearly half the options on S&P 500 stocks as well as on SPY and QQQ have maturities of less than 24 hours (0DTE).
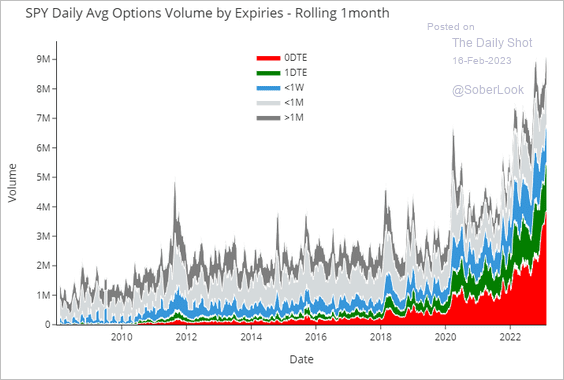 Source: Nomura Securities
Some analysts see this trend as posing substantial risks for the market.
 Source: @luwangnyc, @markets Read full article
——————–
6. Should stock investors be concerned about the Fed draining liquidity from the banking system? Stocks have diverged from Fed reserve balances.
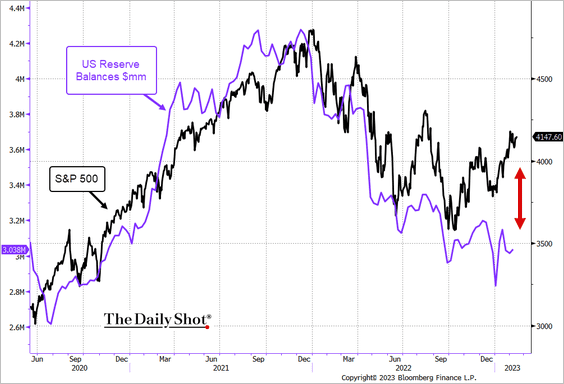 Source: @TheTerminal, Bloomberg Finance L.P.
7. S&P 600 small-caps are gaining momentum relative to large-caps.
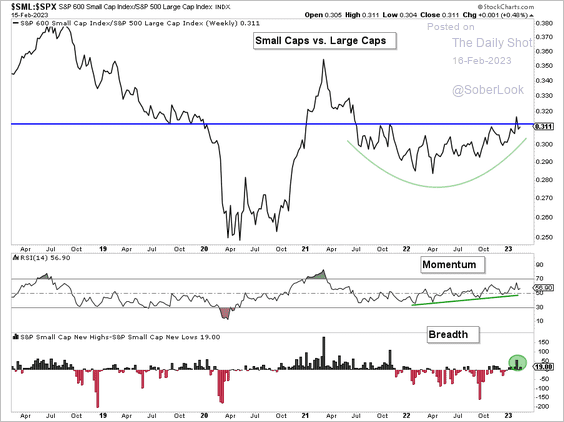 Source: Aazan Habib, Paradigm Capital
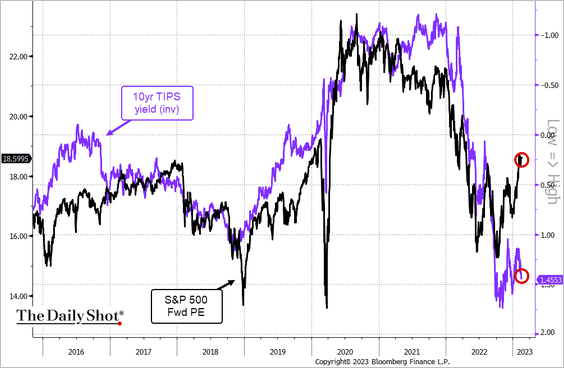
8. Next, let’s take a look at some valuation measures.
• The S&P 500 forward P/E ratio has substantially diverged from real yields.
 Source: @TheTerminal, Bloomberg Finance L.P.
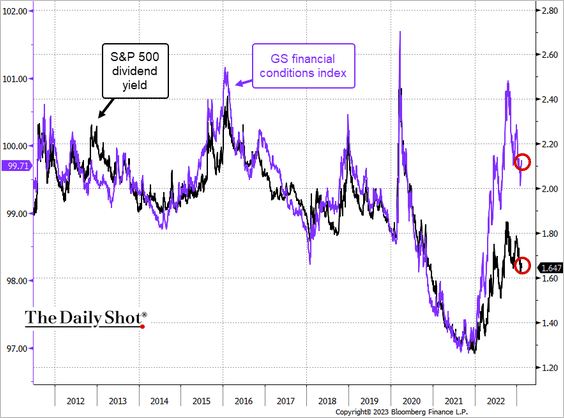
• US financial conditions have eased somewhat, but they are still too tight for the S&P 500 dividend yield to be this low.
 Source: @TheTerminal, Bloomberg Finance L.P.
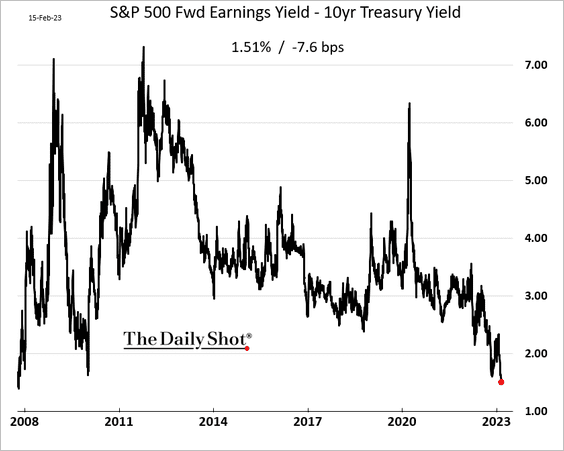
• The S&P 500 risk premium is the lowest since 2007. Very low risk premiums can portend poor returns over the next few years.
Back to Index
Rates
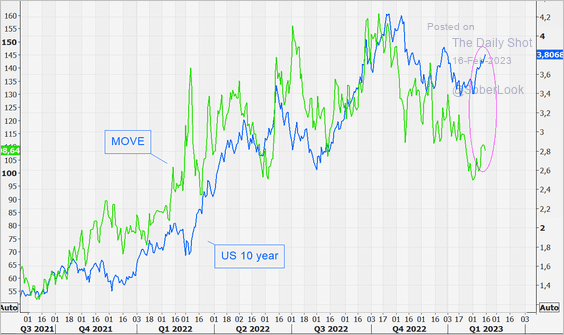
1. The rise in Treasury yields suggests that rates implied vol should be higher.
 Source: @themarketear
2. The breakeven curve (inflation expectations) has inverted again.
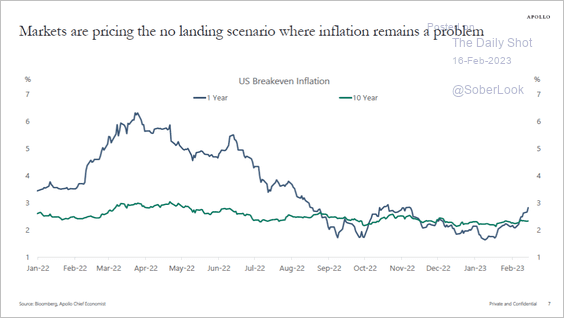 Source: Torsten Slok, Apollo
3. The three-month LIBOR – SOFR spread has been tightening.
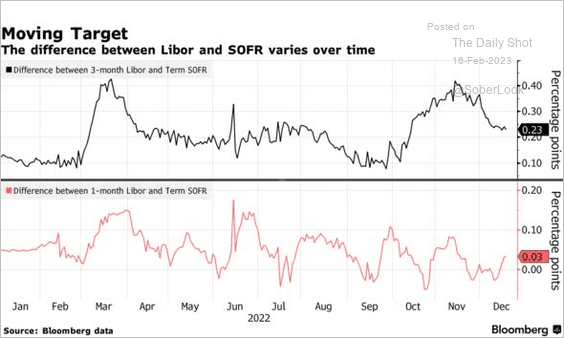 Source: @PSeligson, @markets Read full article
——————–
Food for Thought
1. The cost of mobile internet:
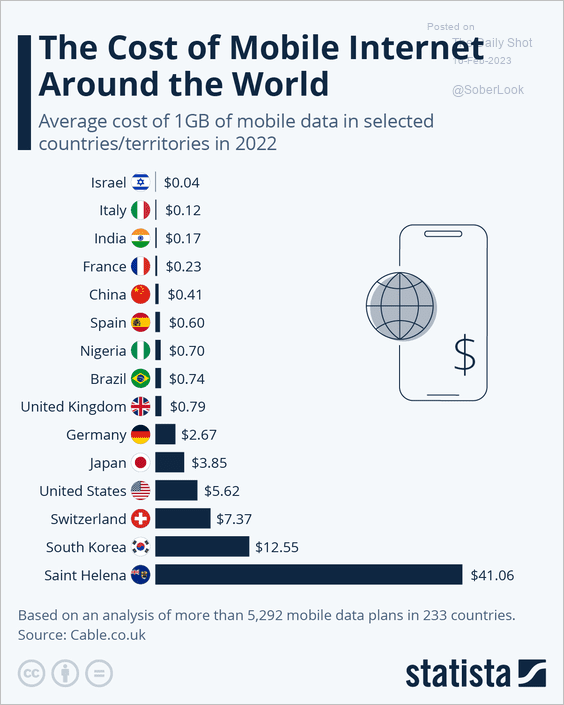 Source: Statista
2. Technology with the greatest strategic value:
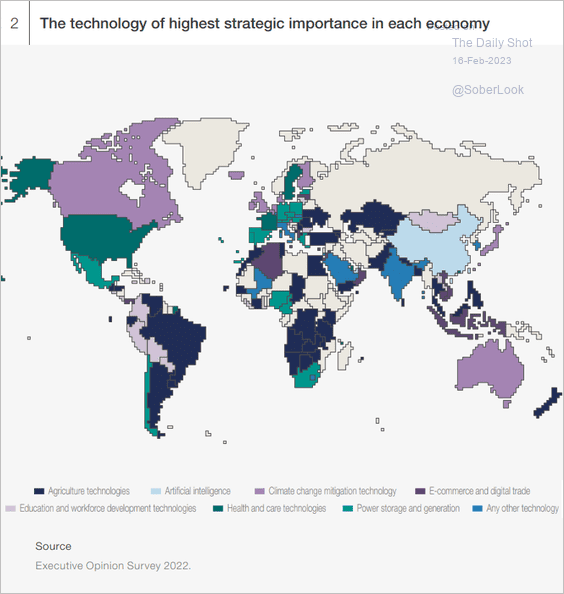 Source: WEF Read full article
3. Peak podcast?
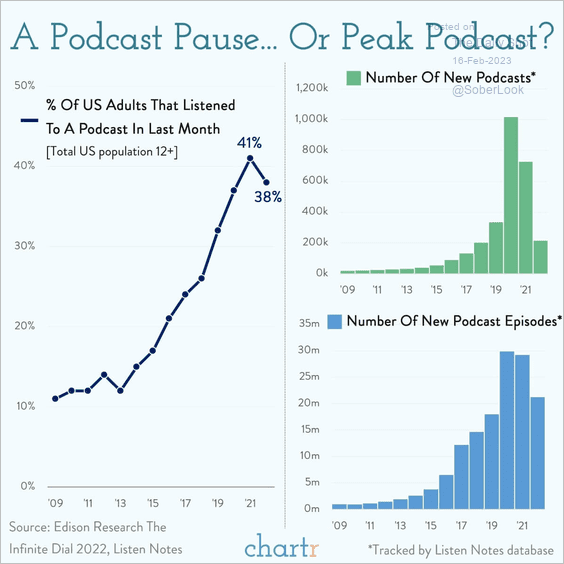 Source: @chartrdaily
4. SpaceX satellite launches:
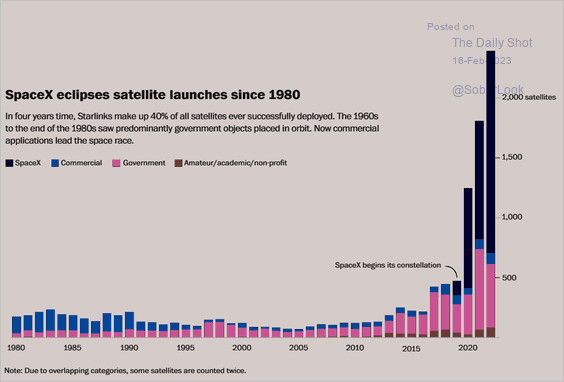 Source: The Washington Post Read full article
5. Installations of industrial robots:
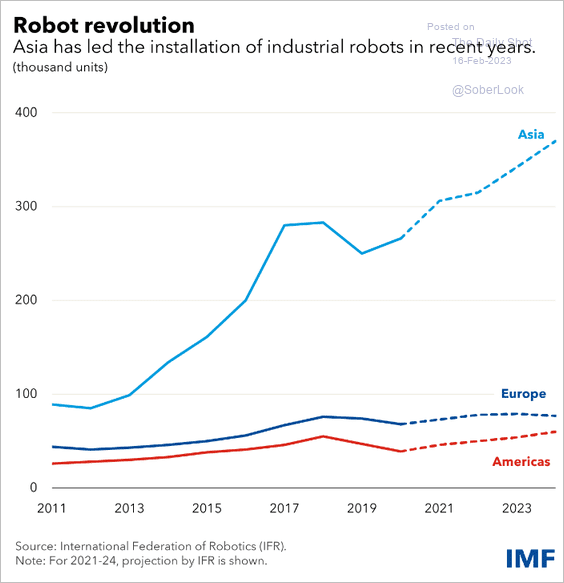 Source: IMF Read full article
6. Fossil fuels’ share of global electricity production:
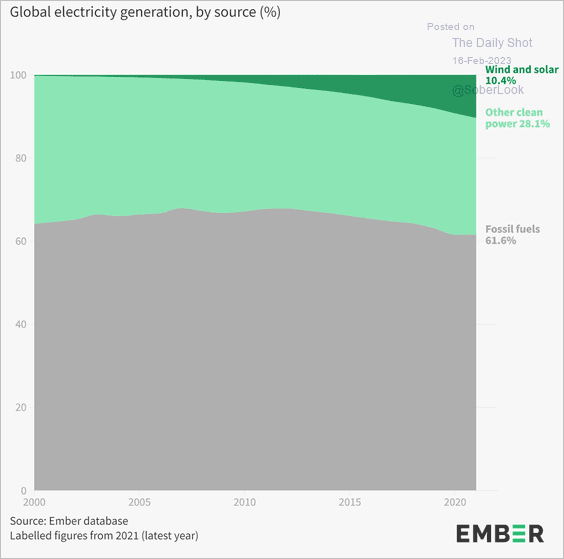 Source: @EmberClimate
7. Women in the United States Congress:
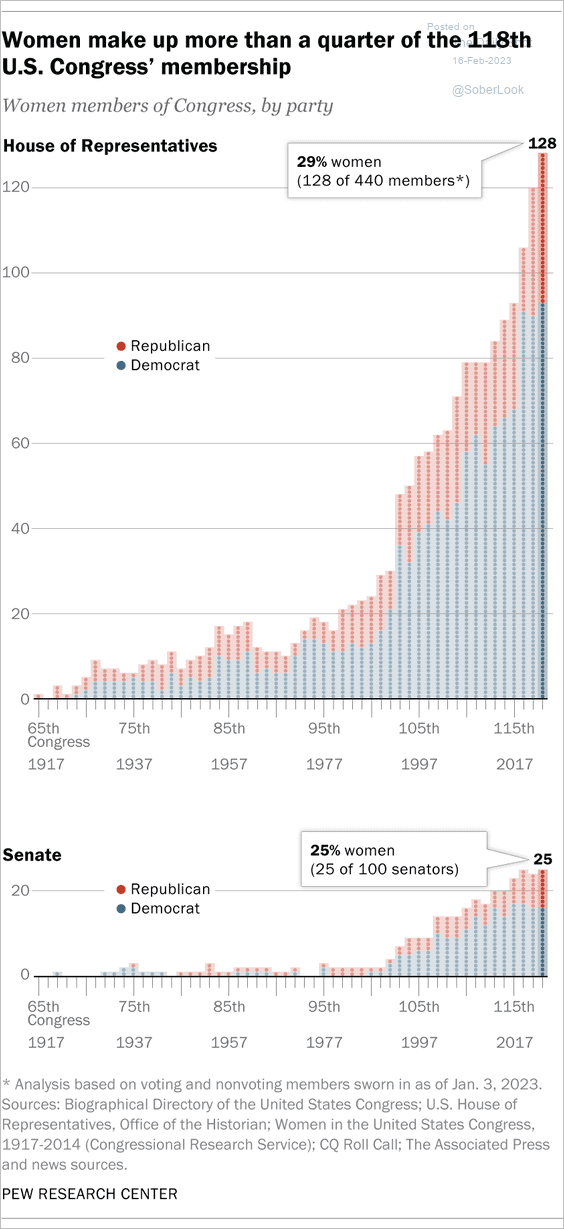 Source: Pew Research Center Read full article
8. GOP House members’ share of small-donor election funding:
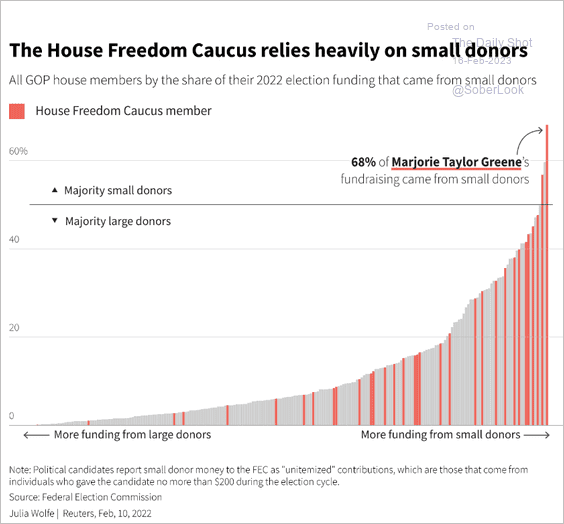 Source: Reuters Read full article
9. Vegan-related online search activity:
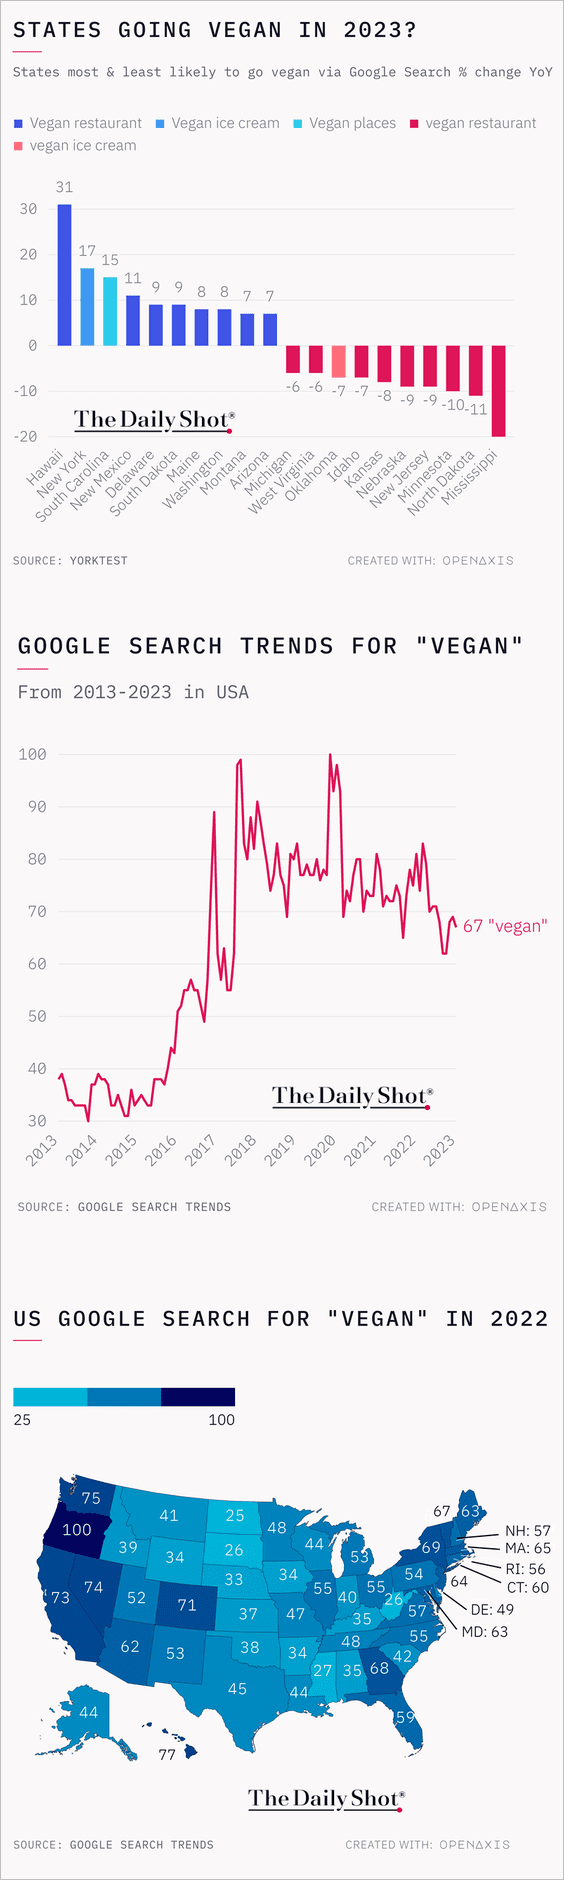 Source: @OpenAxisHQ
——————–
Back to Index