
The Daily Shot: 21-Feb-23
• The United States
• The United Kingdom
• The Eurozone
• Europe
• Japan
• Asia-Pacific
• China
• Emerging Markets
• Cryptocurrency
• Commodities
• Energy
• Equities
• Credit
• Rates
• Global Developments
• Food for Thought
The United States
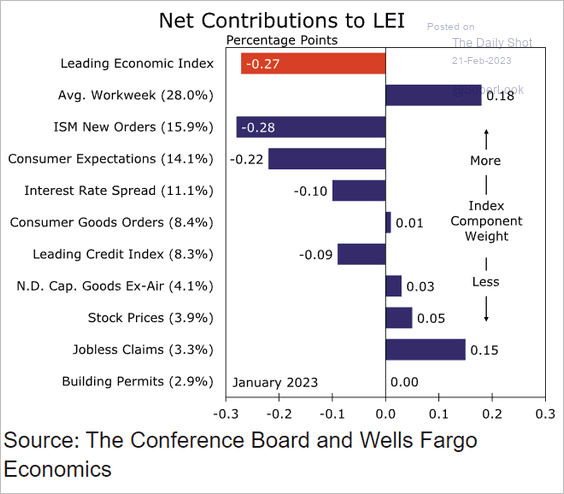
1. The Conference Board’s leading index declined again last month.

• Here are the drivers of the index in January.
 Source: Wells Fargo Securities
• The leading index continues to signal a mild recession ahead, …
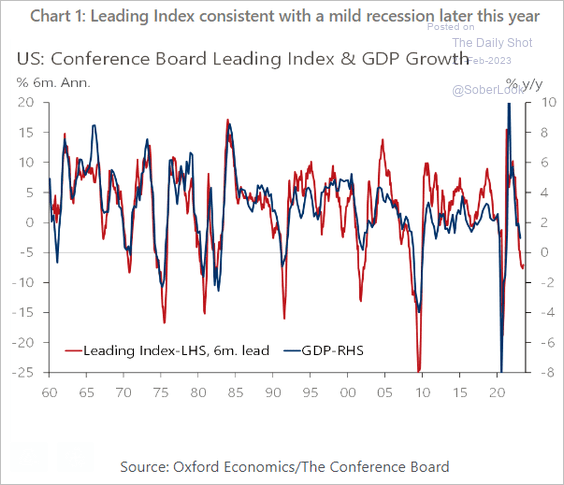 Source: Oxford Economics
… which is consistent with the February Philly Fed’s regional manufacturing outlook indicator.
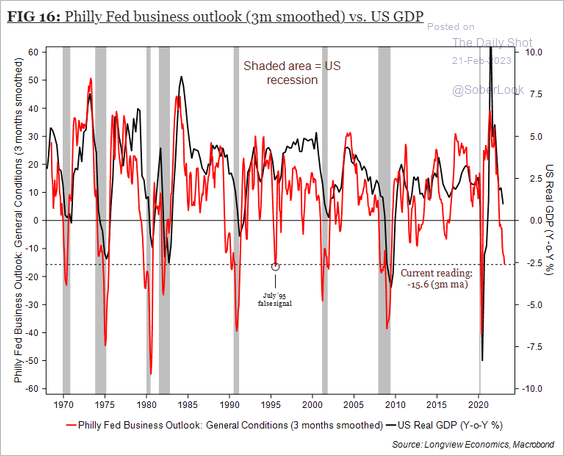 Source: Longview Economics
• Deutsche Bank’s model shows a 90% chance of recession over the next 12 months.
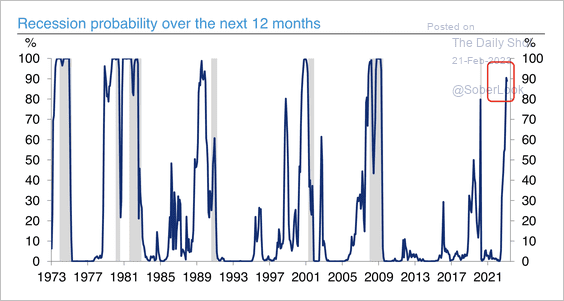 Source: Deutsche Bank Research
• However, fewer firms are mentioning “recession” on earnings calls.
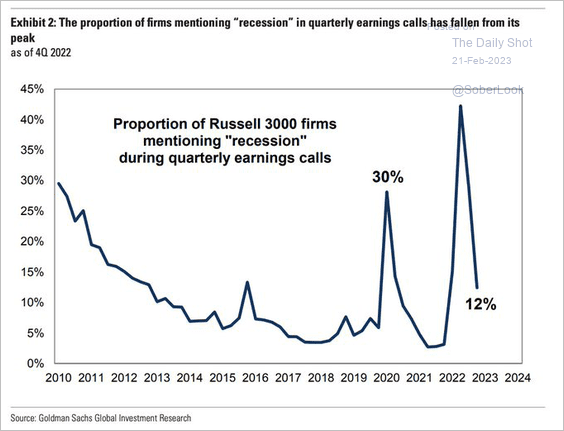 Source: Goldman Sachs; @SamRo
——————–
2. The World Economics SMI report shows US business activity returning to growth this month.
 Source: World Economics
3. Next, we have some updates on inflation.
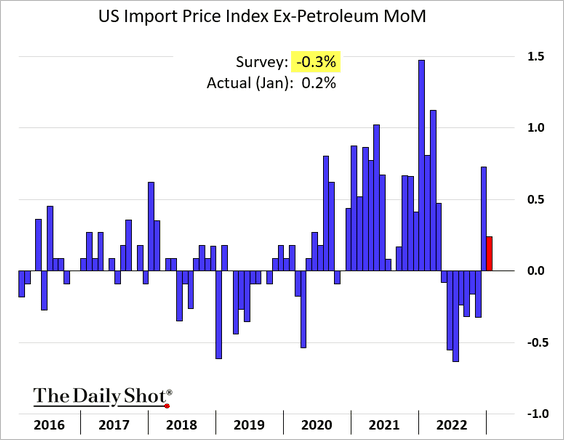
• Import prices (excluding petroleum) unexpectedly climbed in January.
• Based on the CPI and PPI reports, Nomura estimates a jump in the core PCE inflation in January.
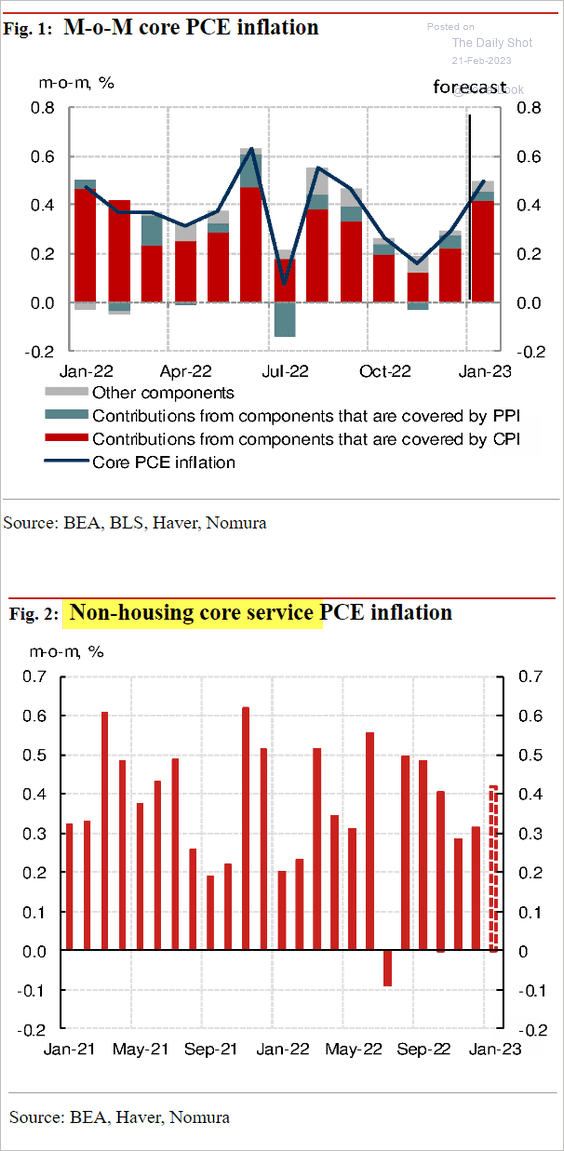 Source: Nomura Securities
• The recent surge in healthcare wage growth signals higher inflation in the sector.
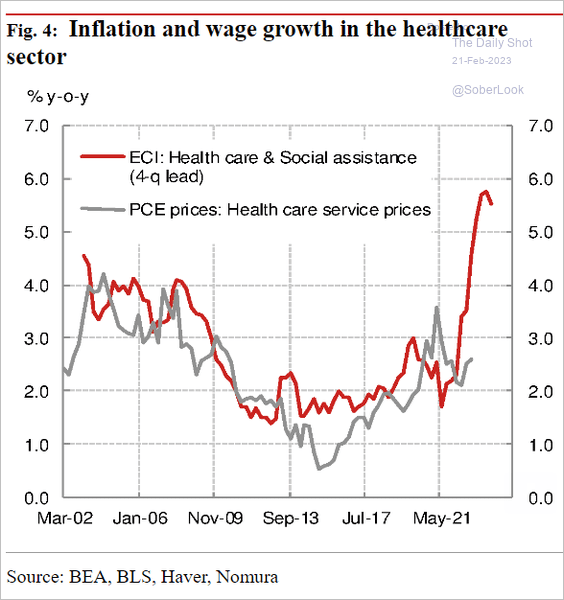 Source: Nomura Securities
• This chart shows US wage growth by wage quartile.
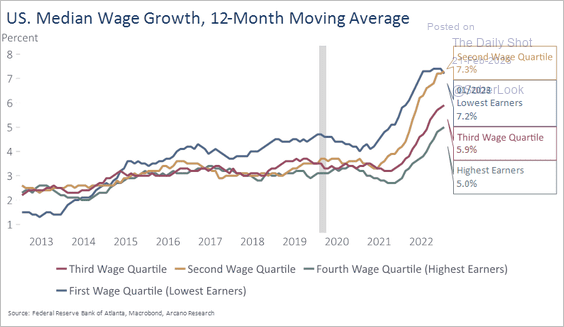 Source: Arcano Economics
• Back to the old Phillips Curve?
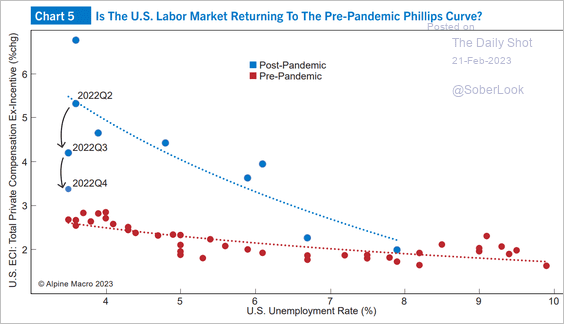 Source: Alpine Macro
——————–
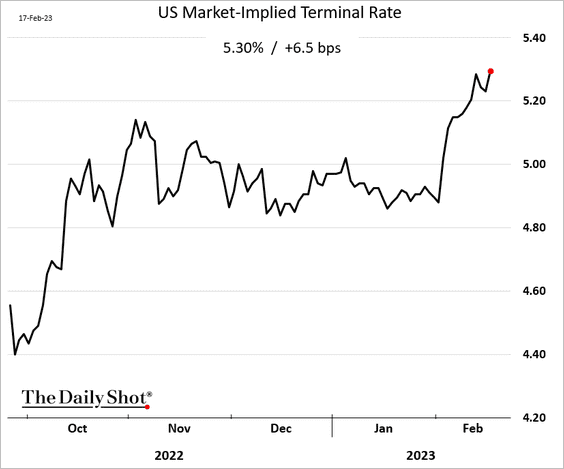
4. The market-implied terminal rate is up some 40 basis points this month. It’s surprising to see the stock market barely responding to this repricing in rate hike expectations.
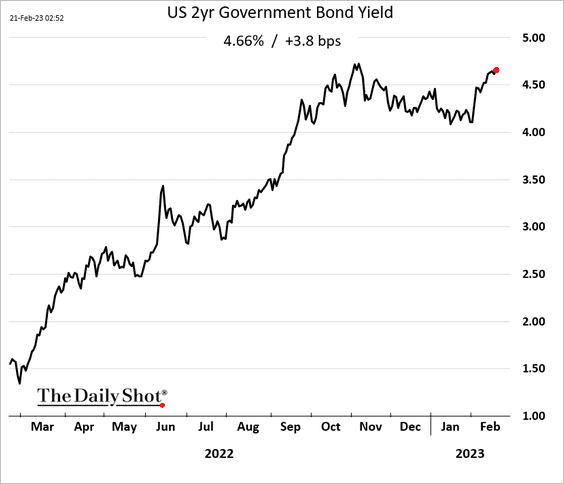
• The 2-year Treasury yield is nearing last year’s peak.
• Deutsche Bank expects an even higher terminal rate than the market.
 Source: Deutsche Bank Research
• The market is now more in line with the 2023 dot-plot, but there is a disagreement between the market and FOMC projections on rate cuts next year.
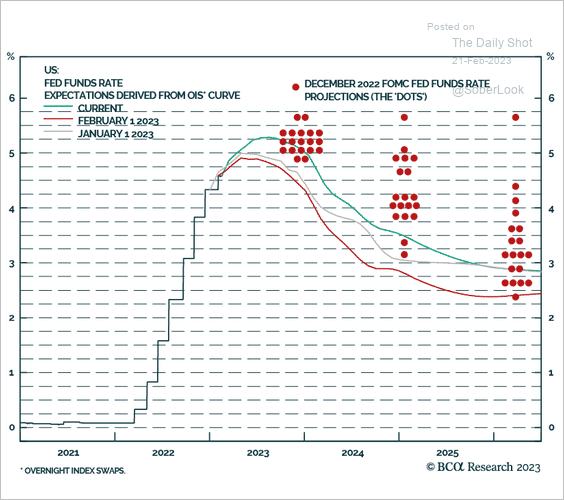 Source: BCA Research
• Here is why the Fed is less likely to cut rates, even amid soft economic activity.
 Source: BCA Research
——————–
5. Participation rates in key US economic data surveys have been falling.
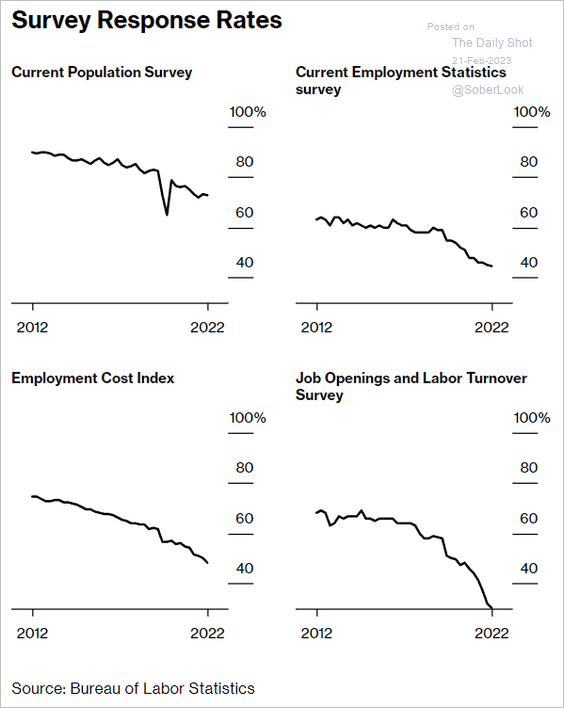 Source: @readep, @BW Read full article
6. Used cars are taking longer to sell.
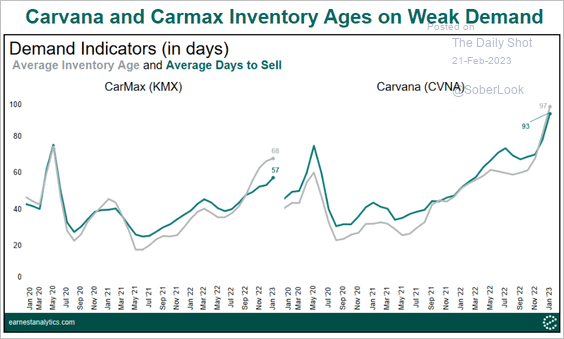 Source: @earnestinsights
Back to Index
The United Kingdom
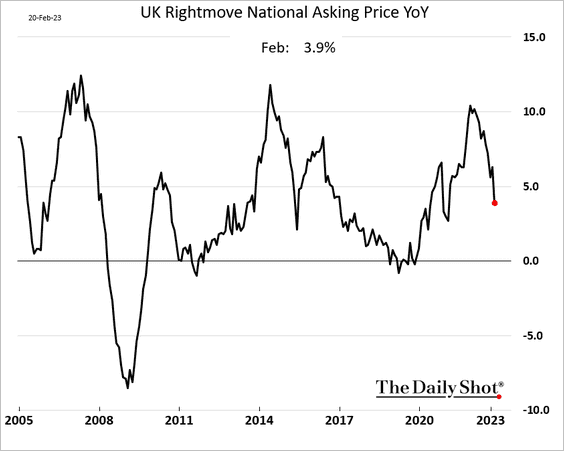
1. Home price appreciation continues to slow.
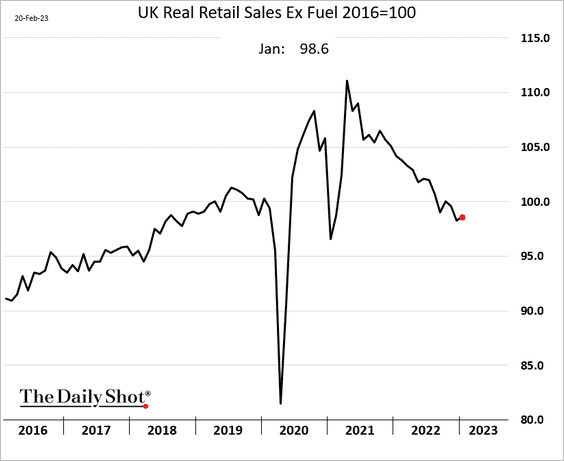
2. Retail sales edged up last month.
3. Tighter consumer credit conditions ahead?
 Source: Pantheon Macroeconomics
Back to Index
The Eurozone
1. Consumer confidence continues to rebound.
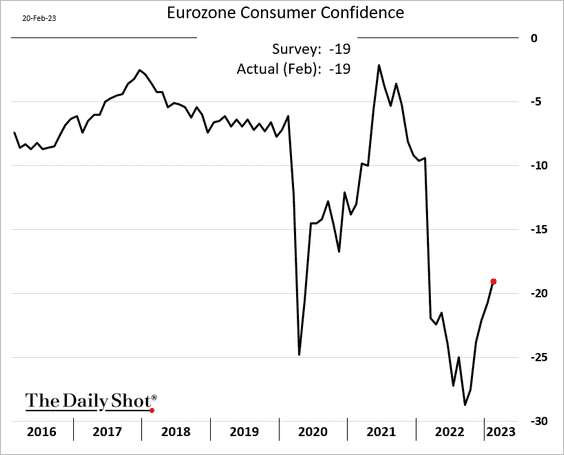
 Source: RTT News Read full article
——————–
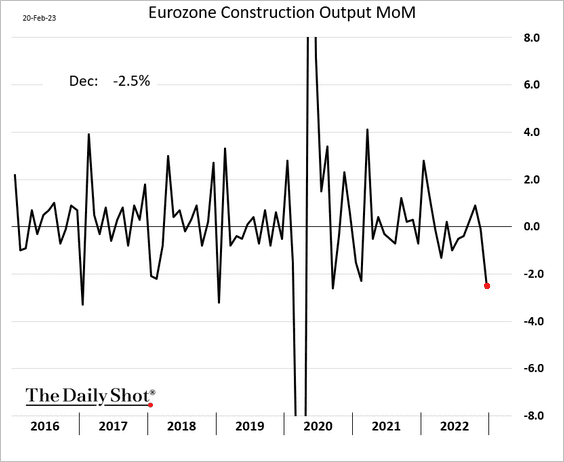
2. Construction output tumbled in December.
3. Barclays upgraded their 2023 GDP forecast for the euro area.
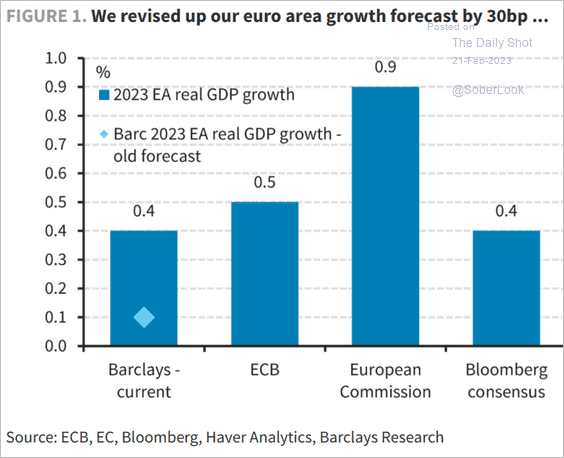 Source: Barclays Research
4. Will wage growth slow down later this year?
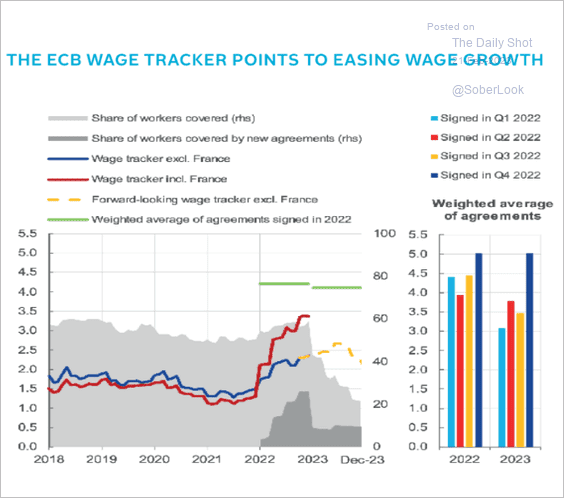 Source: Pantheon Macroeconomics
5. Much of the euro’s recent strength has been due to the dollar’s weakness.
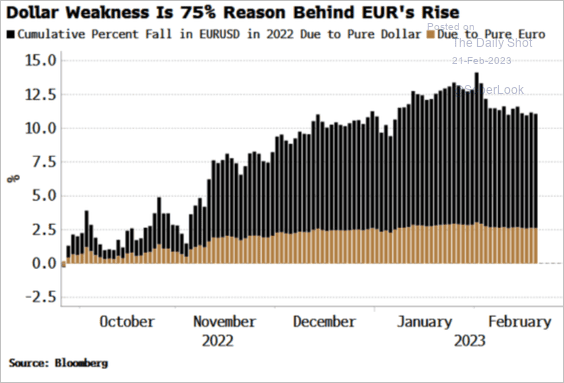 Source: Simon White, Bloomberg Markets Live Blog
Back to Index
Europe
1. Sweden’s underlying inflation print was a shocker.
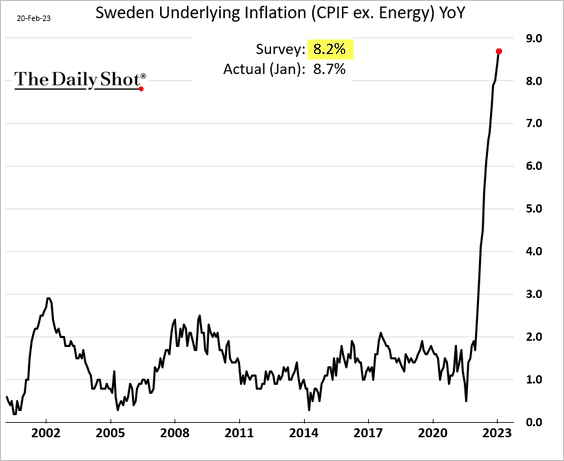
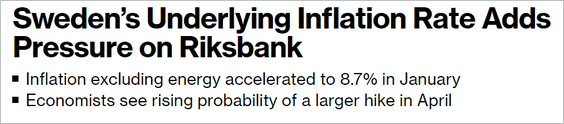 Source: @nicrolander, @economics Read full article
• Price gains were driven by services.
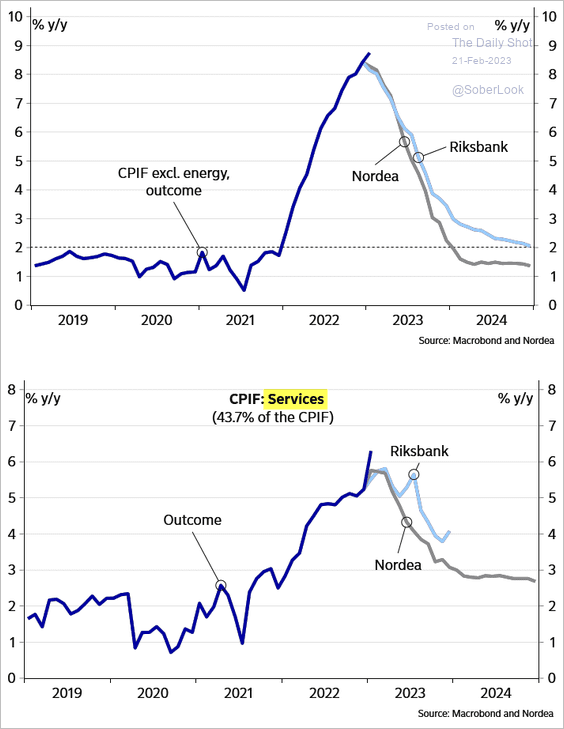 Source: Nordea Markets
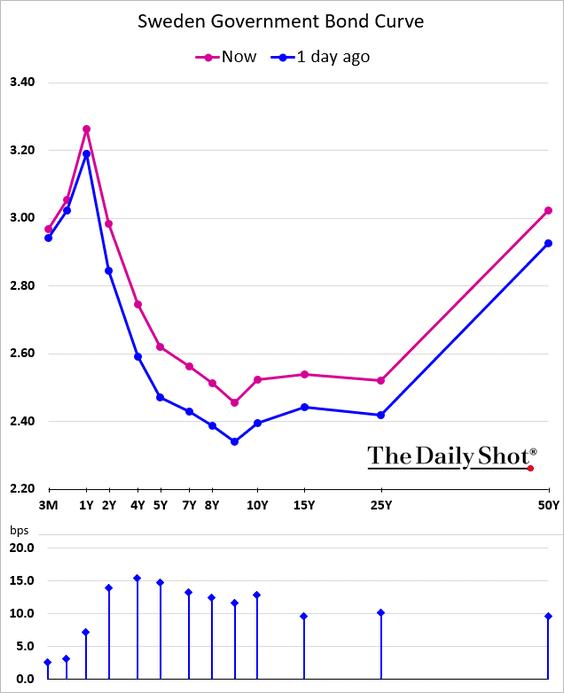
• The 2-year yield is above 3% for the first time since 2008.
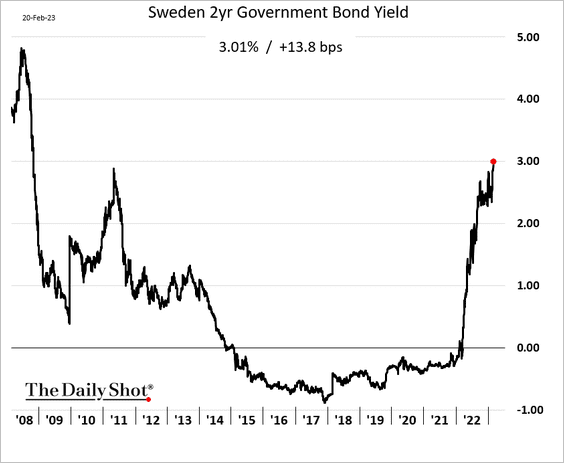
Here is the yield curve.
——————–
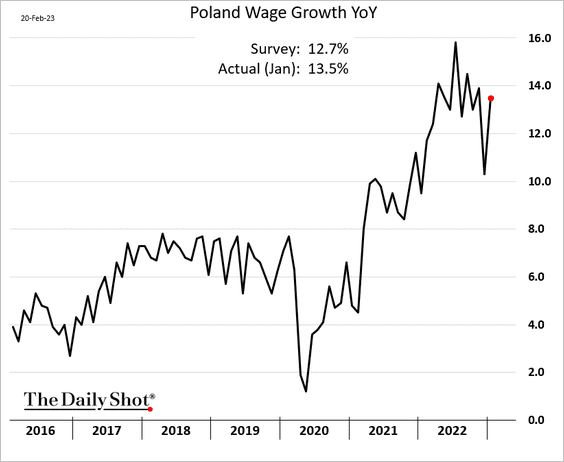
2. Poland’s January industrial production was disappointing.
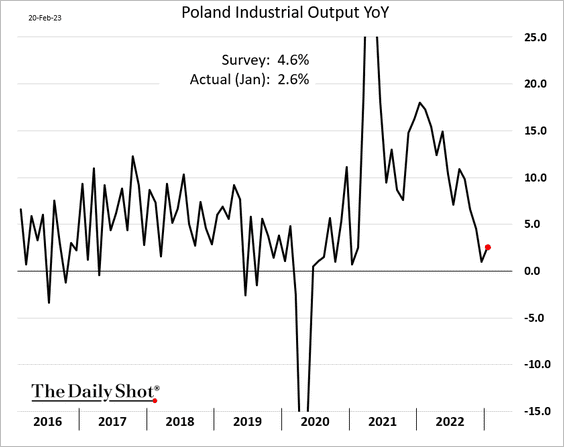
But wage growth topped expectations.
——————–
3. This map shows the regional GDP per capita in the EU.
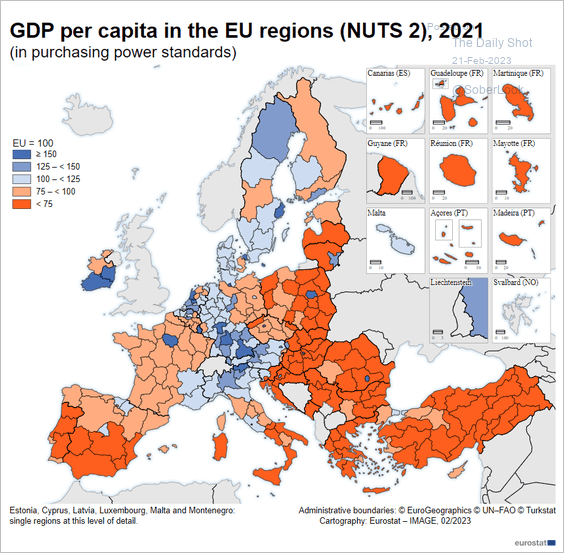 Source: Eurostat Read full article
Back to Index
Japan
1. Manufacturing and services activity (PMI) indicators have diverged.
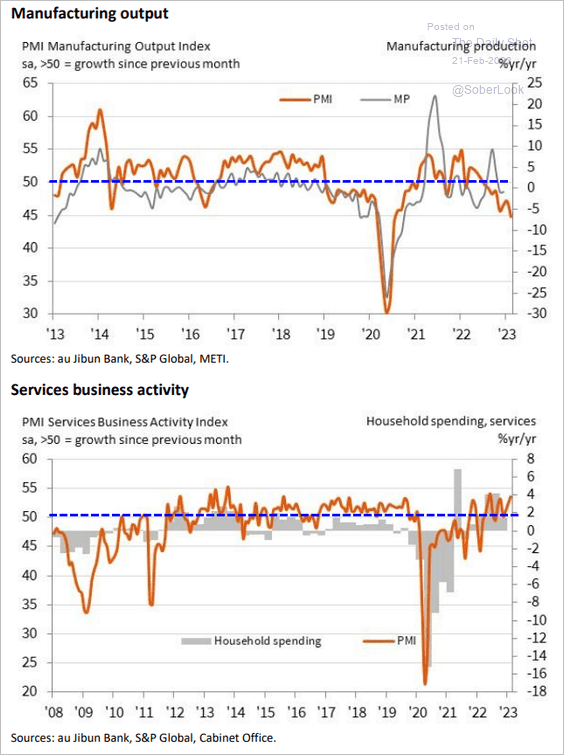 Source: S&P Global PMI
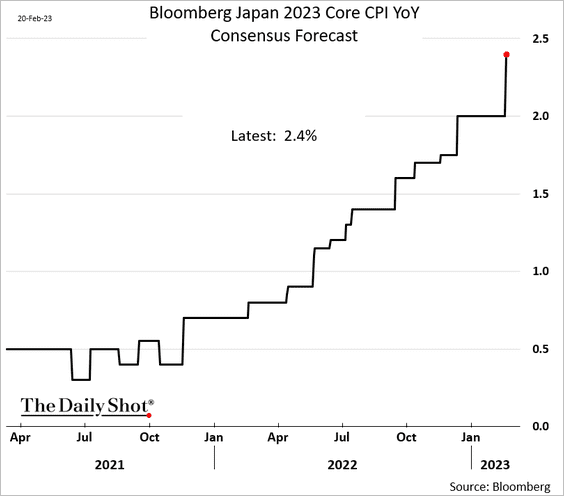
2. Bloomberg’s survey shows economists boosting their core CPI forecasts for 2023.
3. Japan-focused funds are seeing some outflows.
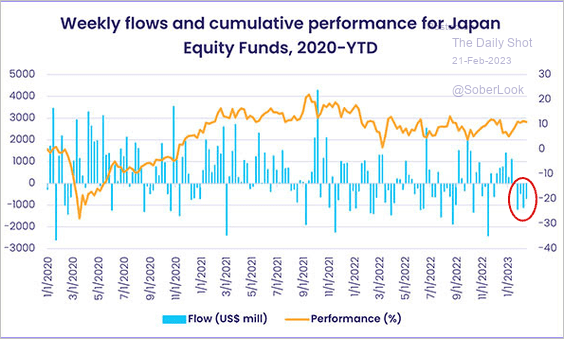 Source: EPFR
Back to Index
Asia-Pacific
1. South Korea’s consumer confidence remains in the doldrums.

2. Taiwan’s January export orders topped expectations.

 Source: Reuters Read full article
——————–
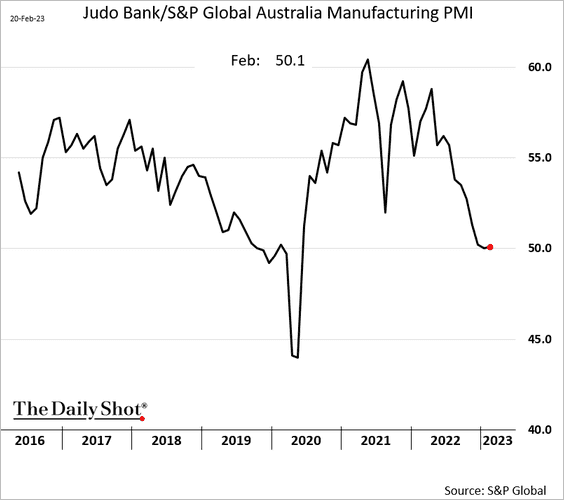
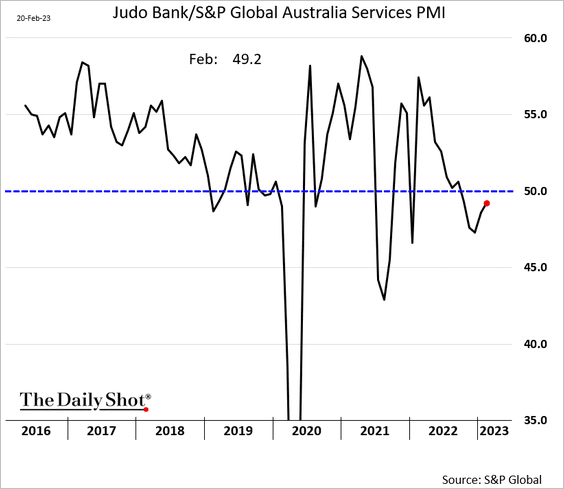
3. S&P Global’s PMI report showed improvement in Australia’s business activity this month.
• Manufacturing (modest growth):
• Services (slower contraction):
Back to Index
China
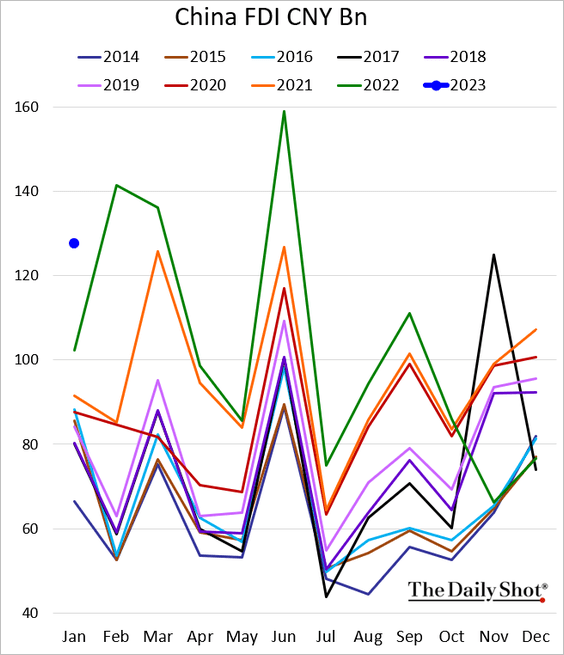
1. Foreign direct investment was very strong in January.
2. There is a lot of local government debt maturing this year.
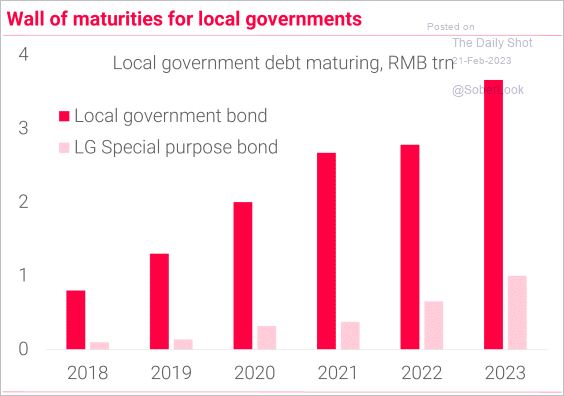 Source: TS Lombard
3. The World Economics SMI report shows a rebound in business activity this month.
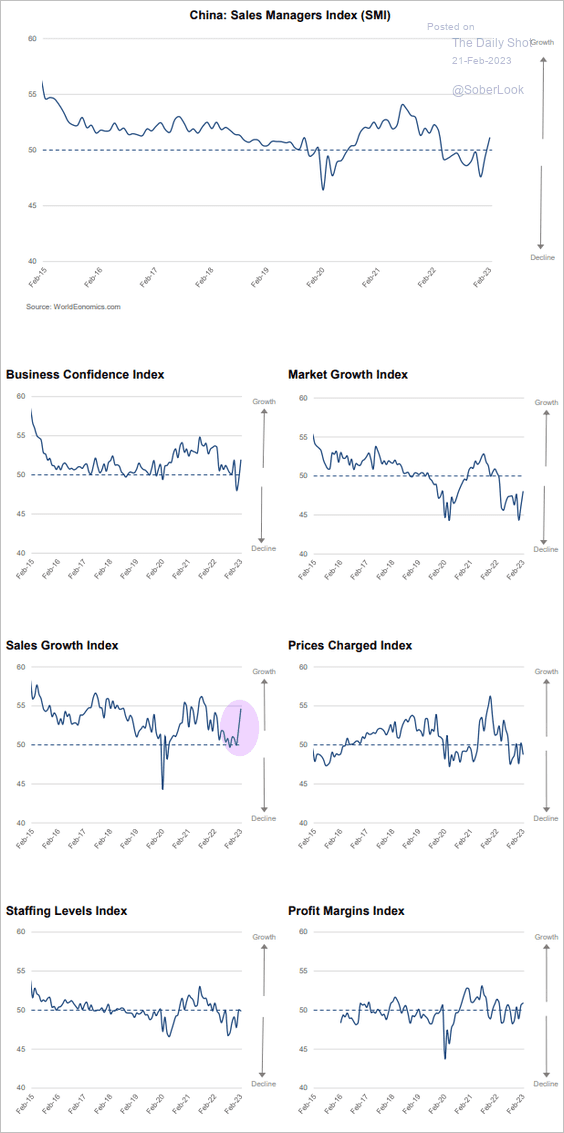 Source: World Economics
4. Road congestion surged as the country reopened.
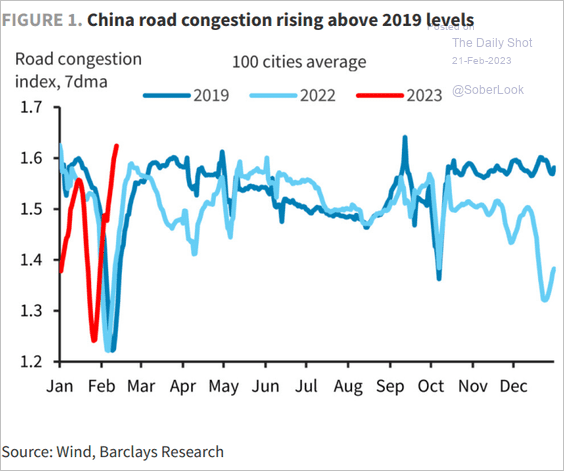 Source: Barclays Research
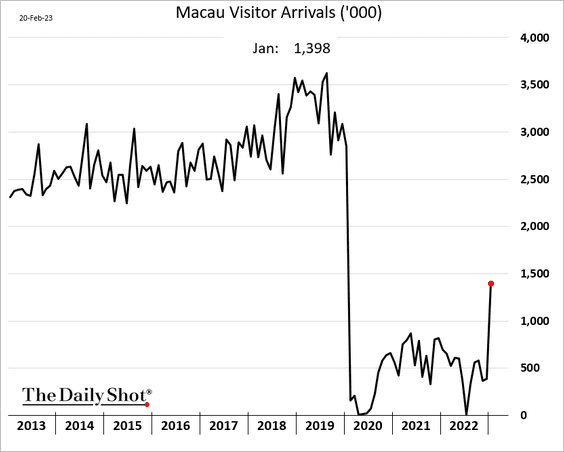
5. Macau visitor arrivals are finally recovering.
6. China’s CSI 300 stock market benchmark is at support.
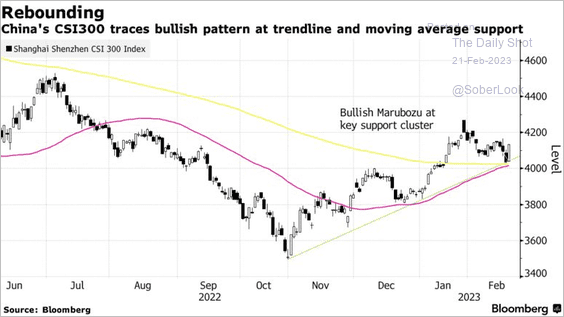 Source: @SashaAndo, @markets Read full article
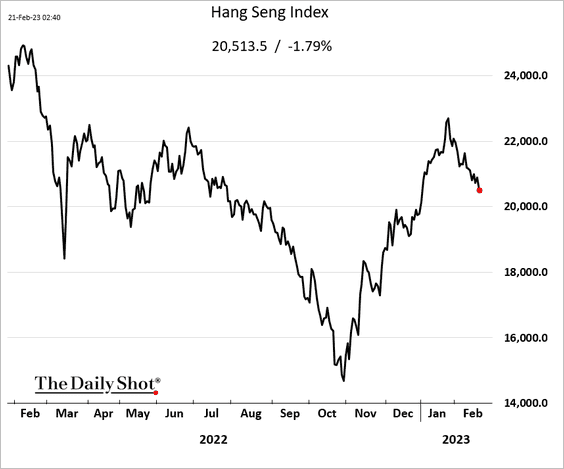
Hong Kong stocks are rolling over.
Back to Index
Emerging Markets
1. Macrobond’s India GDP nowcast model points to a growth slowdown.
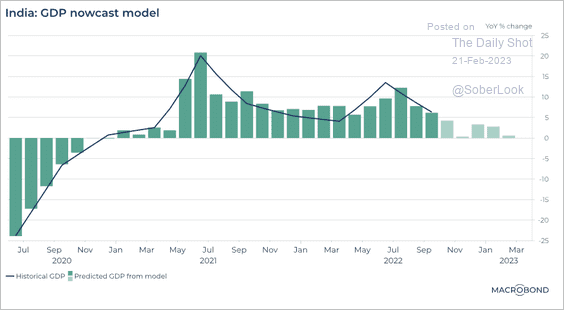 Source: @MacrobondF
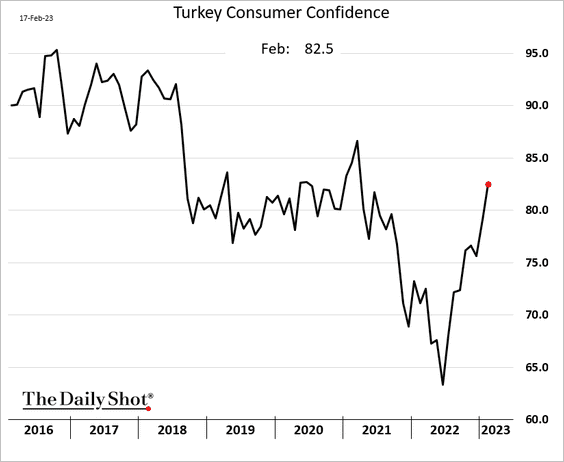
2. Turkey’s consumer confidence is rebounding sharply (similar to the Eurozone).
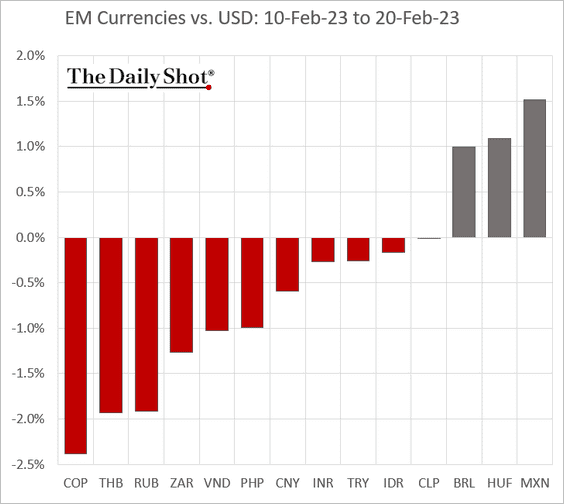
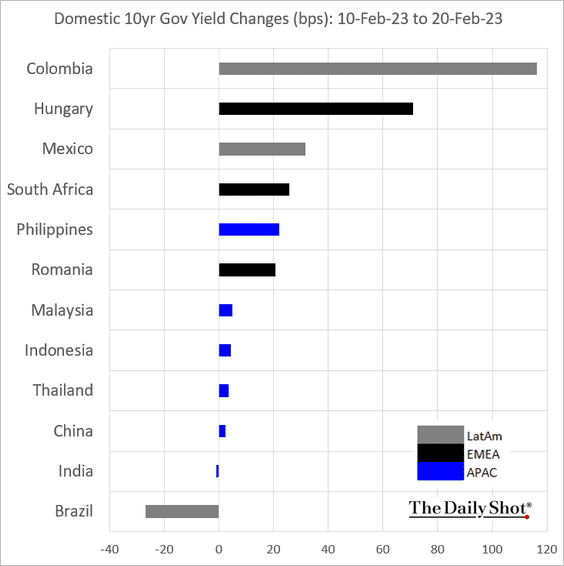
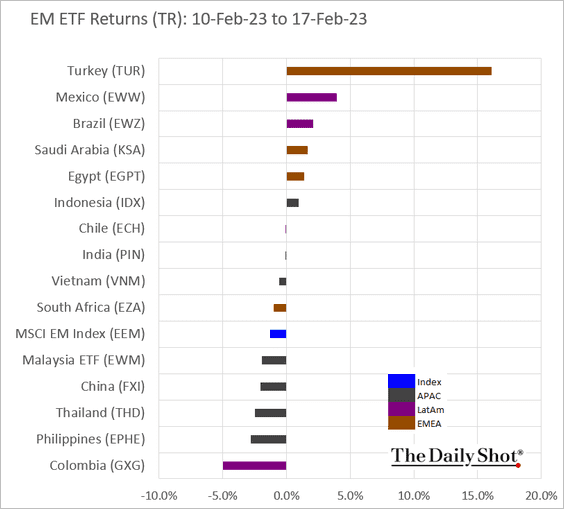
3. Below are some performance updates since February 10th.
• Currencies:
• Bond yields:
• Equity ETFs:
Back to Index
Cryptocurrency
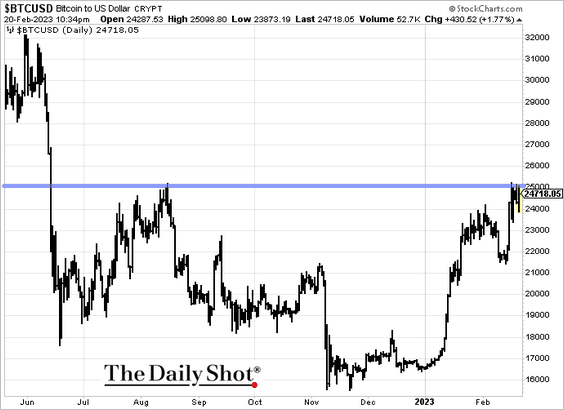
1. Bitcoin is holding resistance at 25k.
2. Last week, crypto funds saw the largest outflows since December 2022.
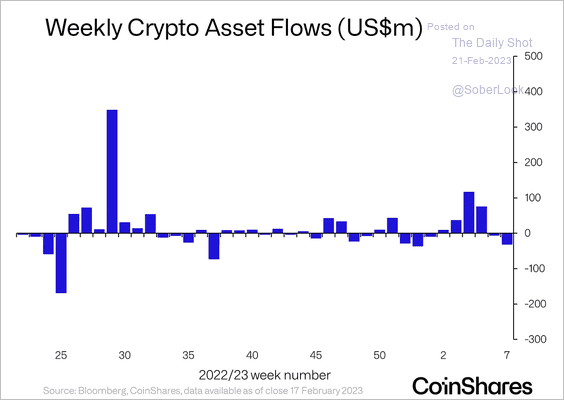 Source: CoinShares Read full article
Long-bitcoin funds accounted for most outflows last week, while investors rotated to short-bitcoin funds.
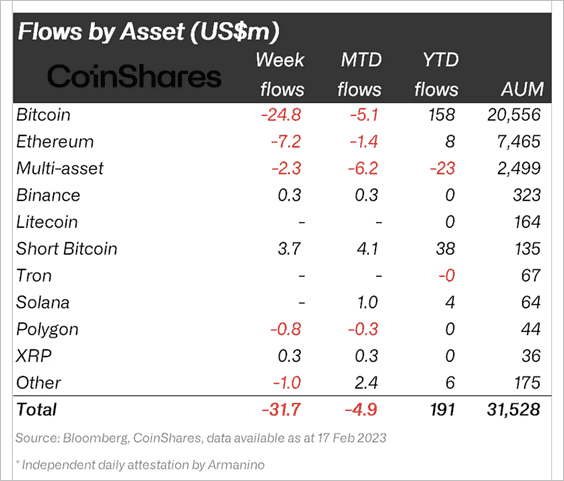 Source: CoinShares Read full article
——————–
3. Short-term bitcoin holders are not heavy sellers to exchanges just yet (possibly keeping tokens in storage/wallets). In contrast, offloading tokens for sale on exchanges could signal capitulation.
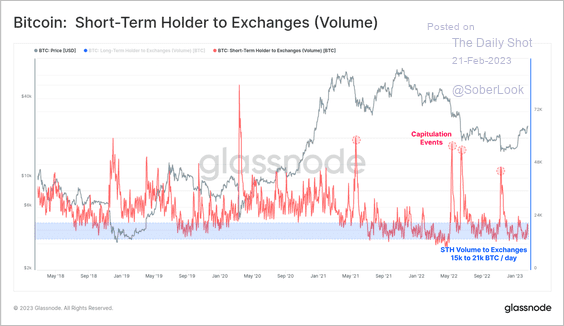 Source: Glassnode Read full article
Back to Index
Commodities
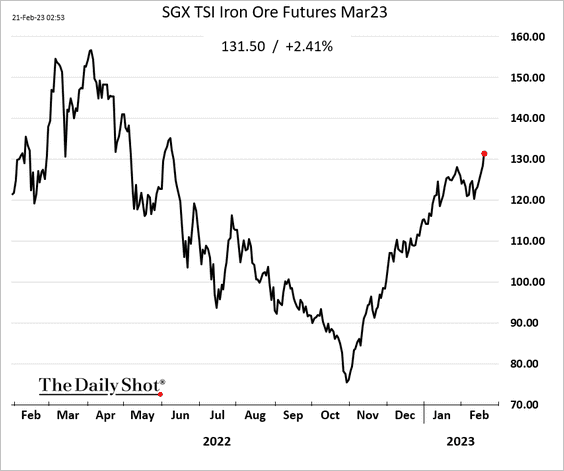
1. Iron ore continues to surge on China reopening.
2. Technicals suggest gold is overbought, especially as bullish sentiment appears stretched. (2 charts)
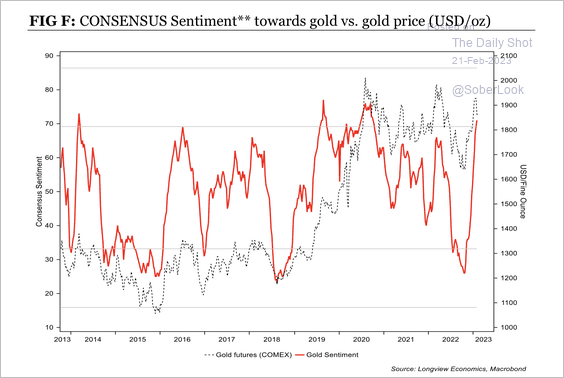 Source: Longview Economics
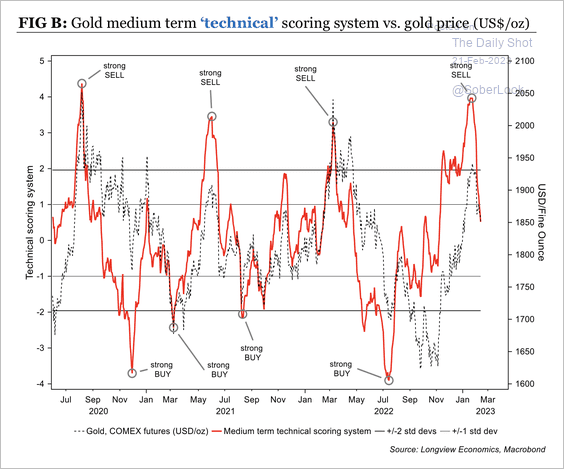 Source: Longview Economics
——————–
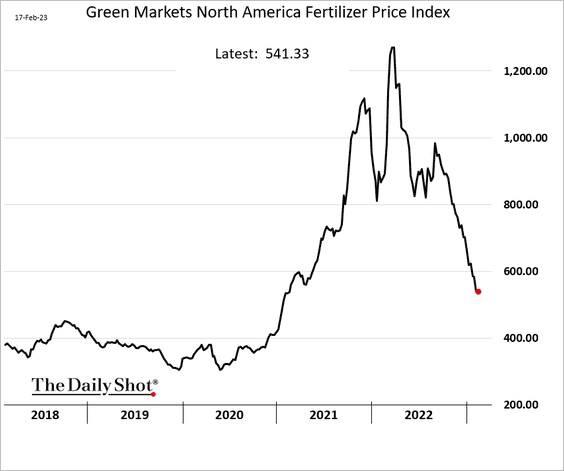
3. Fertilizer prices are down massively from the 2022 peak.
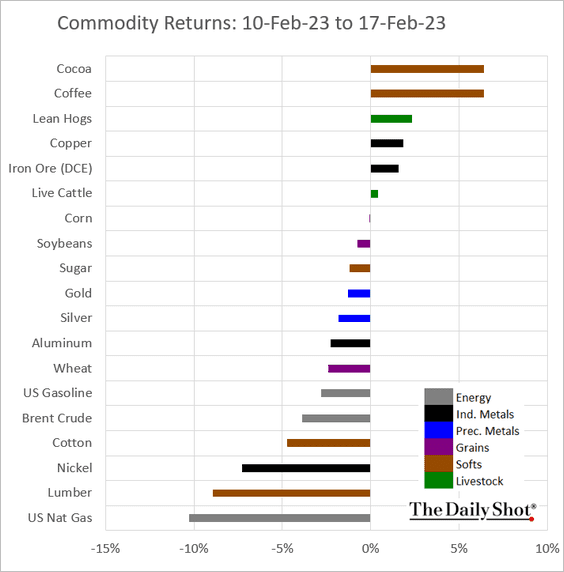
4. Finally, we have last week’s performance across key commodity markets.
Back to Index
Energy
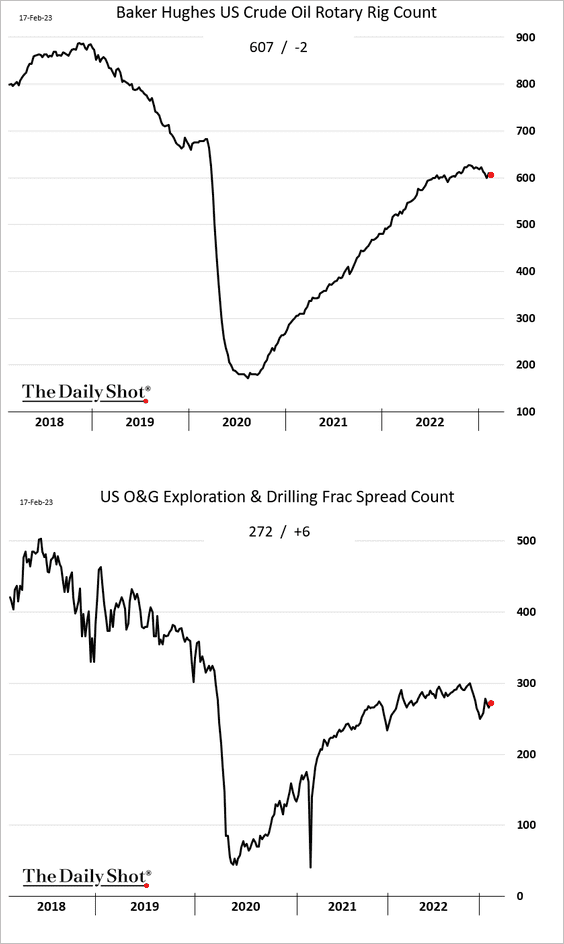
1. Growth in US drilling activity has stalled.
2. CTAs have been increasingly bearish on oil.
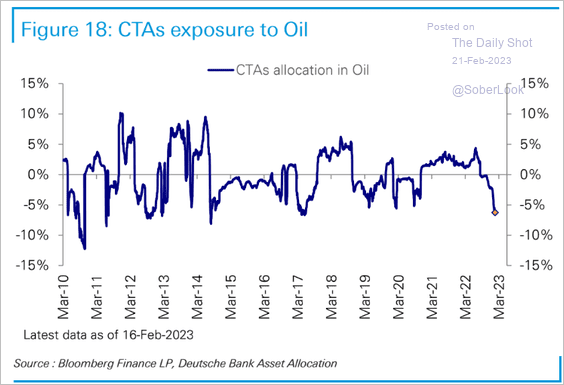 Source: Deutsche Bank Research
3. EU distillates inventories are tight.
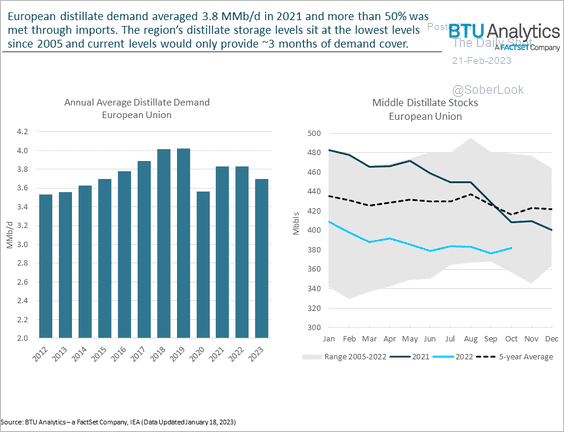 Source: @FactSet Read full article
Back to Index
Equities
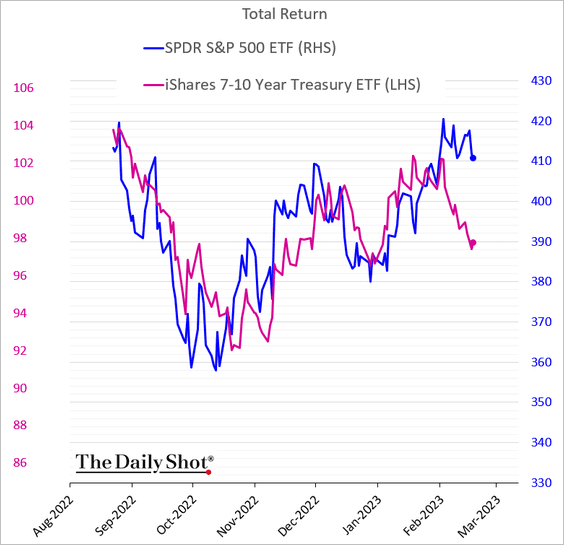
1. Is the decoupling of stocks and bonds sustainable?
2. There is a lot of uncertainty about the stock market trajectory this year.
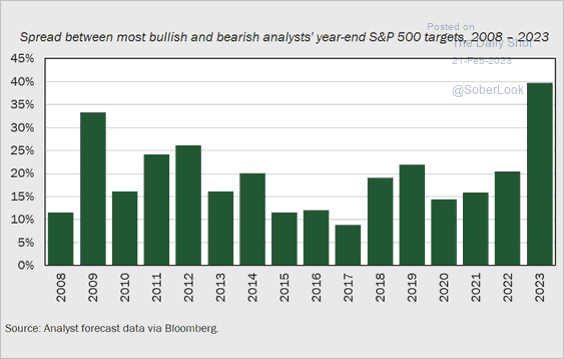 Source: @HendersonRowe; h/t @TopdownCharts
3. A rising unemployment rate off the lows typically signals the final leg of risk-asset drawdowns in recessions, according to Variant Perception.
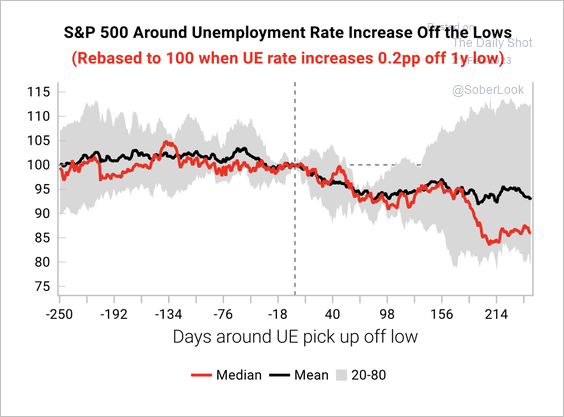 Source: Variant Perception
4. Profit margins have been at historic highs in the pandemic era.
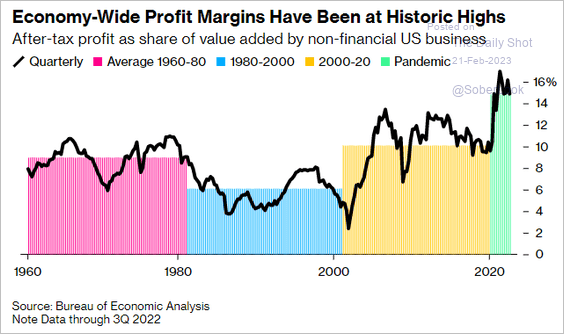 Source: @katiadmi, @business Read full article
5. CTAs have been boosting their equity exposure.
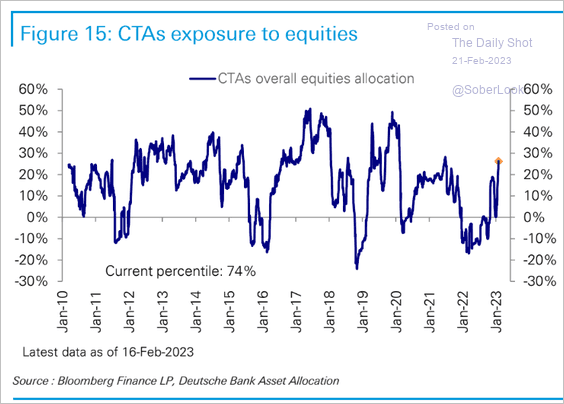 Source: Deutsche Bank Research
6. The latest market rally occurred with strong breadth and underlying volume. Previous advances signaled further gains in the months ahead, according to SentimenTrader.
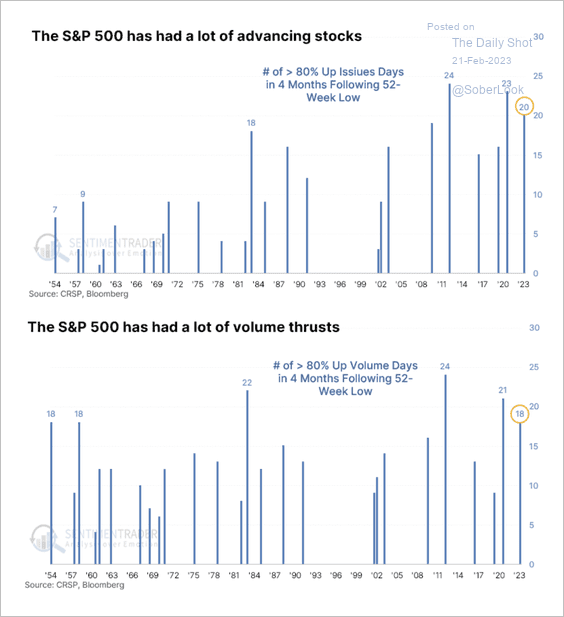 Source: @sentimentrader
7. Bullish sentiment appears stretched.
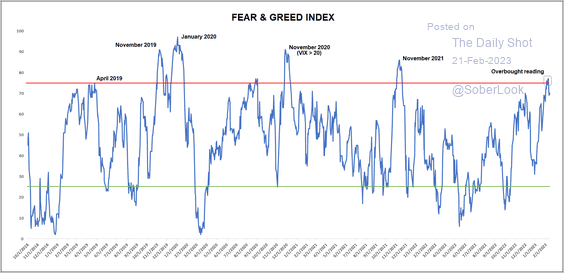 Source: @StocktonKatie
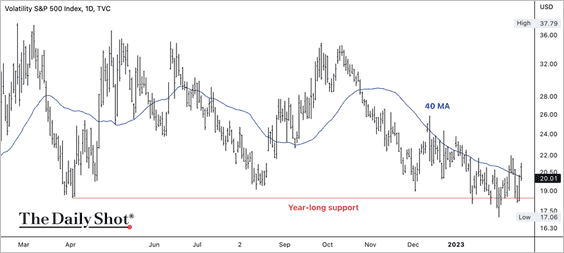
8. VIX is holding support above 18.50 (and broke above its 40-week moving average).
9. There has been quite a bit of interest in VIX call options (used as a hedge against market declines).
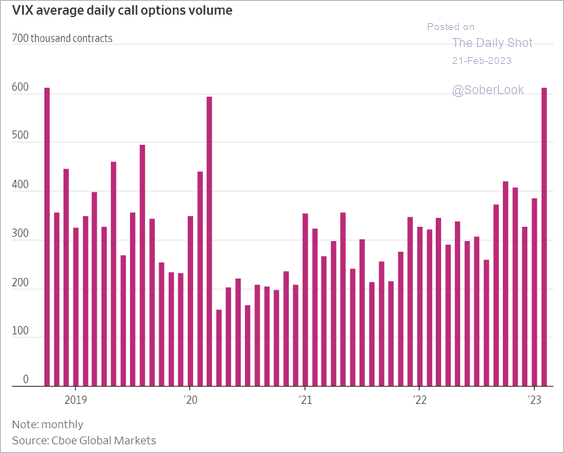 Source: @WSJ Read full article
10. Mid-cap stocks have been outperforming small and large-cap stocks.
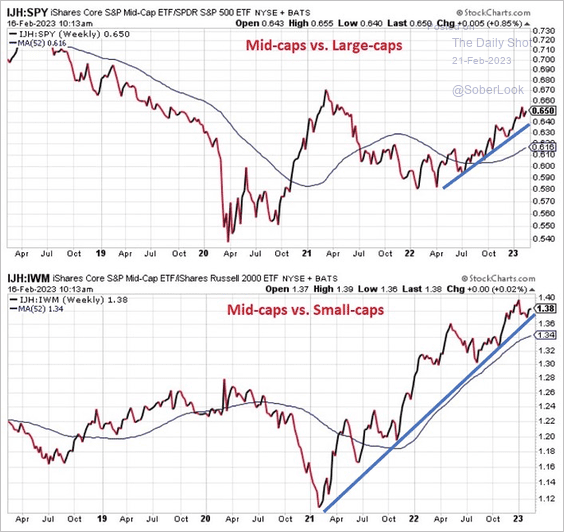 Source: @jaykaeppel
11. Next, we have some performance data from last week.
• Sectors:

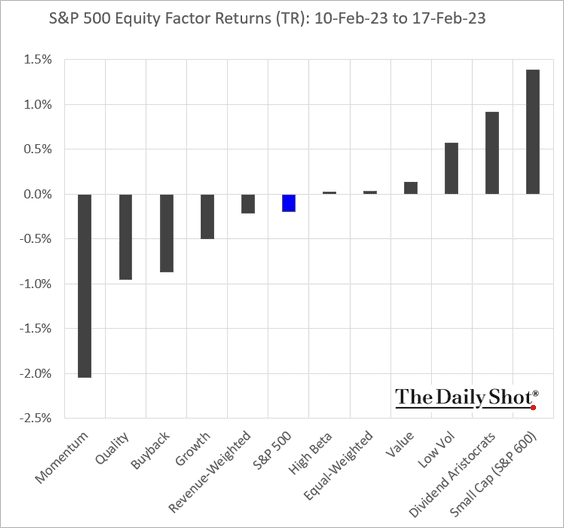
• Equity factors:
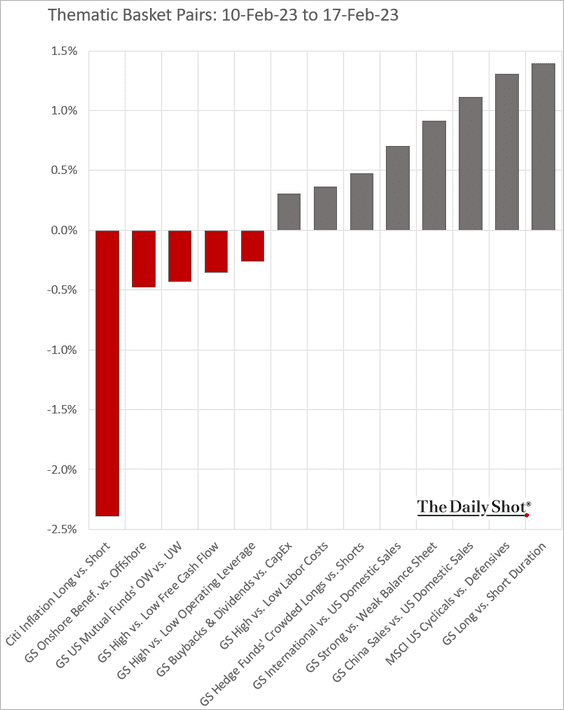
• Macro basket pairs’ relative performance:
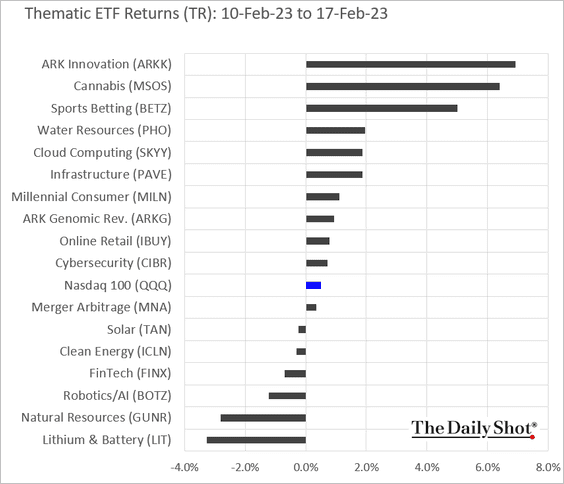
• Thematic ETFs:
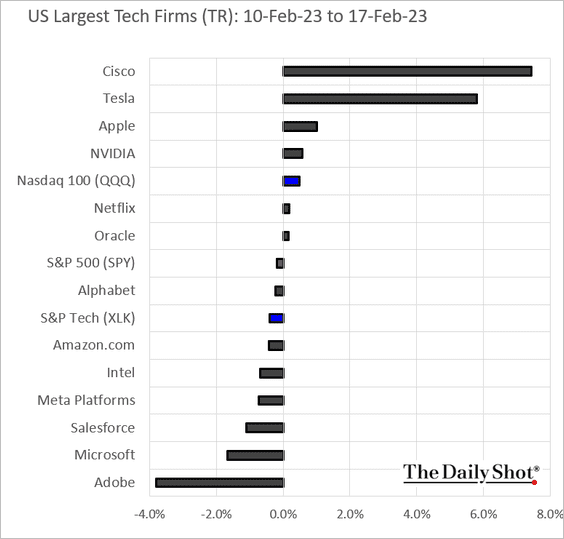
• Largest US tech stocks:
Back to Index
Credit
1. CCC-rated bonds have been leading the rally in credit.
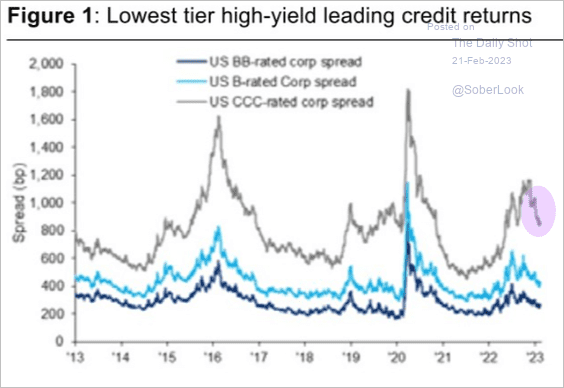 Source: Citi Private Bank
2. Global high-yield bond spreads are too tight.
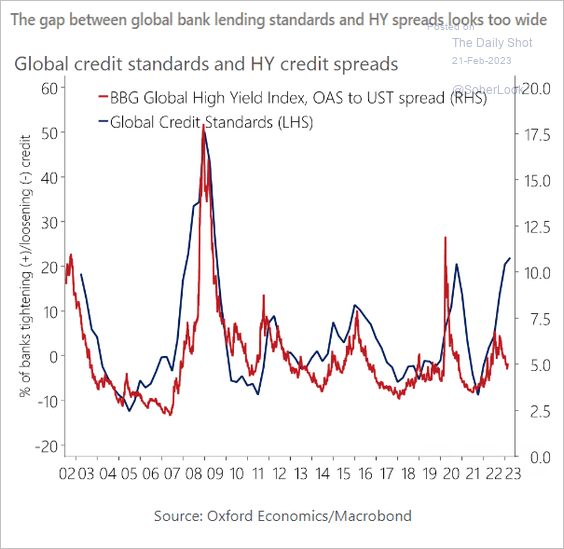 Source: Oxford Economics
3. Leveraged loan funds continue to see outflows. Inflation-linked Treasury funds are also losing capital.
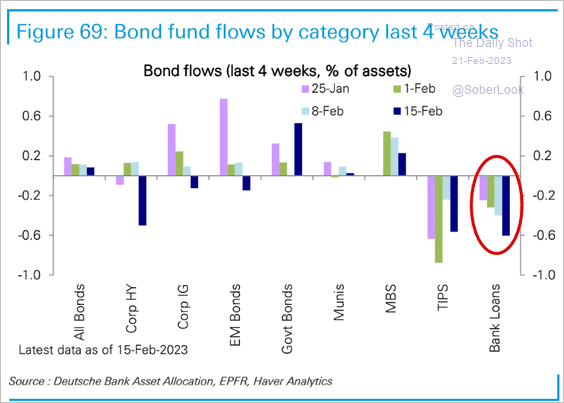 Source: Deutsche Bank Research
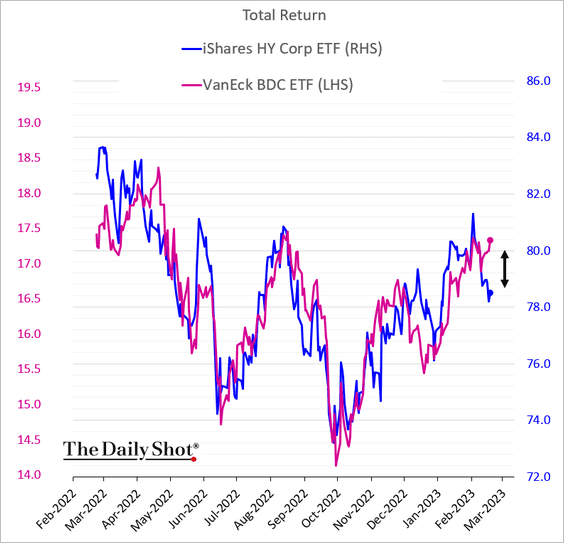
4. Divergence episodes between BDCs and HY bonds generally don’t last long.
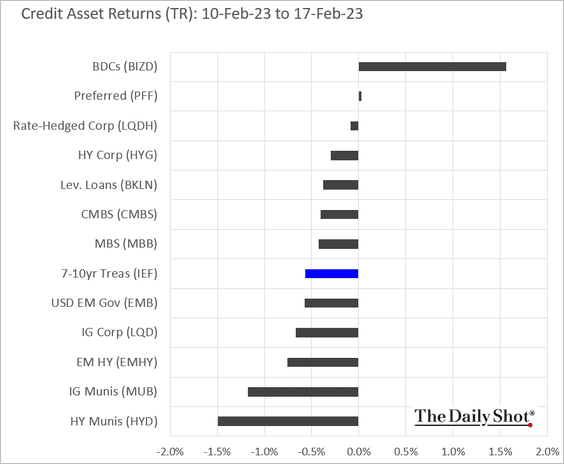
5. This chart shows last week’s performance by asset class.
Back to Index
Rates
1. As #3 in the credit section (above) shows, inflation-linked Treasury (TIPS) funds continue to see substantial outflows.

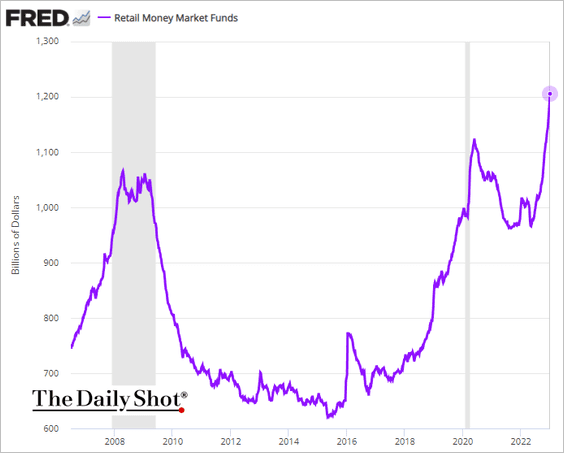
2. Retail money market fund balances have been surging as yields improve, creating competition for banks.
3. Eurodollar 23/24 spreads point to widespread expectations of Fed rate cuts next year.
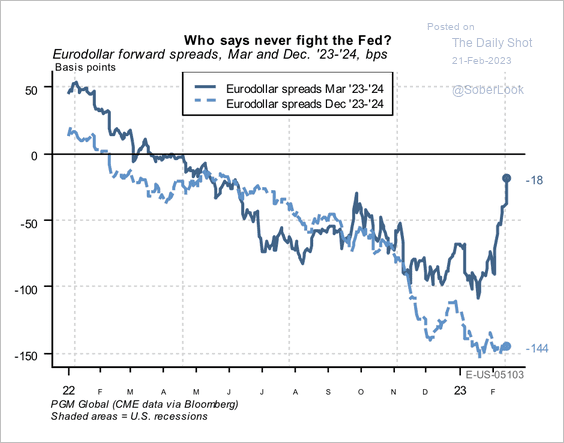 Source: PGM Global
4. Variant Perception’s “Fed easing” probability indicator is rising, although not quite signaling a reversal in yields.
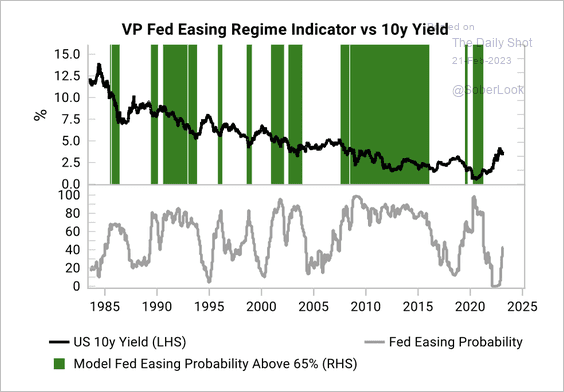 Source: Variant Perception
Back to Index
Global Developments
1. Will improving global liquidity pressure the US dollar?
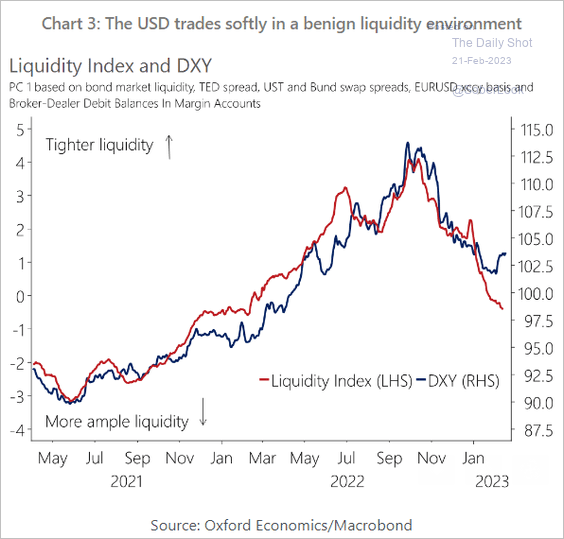 Source: Oxford Economics
• Bloomberg’s US dollar index is at resistance.
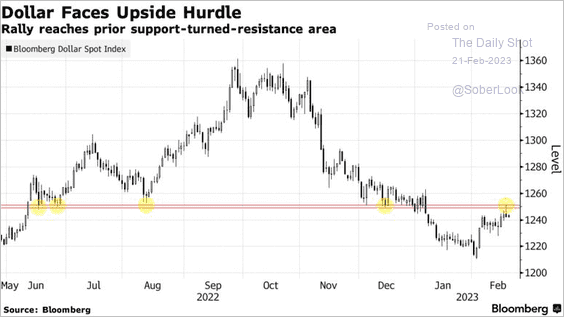 Source: @SriniSivabalan, @markets Read full article
——————–
2. Global air traffic is at multi-year highs for this time of the year.
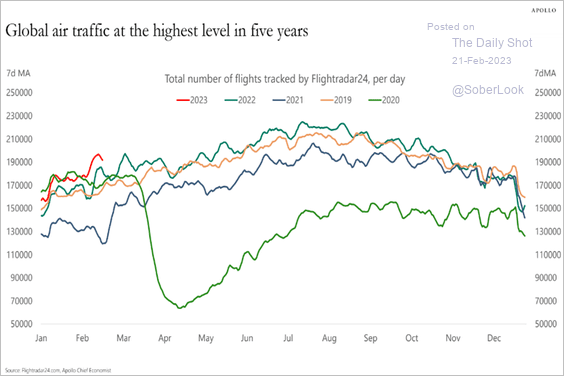 Source: Torsten Slok, Apollo
3. Will a breakout in sovereign bond yields trigger another risk-off phase?
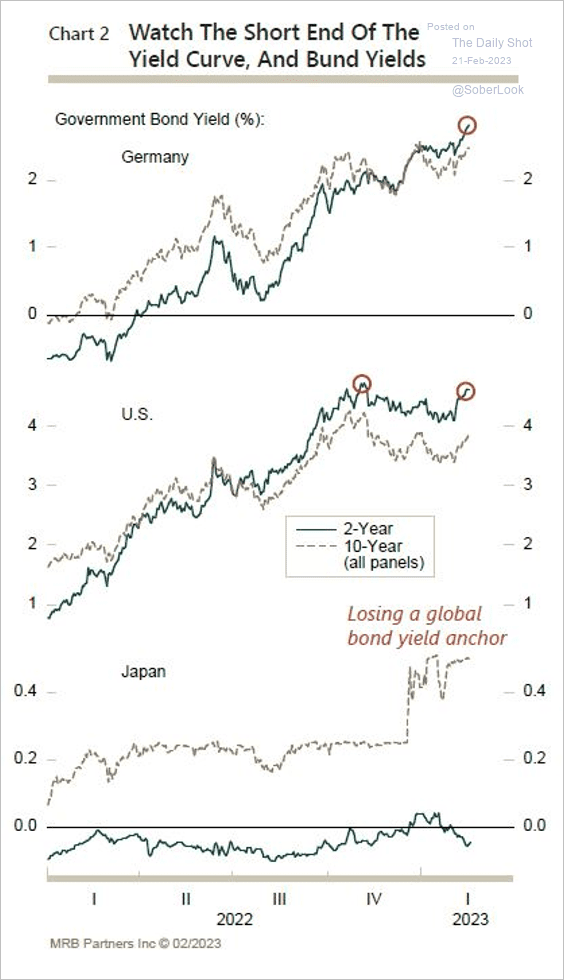 Source: MRB Partners
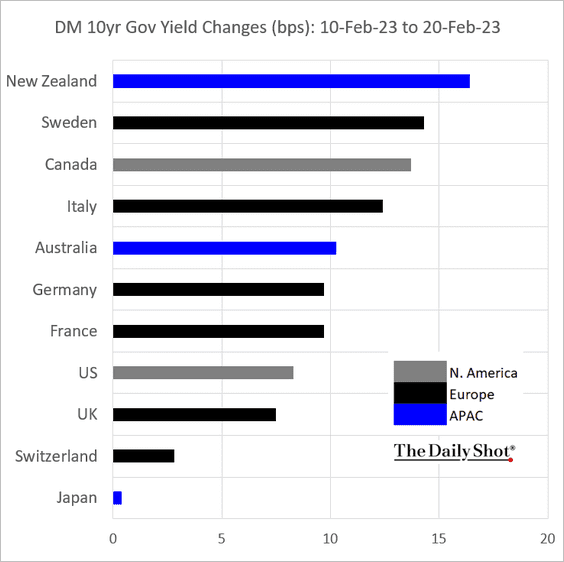
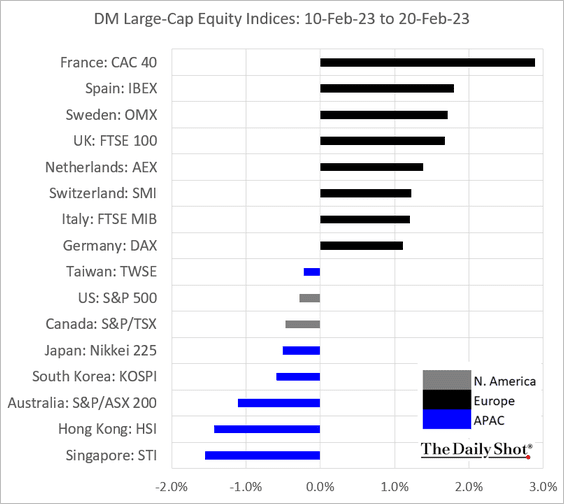
4. Next, we have some performance data since February 10th.
• Bond yields:
• Trade-weighted currency indices:
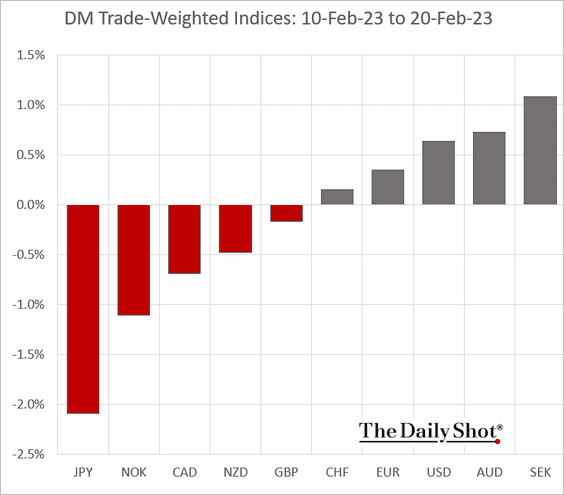
• Large-cap equity indices:
——————–
Food for Thought
1. Orange production in the US:
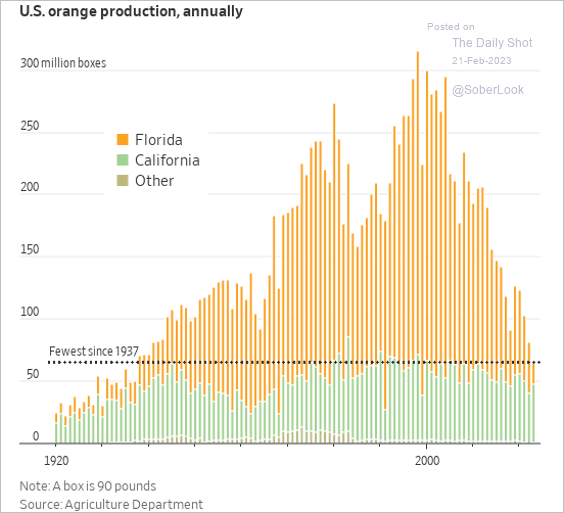 Source: @WSJ Read full article
2. Credit card delinquency rates by age:
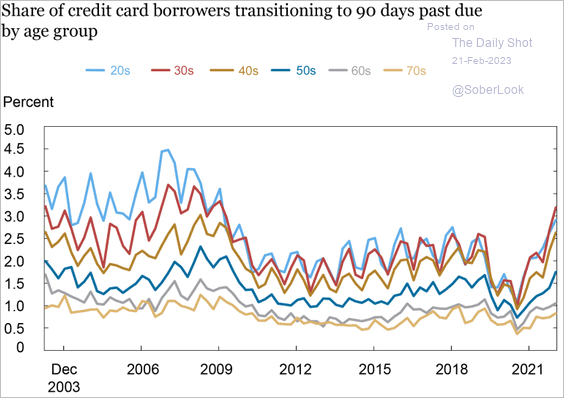 Source: Federal Reserve Bank of New York
3. Payments by banked vs. unbanked consumers:
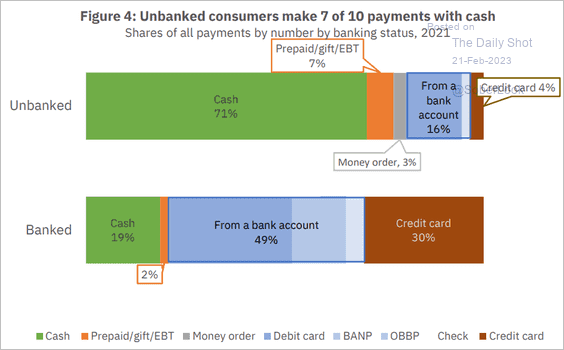 Source: @AtlantaFed Read full article
4. The shift in US drivers’ demographics:
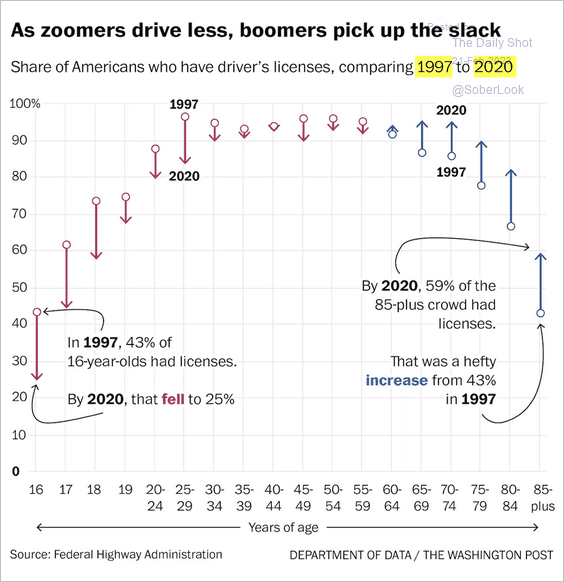 Source: @byHeatherLong, @andrewvandam Read full article
5. US adult population growth by age:
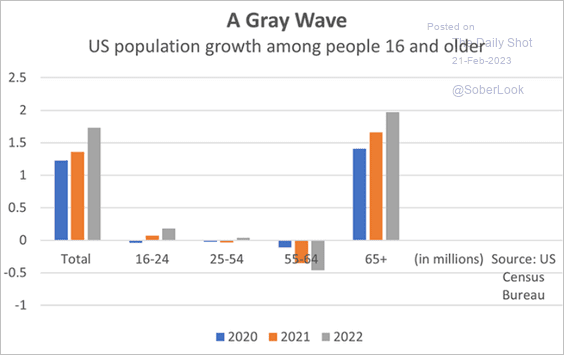 Source: @AtlantaFed Read full article
6. Prescription medications:
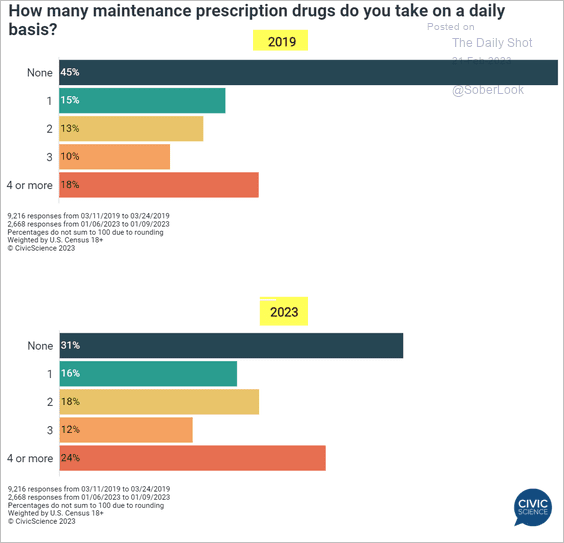 Source: @CivicScience
7. Best-selling albums of all times:
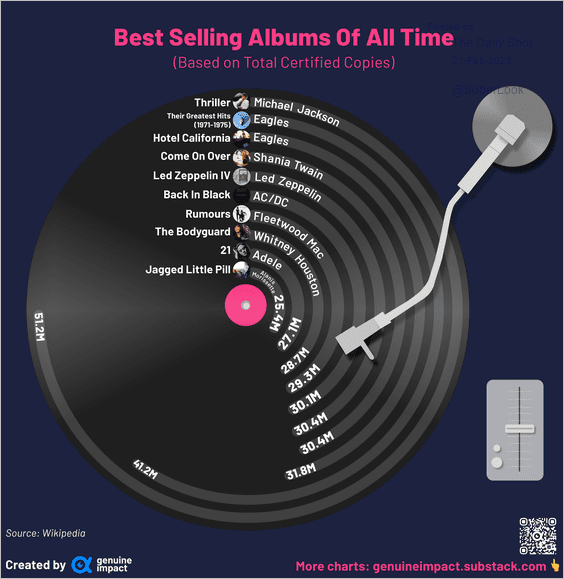 Source: @genuine_impact
——————–
Back to Index