
The Daily Shot: 23-Feb-23
• The United States
• The Eurozone
• Europe
• Asia – Pacific
• China
• Emerging Markets
• Cryptocurrency
• Energy
• Equities
• Alternatives
• Credit
• Rates
• Global Developments
• Food for Thought
The United States
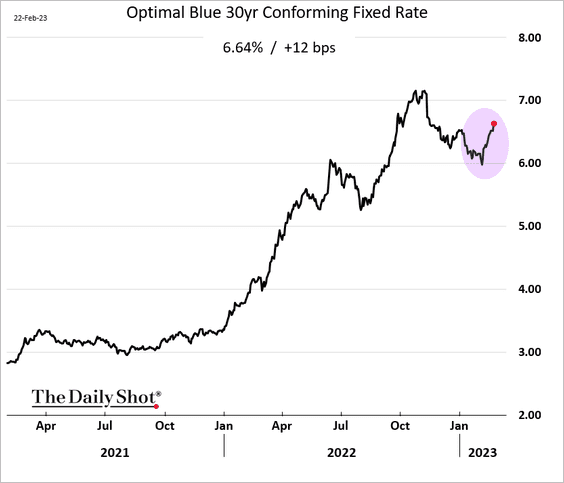
1. Mortgage applications continued to sink last week, …
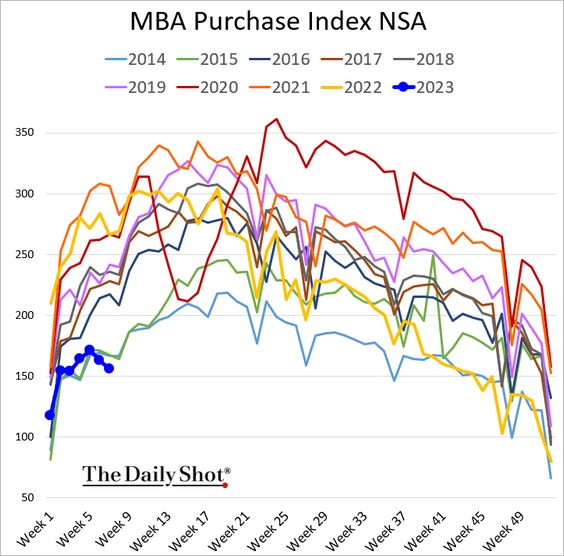
… as mortgage rates climb back toward 7%.
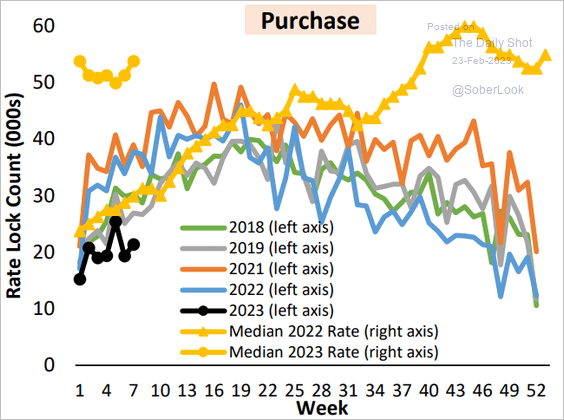
Rate locks were also at multi-year lows.
 Source: AEI Housing Center
——————–
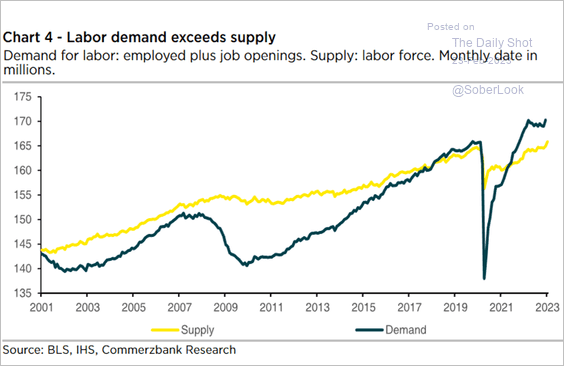
2. Next, we have some updates on the labor market.
• Labor demand still exceeds supply.
 Source: Commerzbank Research
• The declining quits rate points to a slowdown in wage growth.
 Source: Alpine Macro
• Job openings are falling, which should soon be reflected in the official JOLTS figures.
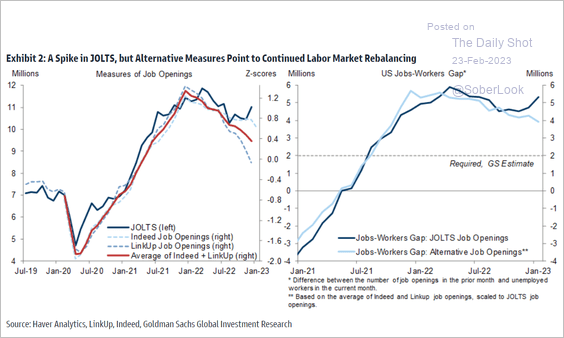 Source: Goldman Sachs
• Most US unemployed are still finding work quickly, …
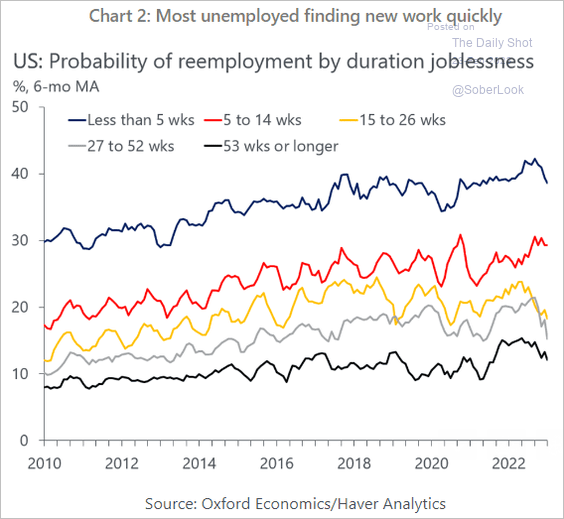 Source: Oxford Economics
… especially tech workers.
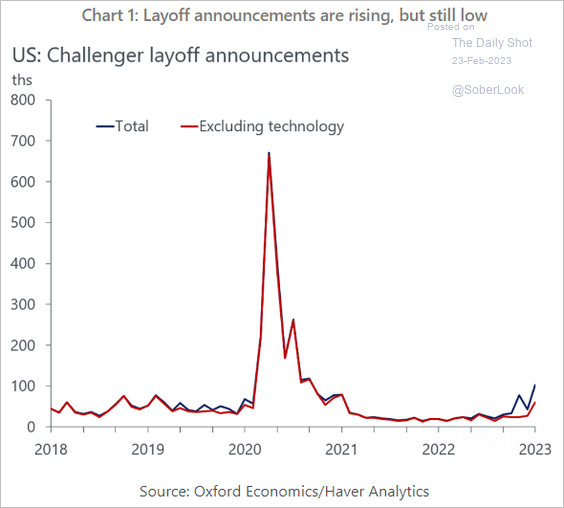 Source: Oxford Economics
• The employment change for workers without a college degree remains below pre-COVID levels.
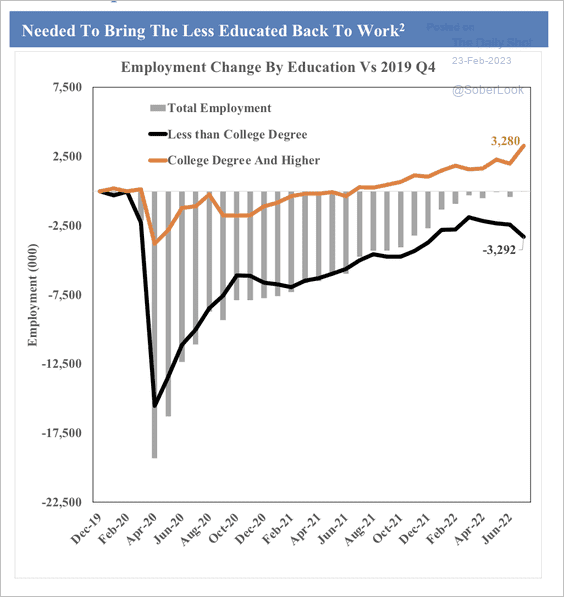 Source: SOM Macro Strategies
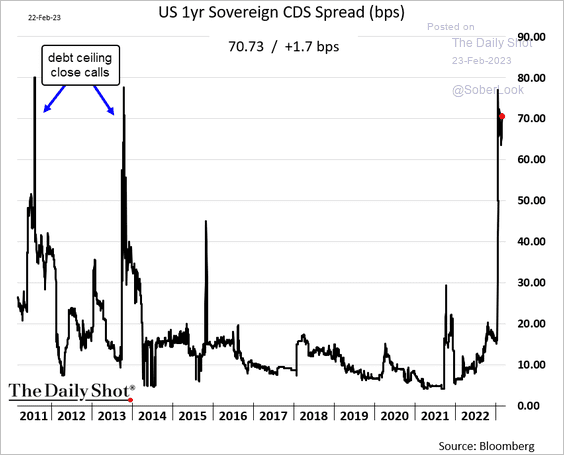
• Market jitters around US debt default risks persist as the x-date approaches. The Treasury is expected to run out of emergency funds in late summer. Here is the US one-year sovereign CDS spread.
How much will a US technical default impact the unemployment rate?
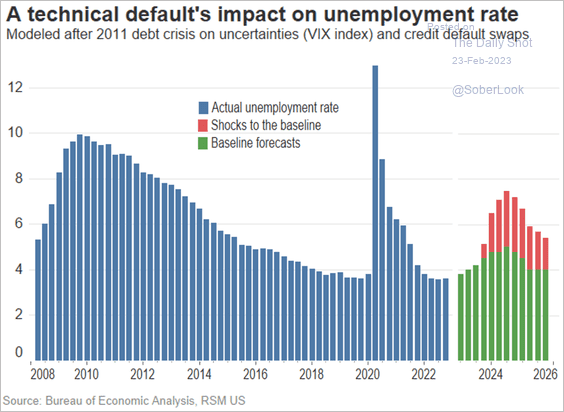 Source: RSM Read full article
——————–
3. Economists have been upgrading their GDP growth forecasts for 2023, …
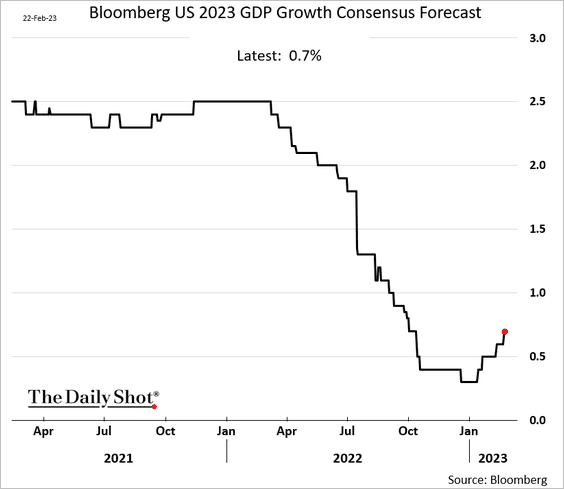
… especially the current quarter.
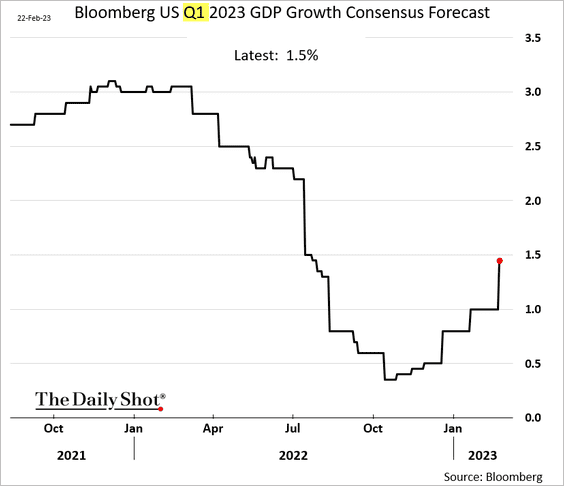
Here is Goldman’s GDP tracker.
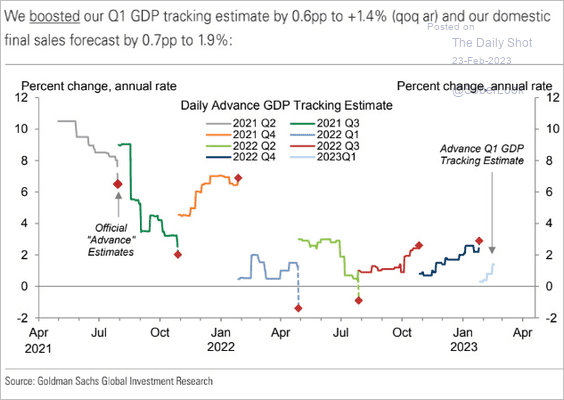 Source: Goldman Sachs; @MikeZaccardi
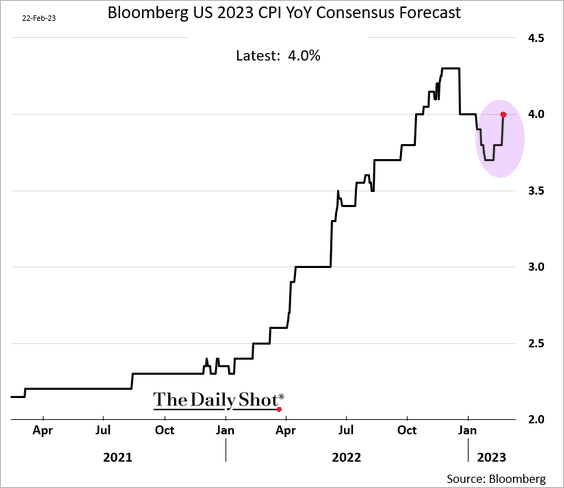
• Economists are also reversing their lowered projections for inflation in 2023.
——————–
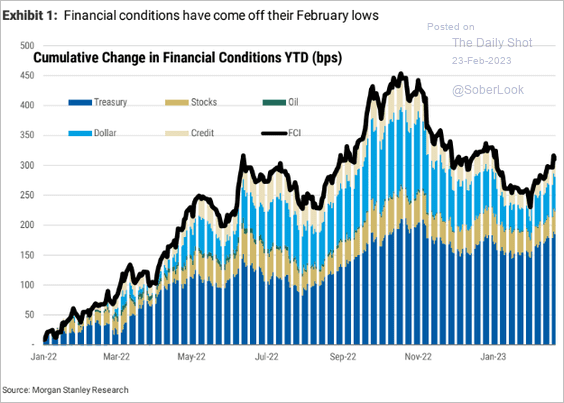
4. Financial conditions are tightening again, according to Morgan Stanley’s model.
 Source: Morgan Stanley Research
The market is coming to terms with “higher for longer.” The surge in US terminal rate was not followed by steeper rate cut expectations.
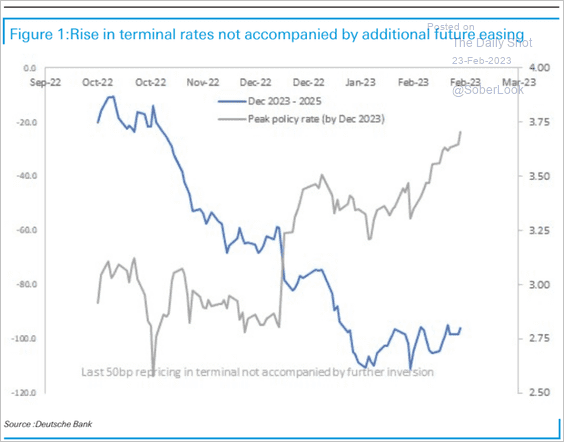 Source: Deutsche Bank Research
——————–
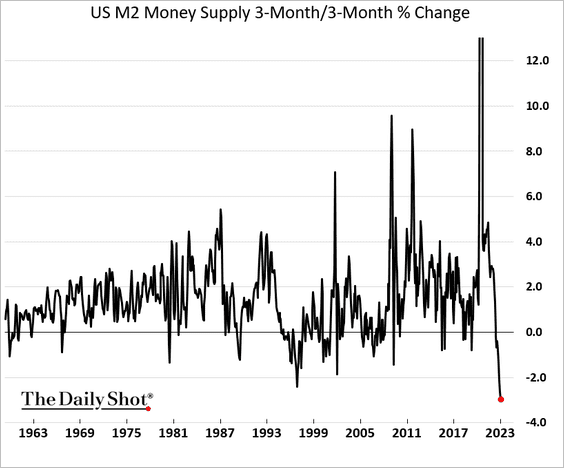
5. The recent decline in the money supply has been unprecedented.
Back to Index
The Eurozone
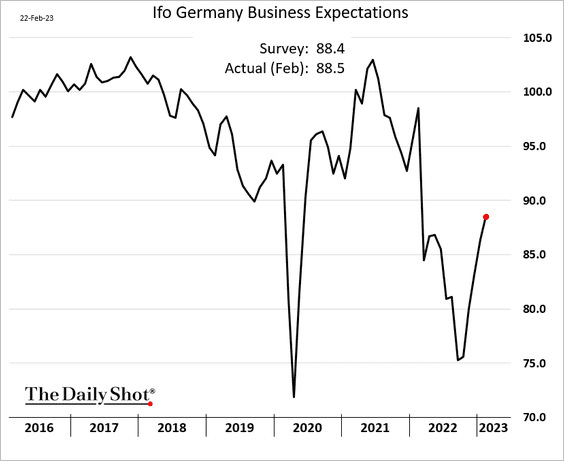
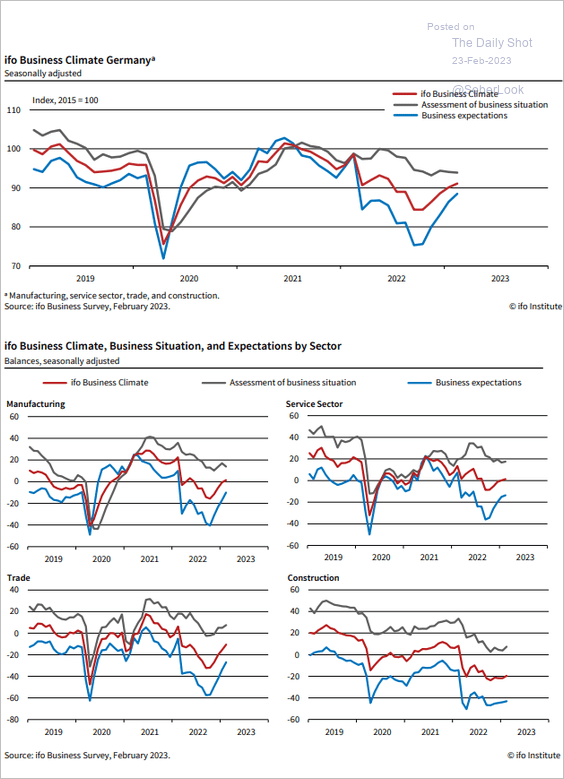
1. Germany’s Ifo expectations index continues to recover.
 Source: ifo Institute
——————–
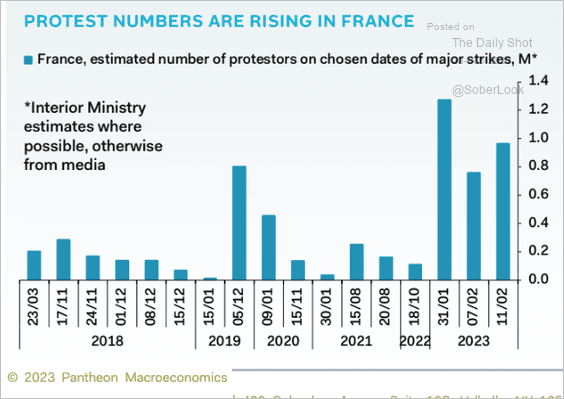
2. French business confidence is also turning higher.

Separately, France saw a lot of protests this year.
 Source: Pantheon Macroeconomics
——————–
3. ECB rate hike expectations have repriced sharply over the past month.
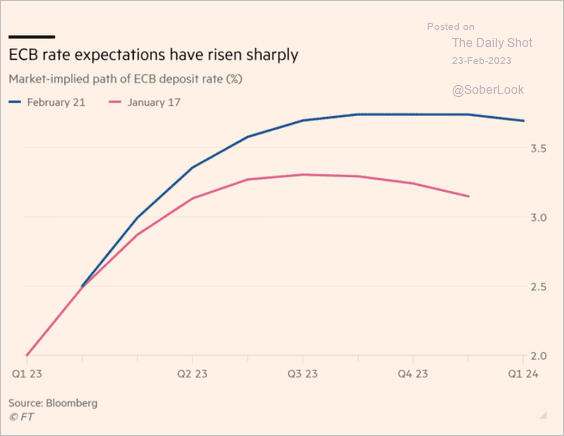 Source: @financialtimes Read full article
4. Here is how the ECB models the transmission mechanism of its monetary policy.
![]() Source: ECB Read full article
Source: ECB Read full article
5. This chart shows the 5-year inflation expectations distribution based on inflation options.
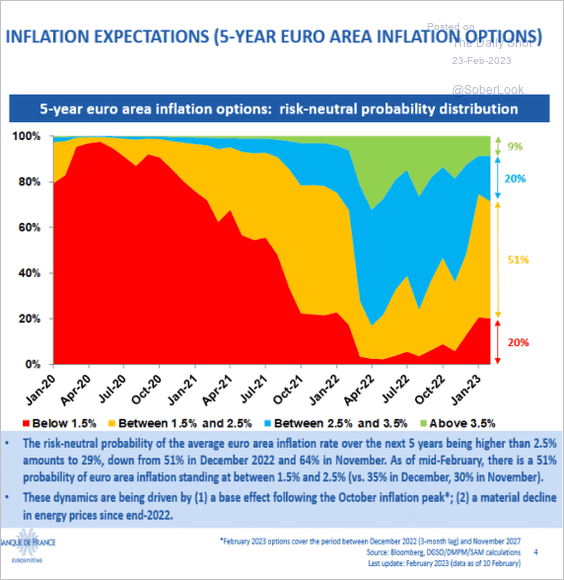 Source: La Banque de France
6. Labor force participation is well above the levels implied by demographics.
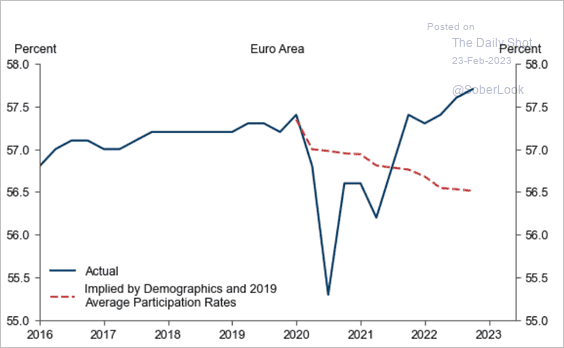 Source: Goldman Sachs
Back to Index
Europe
1. Here is the reduction in natural gas demand across the EU between August and January.
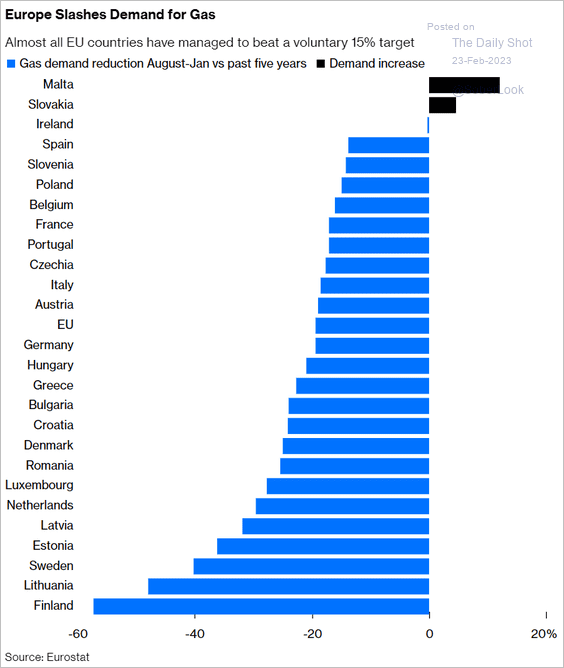 Source: @JLeeEnergy, @opinion Read full article
2. How has the median age changed across the EU over the past decade?
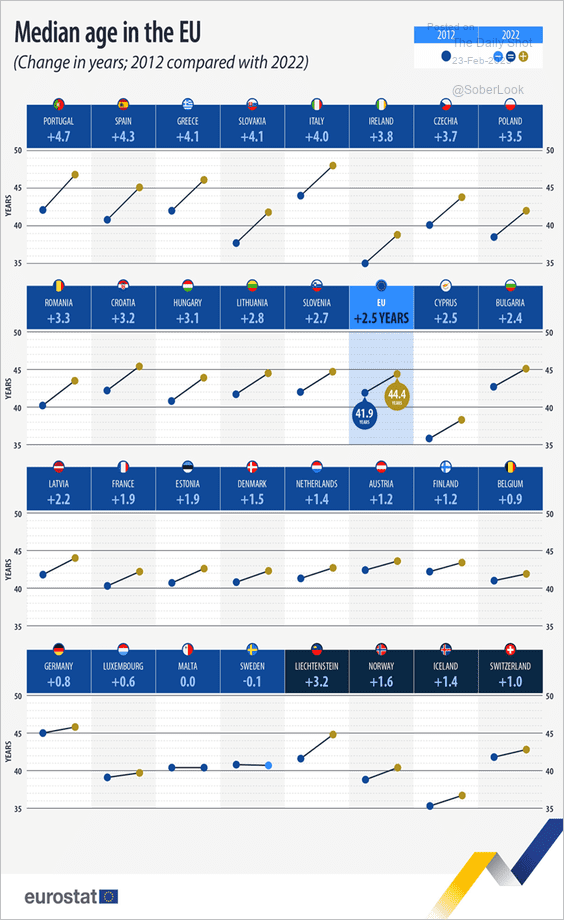 Source: @EU_Eurostat Read full article
Back to Index
Asia – Pacific
1. Economists expect the BoJ to tighten policy this year under new leadership.
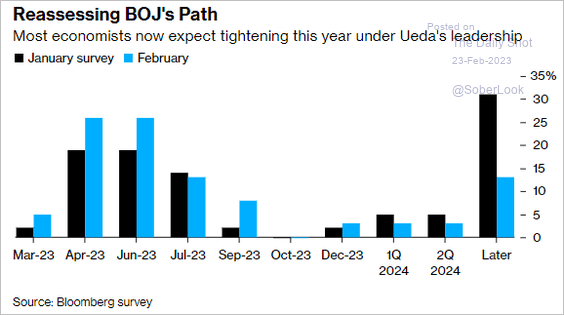 Source: @GregDaco, @economics Read full article
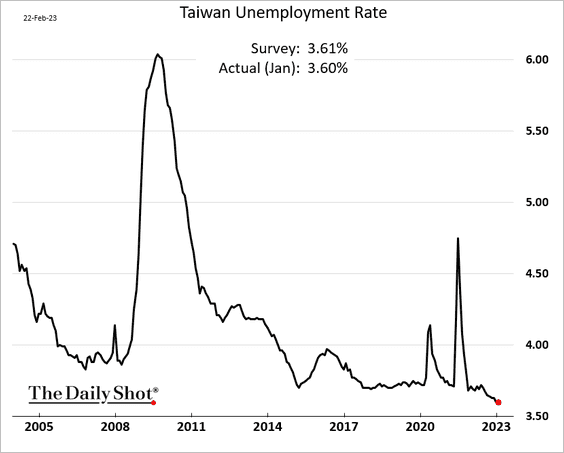
2. Taiwan’s unemployment rate is at multi-decade lows.
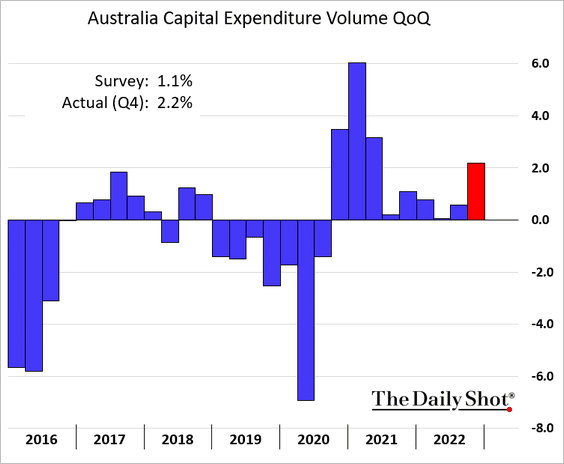
3. Australia’s business investment strengthened last quarter.
Back to Index
China
1. The bounce in property developer stocks and bonds is starting to fade.
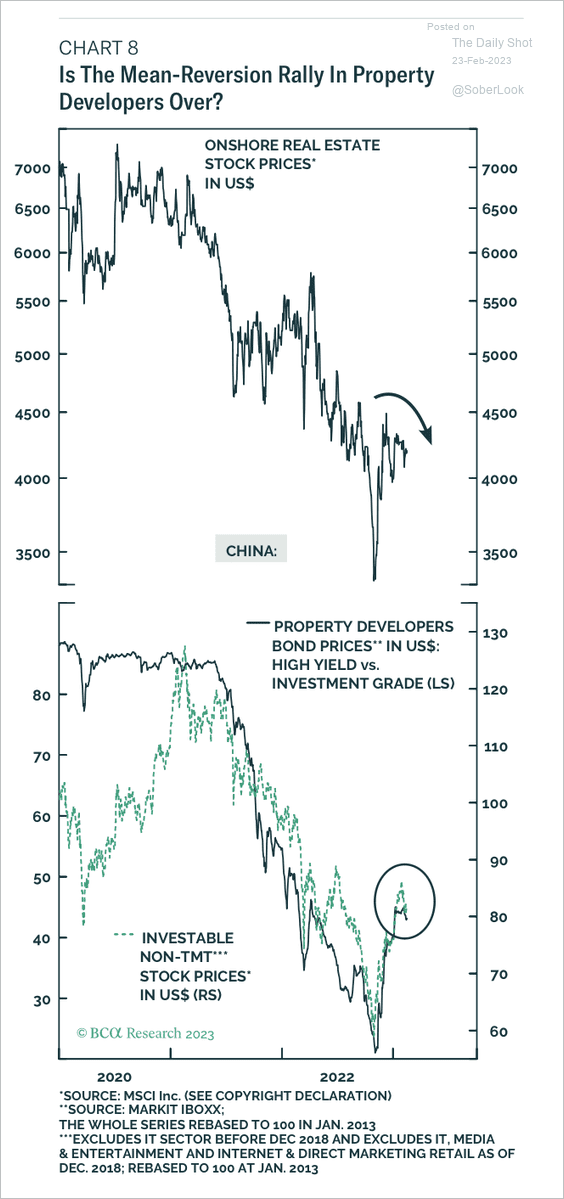 Source: BCA Research
Developers’ sales sagged this year.
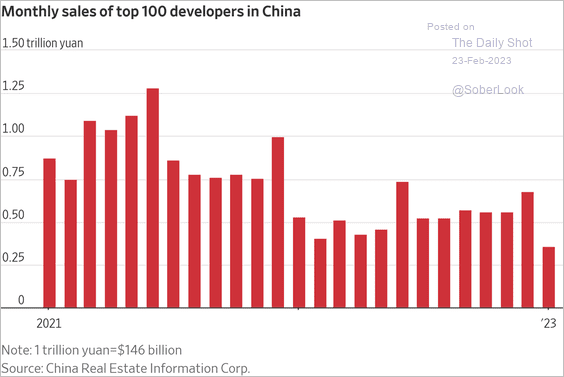 Source: @WSJ Read full article
——————–
2. China’s households’ wealth declined for the first time in decades last year.
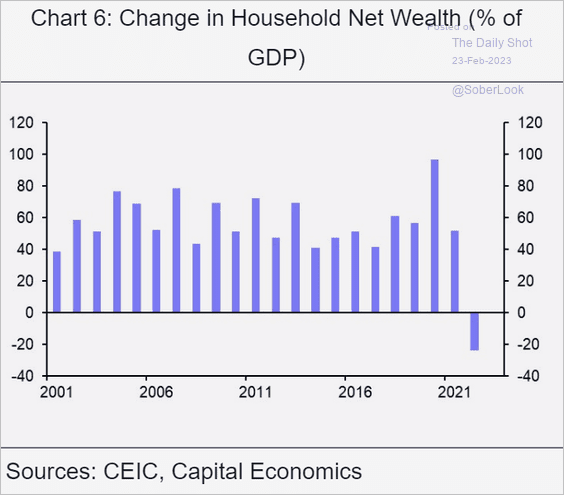 Source: Capital Economics
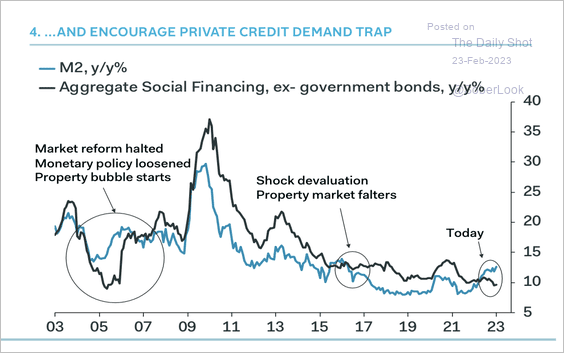
3. Household savings have risen amid weak credit demand. But regulators have asked lenders to front-load lending. (2 charts)
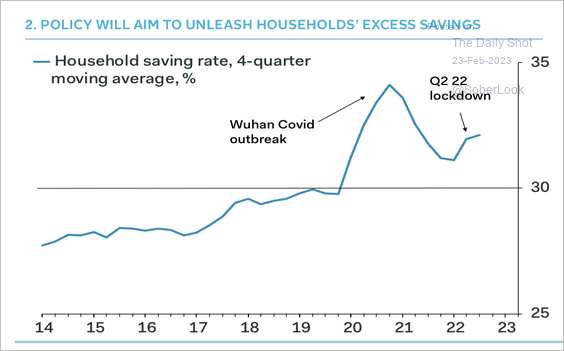 Source: Pantheon Macroeconomics
 Source: Pantheon Macroeconomics
——————–
4. Could we see further weakness in China’s industrial activity?
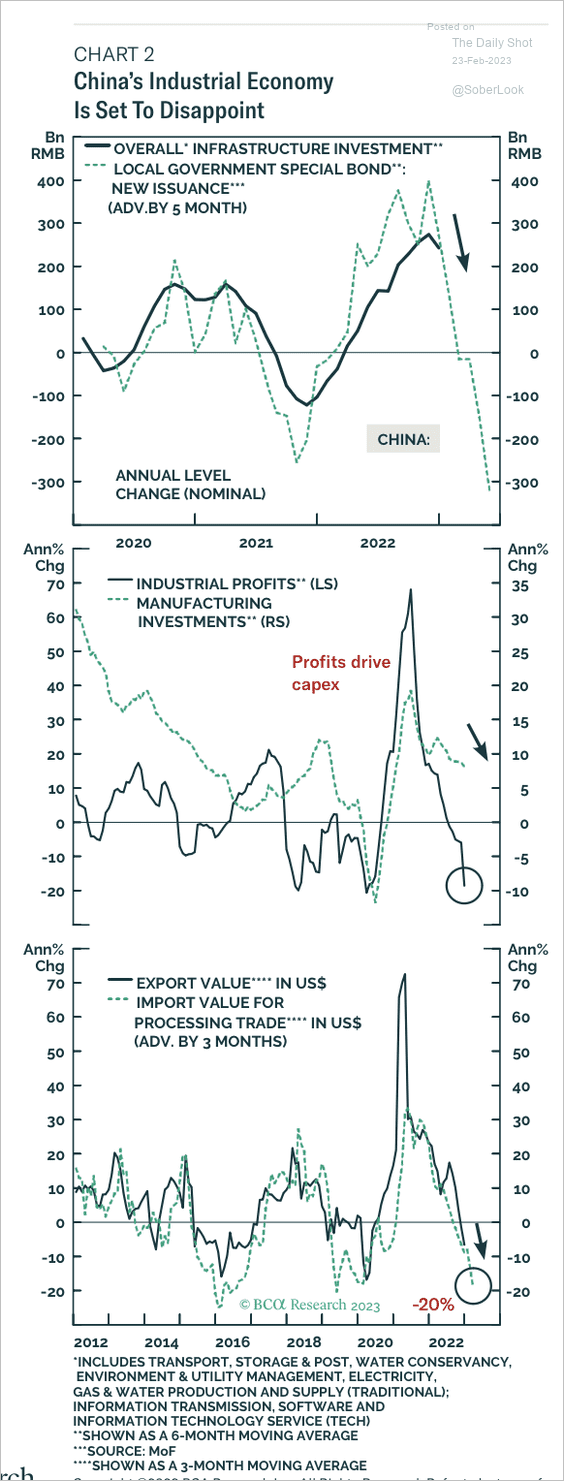 Source: BCA Research
5. Here are the components of China’s infrastructure investment.
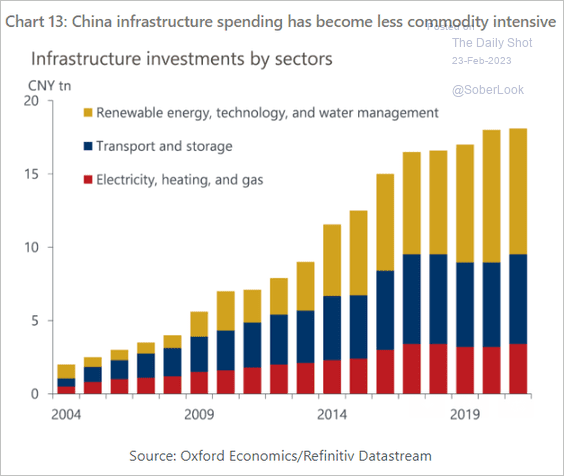 Source: Oxford Economics
6. China’s labor costs have risen sharply over the past decade.
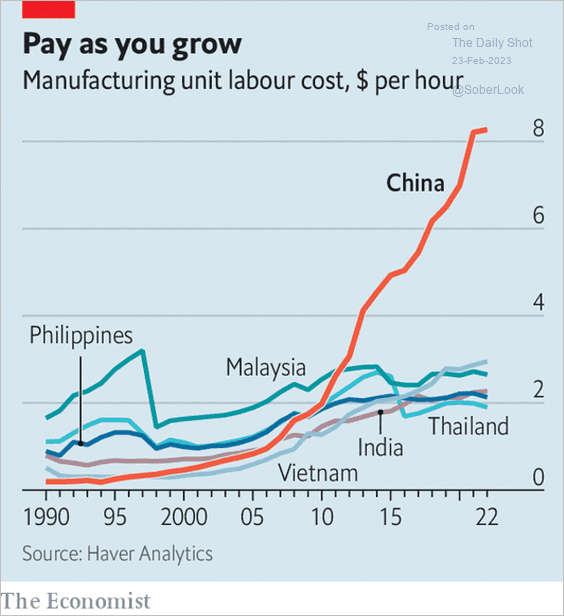 Source: @jessefelder; The Economist Read full article
Back to Index
Emerging Markets
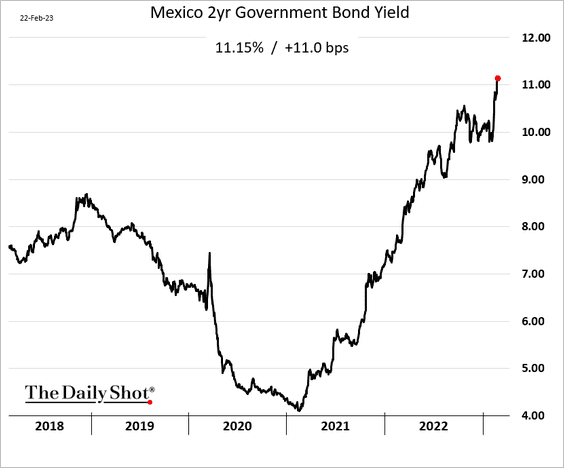
1. Mexico’s 2-year yield is now firmly above 11% amid persistent inflationary pressures.
2. Argentina’s official currency devaluation is not keeping up with the market.
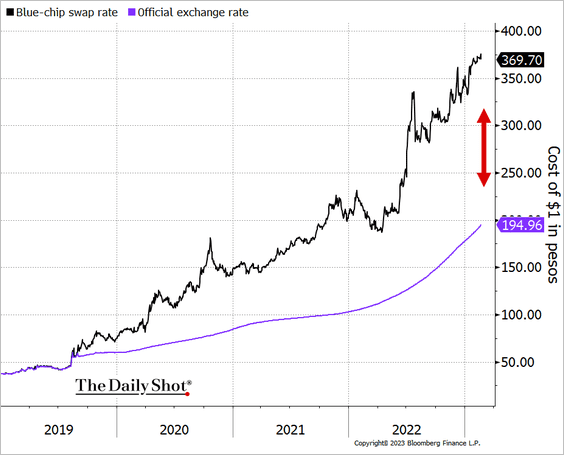 Source: @TheTerminal, Bloomberg Finance L.P.
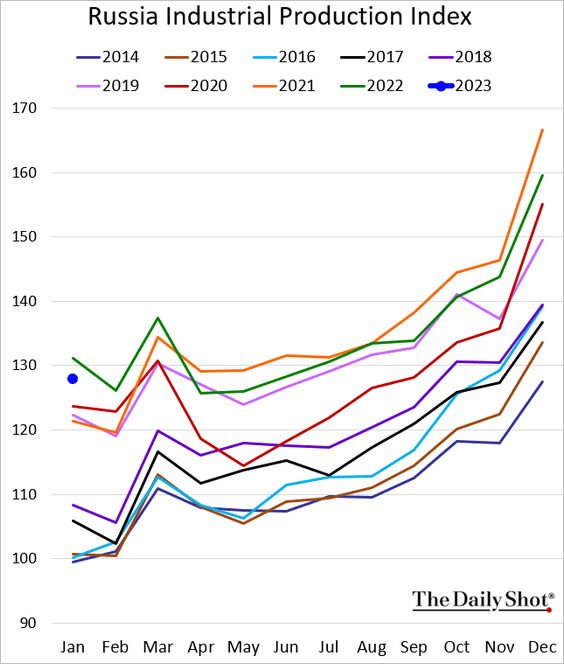
3. Here is Russia’s industrial production index (as reported by the government).
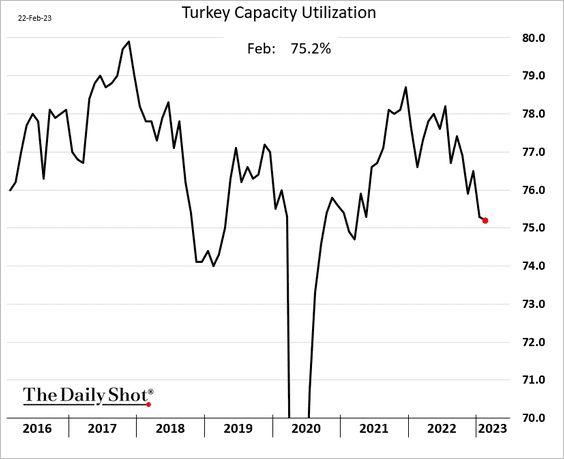
4. Turkey’s capacity utilization continues to sink.
5. A leading indicator from Oxford Economics suggests that EM stocks will underperform bonds.
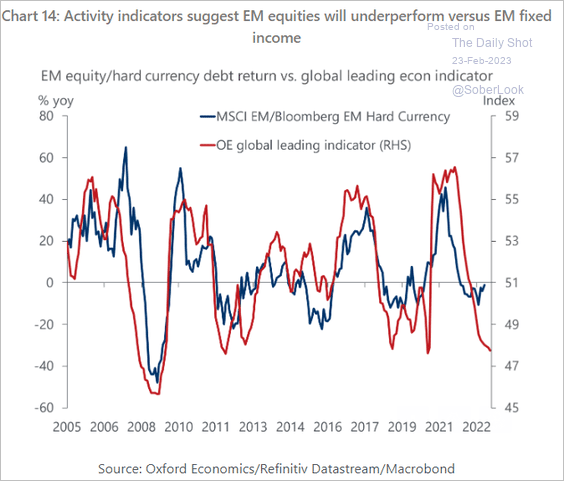 Source: Oxford Economics
6. Here is the EM debt maturity wall.
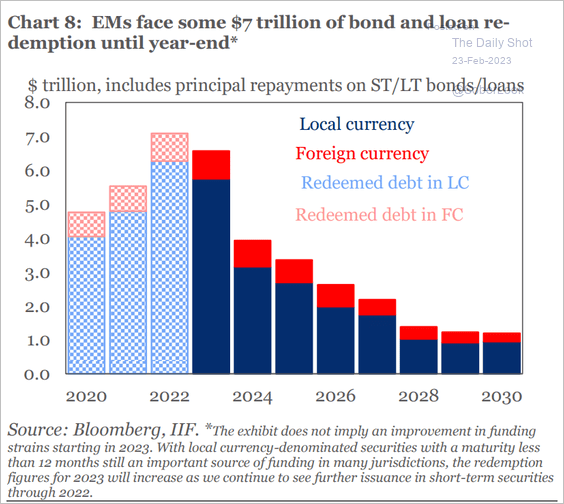 Source: IIF
Back to Index
Cryptocurrency
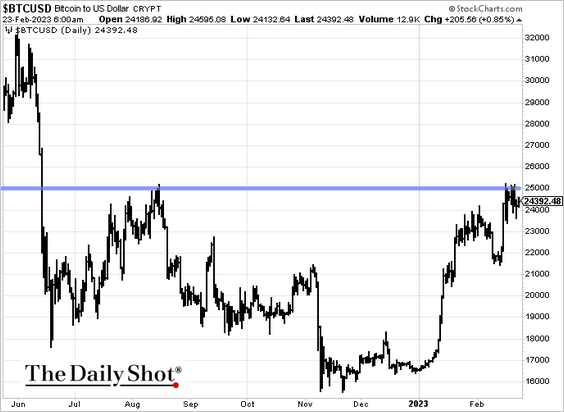
1. Bitcoin’s $25k resistance is holding.
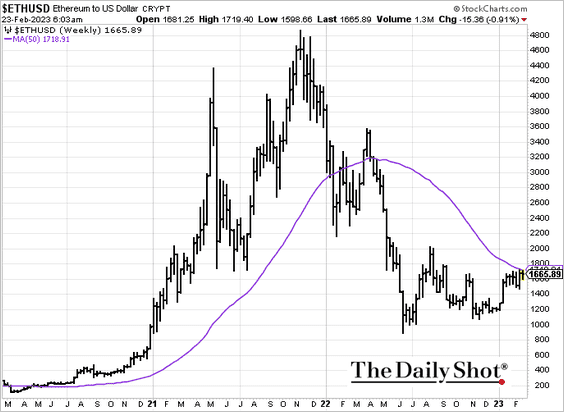
2. Ether is testing resistance at the 50-week moving average.
3. So far, bitcoin has improved relative to gold this year as investors embraced risk-on conditions.
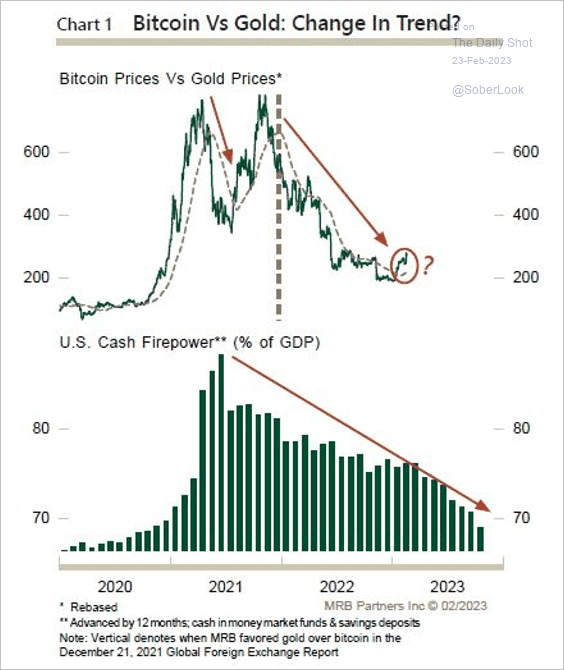 Source: MRB Partners
4. The slowdown in excess cash and savings has been a headwind for bitcoin over the past year.
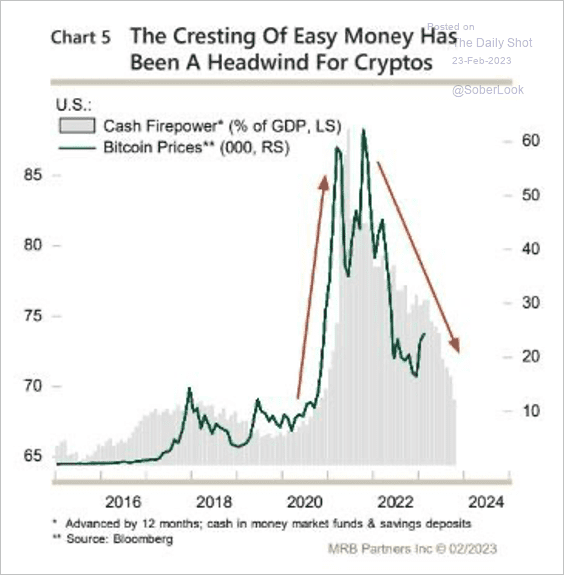 Source: MRB Partners
5. This map shows the most searched tokens by state.
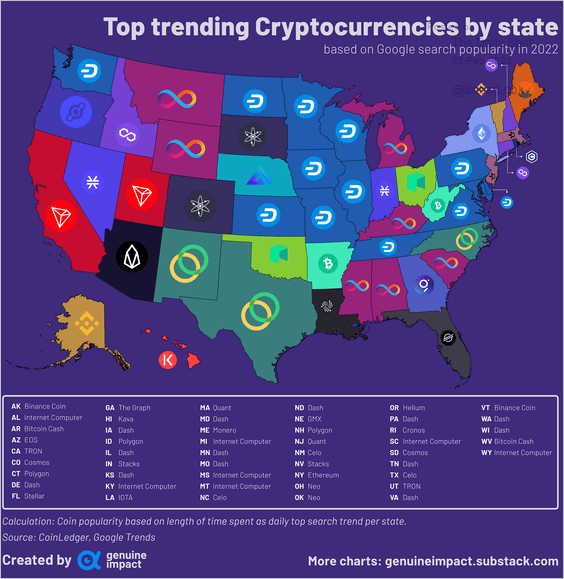 Source: @genuine_impact
Back to Index
Energy
1. Crude oil has been under pressure this week amid demand concerns.
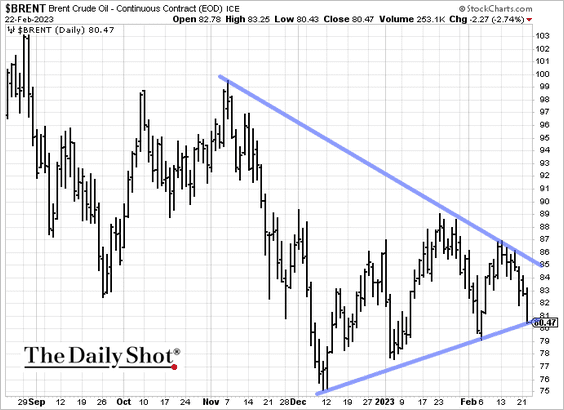
 Source: Reuters Read full article
——————–
2. US natural gas futures dipped below $2/mmbtu for the first time since 2020, before rebounding.
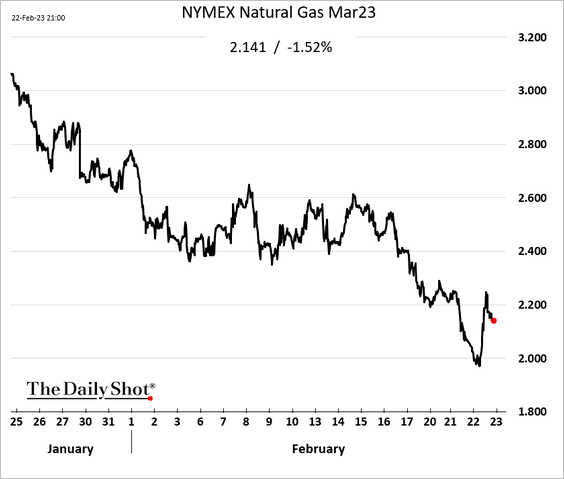
• Will natural gas test record lows?
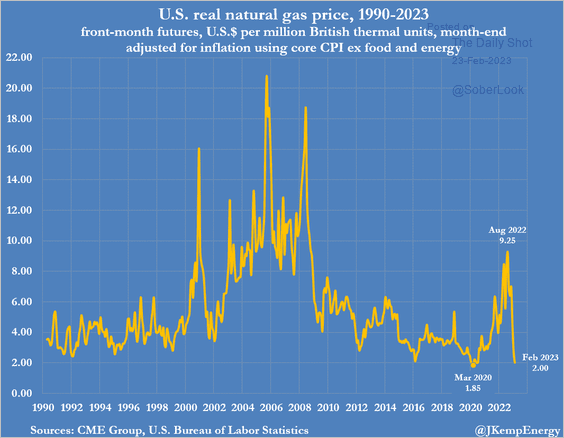 Source: @JKempEnergy
• Will we see lower production ahead?
 Source: Reuters Read full article
• US LNG exports are expected to keep surging.
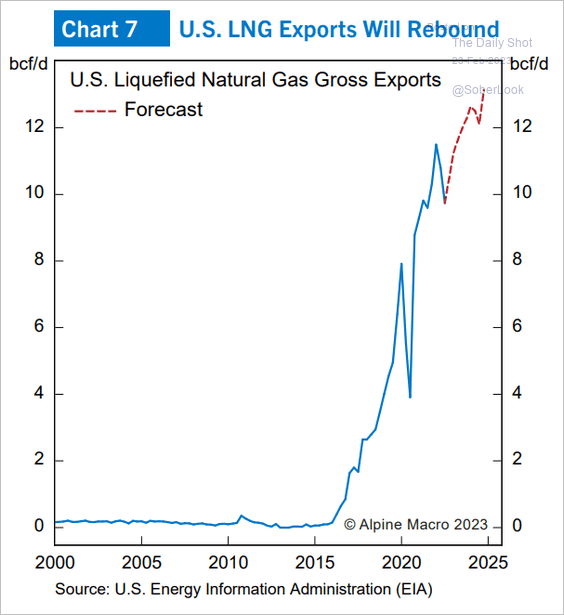 Source: Alpine Macro
——————–
3. The SPDR Oil & Gas Exploration & Production ETF (XOP) is testing long-term resistance.
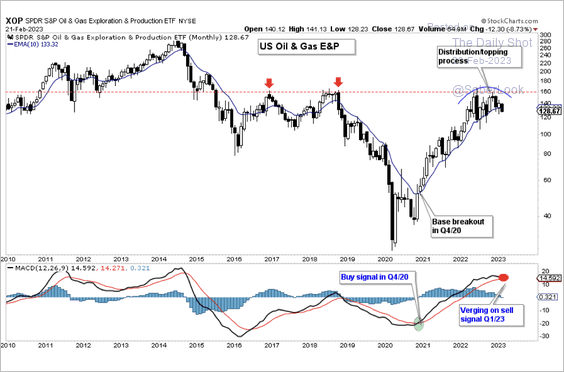 Source: Aazan Habib, Paradigm Capital
Back to Index
Equities
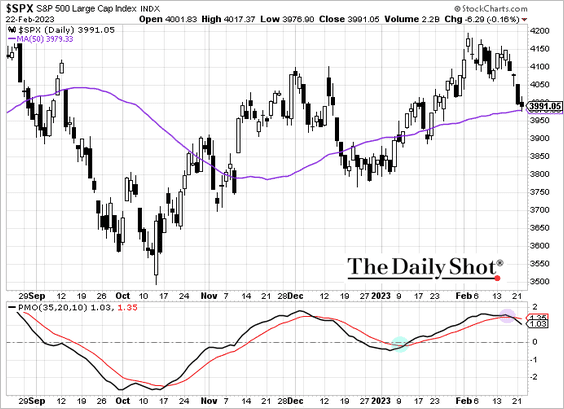
1. The S&P 500 is testing initial support near its 50-day moving average, although short-term momentum is negative.
2. Elevated real yields suggest that stocks are too expensive.
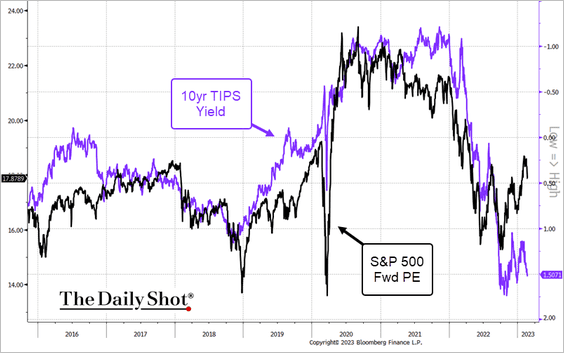 Source: @TheTerminal, Bloomberg Finance L.P.
3. Macro hedge funds have been boosting their exposure to stocks.
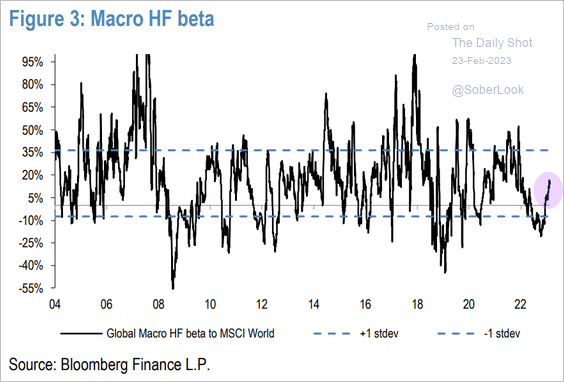 Source: JP Morgan Research
4. US value stocks trade at a substantial premium to non-US large-caps.
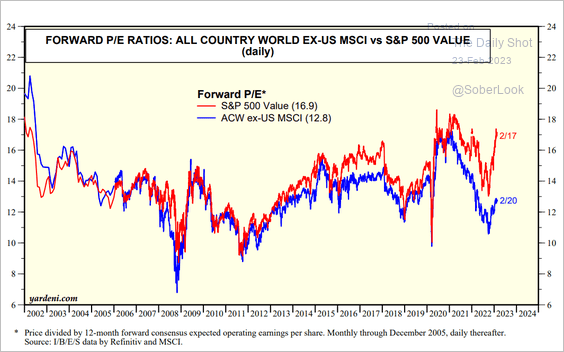 Source: Yardeni Research
5. Which industries are most concerned about inflation?
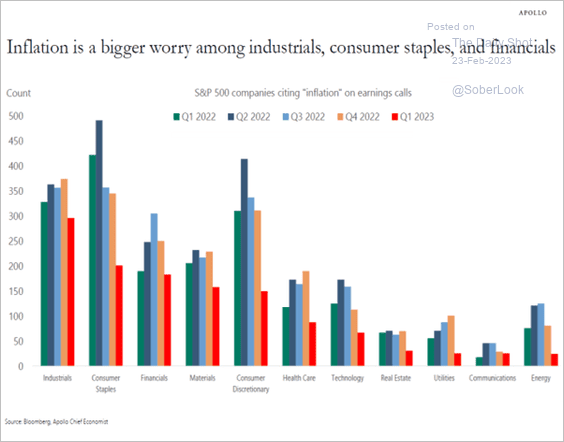 Source: Torsten Slok, Apollo
6. Fund flows into financials are recovering after massive withdrawals last year. Energy-sector funds are seeing outflows.
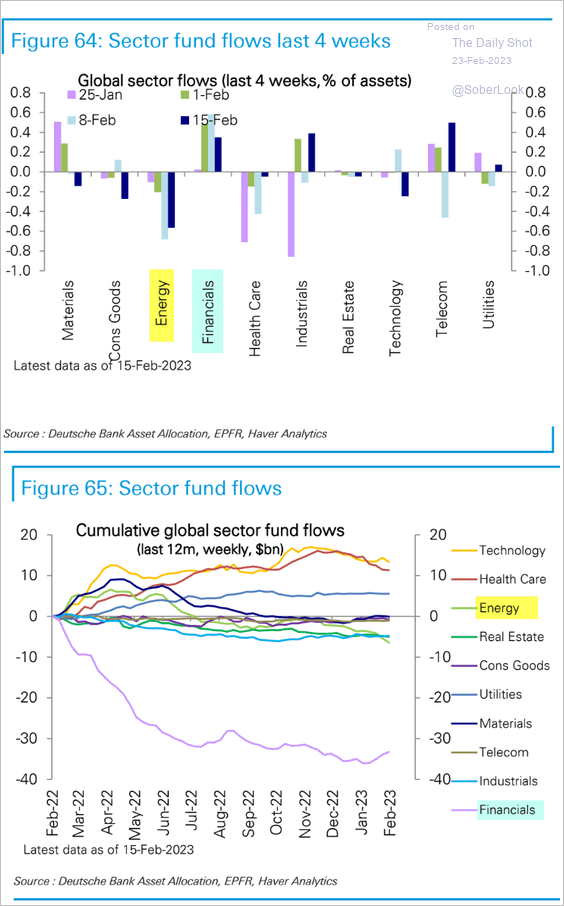 Source: Deutsche Bank Research
7. Active ETFs’ share of fund flows surged this year.
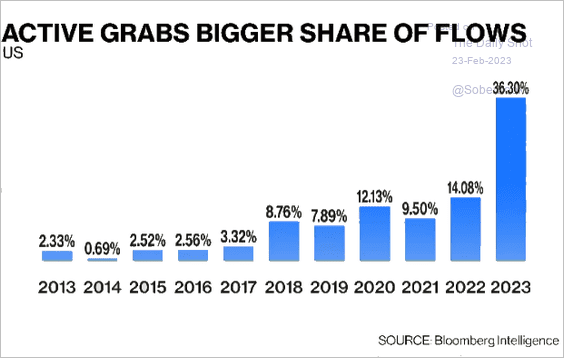 Source: @BloombergTV
8. M&A spending (deal value) has been trending lower.
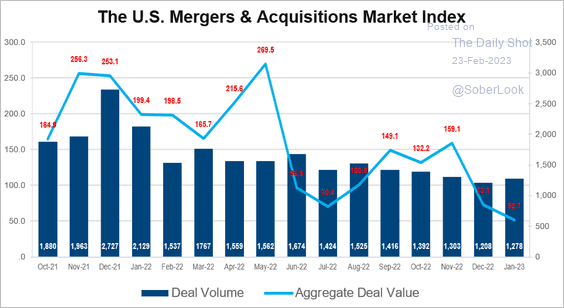 Source: @FactSet Read full article
Back to Index
Alternatives
1. VC fundraising hit a nine-year low.
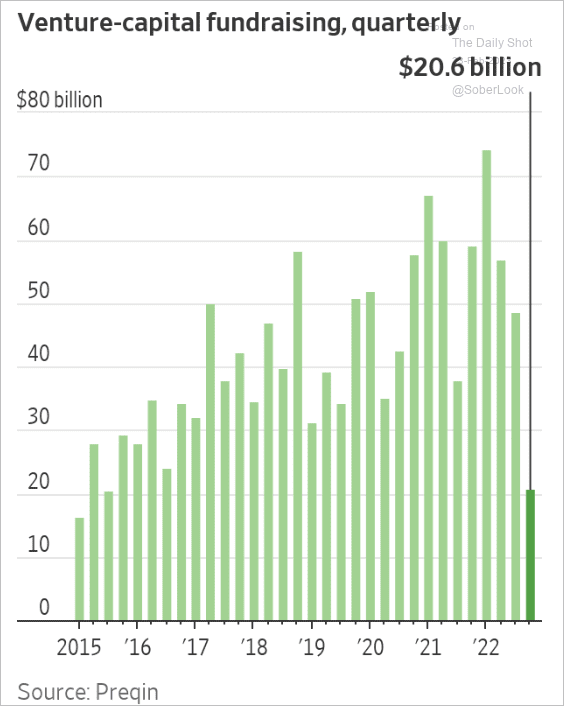 Source: @WSJ Read full article
2. 73% of venture capital commitments in 2022 went to Bay Area or NYC firms.
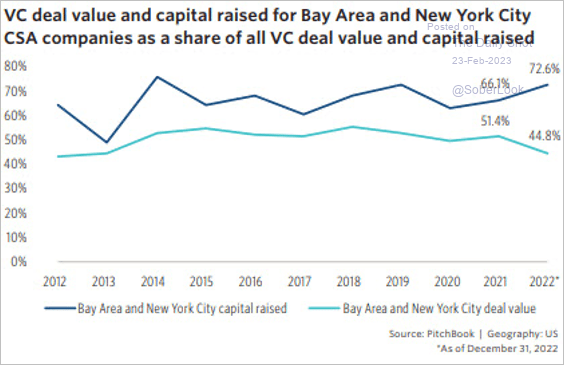 Source: PitchBook
3. China-focused PE and VC funds didn’t get much love last year.
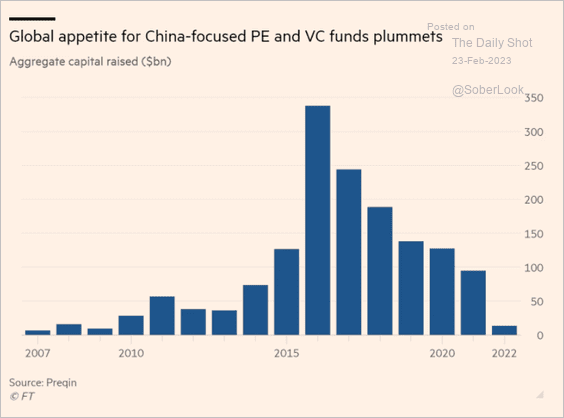 Source: @financialtimes Read full article
Back to Index
Credit
1. ETF investors have been dumping HY bonds and moving into cash.
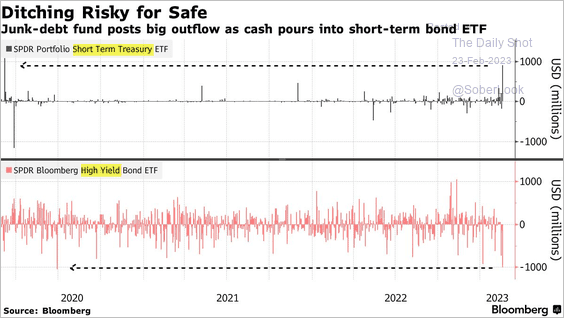 Source: @SamJPotter, @markets Read full article
3. Capital markets financing slowed sharply last year.
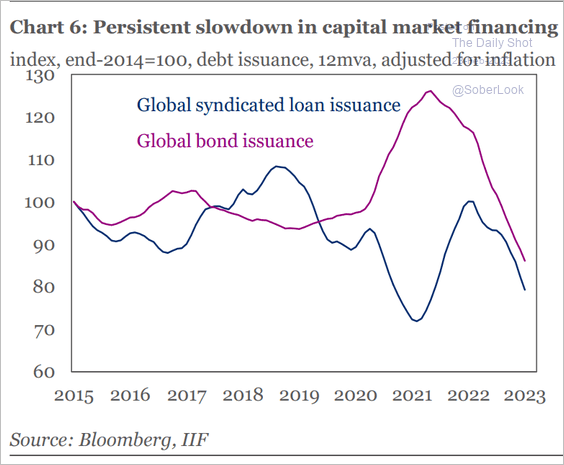 Source: IIF
4. CLO issuance has been robust year-to-date.
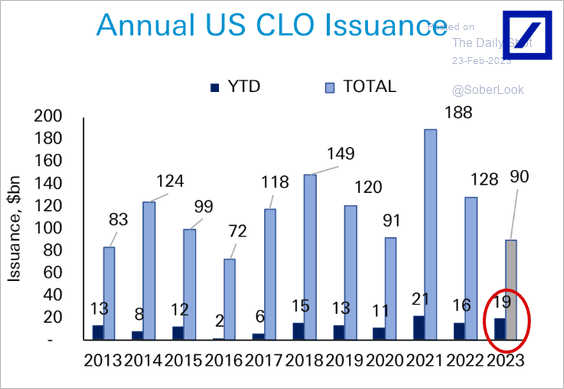 Source: Deutsche Bank Research
Back to Index
Rates
1. The 10-year Treasury yield has risen above average levels during previous hiking cycles.
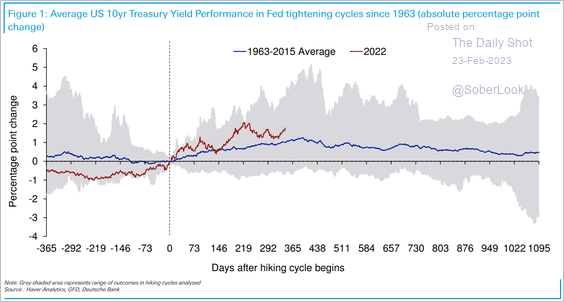 Source: Deutsche Bank Research
2. Over the long run, the 10-year Treasury yield tends to track US nominal GDP growth.
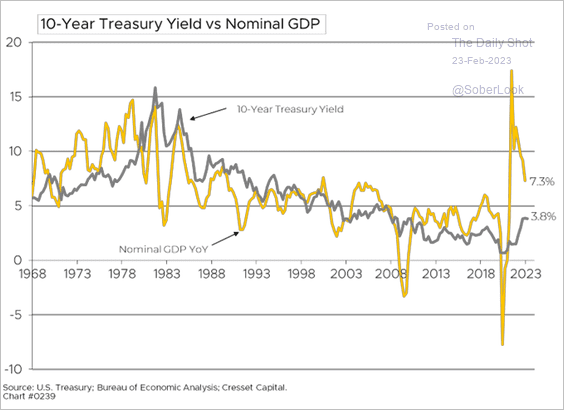 Source: Jack Ablin, Cresset Wealth Advisors
Back to Index
Global Developments
1. Excess liquidity ticked up off very low levels, largely reflecting the dollar’s sell-off since October 2022.
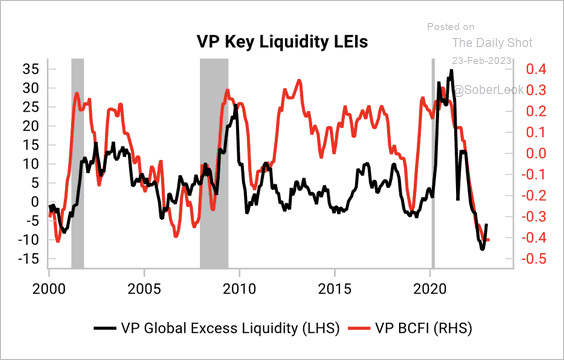 Source: Variant Perception
2. This chart shows labor force participation rates in advanced economies.
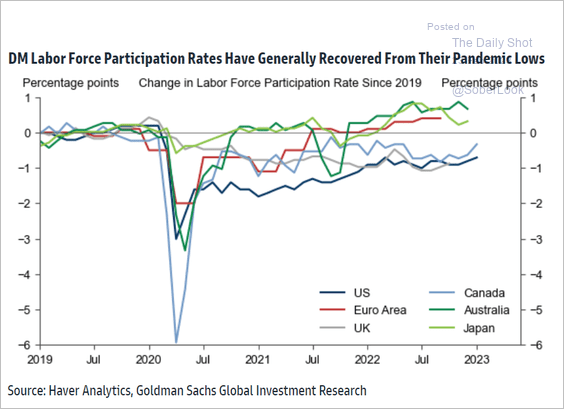 Source: Goldman Sachs
3. Global trade volumes and prices have eased.
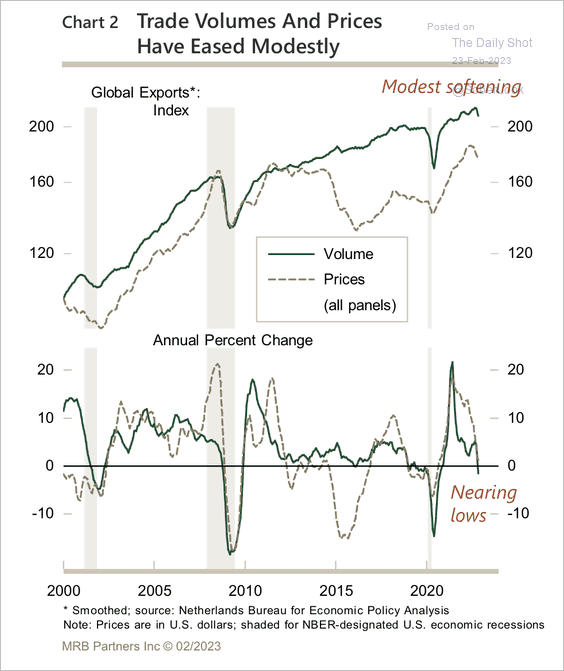 Source: MRB Partners
4. Which countries have the most firms with low interest coverage ratios?
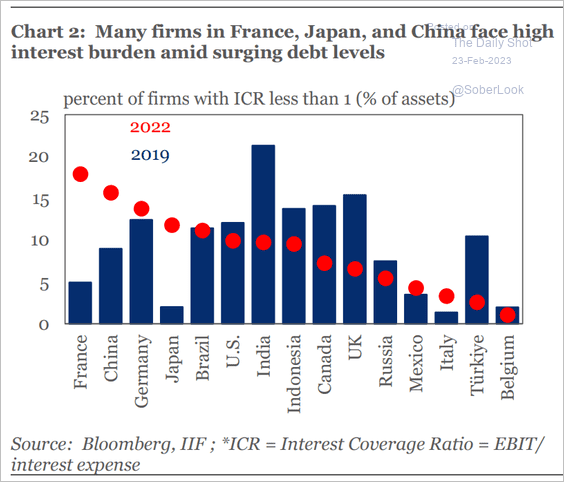 Source: IIF
——————–
Food for Thought
1. Gen-Z career goals:
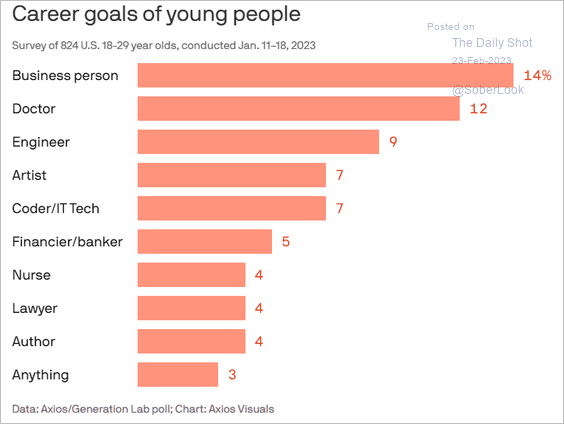 Source: @axios Read full article
2. US pickup truck sales by size:
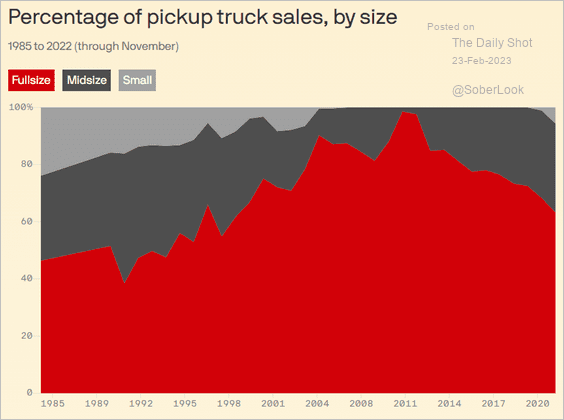 Source: @axios Read full article
What do truck buyers care about?
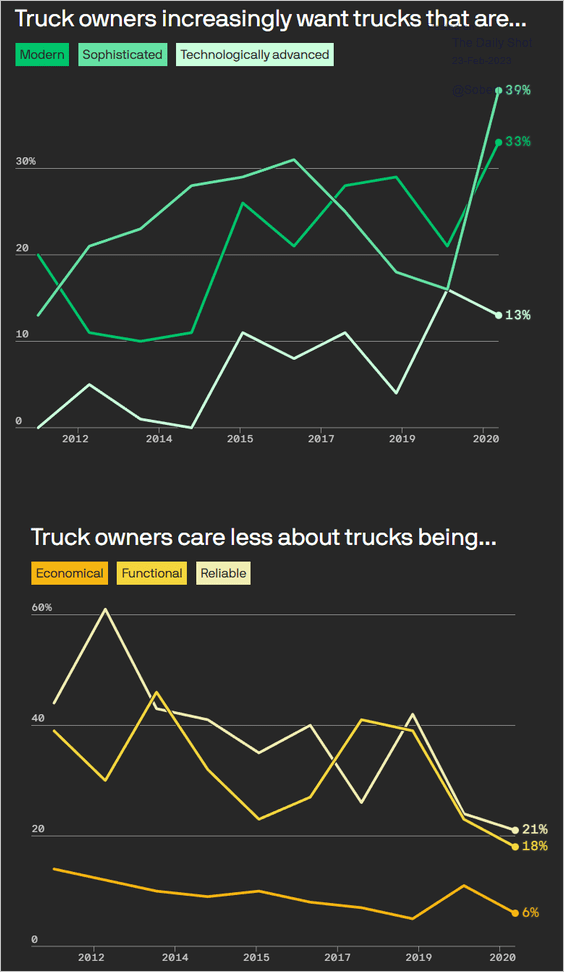 Source: @axios Read full article
——————–
3. Weapons manufacturers’ share prices:
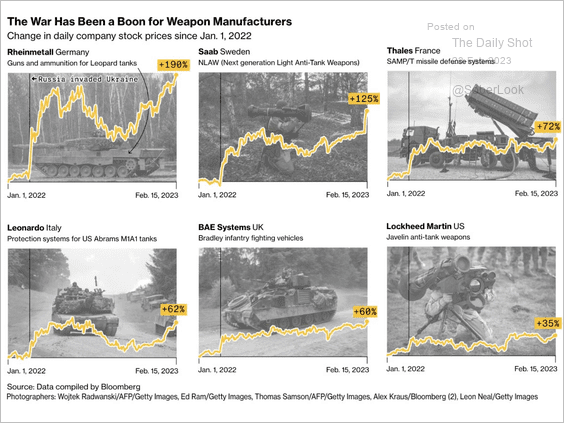 Source: @pogkas, @BBGVisualData, @bpolitics Read full article
4. Twitter’s advertising revenue loss:
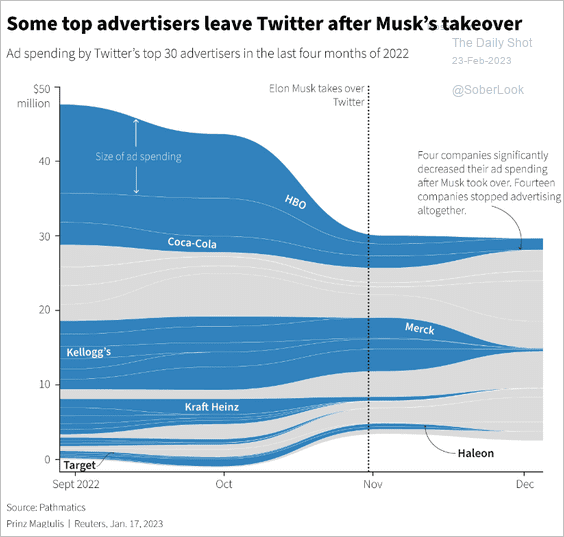 Source: Reuters Read full article
5. Salesforce revenue growth:
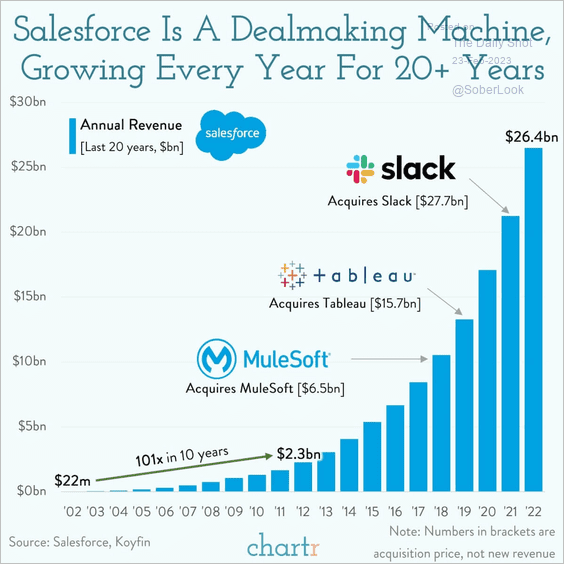 Source: @chartrdaily
6. The Wikimedia Foundation:
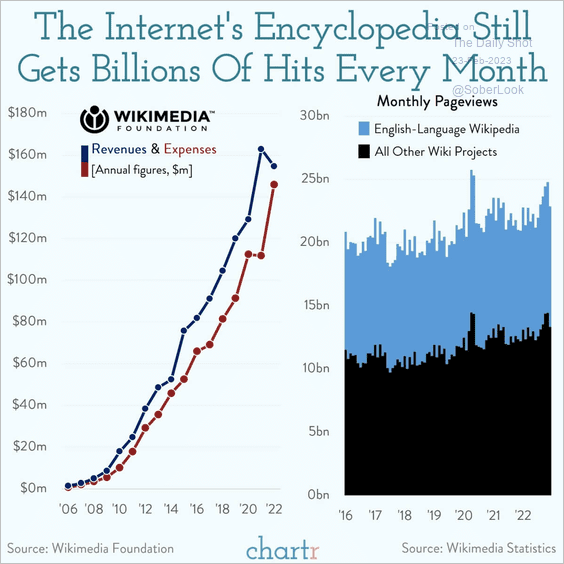 Source: @chartrdaily
7. CO2 emissions by income group:
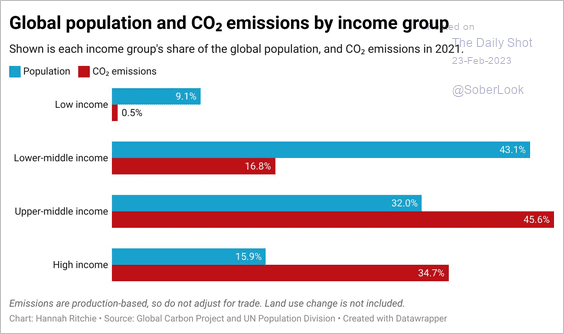 Source: @_HannahRitchie
8. Political polarization globally:
 Source: Visual Capitalist Read full article
9. The amount of sugar per ounce in select drinks:
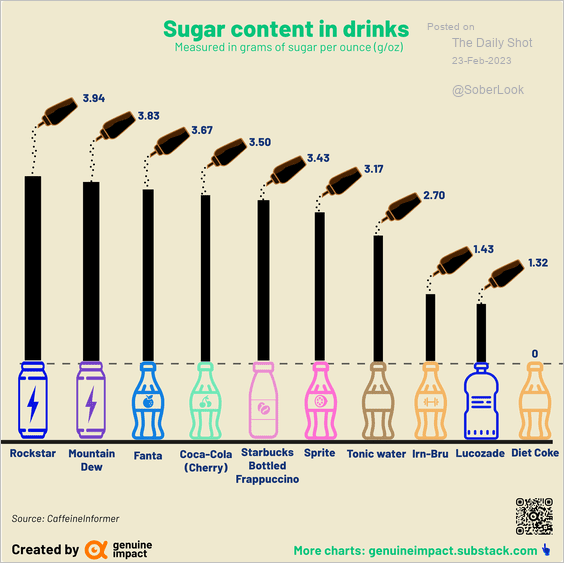 Source: @genuine_impact
10. Share of obese adults by income quintile in France and Italy:
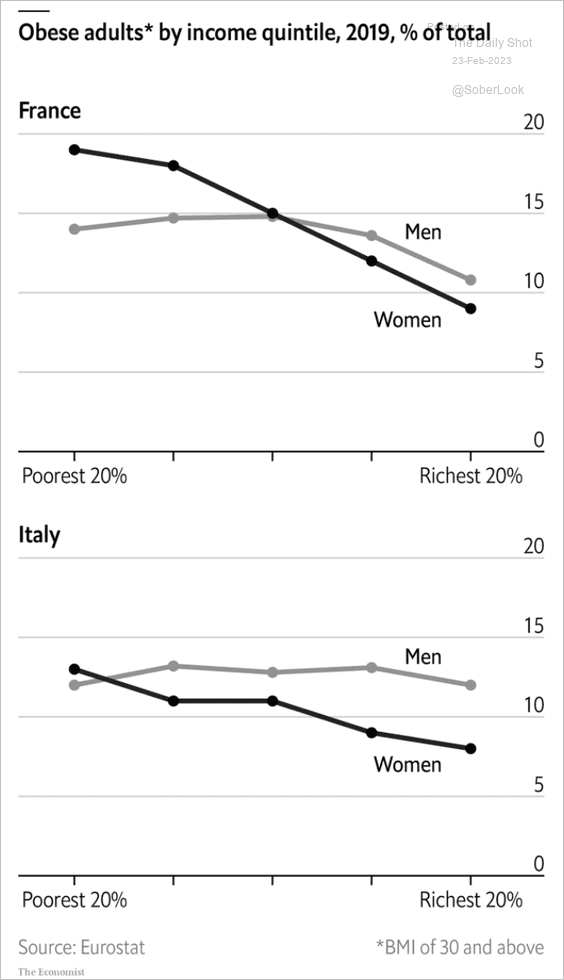 Source: The Economist Read full article
11. Most Super Bowl appearances:
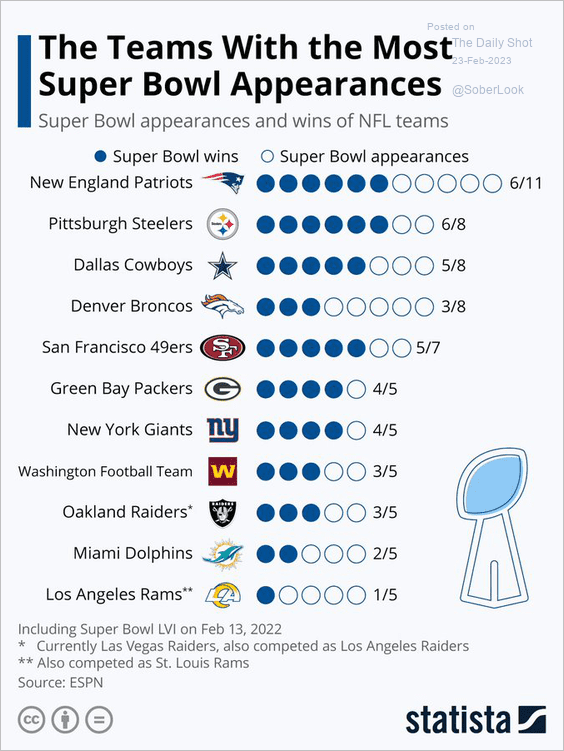 Source: Statista
——————–
Back to Index