The Daily Shot: 01-Mar-23
• The United States
• Canada
• The United Kingdom
• The Eurozone
• Europe
• Asia – Pacific
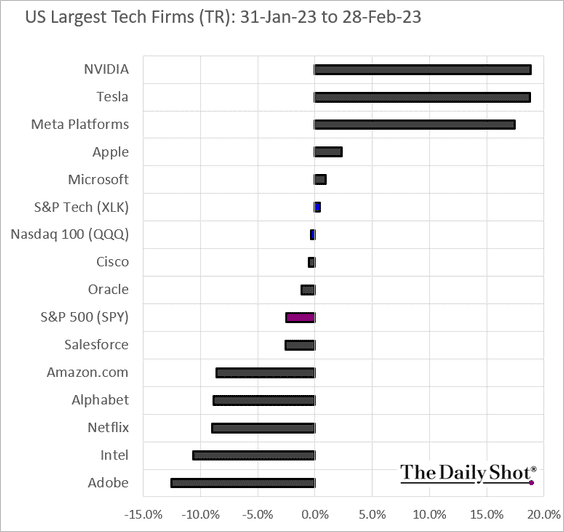
• China
• Emerging Markets
• Commodities
• Energy
• Equities
• Credit
• Rates
• Global Developments
• Food for Thought
The United States
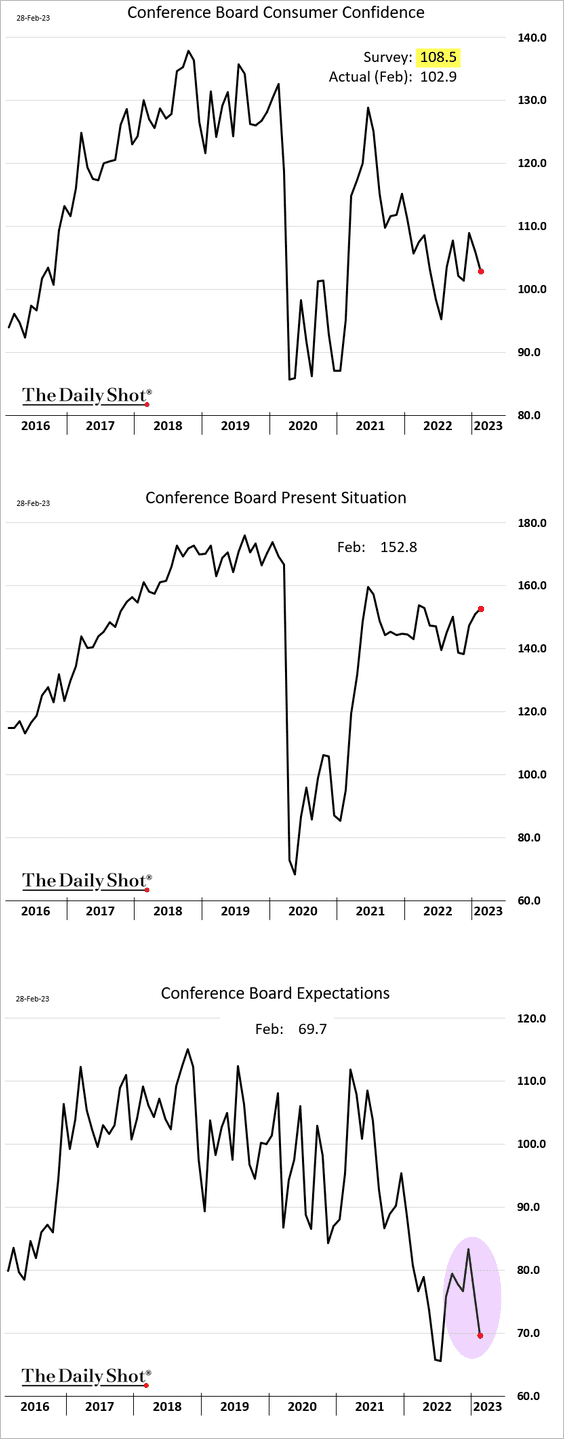
1. The Conference Board’s consumer confidence indicator surprised to the downside, as the expectations component slumped.
• Here are the contributions.
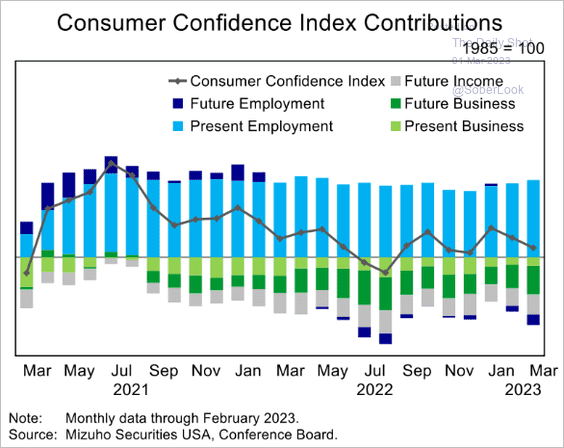 Source: Mizuho Securities USA
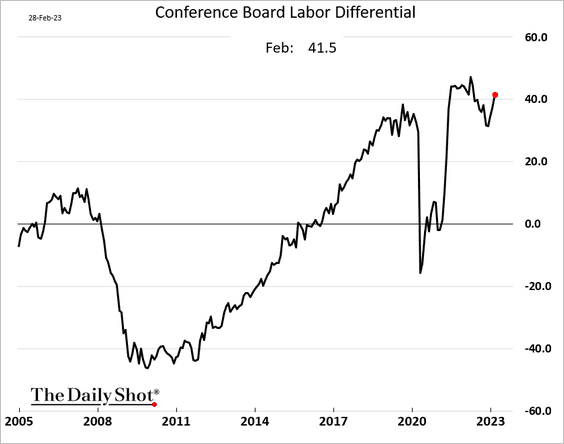
• The labor differential (“jobs plentiful” – “jobs hard to get”) once again points to a tight labor market.
• The spread between expectations and current conditions continues to signal a recession ahead.
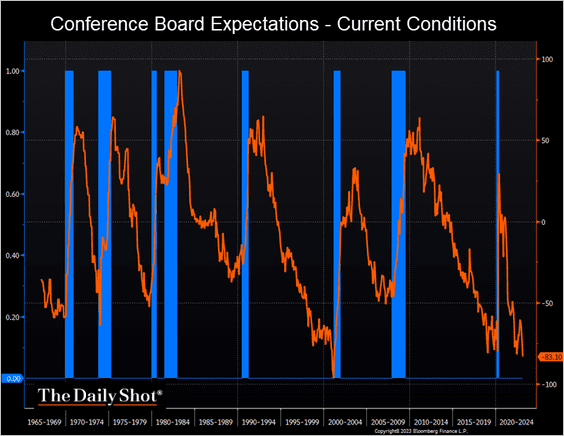 Source: @TheTerminal, Bloomberg Finance L.P.
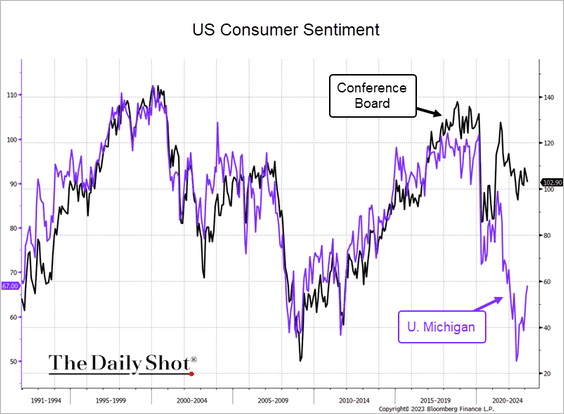
• The Conference Board – U. Michigan sentiment index gap persists.
 Source: @TheTerminal, Bloomberg Finance L.P.
——————–
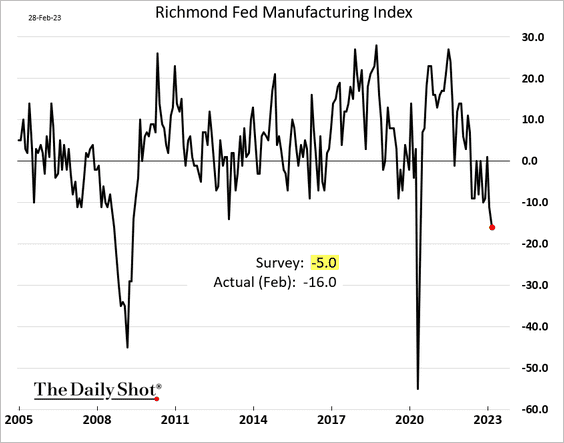
2. The Richmond Fed’s manufacturing index showed severe deterioration in the region’s business activity.
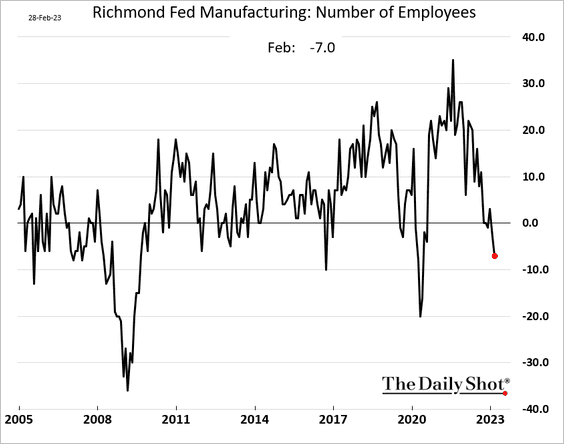
• Manufacturers reduced their workforce in February.
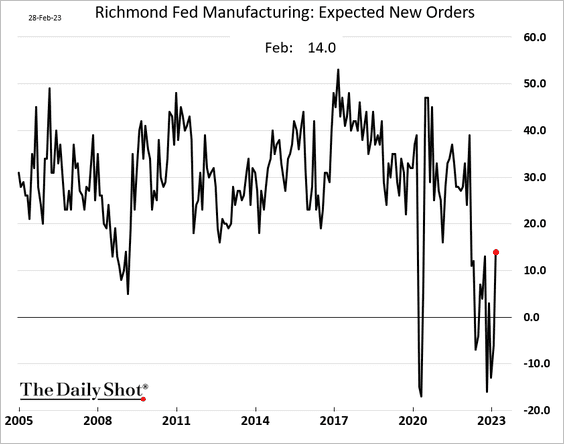
• Manufacturers are somewhat more upbeat about the future.
——————–
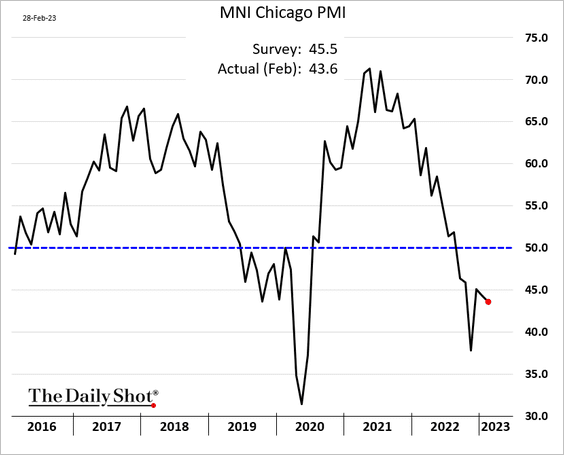
3. The MNI Chicago PMI points to factory activity weakness in the Midwest region.
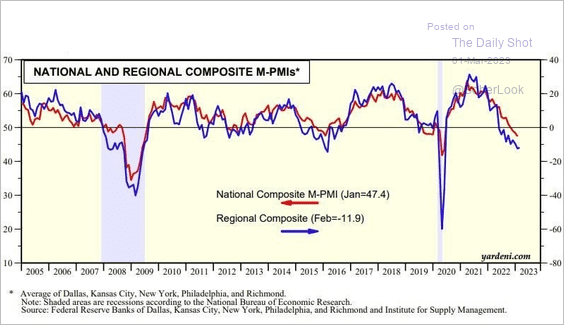
4. Regional indicators continue to signal weakness at the national level (ISM).
 Source: Yardeni Research
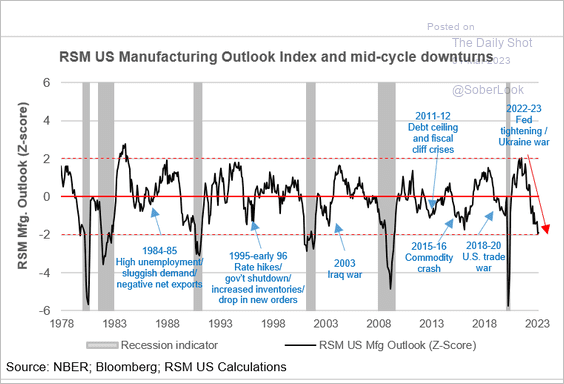
• Here is the aggregate manufacturing index from RSM.
 Source: RSM Read full article
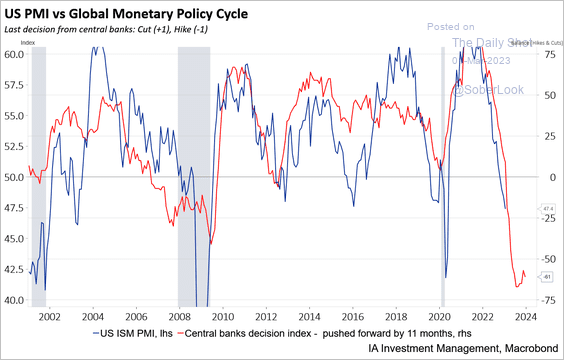
• Global monetary tightening has also been a headwind for US manufacturing.
 Source: Industrial Alliance Investment Management
• But China’s recovery could support US factory activity.
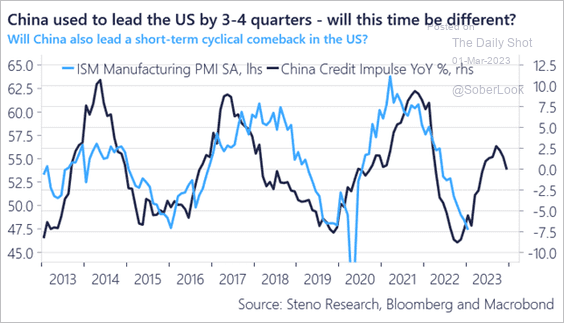 Source: @AndreasSteno
——————–
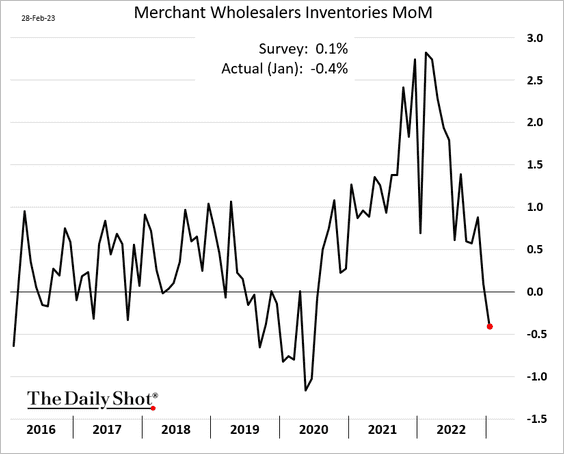
5. Wholesale inventories unexpectedly declined in January.
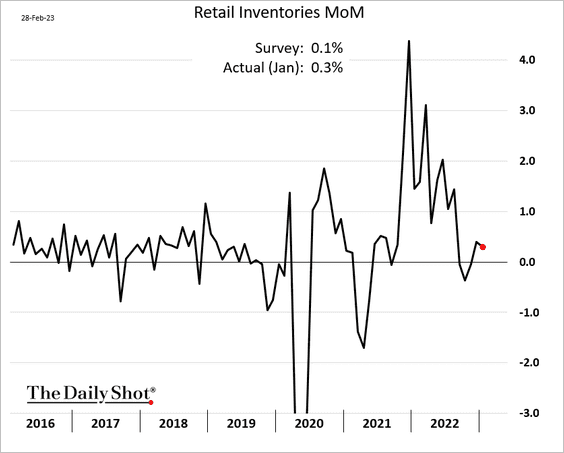
But retail inventories continue to climb.
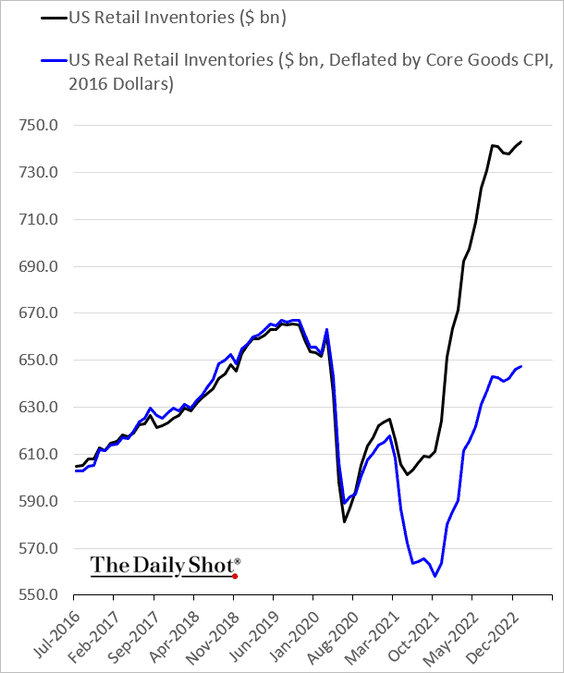
This chart shows nominal and real retail inventories (level).
——————–
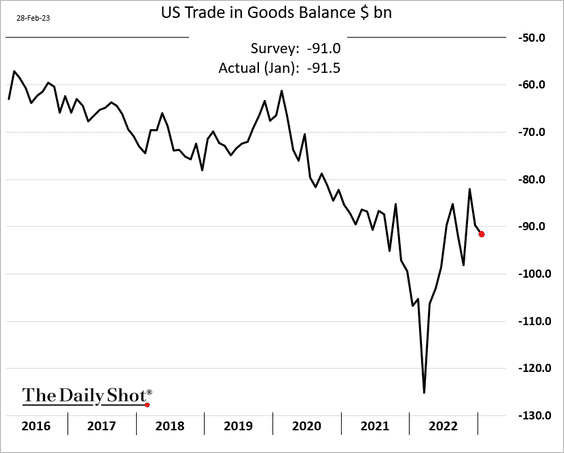
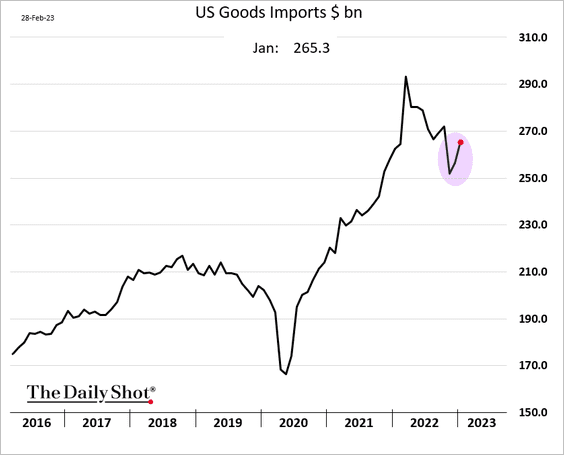
6. The US trade deficit in goods widened in January, …
… as imports strengthened.
——————–
7. Next, we have some updates on the housing market.
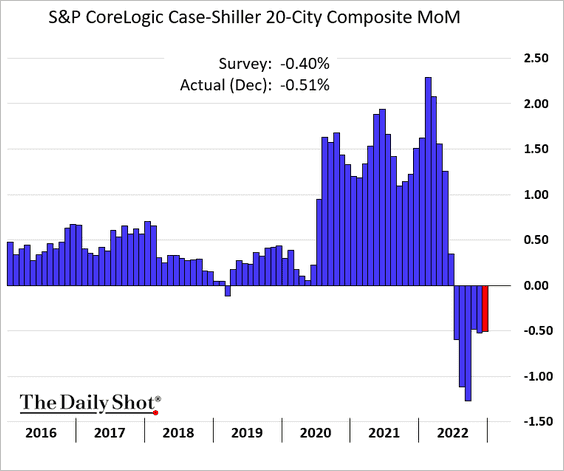
• Home prices declined for the sixth month in a row in December.
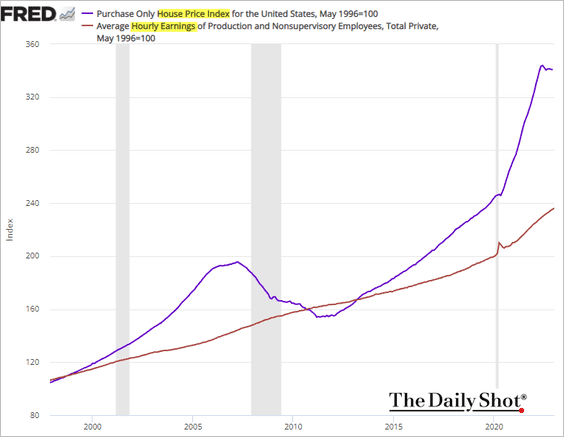
• Home price declines have hardly made a dent in the wage/price gap.
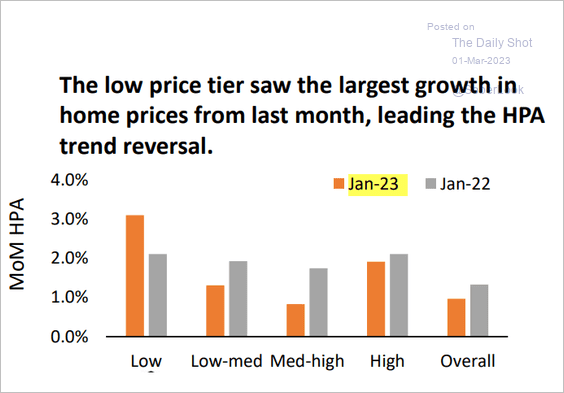
• Moreover, home prices increased in January, led by the low-price tier.
 Source: AEI Housing Center
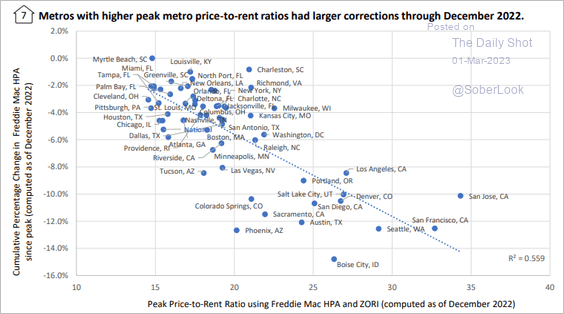
• Housing markets with higher valuations saw bigger corrections through December.
 Source: AEI Housing Center
——————–
8. Finally, let’s take a look at some trends impacting inflation.
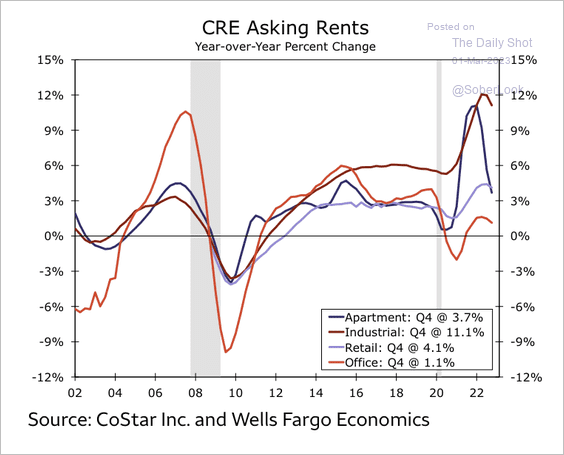
• Apartment rents have slowed considerably versus other property types, …
 Source: Wells Fargo Securities
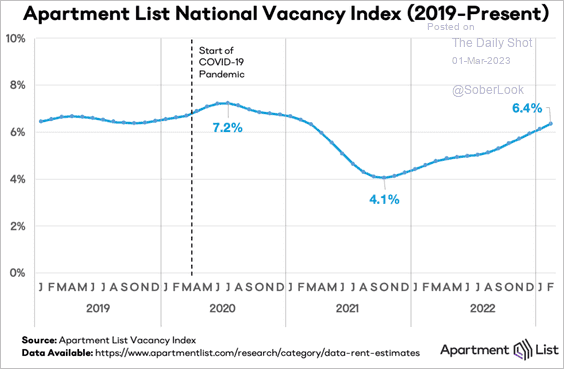
… as vacancies increased.
 Source: Apartment List
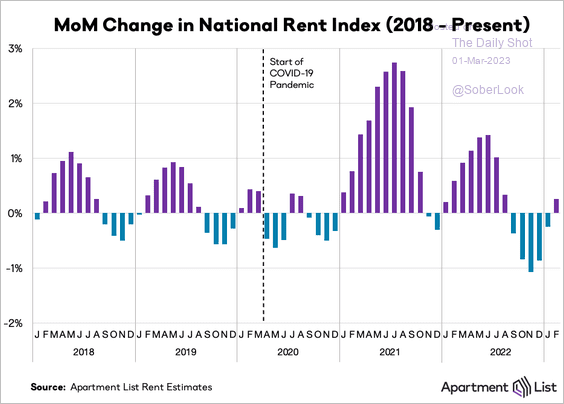
However, after five months of declines, apartment rental costs increased in February.
 Source: Apartment List
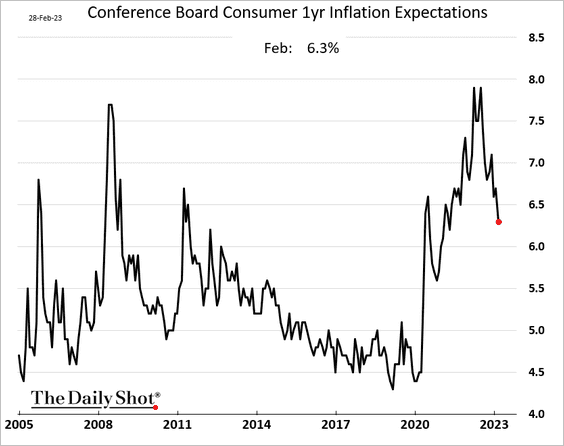
• According to the Conference Board, consumer inflation expectations continue to ease.
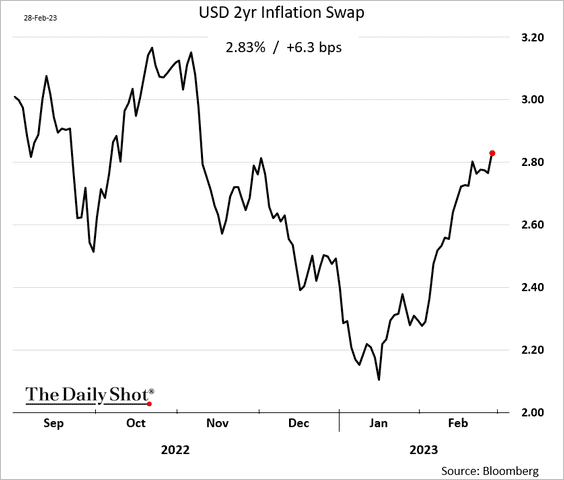
However, the market is pricing higher inflation over the next couple of years.
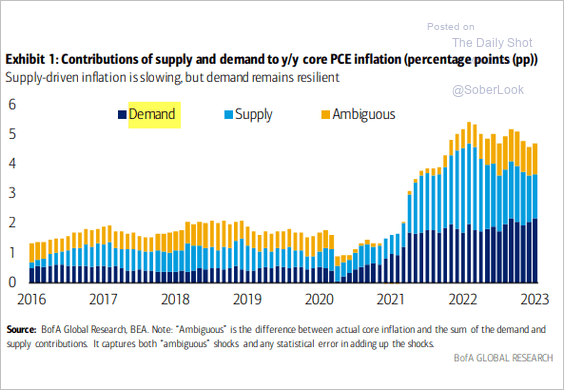
• As supply bottlenecks ease, inflation is increasingly driven by demand.
 Source: BofA Global Research
Back to Index
Canada
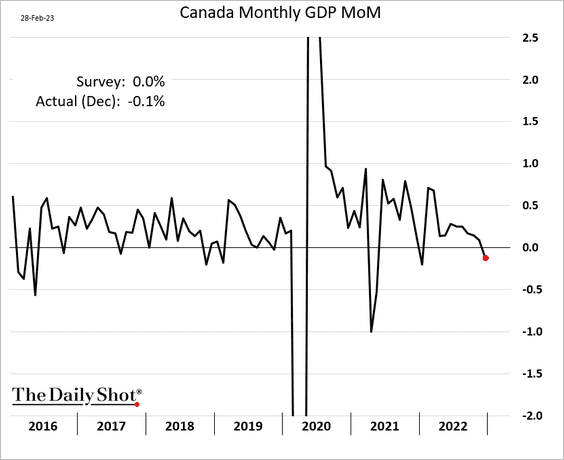
1. The monthly GDP estimate unexpectedly showed an economic contraction in December, …
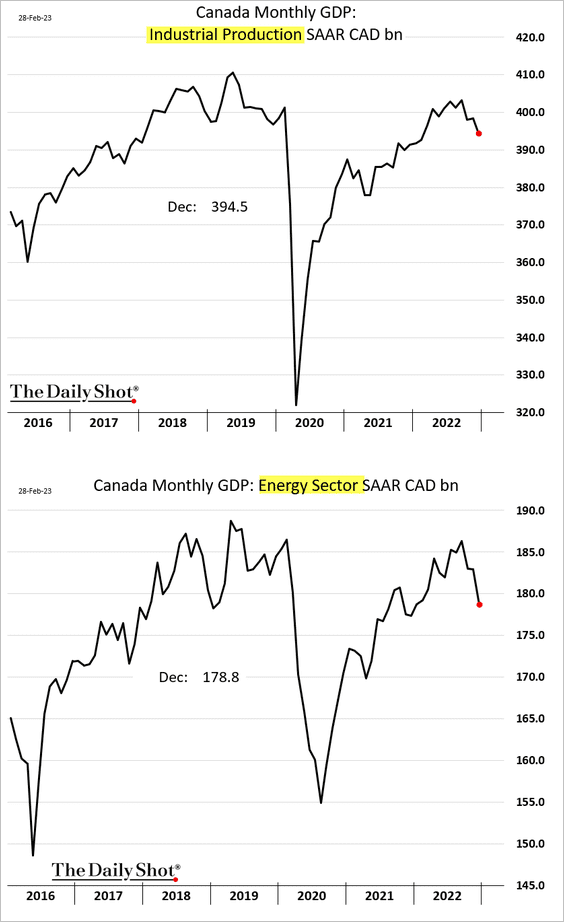
… with manufacturing and energy output slowing.
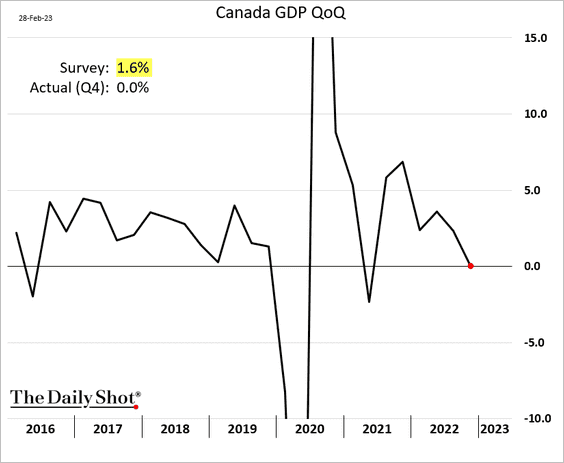
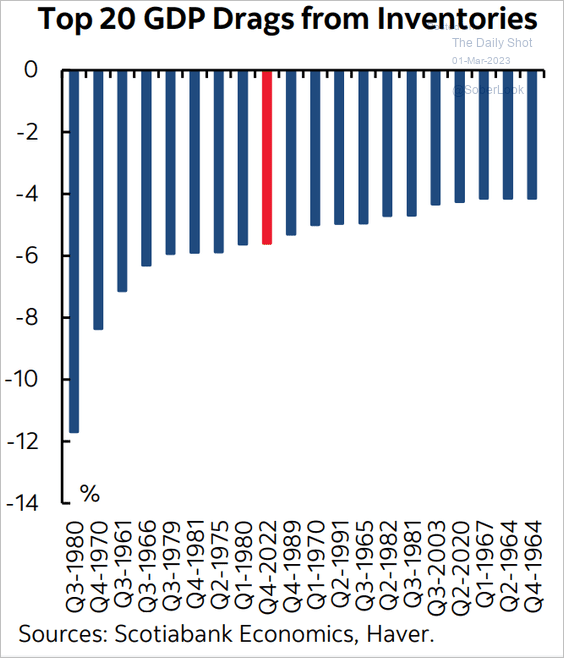
• The quarterly GDP was flat (the market expected a 1.6% annualized expansion).
• However, the “core” GDP showed growth, …
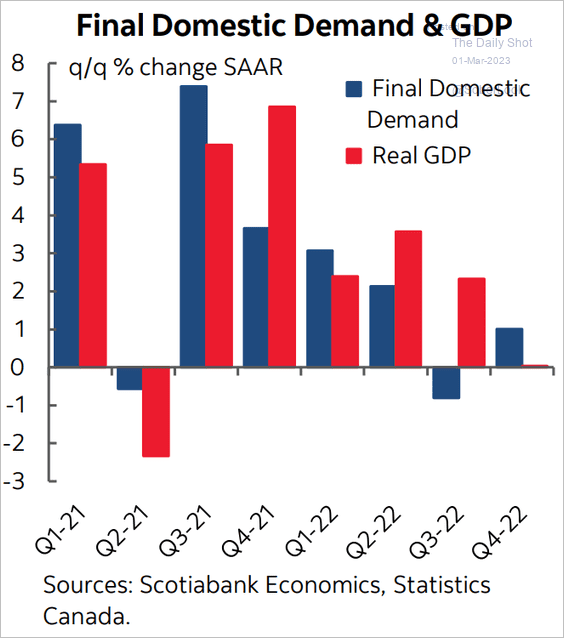 Source: Scotiabank Economics
… with weakness driven by inventories.
 Source: Scotiabank Economics
——————–
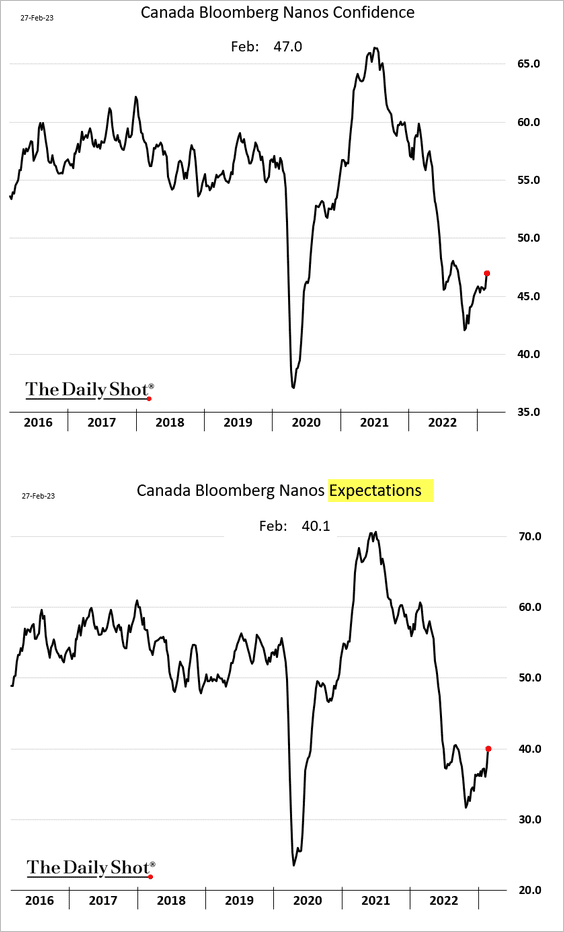
2. Consumer confidence is gradually improving.
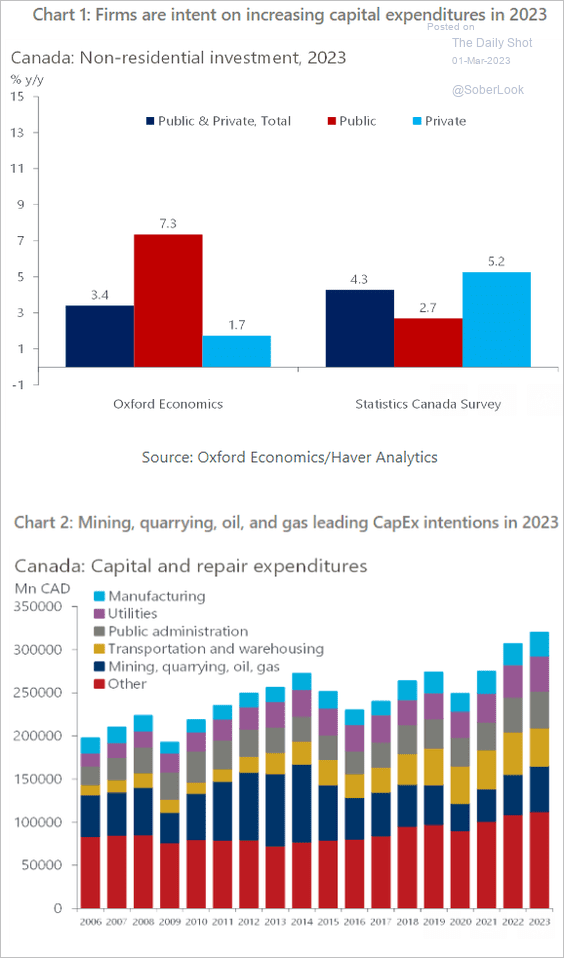
3. Canadian firms expect to grow business investment.
 Source: Oxford Economics
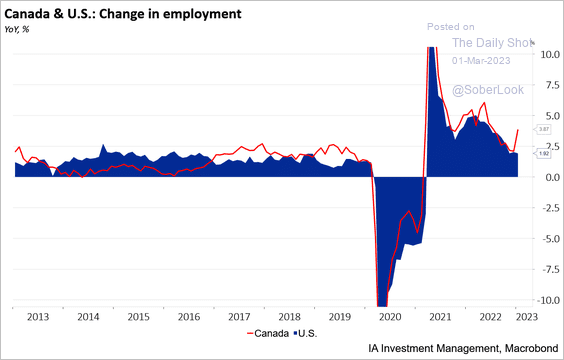
4. Canada’s employment growth has been outpacing the US.
 Source: Industrial Alliance Investment Management
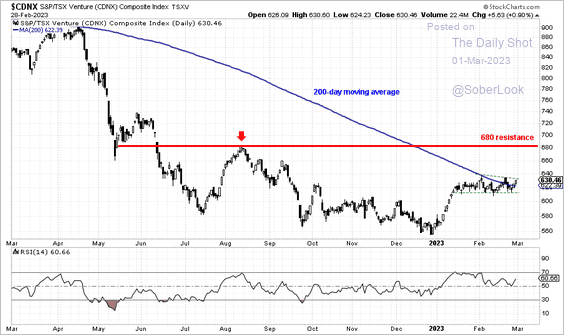
5. The TSX Venture Index (micro-cap stocks) is breaking above its 200-day moving average.
 Source: Aazan Habib, Paradigm Capital
Back to Index
The United Kingdom
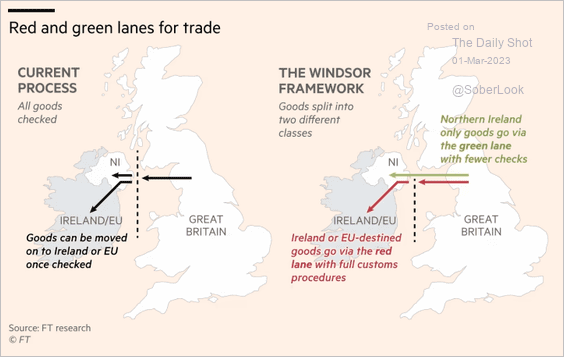
1. This graphic illustrates the “two-lane” UK/EU trade framework.
 Source: @financialtimes Read full article
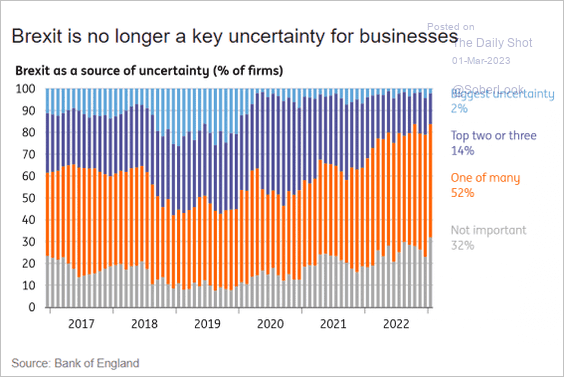
Brexit uncertainty has been less of a concern for businesses.
 Source: ING
——————–
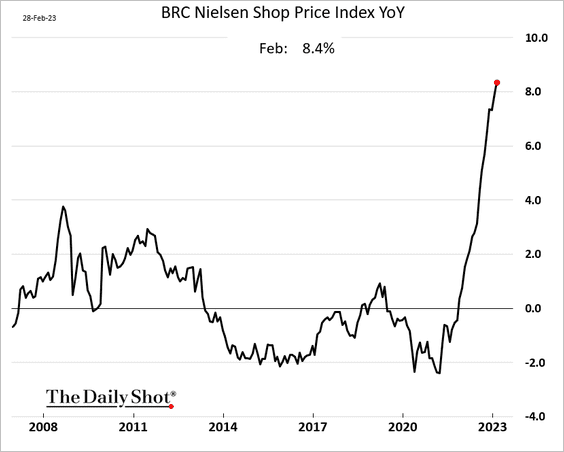
2. Shop prices continue to surge.
 Source: Reuters Read full article
Back to Index
The Eurozone
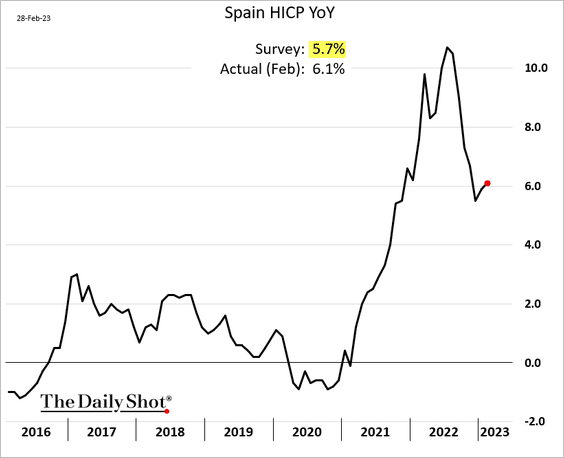
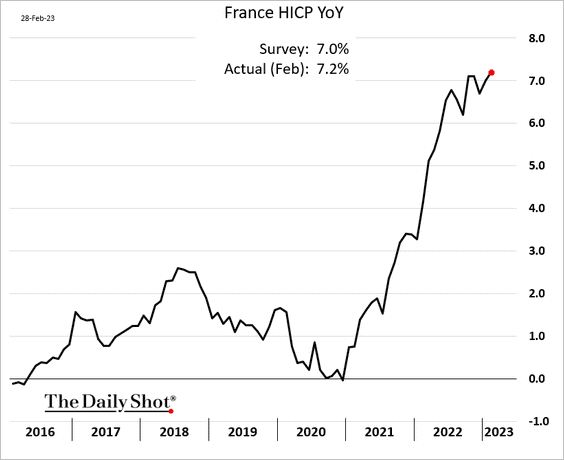
1. The first releases of February inflation measures topped expectations. Euro-area inflation is still running hot.
 Source: Reuters Read full article
• Spain:
Here is Spain’s core inflation, which continues to hit multi-year highs.
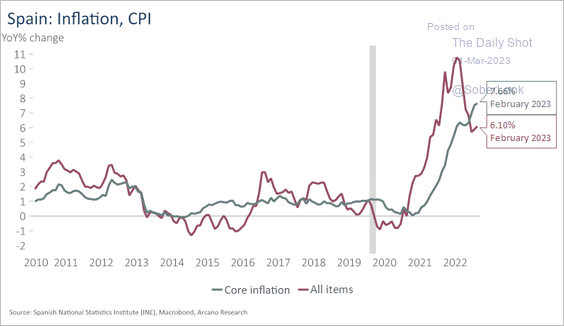 Source: Arcano Economics
• France:
——————–
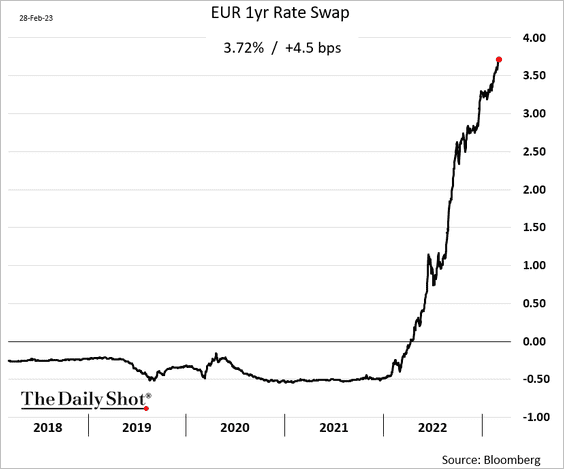
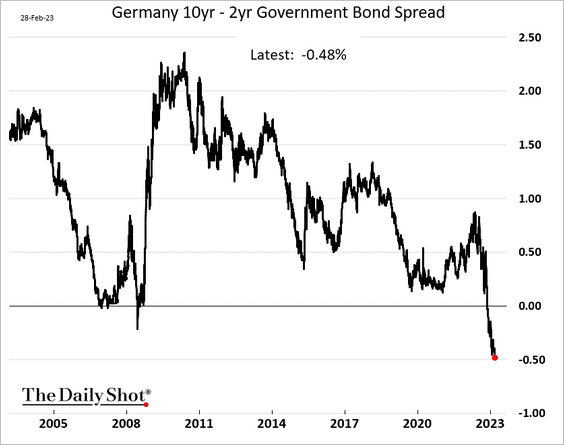
2. Market expectations for ECB rate hikes climbed further.
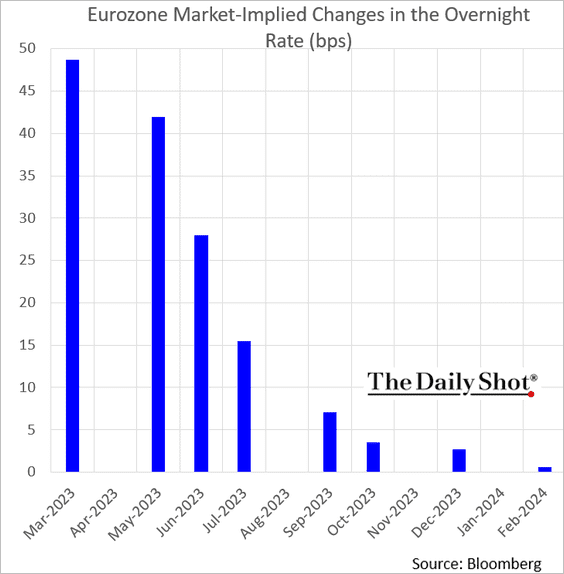
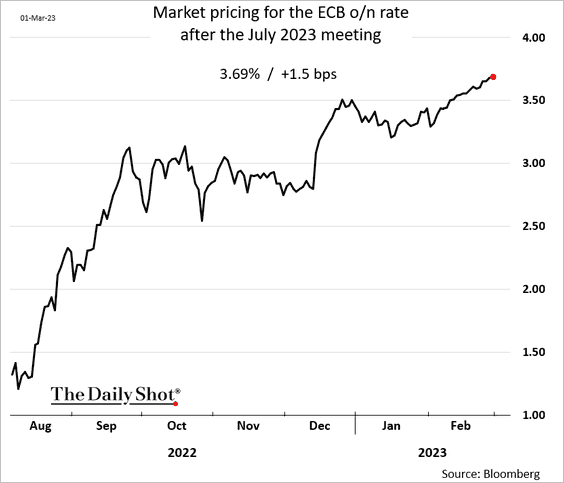
• The terminal rate is nearing 4%.
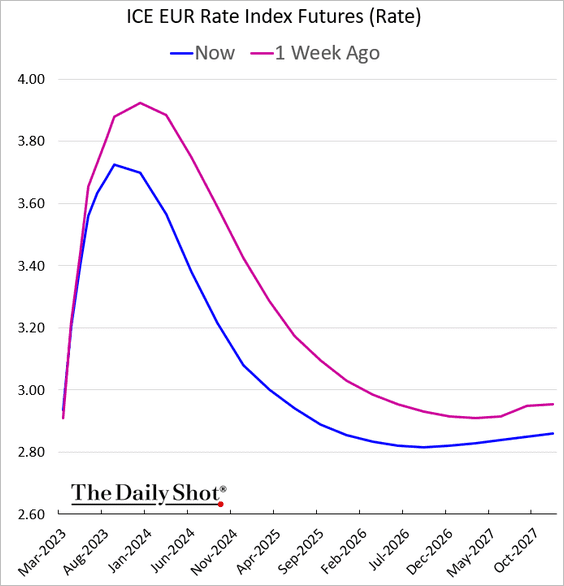
• Short-term rates continue to surge.
• The Bund curve is increasingly inverted.
——————–
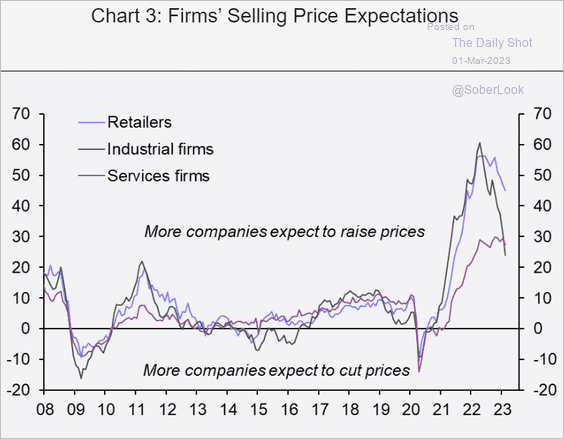
3. Many companies plan to keep boosting prices.
 Source: Capital Economics
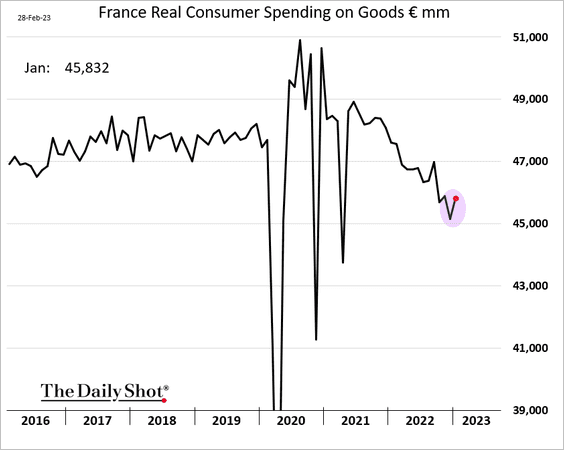
4. French consumer spending improved in January.
Back to Index
Europe
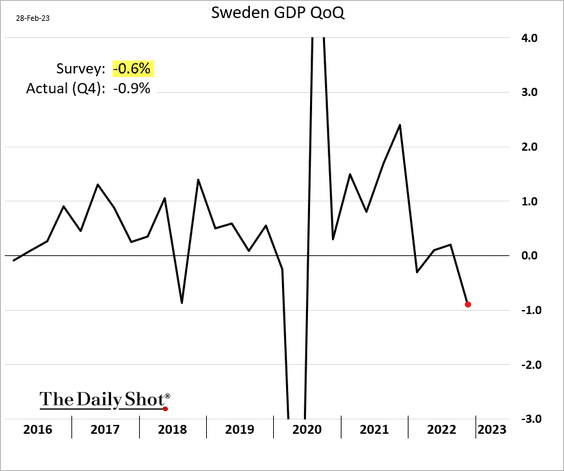
1. Sweden’s Q4 GDP report was ugly.
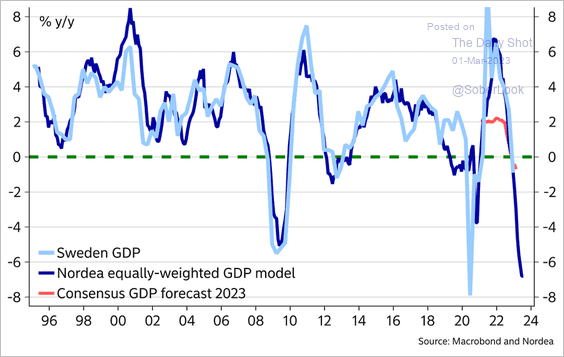
More pain ahead?
 Source: @MikaelSarwe
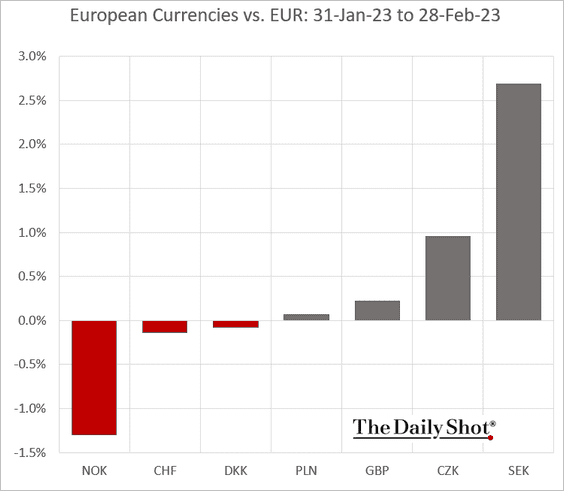
The Swedish krona outperformed in February.
——————–
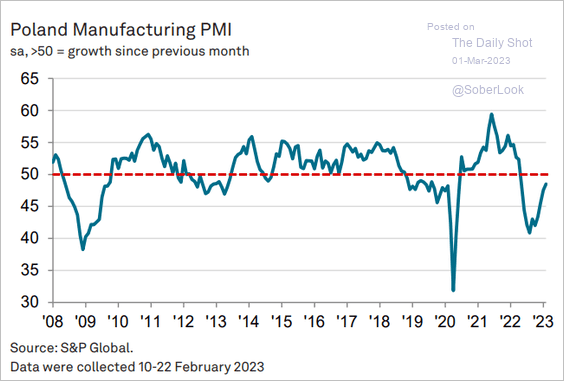
2. The contraction in Poland’s factory activity is slowing.
 Source: World Economics
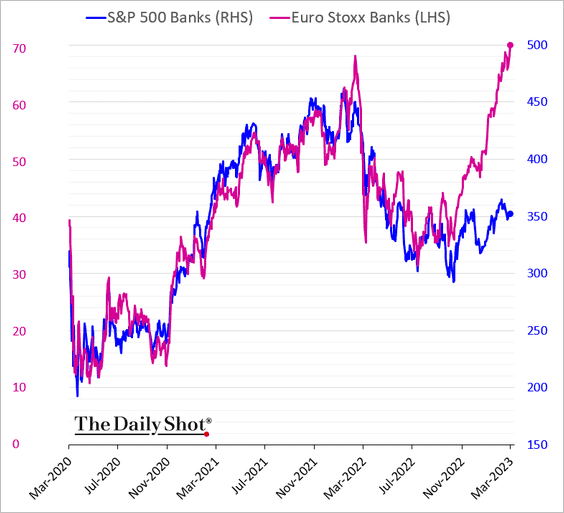
3. European bank shares have massively outperformed their US peers in recent months.
Back to Index
Asia – Pacific
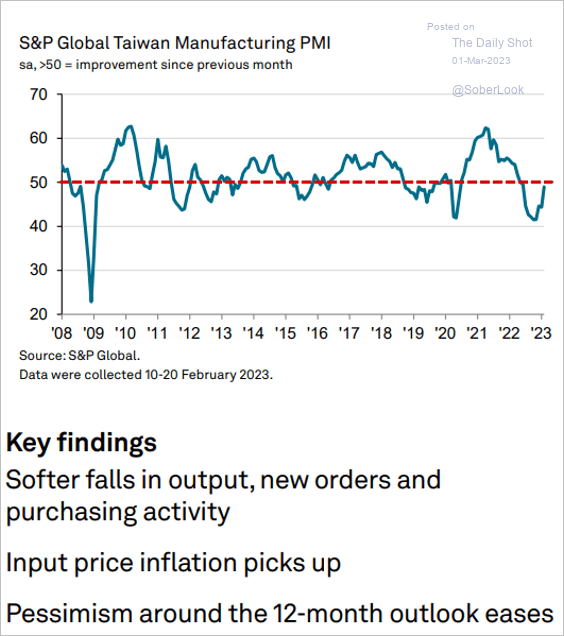
1. Taiwan’s manufacturing sector contraction is almost over.
 Source: S&P Global PMI
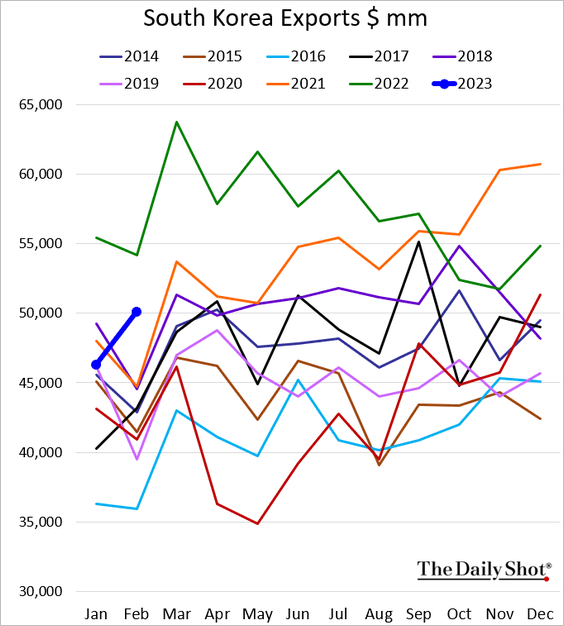
2. South Korea’s exports were relatively strong in February.
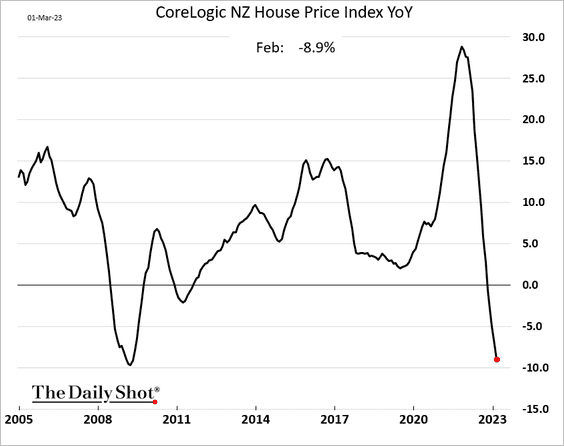
3. New Zealand’s home prices continue to fall.
 Source: Reuters Read full article
——————–
4. Next, we have some updates on Australia.
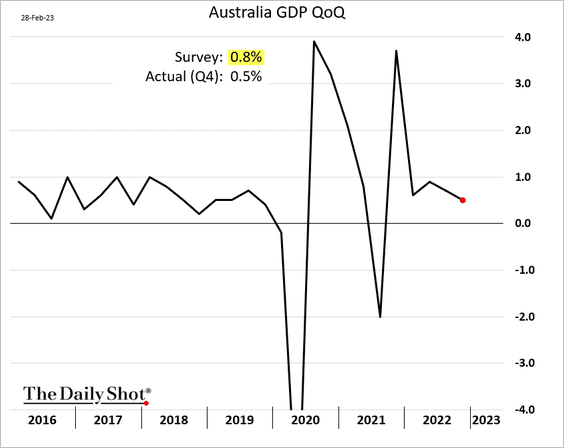
• The Q4 GDP report was disappointing.
 Source: ABC News Read full article
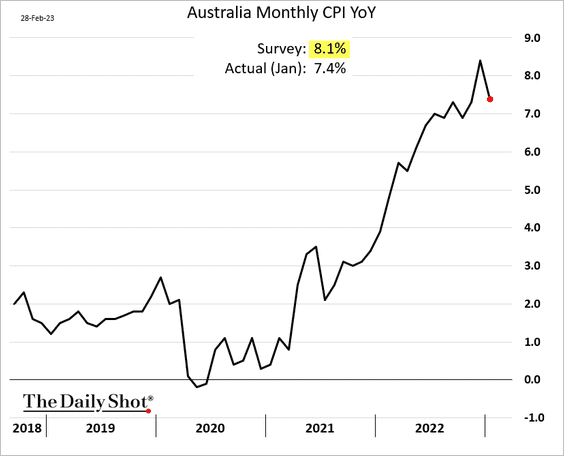
• The monthly inflation index appears to have peaked on a year-over-year basis.
 Source: The Guardian Read full article
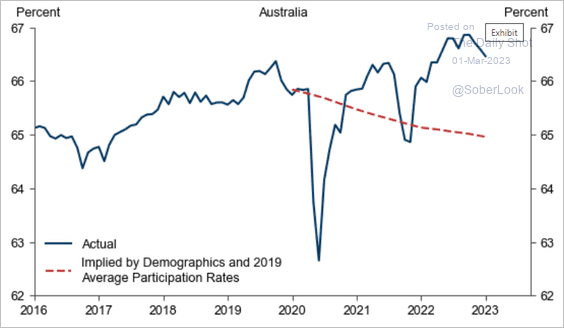
• Australia’s labor force participation is well above the level implied by the nation’s demographics.
 Source: Goldman Sachs
Back to Index
China
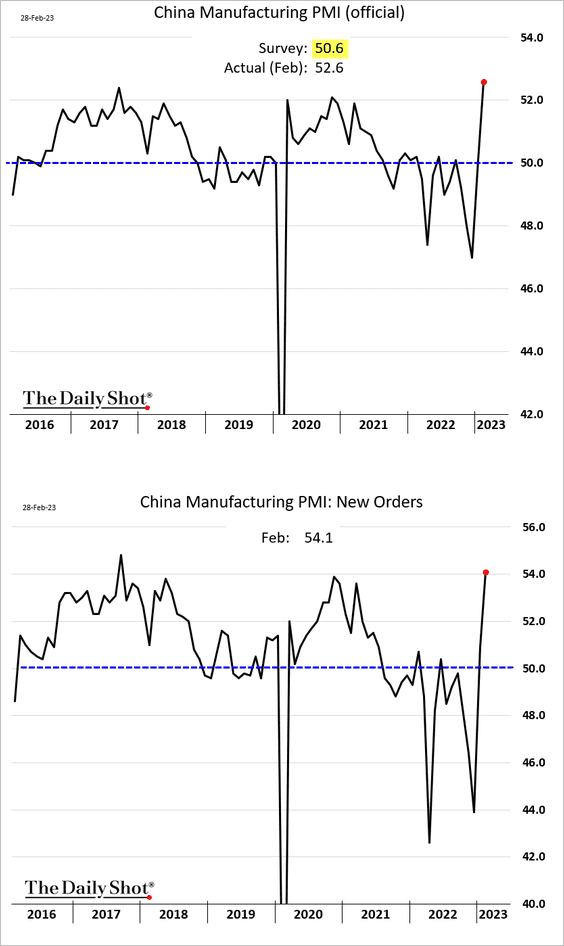
1. The official manufacturing PMI showed a massive factory activity surge in February.
 Source: Reuters Read full article
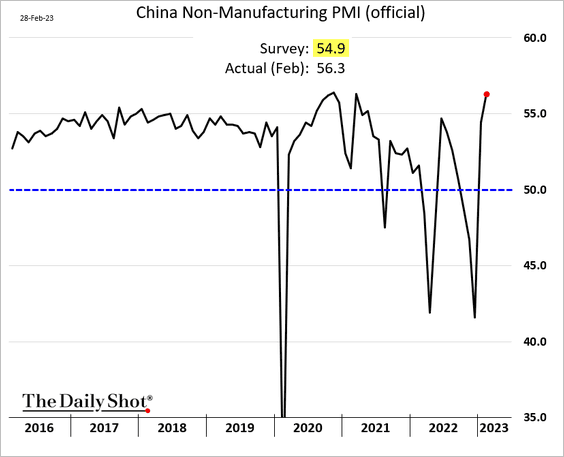
The non-manufacturing index is also very strong, topping expectations.
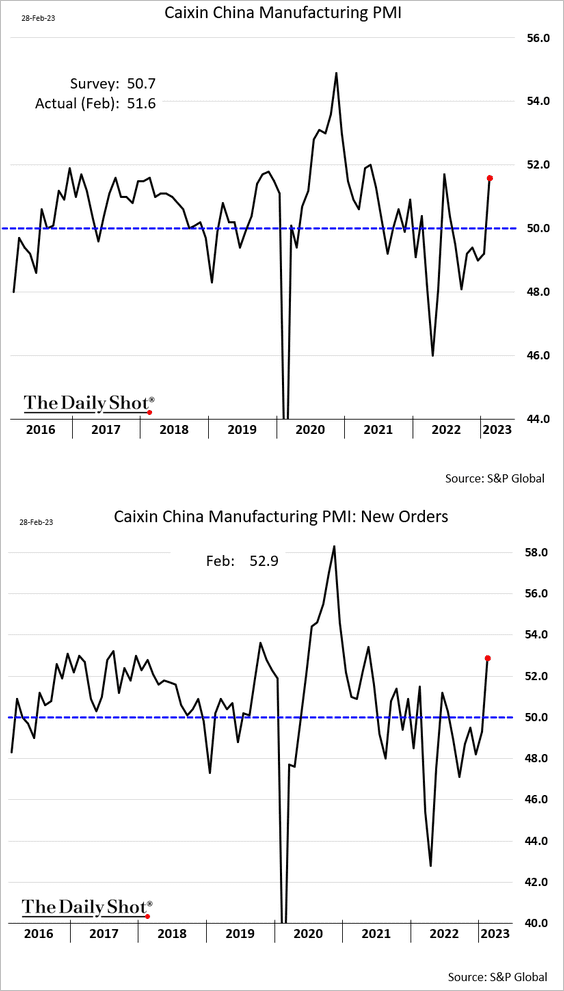
The private PMI index from S&P Global was less upbeat but also showed an acceleration in growth.
——————–
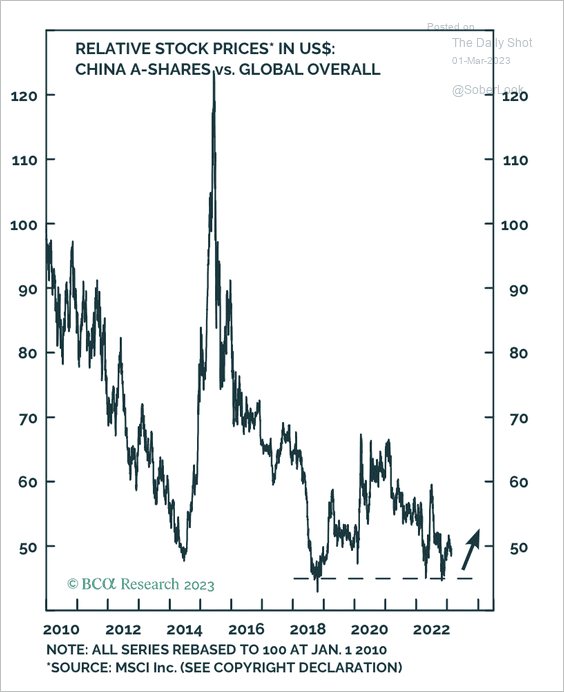
2. Chinese A-shares are holding long-term support relative to global stocks.
 Source: BCA Research
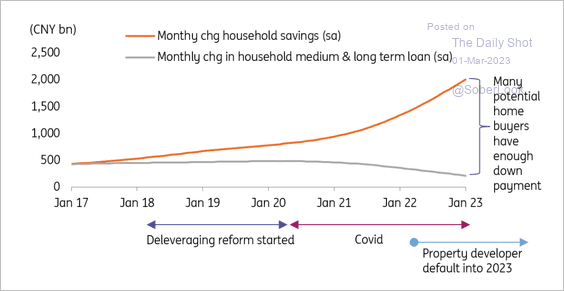
3. Potential homebuyers have saved enough for down payments.
 Source: ING
Back to Index
Emerging Markets
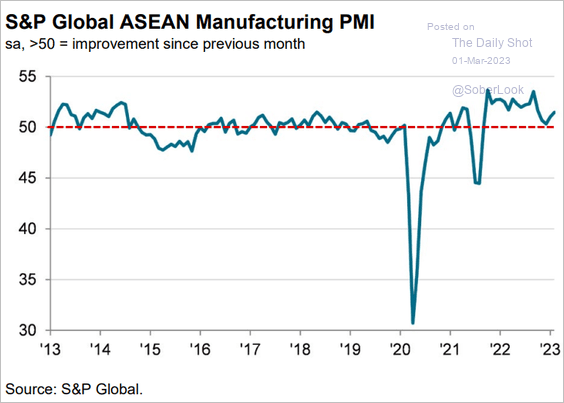
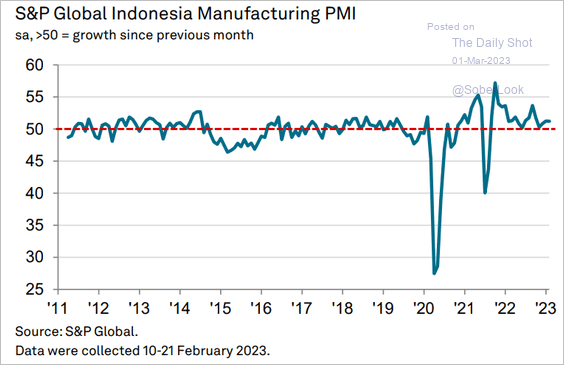
1. Let’s run through the Asian PMI data.
• ASEAN (improved growth):
 Source: S&P Global PMI
• Indonesia:
 Source: S&P Global PMI
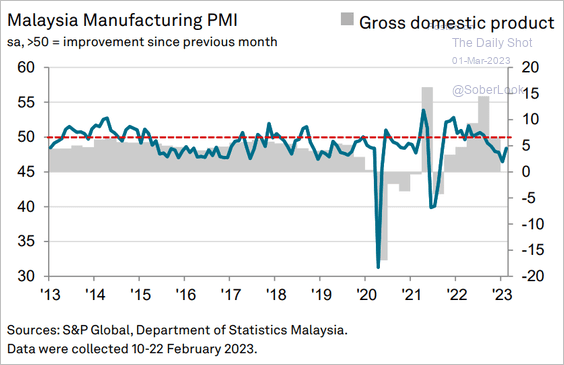
• Malaysia (still contracting):
 Source: S&P Global PMI
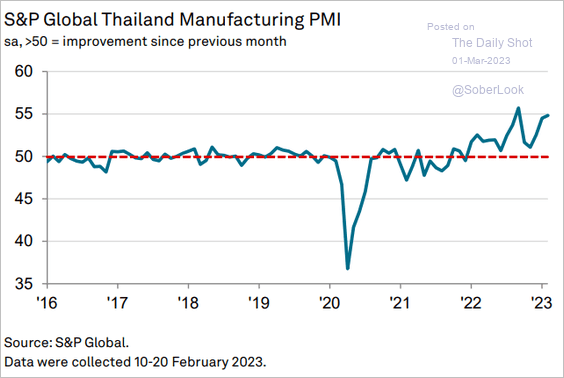
• Thailand (very strong):
 Source: S&P Global PMI
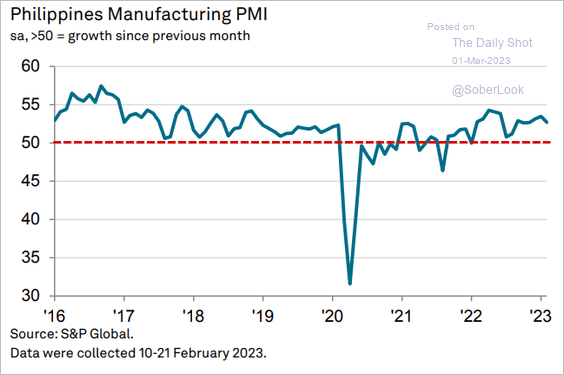
• The Philippines (still solid):
 Source: S&P Global PMI
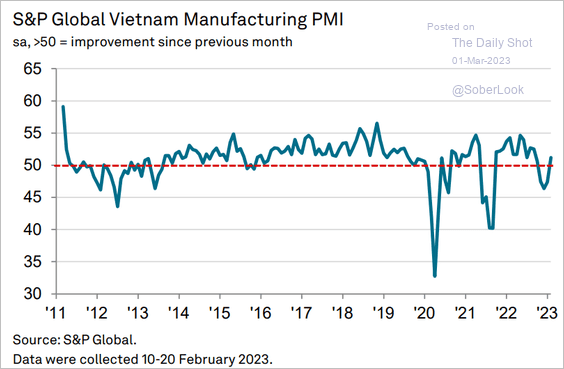
• Vietnam (back in growth territory):
 Source: S&P Global PMI
——————–
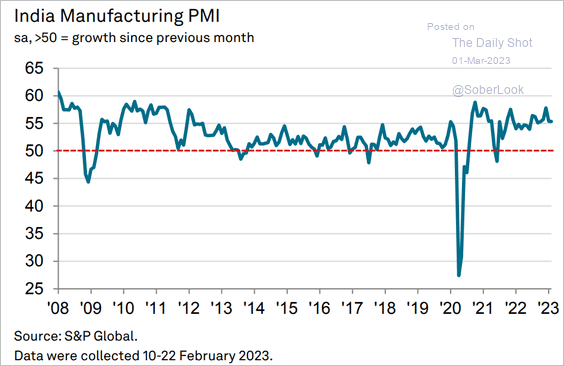
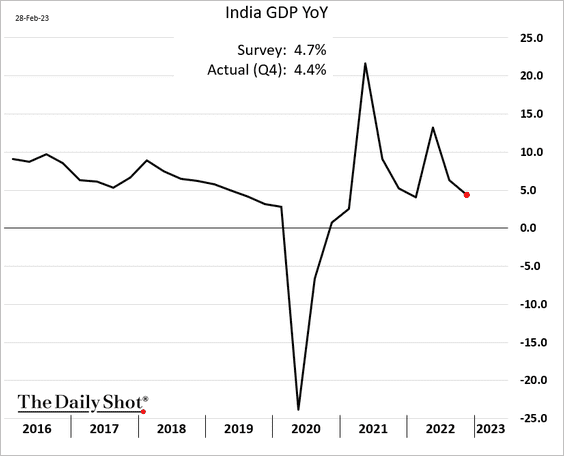
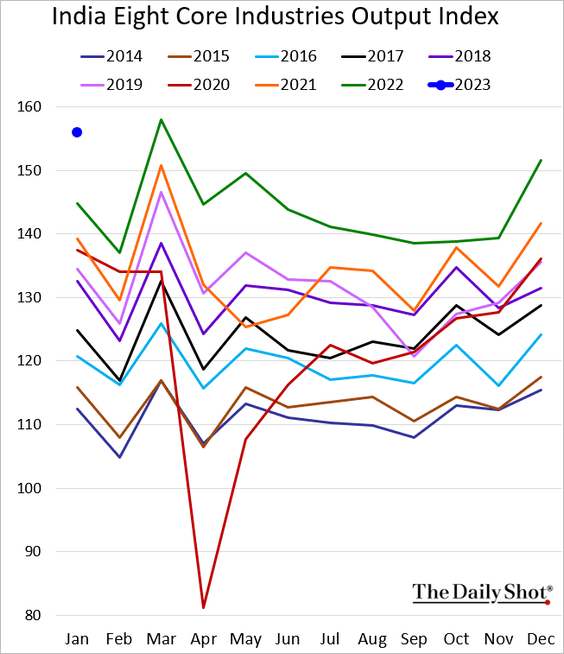
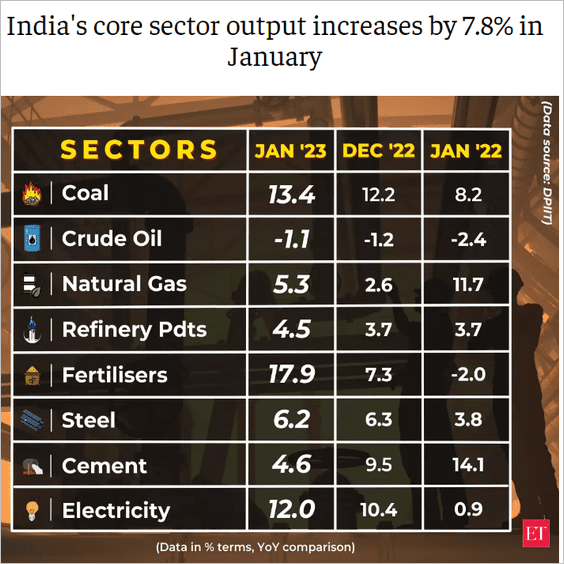
2. Next, we have some updates on India.
• Manufacturing growth is holding up well.
 Source: World Economics
• The GDP report was softer than expected.
 Source: @WSJ Read full article
But India still outpaced China.
 Source: NIKKEI Asia Read full article
• Core industries’ output was robust in January.
 Source: The Economic Times Read full article
• Government spending remains strong.
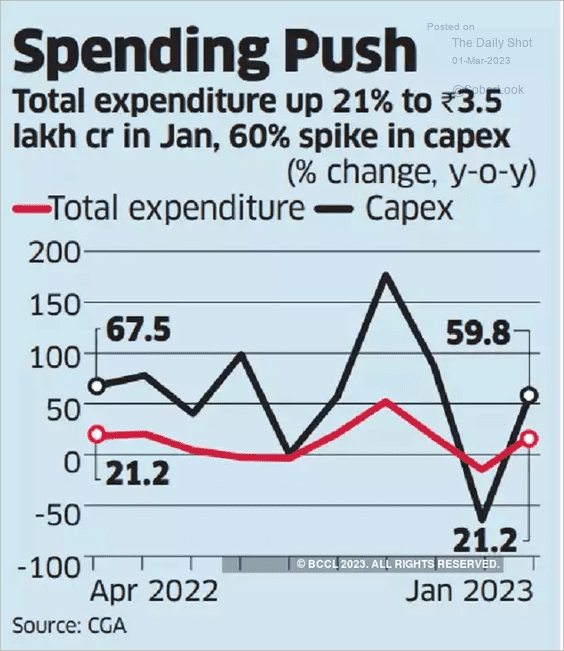 Source: The Economic Times Read full article
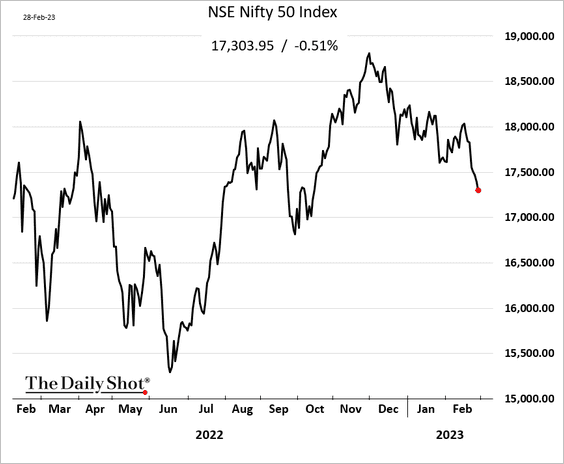
• The stock market has been struggling.
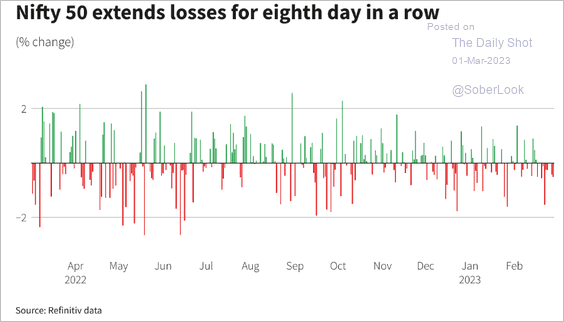 Source: Reuters Read full article
——————–
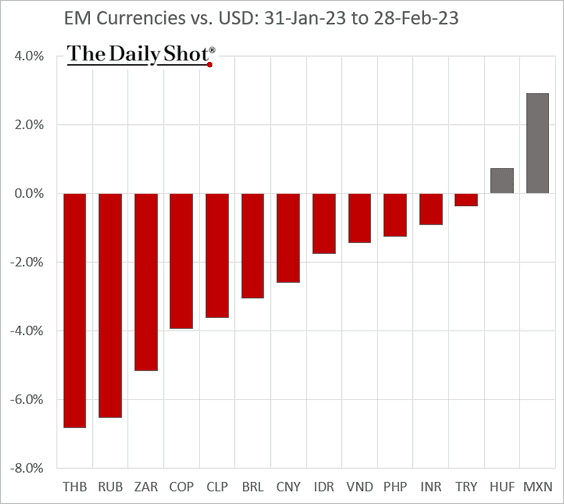
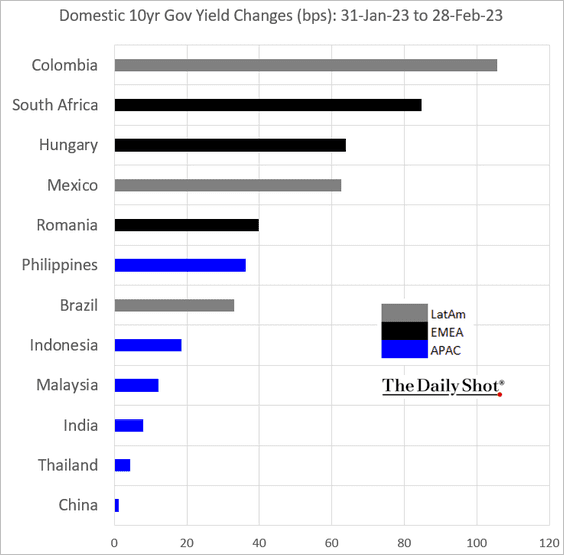
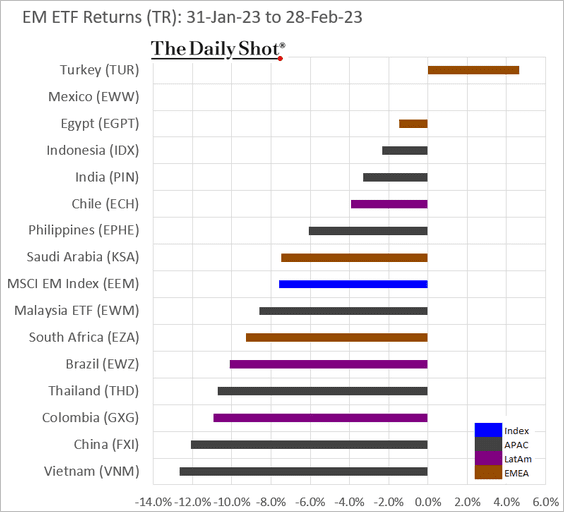
3. Finally, we have some performance data for February.
• Currencies:
• Bond yields:
• Equity ETFs:
Back to Index
Commodities
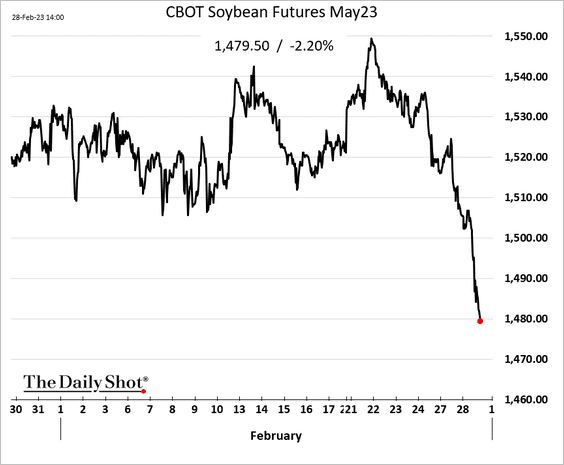
1. US soybean futures ended the month on a soft note.
 Source: Meredith Read full article
——————–
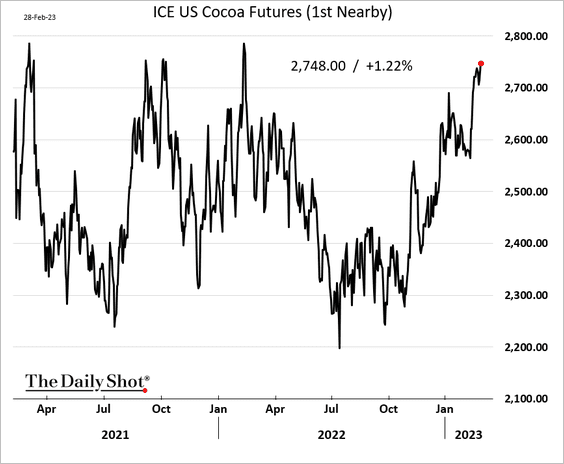
2. Cocoa futures have been rallying.
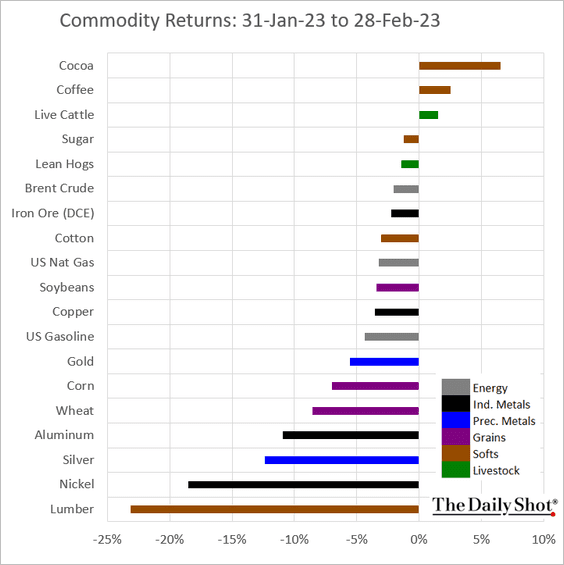
3. Here is the February performance across key commodity markets.
Back to Index
Energy
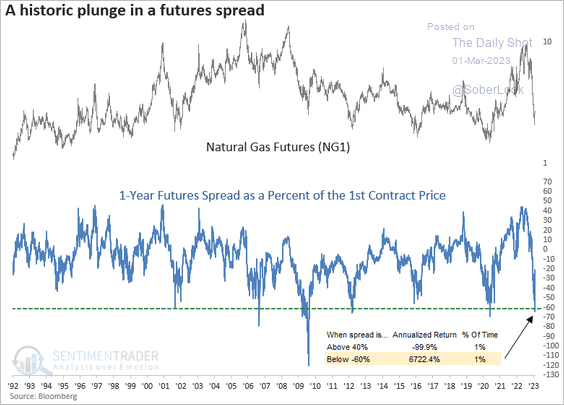
1. The one-year futures spread for Henry Hub Natural Gas plummeted below -60% and then reversed. Historically, natural gas has rallied after similar spread reversals.
 Source: SentimenTrader
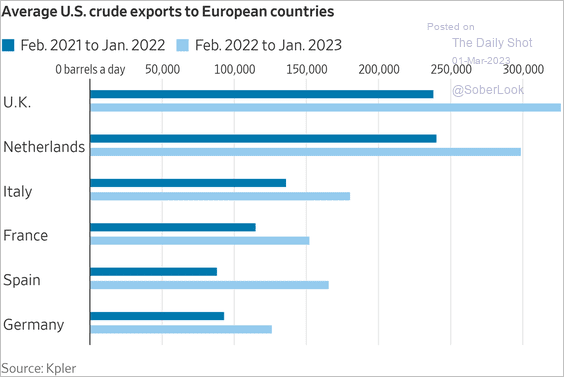
2. US crude oil exports to Europe increased substantially over the past 12 months.
 Source: @WSJ Read full article
Back to Index
Equities
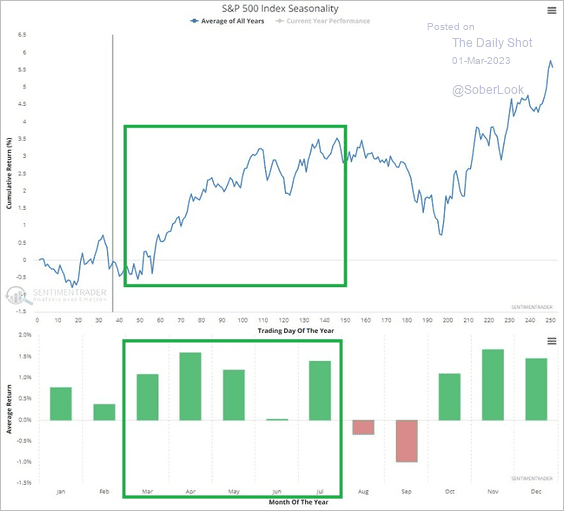
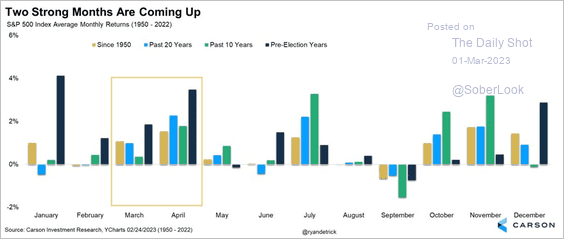
1. The S&P 500 is entering a seasonally strong period. (2 charts)
 Source: SentimenTrader
 Source: @RyanDetrick
——————–
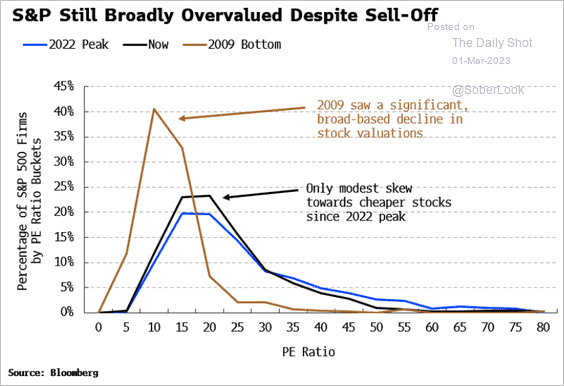
2. Stocks still look overvalued. Here is the distribution of P/E ratios for the S&P 500.
 Source: Simon White, Bloomberg Markets Live Blog
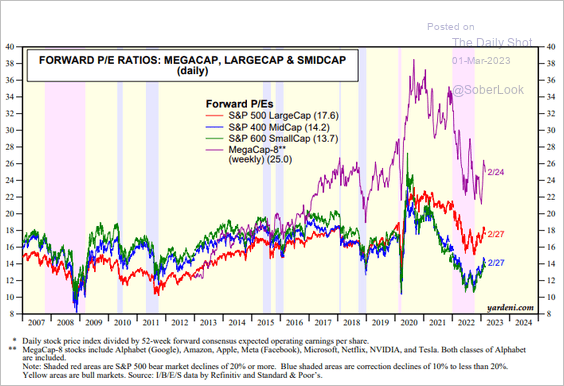
3. This chart shows P/E ratios for tech mega-caps, large caps, mid-caps, and small caps.
 Source: Yardeni Research
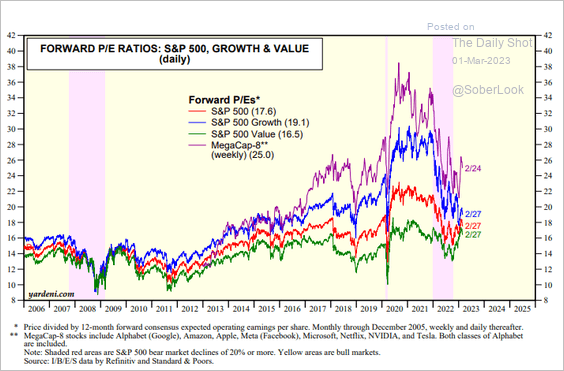
And here are the P/E ratios for growth and value factors.
 Source: Yardeni Research
——————–
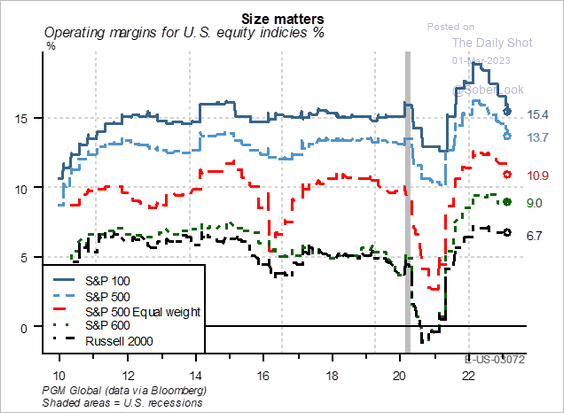
4. Larger firms have been running higher operating margins.
 Source: PGM Global
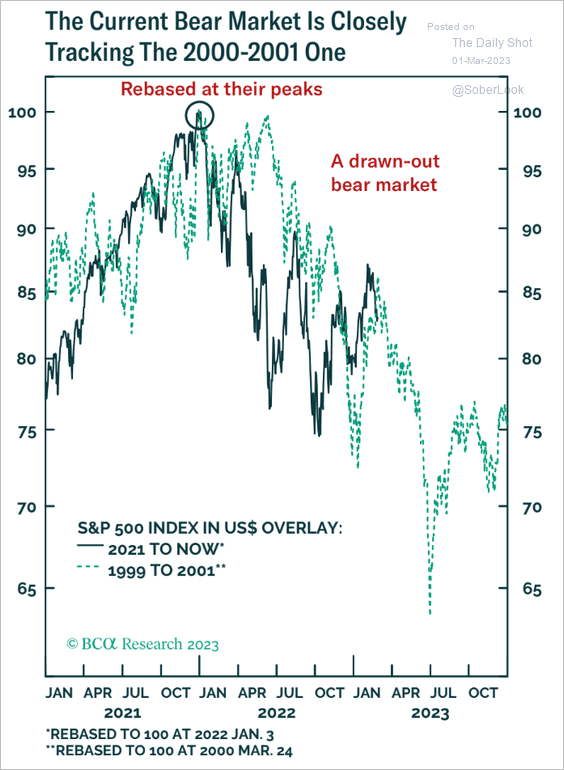
5. The dot-com analog remains in play.
 Source: BCA Research
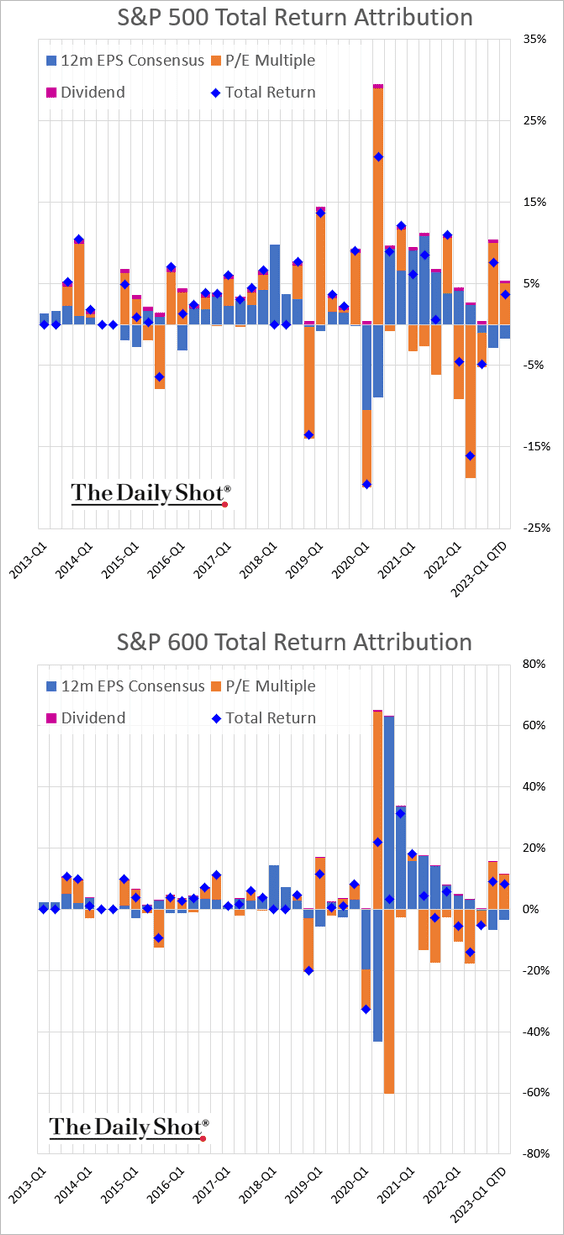
6. Here is the quarterly performance attribution for US large and small caps (through the end of February).
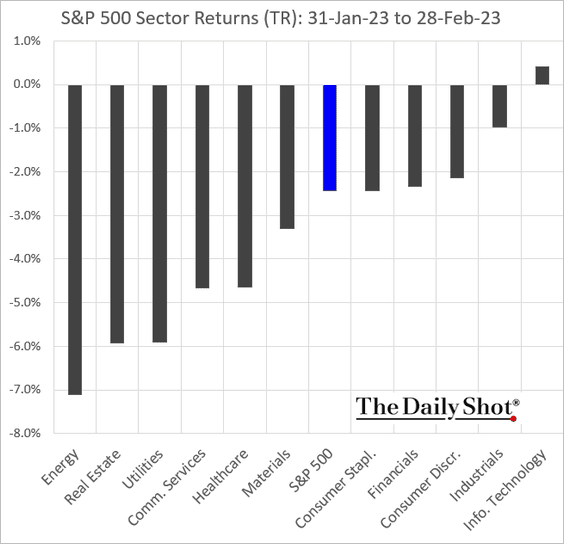
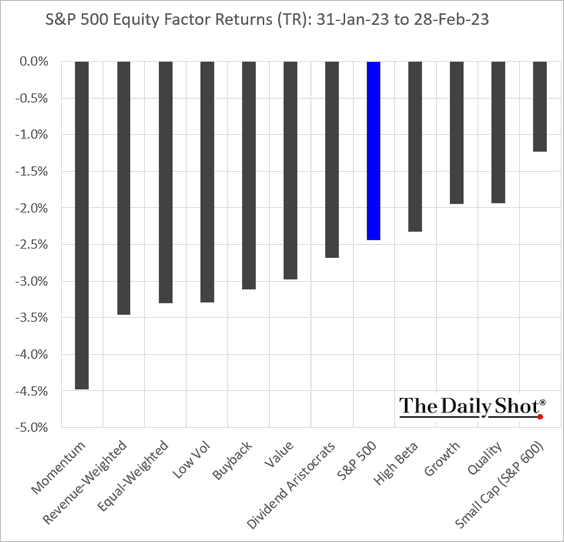
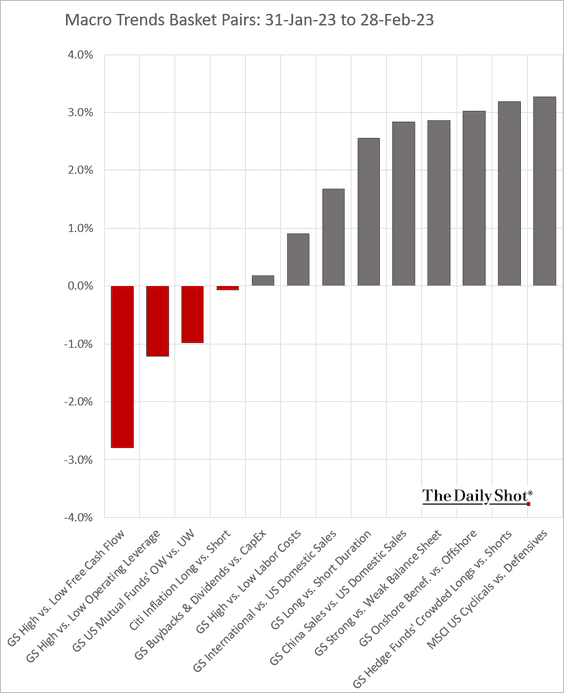
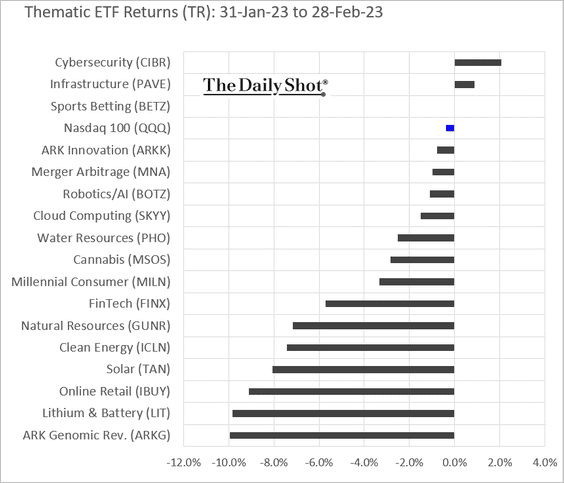
7. Finally, we have performance metrics for the month of February.
• Sectors:
• Equity factors:
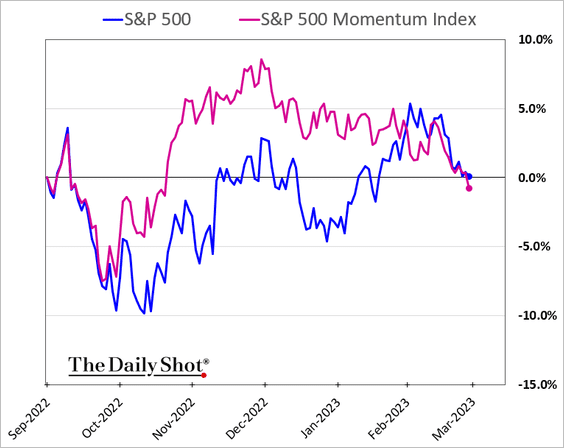
The momentum factor has given up its recent outperformance.
• Macro basket pairs:
• Thematic ETFs:
• Largest US tech firms:
Back to Index
Credit
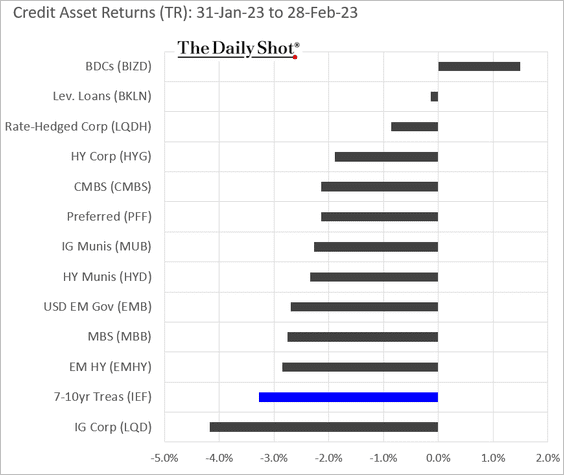
This chart shows credit performance by asset class in February. The weakness was driven by higher Treasury yields.
Back to Index
Rates
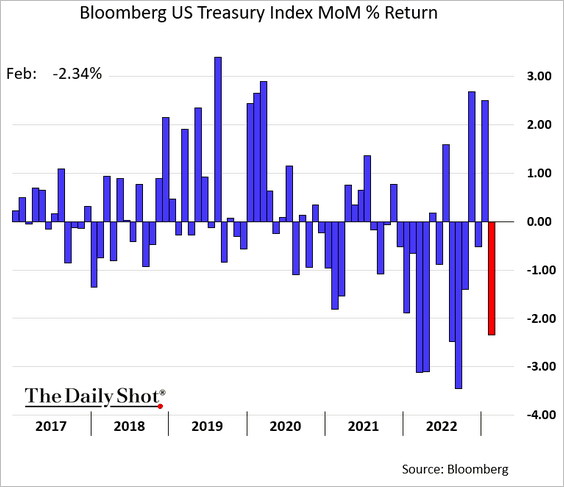
1. With inflation still running hot, Treasuries tumbled in February.
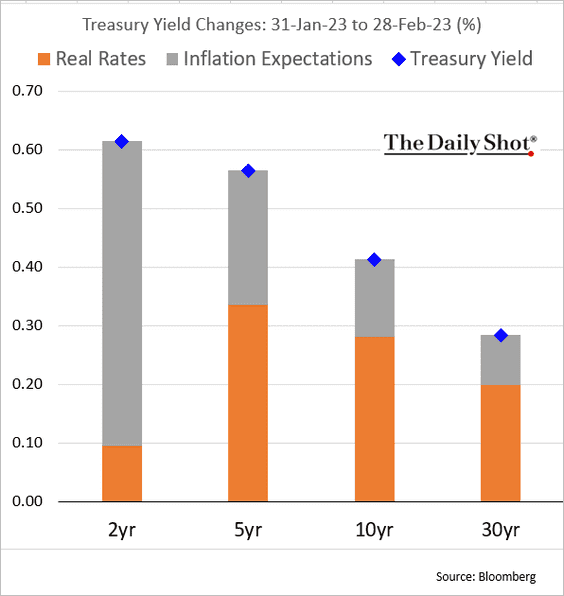
Here is the attribution of yield changes.
——————–
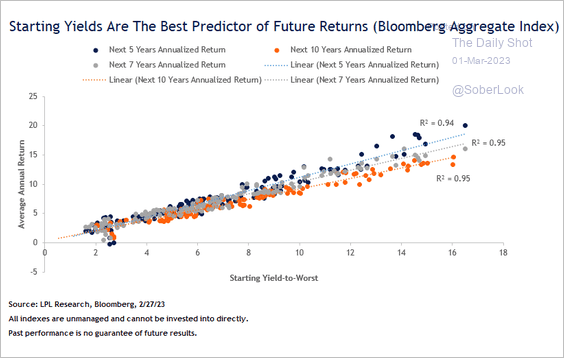
2. Starting yields are a good predictor of longer-term bond returns.
 Source: LPL Research
Back to Index
Global Developments
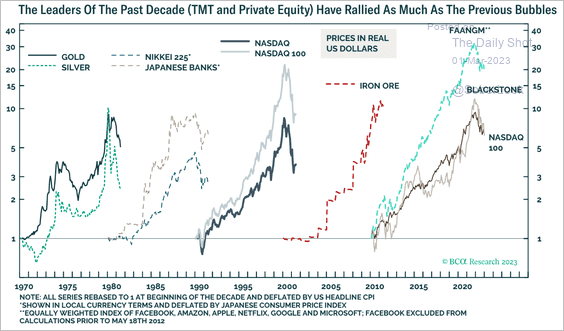
1. This chart shows “bubble” leaders in each cycle.
 Source: BCA Research
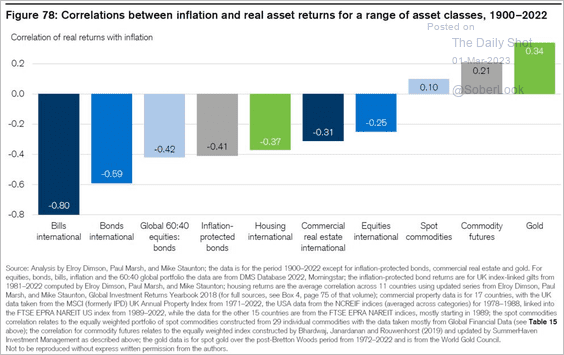
2. How correlated are real long-term asset returns to inflation?
 Source: @jessefelder, @johnauthers Read full article
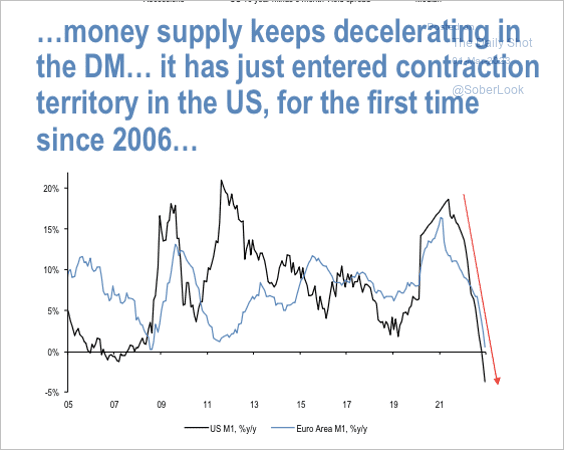
3. Money supply keeps decelerating in the US and euro area.
 Source: JP Morgan Research
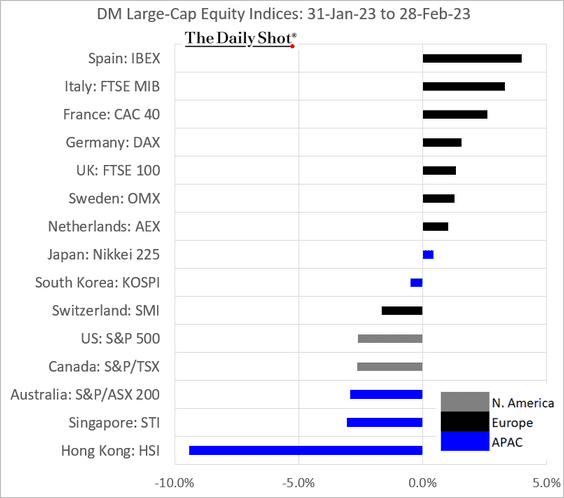
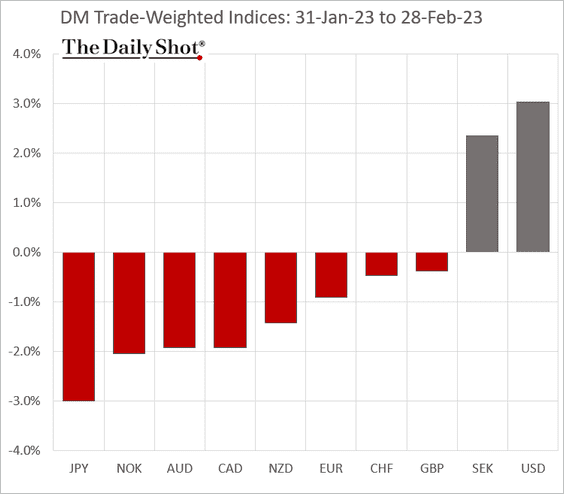
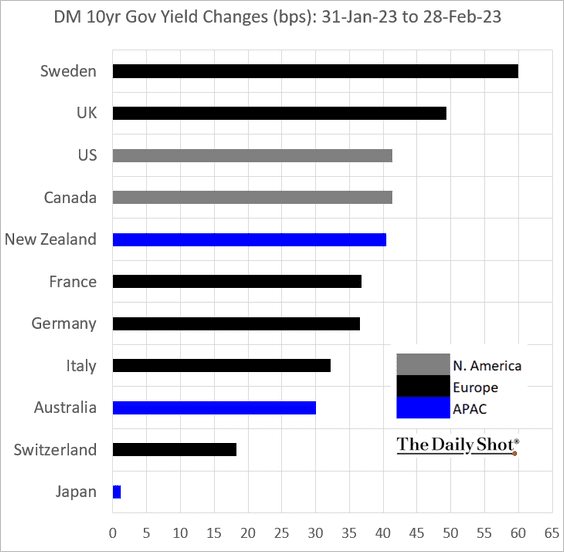
4. Next, we have some DM performance data for February.
• Large-cap equity indices:
• Trade-weighted currency indices:
• Bond yields:
——————–
Food for Thought
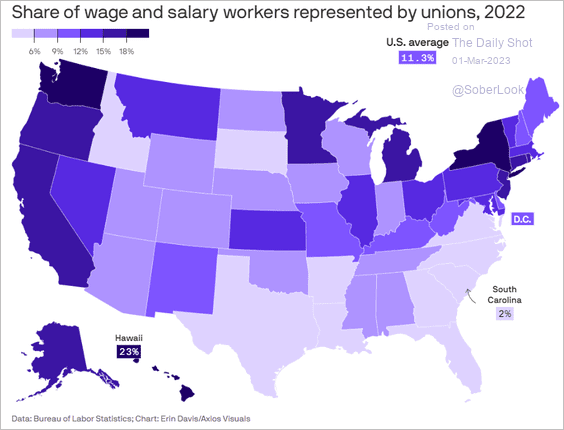
1. Union membership by state:
 Source: @axios Read full article
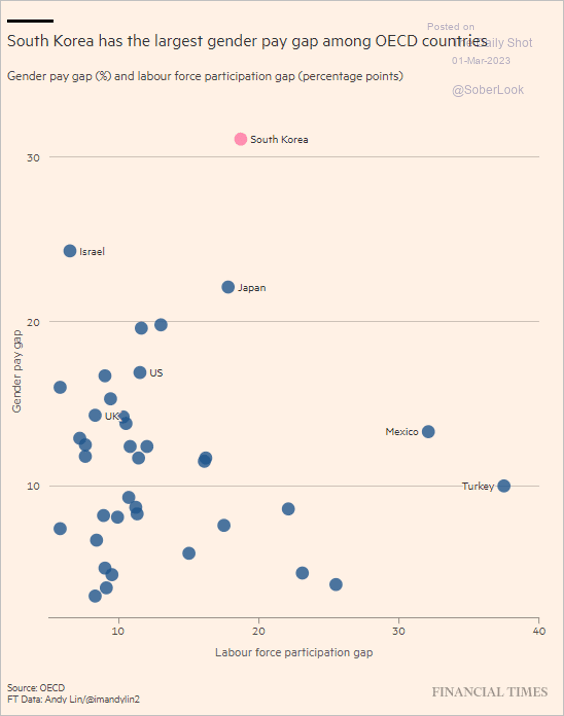
2. Gender pay and labor force participation gaps globally:
 Source: @financialtimes Read full article
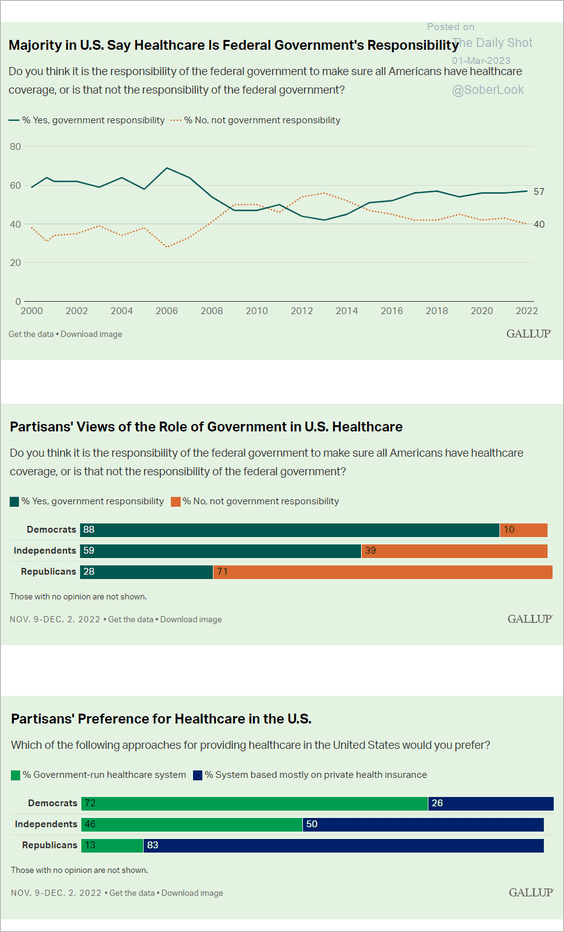
3. Views on US government’s role in healthcare:
 Source: Gallup Read full article
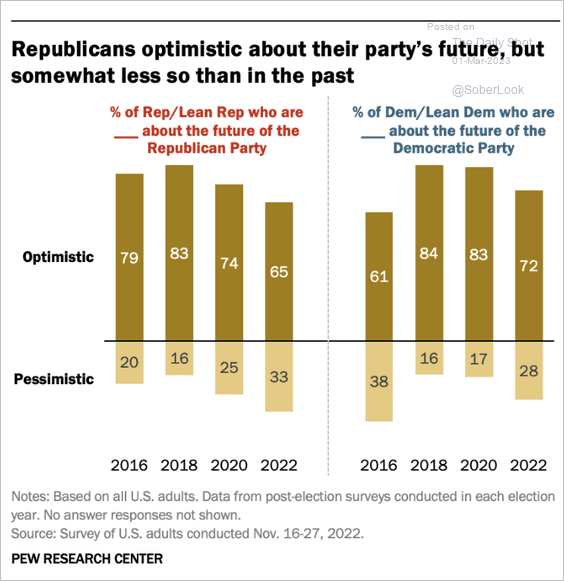
4. Americans’ views on their political party’s future:
 Source: Pew Research Center Read full article
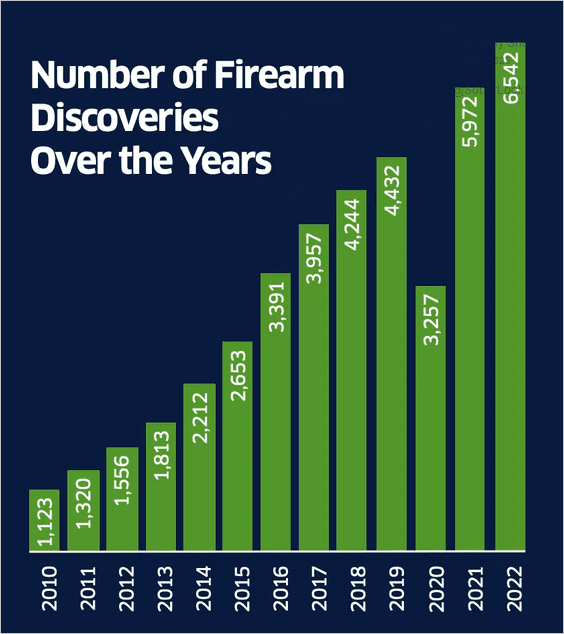
5. TSA firearm discoveries at security checkpoints:
 Source: @axios Read full article
6. Targets of terror attacks:
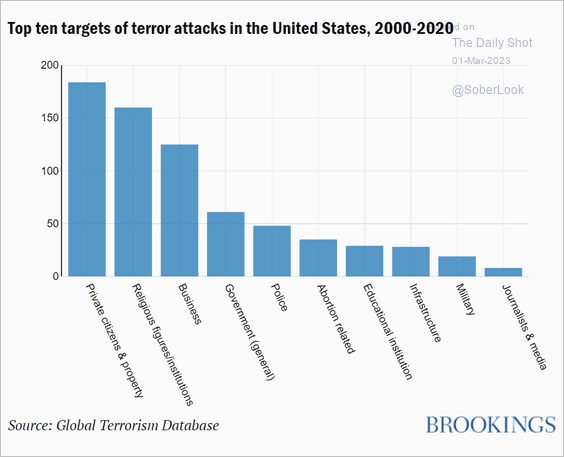 Source: Brookings Read full article
7. Rockets that NASA and SpaceX plan to send to the moon:
 Source: The Washington Post Read full article
——————–
Back to Index
