
The Daily Shot: 03-Mar-23
• The United States
• The Eurozone
• Europe
• Japan
• Asia – Pacific
• China
• Emerging Markets
• Cryptocurrency
• Energy
• Equities
• Rates
• Food for Thought
The United States
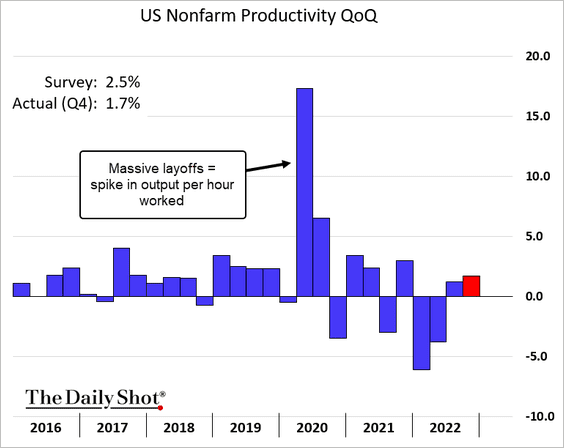
1. The Q4 unit labor costs were revised higher, …
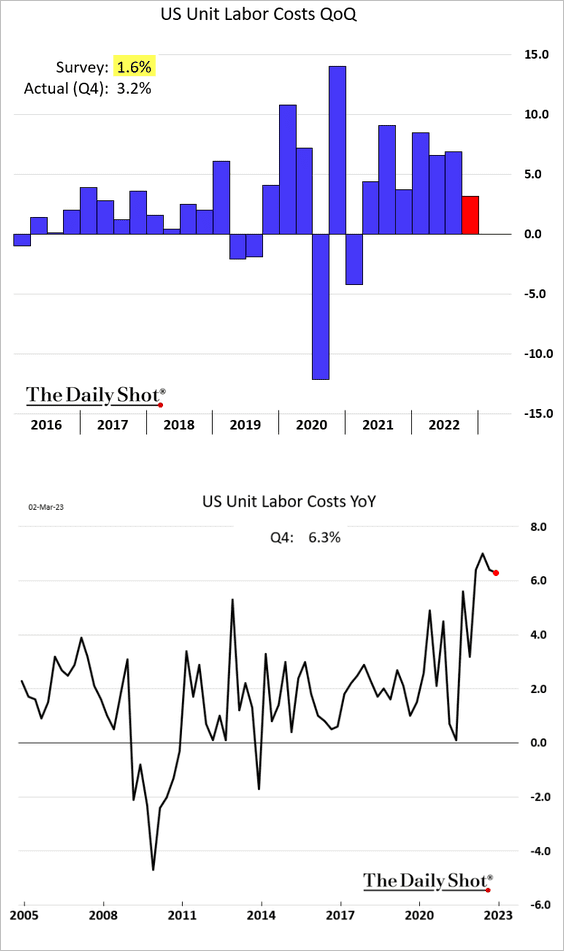
… while productivity growth was downgraded.
 Source: Reuters Read full article
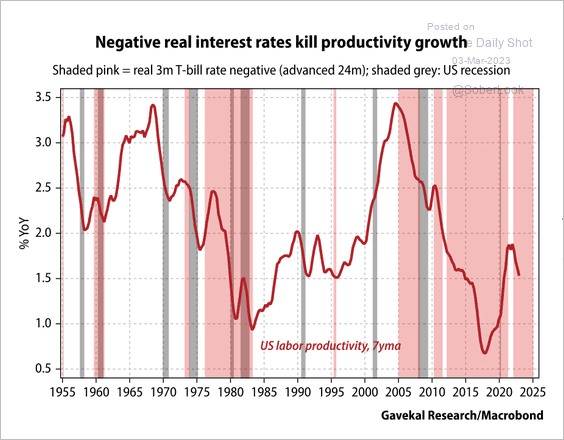
By the way, weak labor productivity has coincided with negative real interest rate environments.
 Source: Gavekal Research
——————–
2. Next, we have some updates on the labor market.
• Initial jobless claims continue to signal tightness in the labor market.
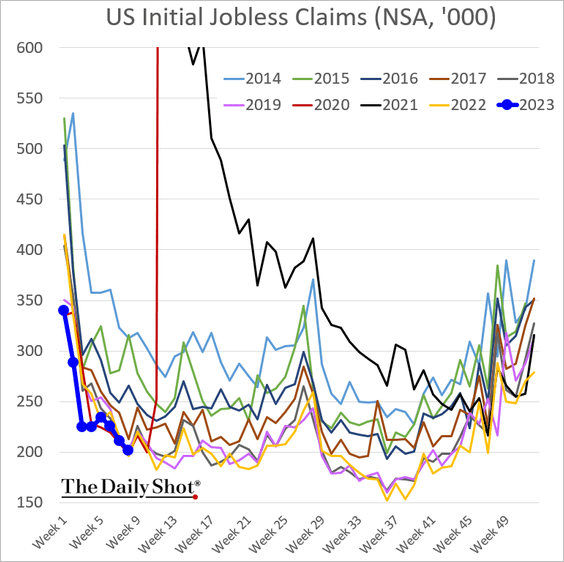
– Continuing claims are now running slightly above last year’s levels.
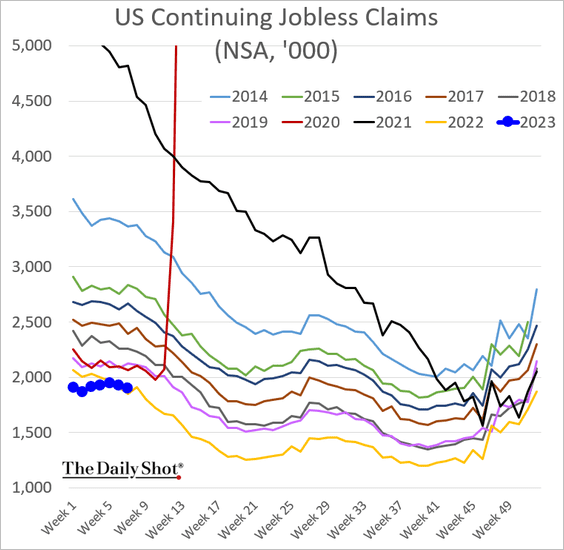
– Pantheon Macroeconomics expects jobless claims to rise in the coming months.
 Source: Pantheon Macroeconomics
• The ISM Manufacturing PMI is pointing to slower hiring ahead.
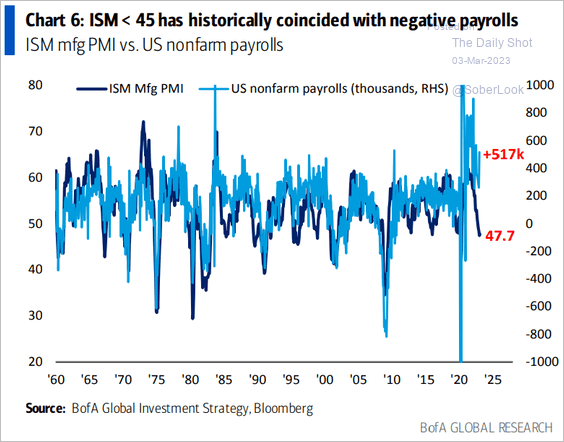 Source: BofA Global Research
• This chart shows the number of companies mentioning “labor shortages” on earnings calls.
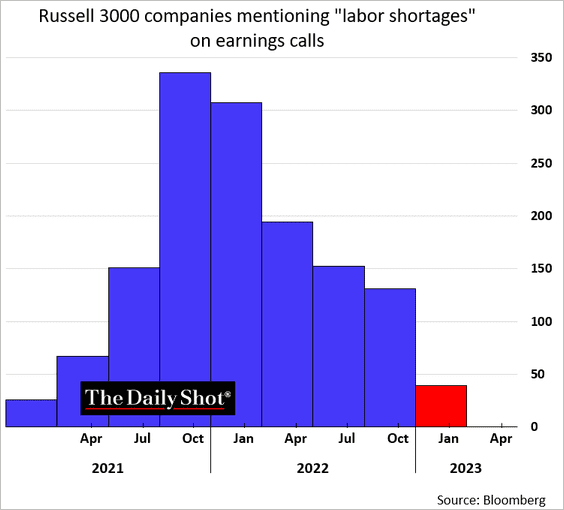 h/t @ValerieTytel
• High-frequency indicators continue to signal gradual declines in job openings.
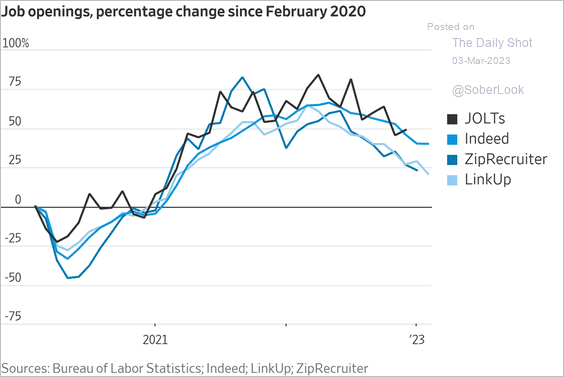 Source: @WSJ Read full article
• More workers will receive a minimum wage increase.
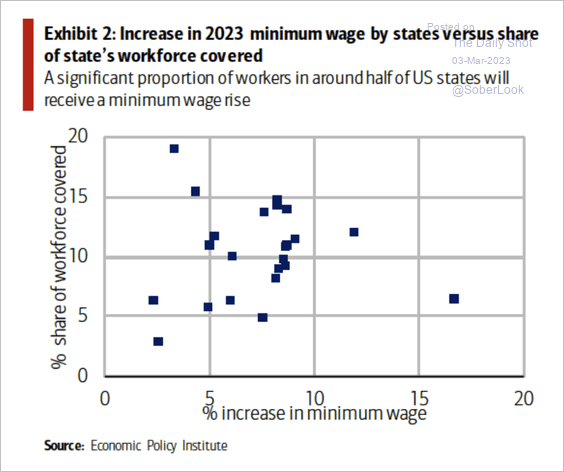 Source: Economic Policy Institute; SOM Macro Strategies
• Many Americans opt for part-time employment, not out of necessity but by choice.
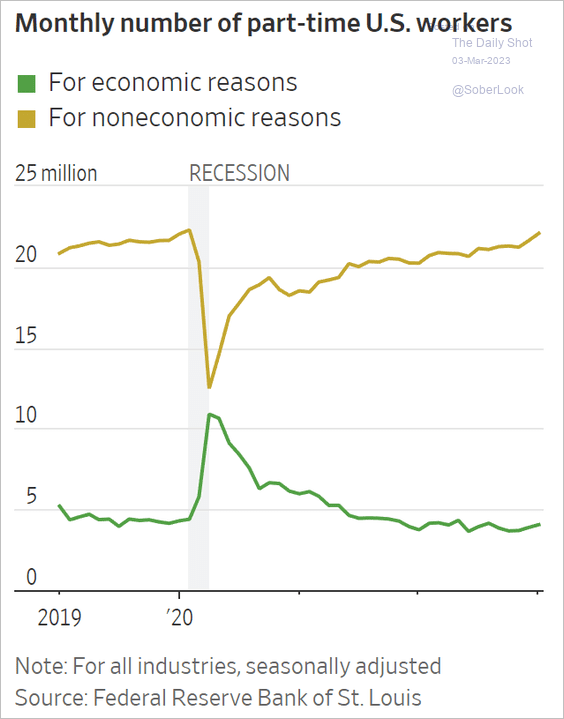 Source: @WSJ Read full article
——————–
3. Next, let’s take a look at some patterns in consumer financial health and spending.
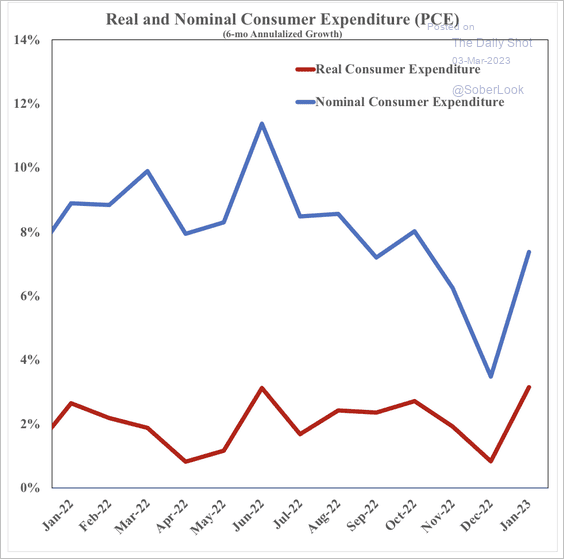
• Real wage growth remains close to 3%, supporting real consumption of over 2%. (2 charts)
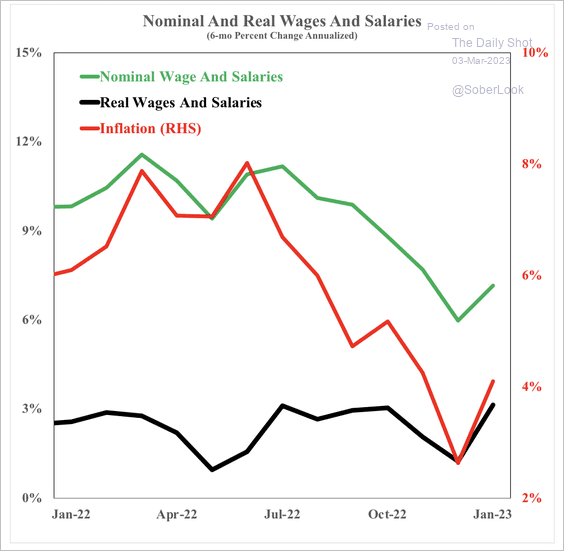 Source: SOM Macro Strategies
 Source: SOM Macro Strategies
• Credit card and subprime auto loan delinquencies have been rising.
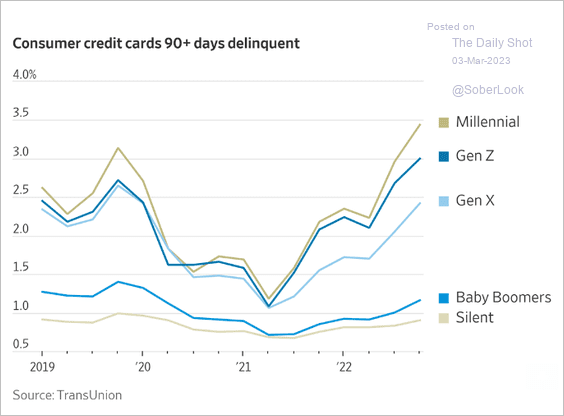 Source: @WSJ Read full article
This chart shows the increase in negative equity on vehicles.
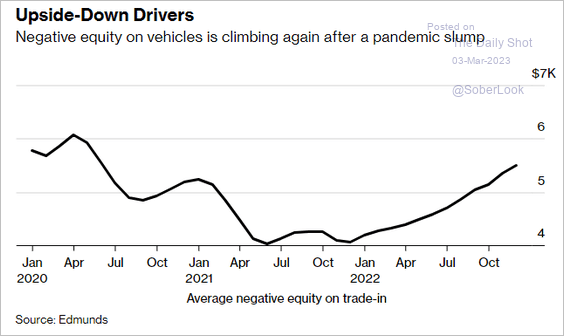 Source: @PaigeSmithNews, @msasso, @business Read full article
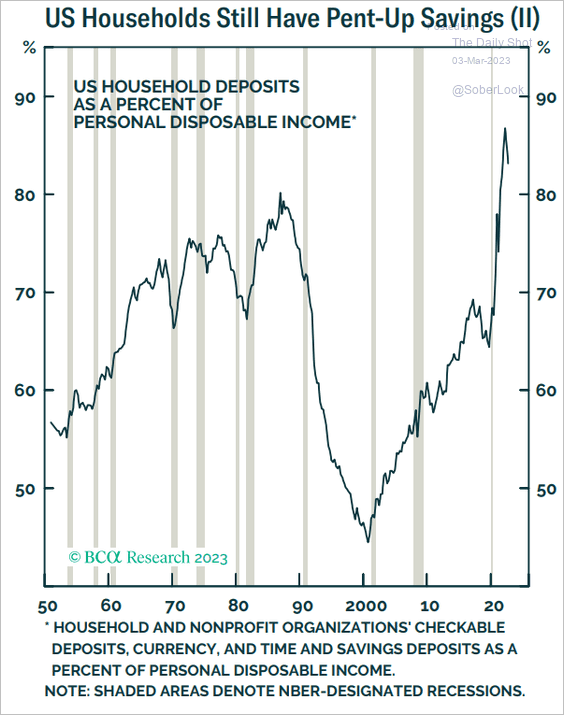
• Low-income households are facing financial pressures from inflation and relying on credit cards for necessities, leading to higher delinquencies. Meanwhile, higher-income households are driving much of the spending in the US and maintaining healthy savings.
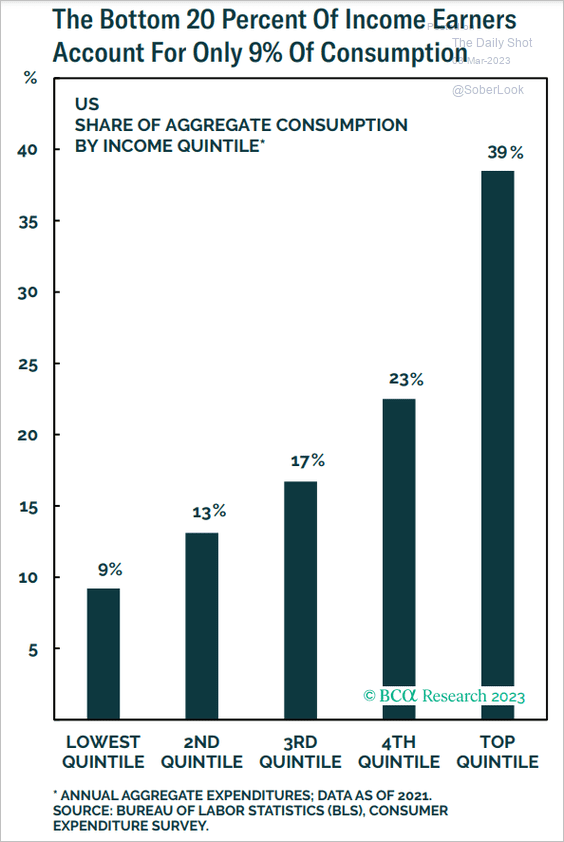 Source: BCA Research
 Source: BCA Research
——————–
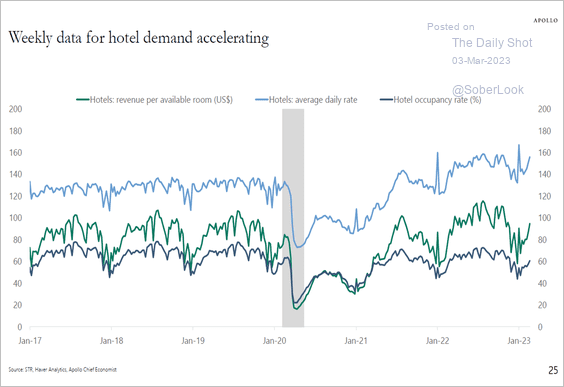
4. Hotel demand has been strong.
 Source: Torsten Slok, Apollo
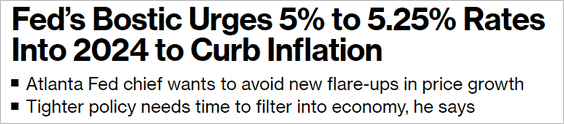
5. Fed’s Bostic calmed the markets by mentioning a 5% – 5.25% terminal rate (below market-implied levels). Stocks rebounded.
 Source: @SteveMatthews12, @economics Read full article
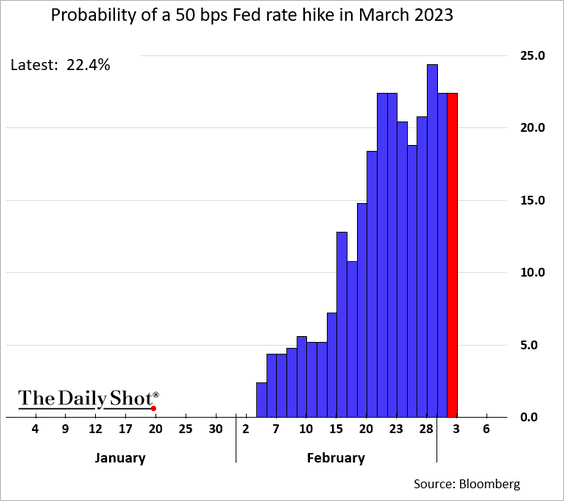
• The probability of a 50 bps rate hike this month (instead of 25 bps) remains above 20%.
• The real Fed Funds rate has overshot its long-term downtrend, indicating highly restrictive monetary policy.
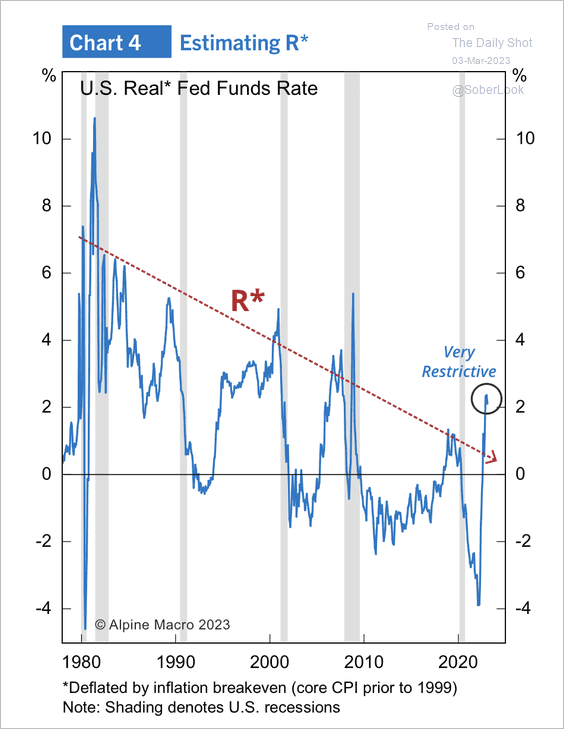 Source: Alpine Macro
——————–
6. A further slowdown ahead for the US money supply growth?
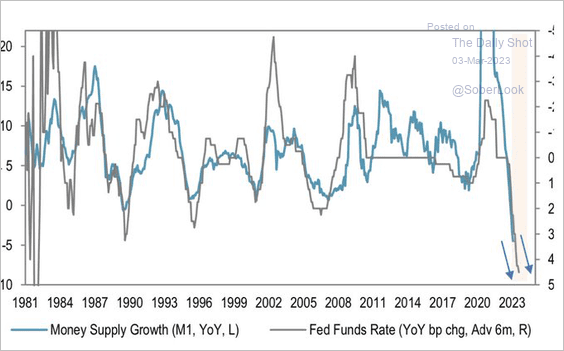 Source: @MichaelKantro
Back to Index
The Eurozone
1. As with other inflation reports, Italy’s CPI topped expectations.
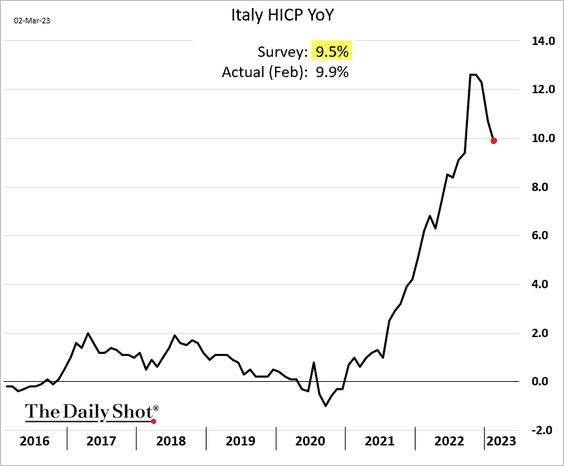
• At the Eurozone level, the headline inflation is off the peak but remains above 8%.
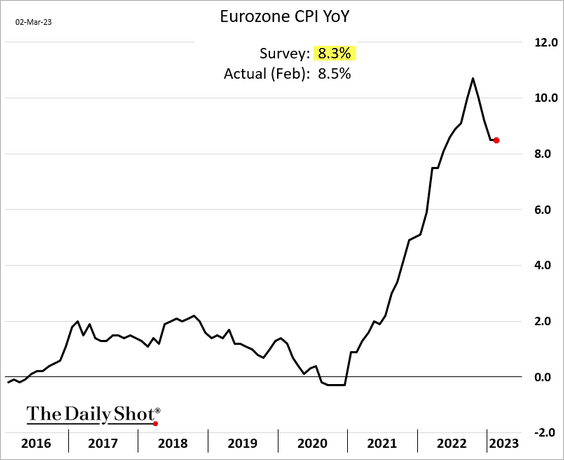
• A more worrying trend is the core CPI, which hit a record high.
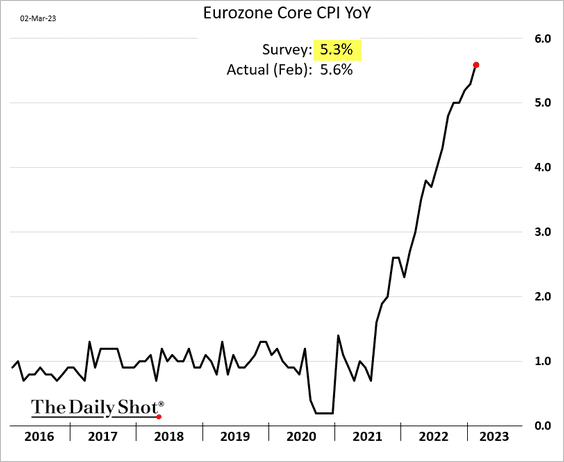
 Source: @WSJ Read full article
• Here are the CPI components.
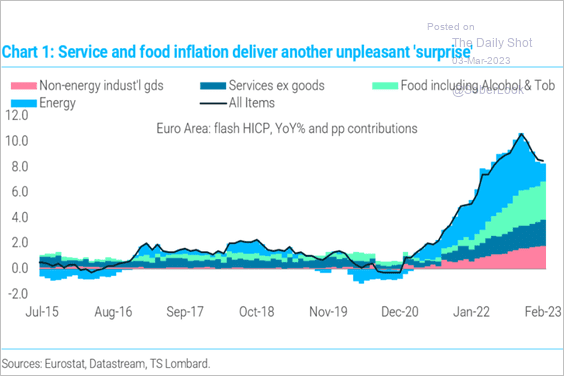 Source: TS Lombard
• And this chart shows Germany’s goods and services inflation.
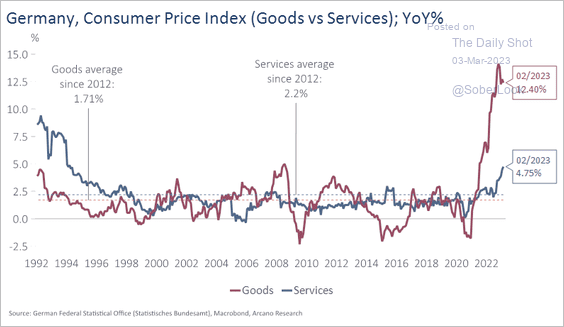 Source: Arcano Economics
——————–
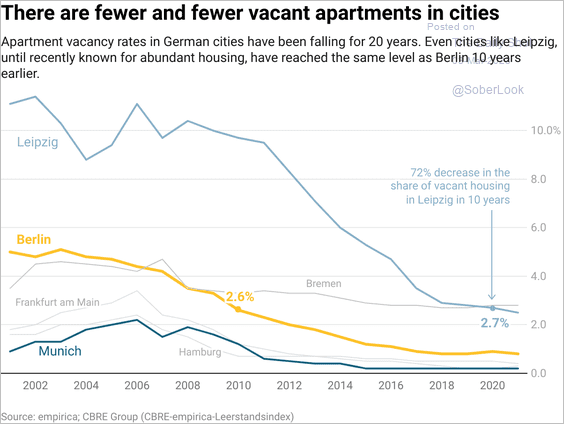
4. Germany’s Pfandbriefe yields hit the highest level since 2011, which is driving up mortgage rates and hurting housing affordability.
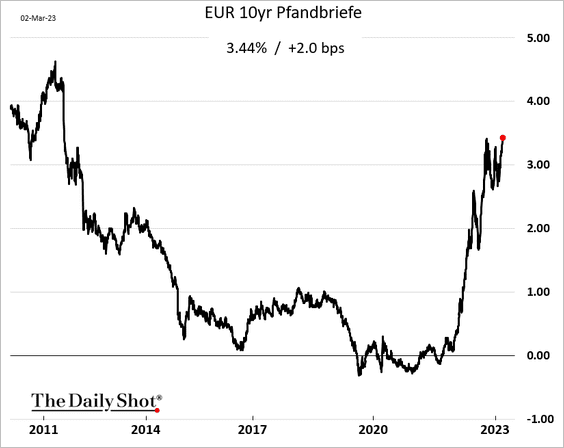
Will the rental market now become even tighter?
 Source: @Datawrapper
——————–
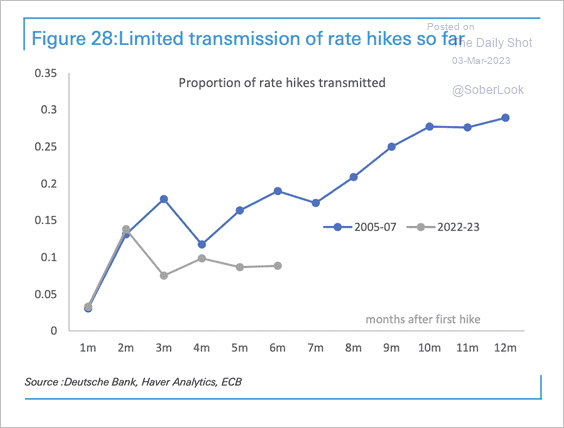
5. So far, there has been a limited transmission of rate hikes in the Eurozone compared with the 2005 cycle. This is due to excess liquidity and low competition for deposits, according to Deutsche Bank. (2 charts)
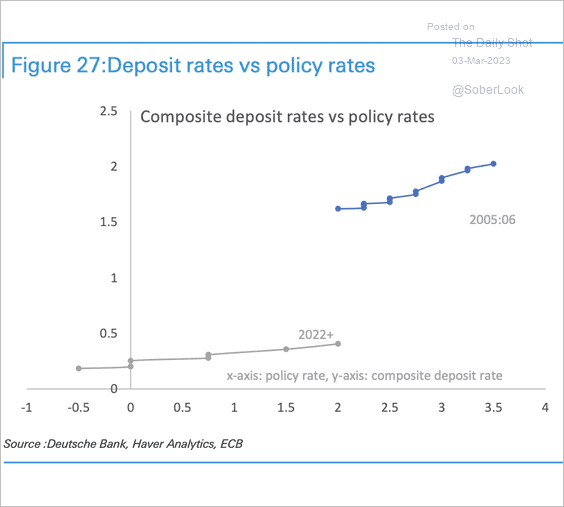 Source: Deutsche Bank Research
 Source: Deutsche Bank Research
Back to Index
Europe
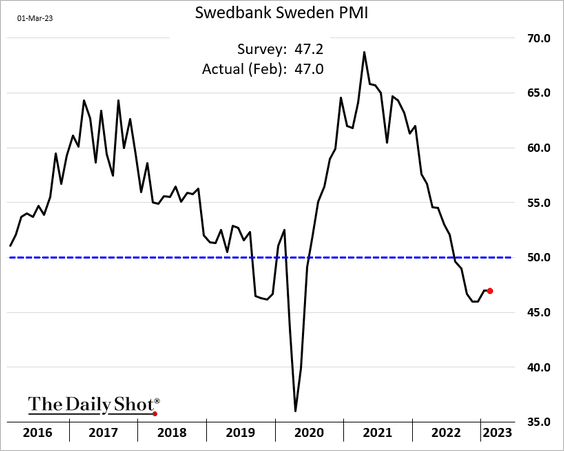
1. Sweden’s factory activity continues to shrink.
• The Czech Republic’s manufacturing PMI remains in contraction territory.
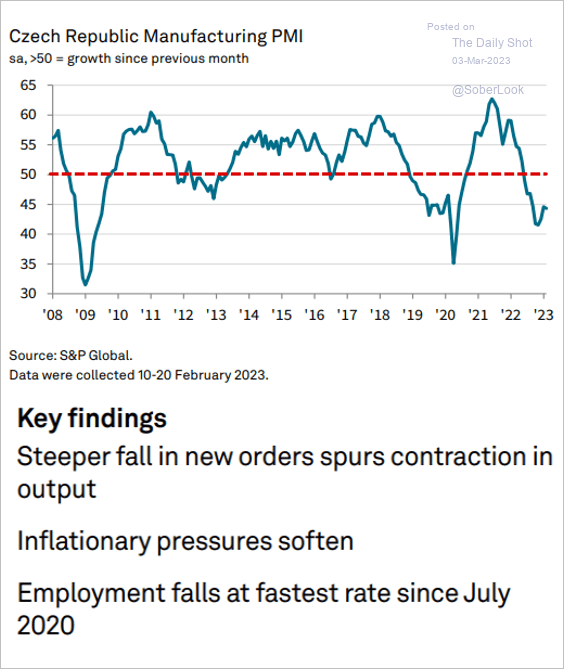 Source: S&P Global PMI
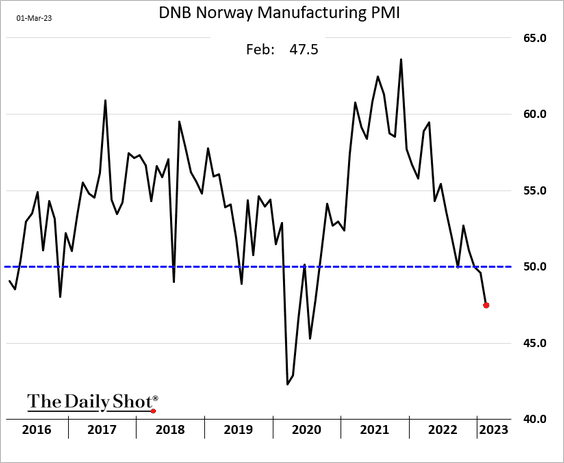
• Norway now also faces weakness in the manufacturing sector.
——————–
2. Elevated rates are important in Europe, where savings rates are high.
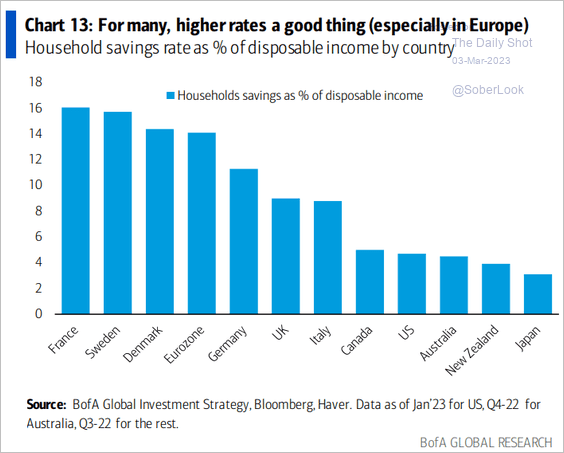 Source: BofA Global Research
3. This chart shows the share of households that rent.
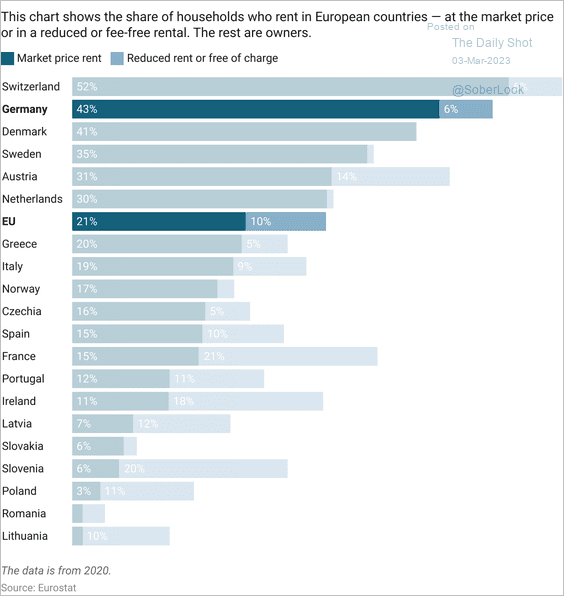 Source: @Datawrapper
4. Inflows into funds focused on European equities are fading.
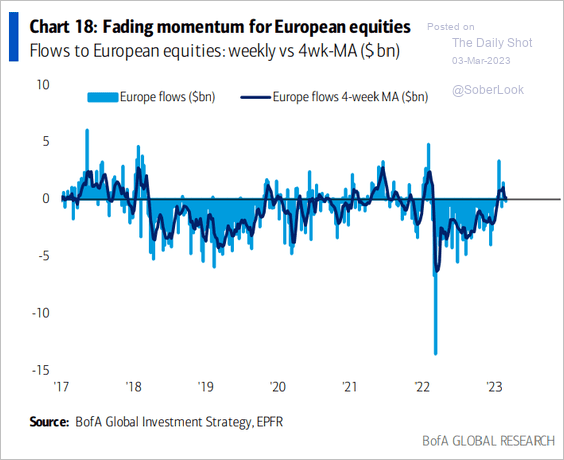 Source: BofA Global Research
Back to Index
Japan
1. The Tokyo CPI came off the highs, but the core inflation continues to accelerate.
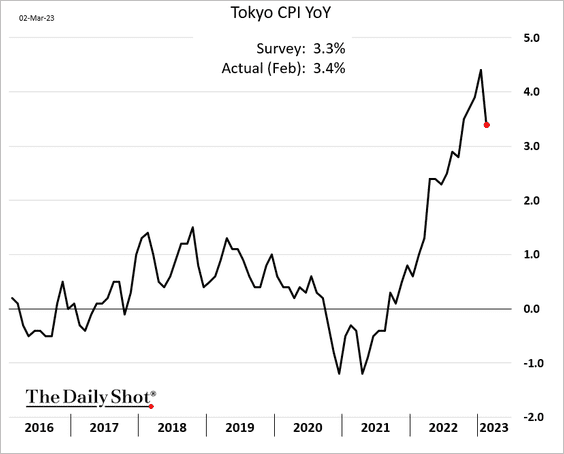
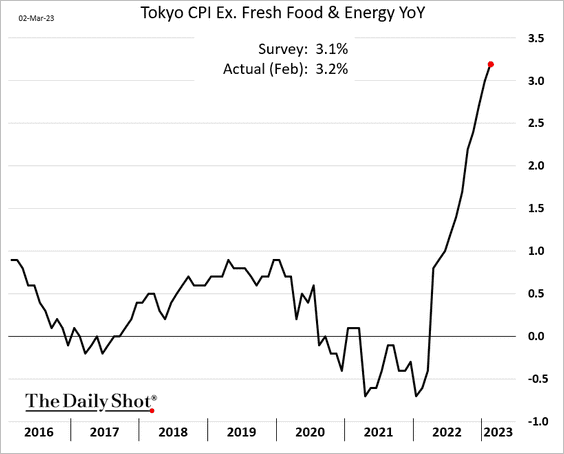
 Source: Reuters Read full article
• Japan’s Inflation expectations have been rising.
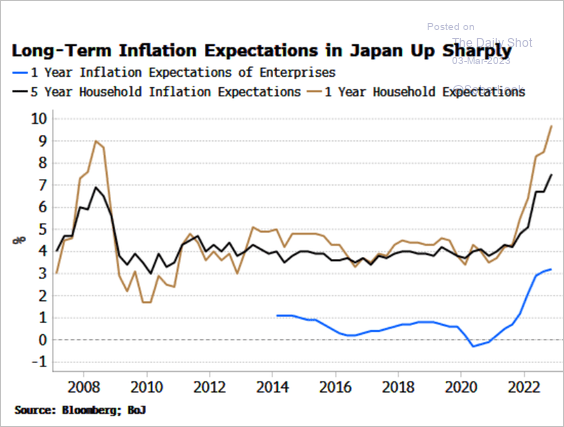 Source: Simon White, Bloomberg Markets Live Blog
——————–
2. Service-sector activity remains robust.
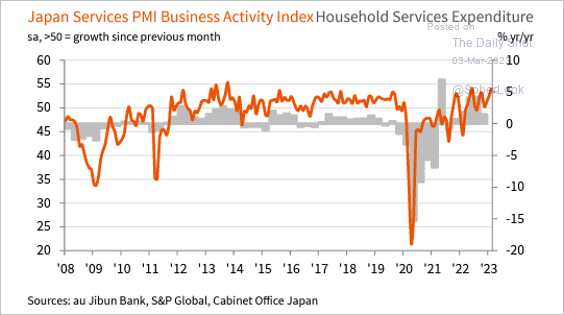 Source: @SPGlobalPMI, @jibunbank Read full article
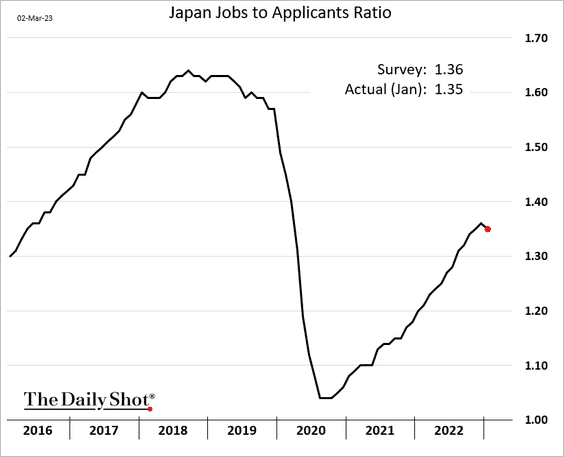
3. The unemployment rate is back at pre-COVID levels.

But the jobs-to-applicants ratio appears to have peaked.
——————–
4. Japan is the only major economy with a steepening yield curve, which bodes well for financial stocks.
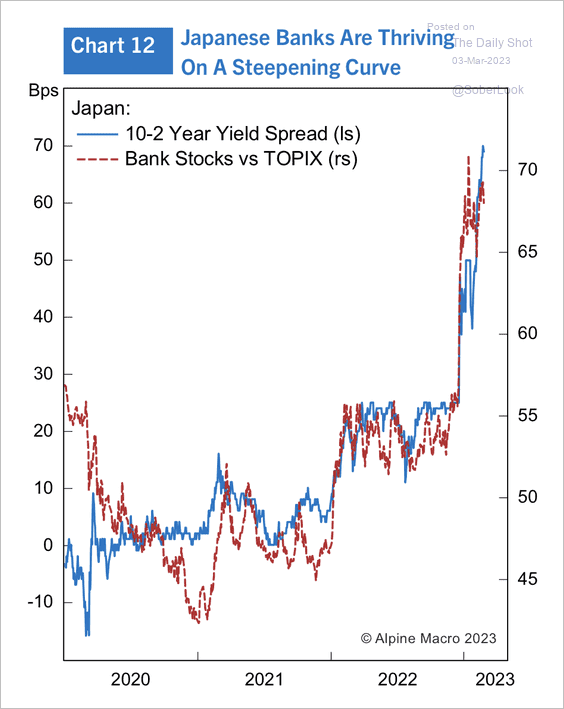 Source: Alpine Macro
Back to Index
Asia – Pacific
1. Singapore’s business activity is not growing.
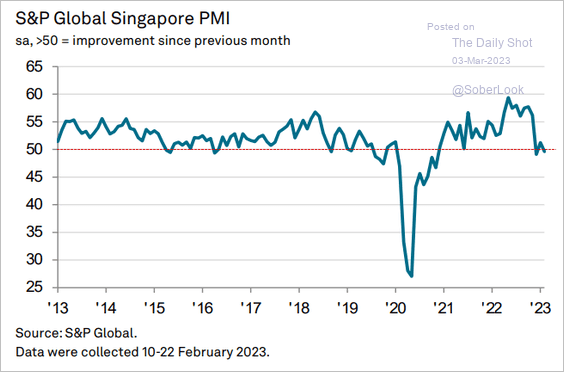 Source: S&P Global PMI
2. Australia’s housing finance slump shows no signs of easing.
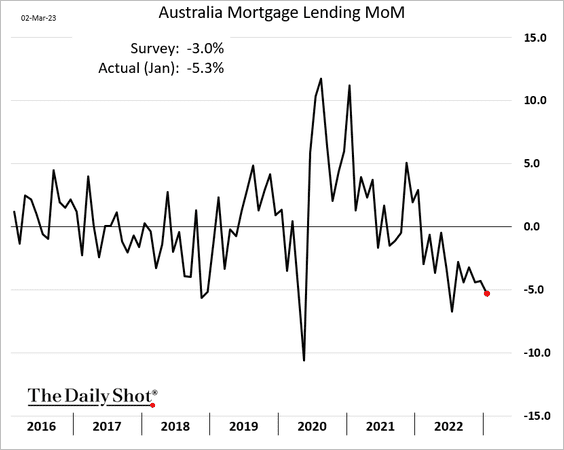
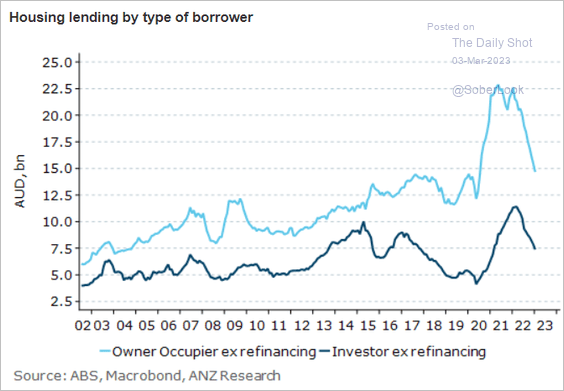 Source: @ANZ_Research
Back to Index
China
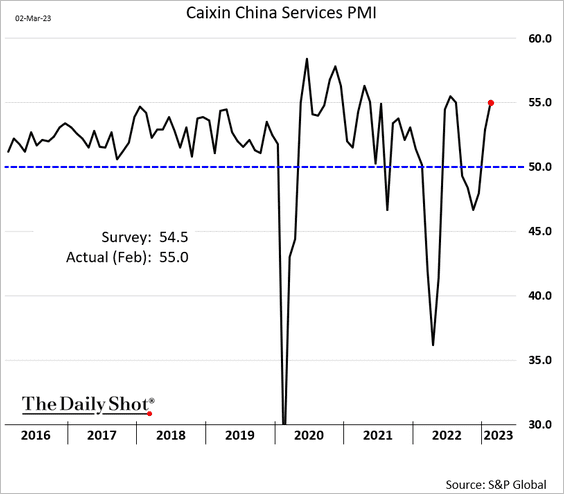
1. The services PMI index from S&P Global showed strong growth in February (confirming the official PMI report).
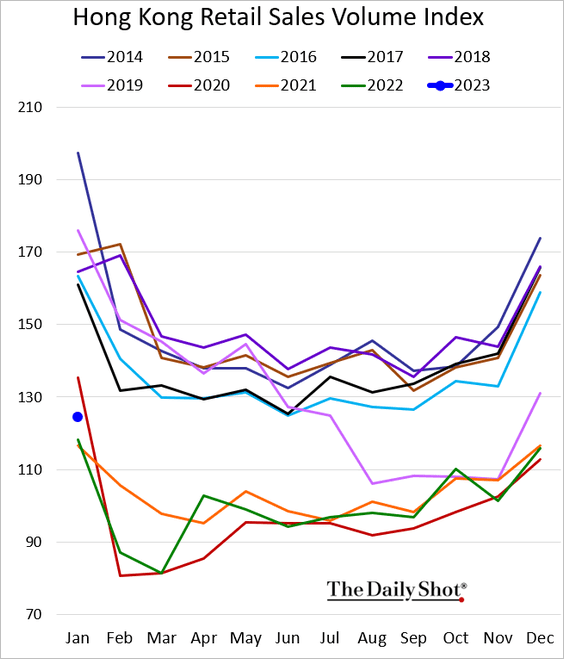
2. Hong Kong’s business activity also rebounded last month.
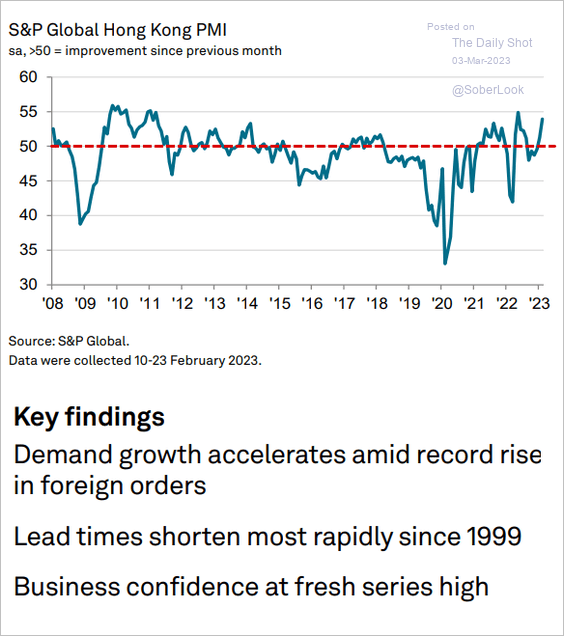 Source: S&P Global PMI
Hong Kong’s retail sales were above last year’s levels in January.
——————–
3. The US-China 10-year yield spread remains near multi-year highs.
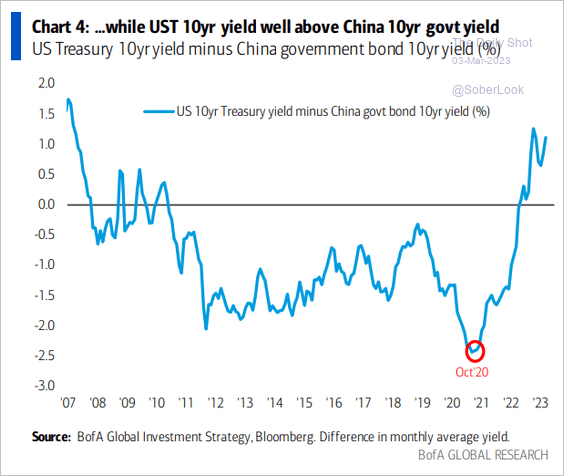 Source: BofA Global Research
Back to Index
Emerging Markets
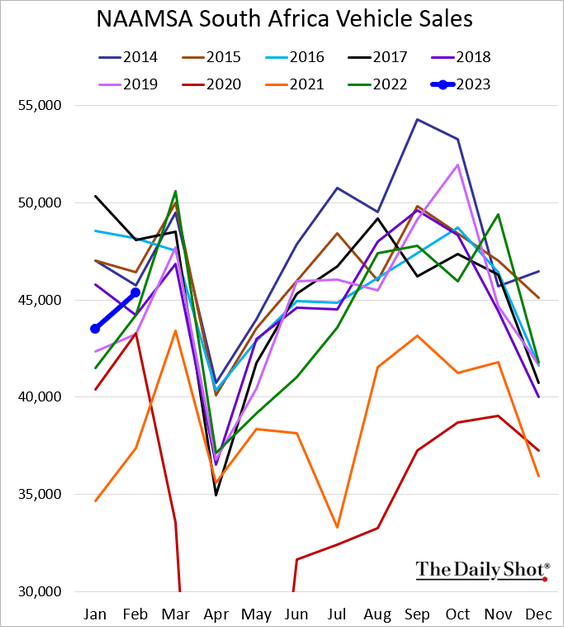
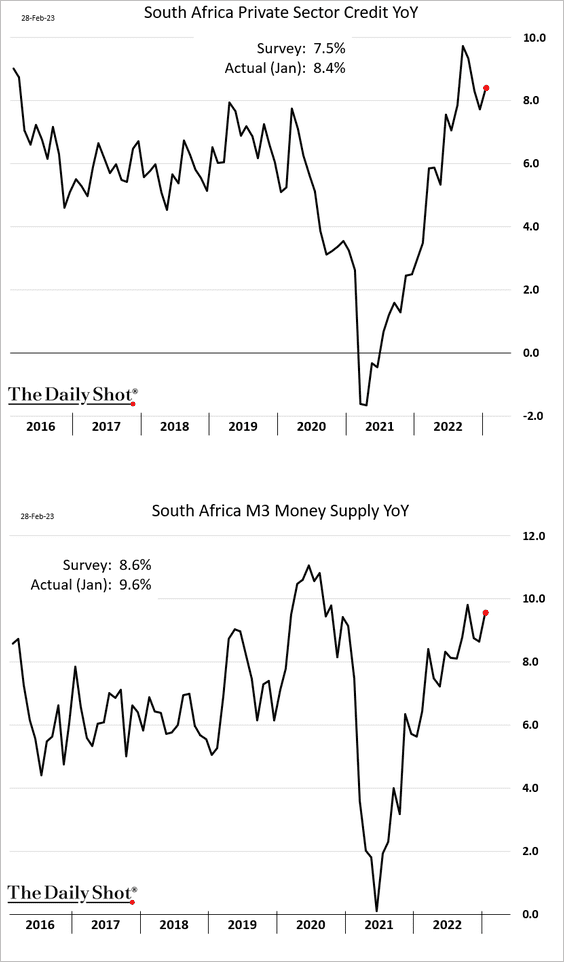
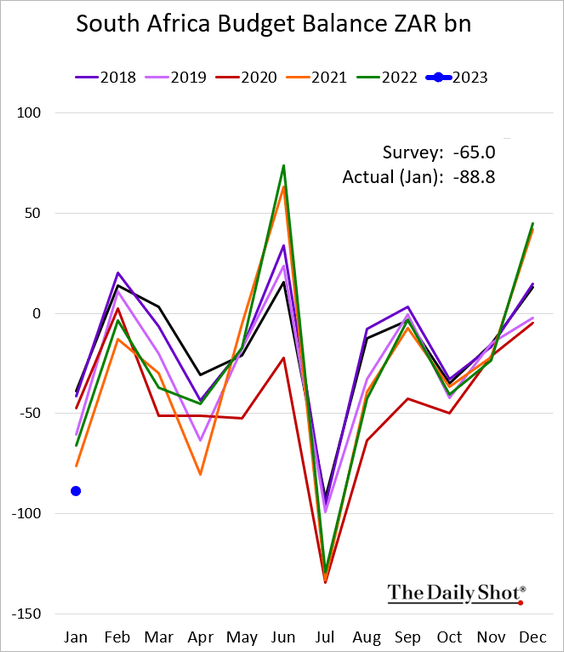
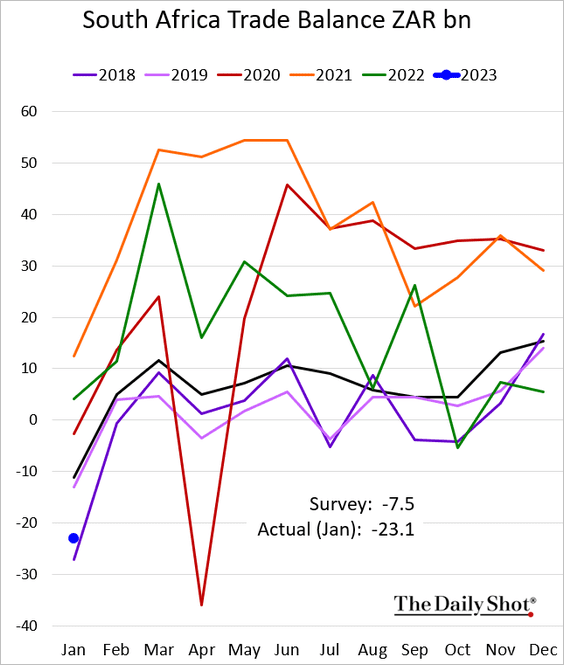
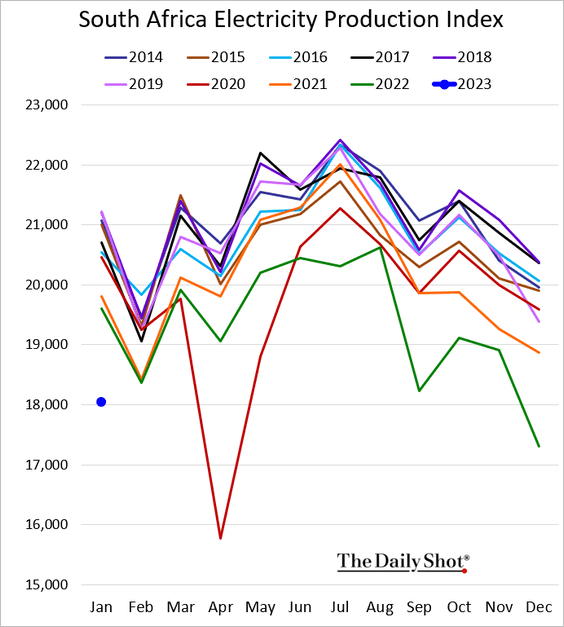
1. Let’s begin with South Africa.
• Vehicle sales (above last year’s levels):
• Credit growth (strong):
• Government budget (deep deficit):
• Trade balance:
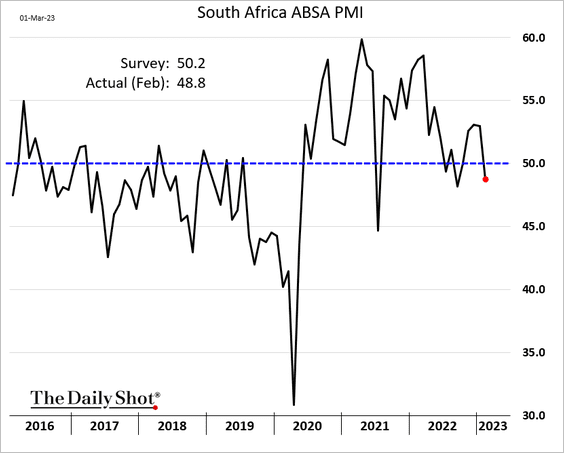
• Manufacturing activity (contracting):
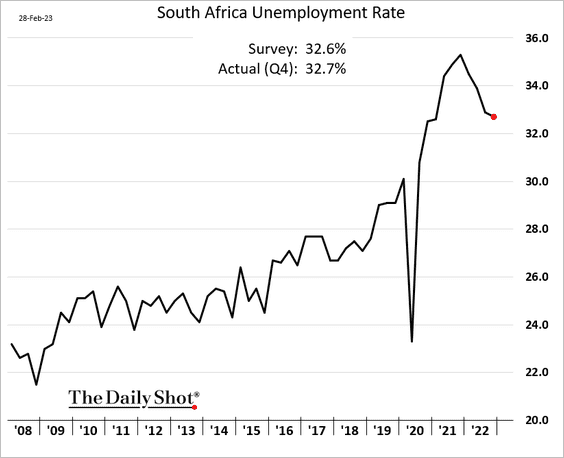
• The unemployment rate (still near 33%):
• Electricity production in January (ugly):
——————–
2. Pakistan’s central bank hiked rates by 300 bps as inflation surges.
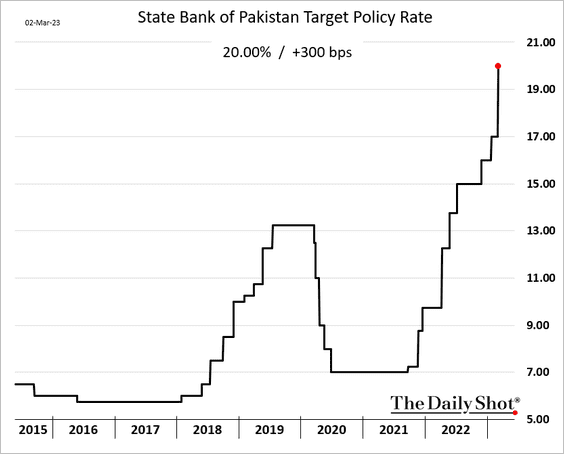
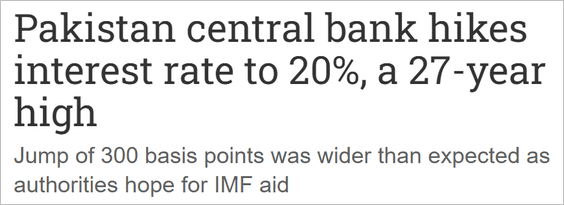 Source: NIKKEI Asia Read full article
——————–
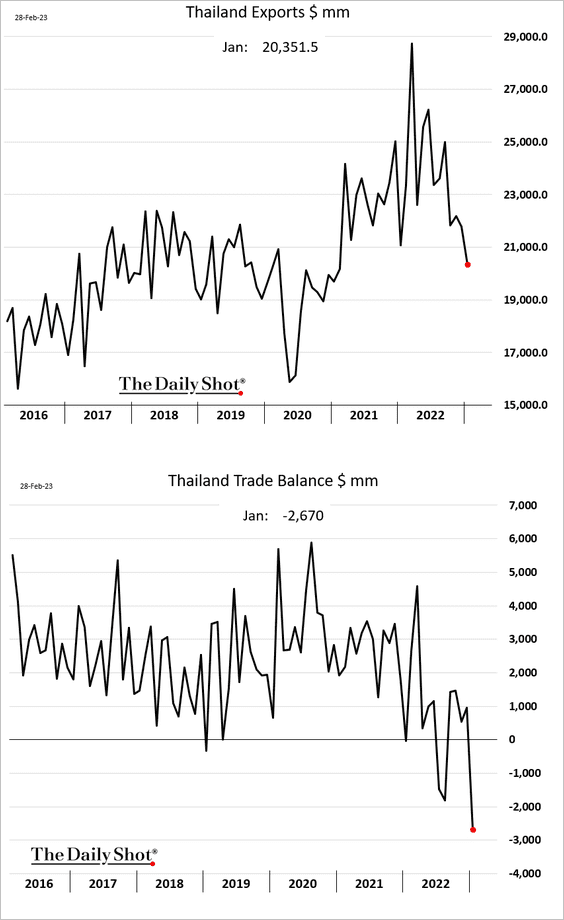
3. Thai exports have been slowing.
4. Brazil’s GDP report was disappointing.
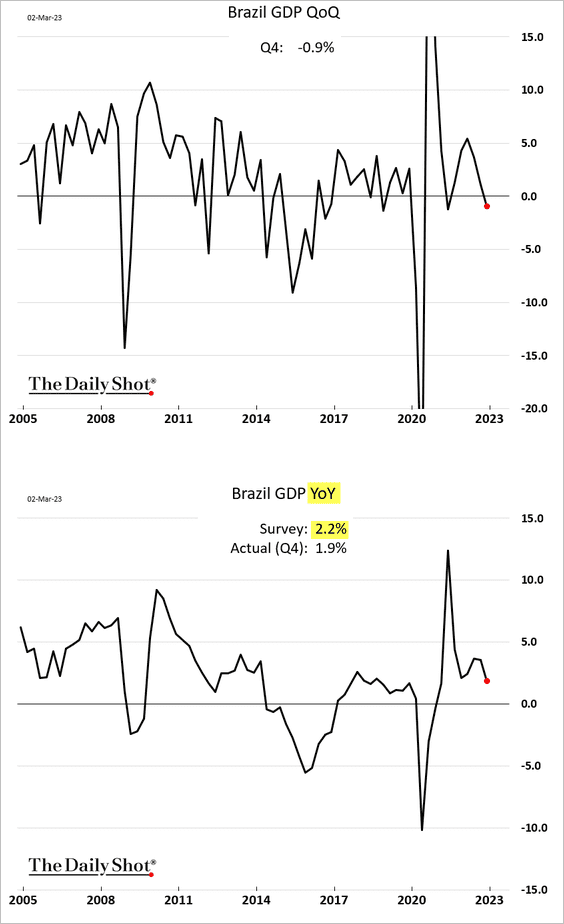
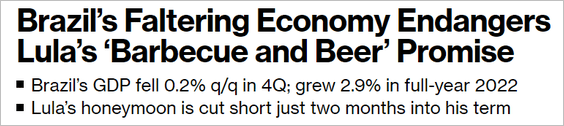 Source: @andrewrosati, @bpolitics Read full article
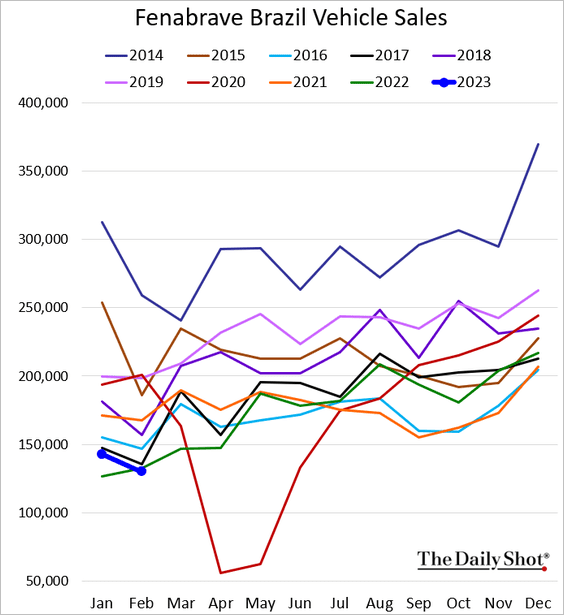
Vehicle sales are at multi-year lows.
——————–
5. Here is the services CPI by region.
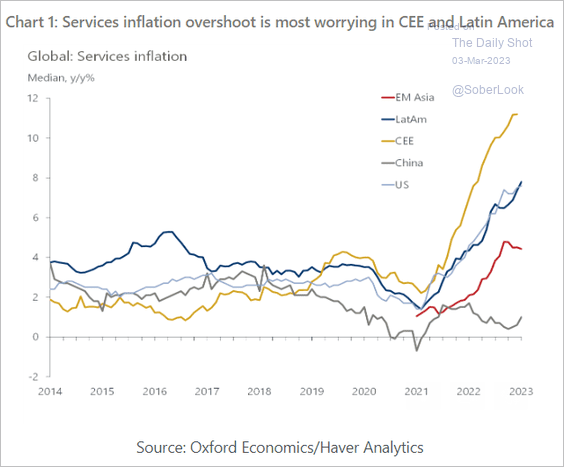 Source: Oxford Economics
Back to Index
Cryptocurrency
1. Cryptos took a hit on concerns about Silvergate (crypto bank).
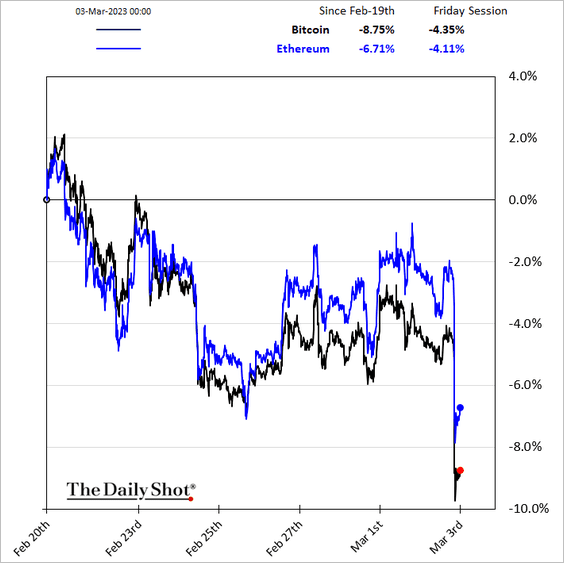
 Source: @MaxJReyes, @Yueqi_Yang, @Matt_Turnerr, @markets Read full article
 Source: @SKJagtiani, @crypto Read full article
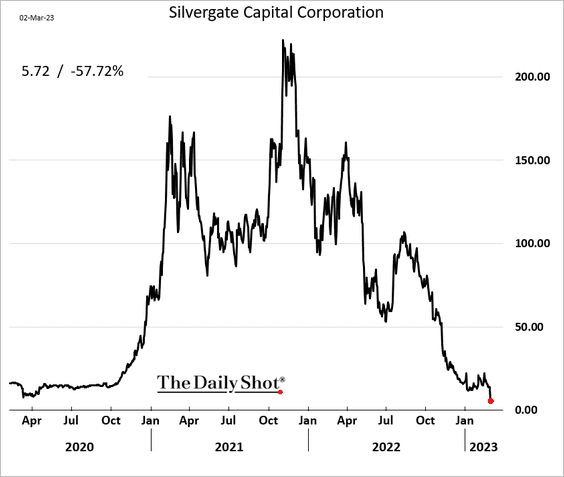
Silvergate’s share price has collapsed.
——————–
2. Half of the top 50 cryptos have outperformed bitcoin over the past month.
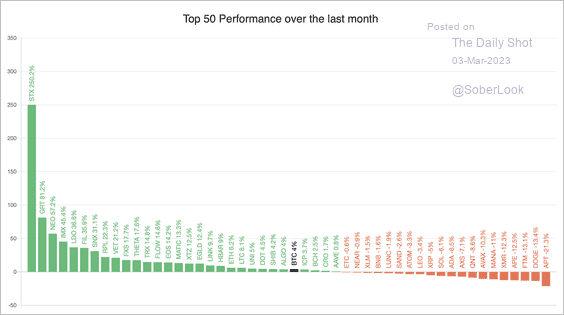 Source: BlockchainCenter
3. Bitcoin’s implied volatility declined over the past week after a spike in January.
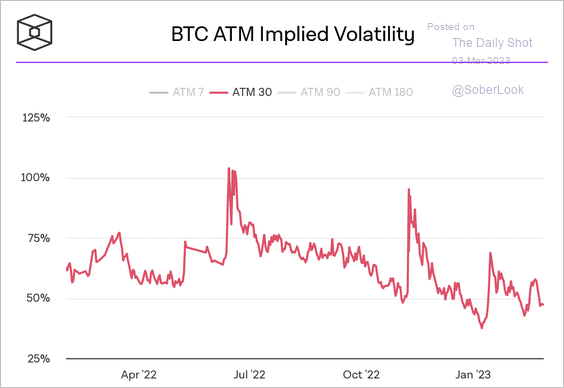 Source: The Block Research
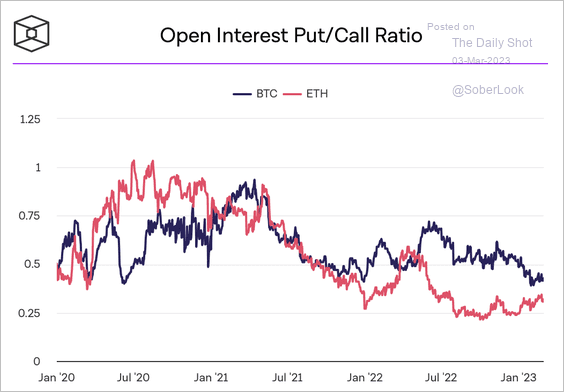
Bitcoin’s put/call ratio returned toward last year’s lows, while ether’s put/call ratio is starting to advance. Traders are probably hedging against downside risk in ETH, which is more volatile than BTC.
 Source: The Block Research
Back to Index
Energy
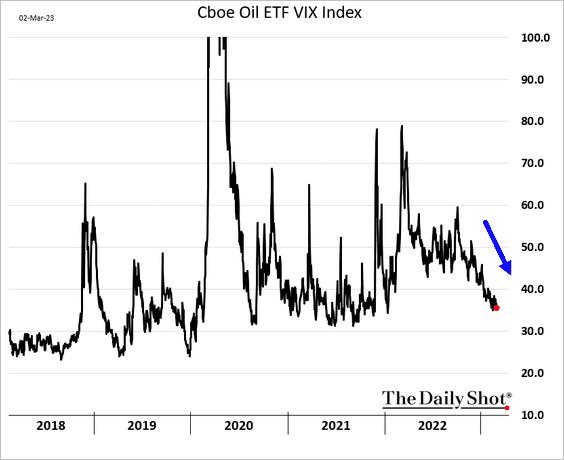
1. Oil market implied volatility continues to trend lower.
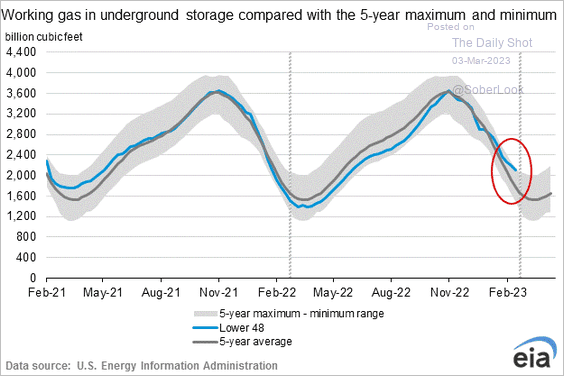
2. US natural gas in storage is nearing the top of its five-year range.
3. There wasn’t much new US interstate natural gas pipeline capacity added last year.
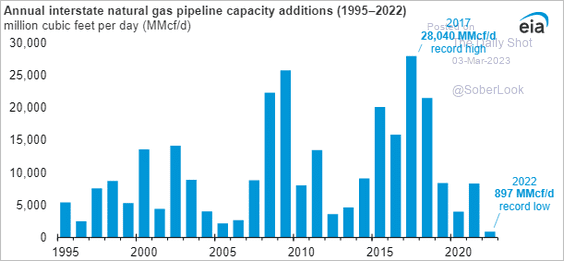 Source: @EIAgov Read full article
4. The CapEx of major oil & gas companies has been notably low.
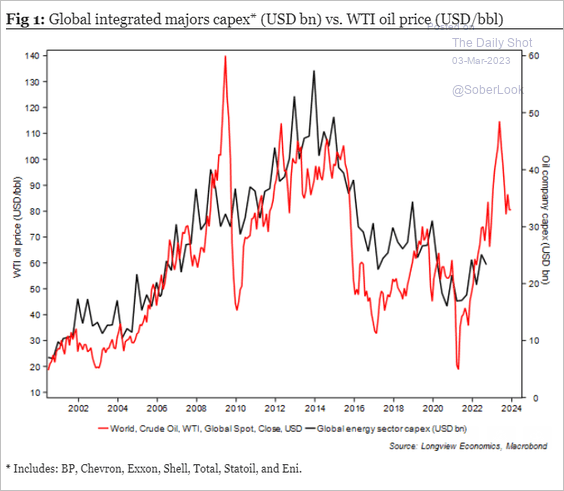 Source: Longview Economics
Back to Index
Equities
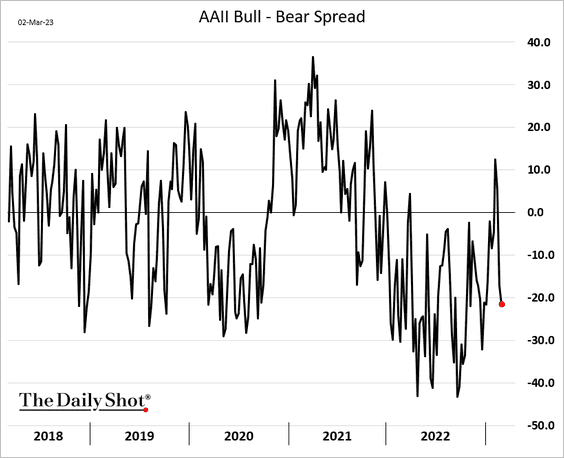
1. The AAII investor sentiment indicator is back in bearish territory.
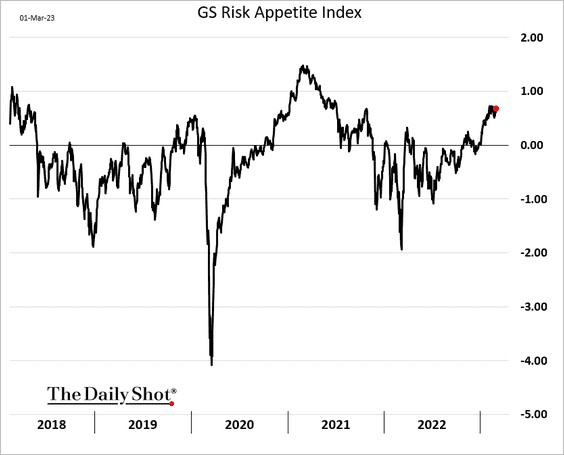
• But Goldman’s risk appetite index has been climbing.
• Even with T-bill rates above 5%, strategists still don’t like cash.
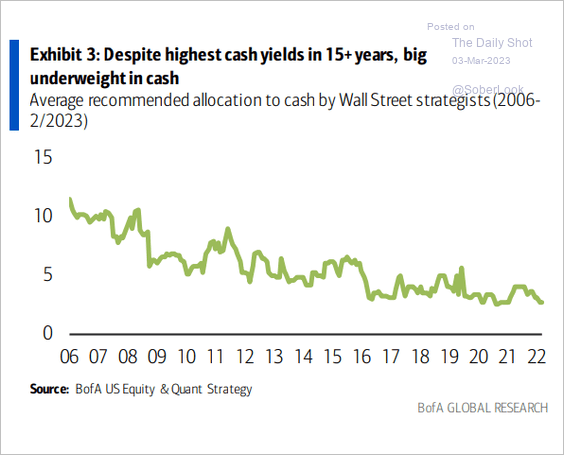 Source: BofA Global Research
——————–
2. Profit margins are back to pre-COVID levels.
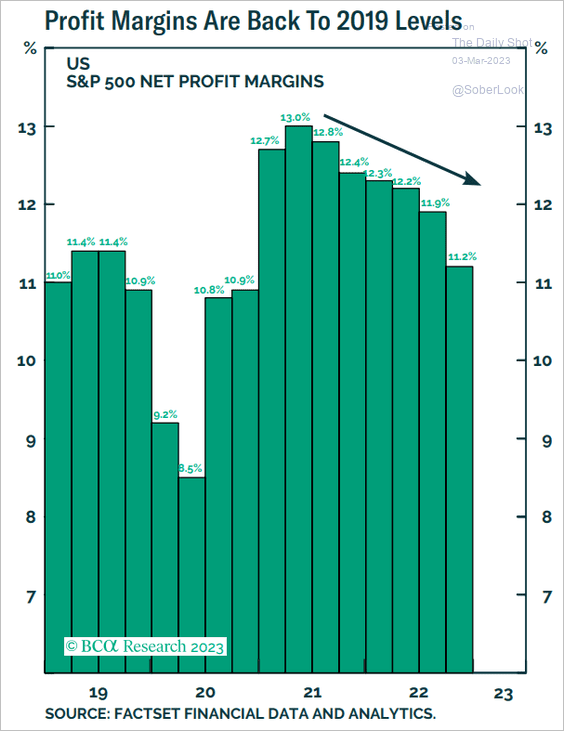 Source: BCA Research
3. Dealers’ options gamma could turn negative, which tends to boost market volatility.
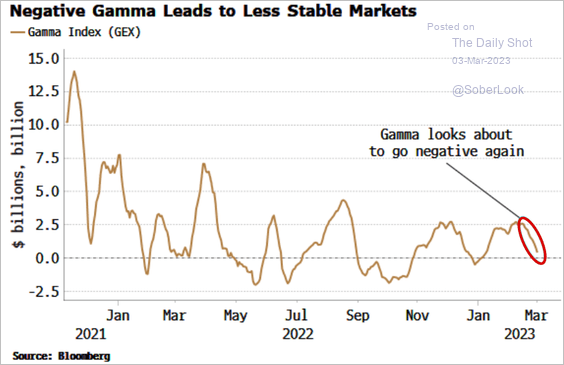 Source: Simon White, Bloomberg Markets Live Blog
4. Some analysts are concerned about the quality of earnings.
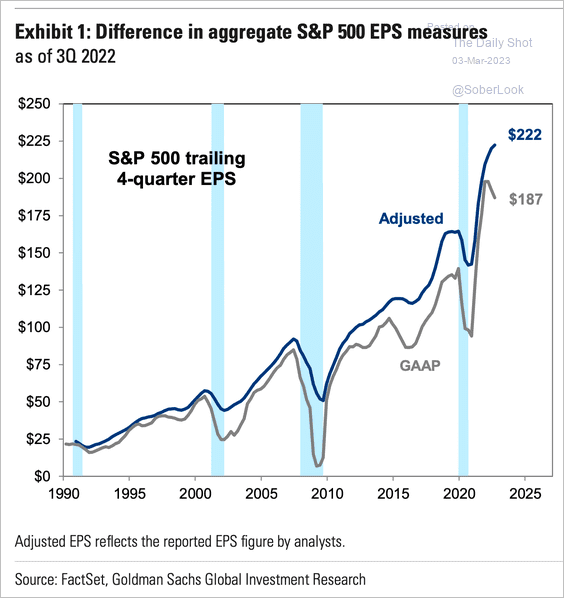 Source: Goldman Sachs; @SamRo, h/t @dailychartbook Read full article
5. Retail buying of single stocks hit a record this year.
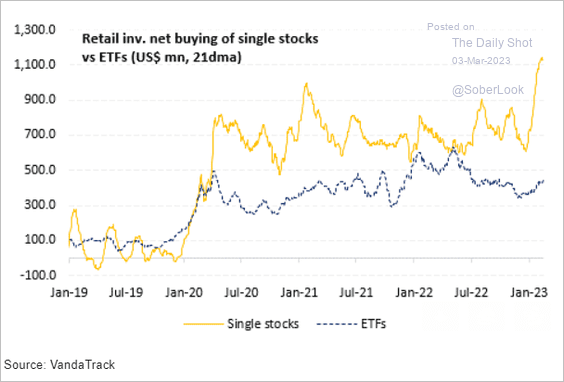 Source: Vanda Research
• Much of that was Tesla.
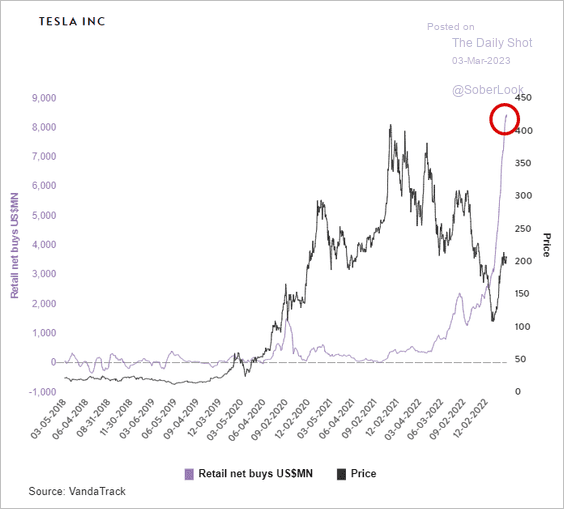 Source: Vanda Research
• Is retail buying about to tank? Here is a forecast from Vanda Research.
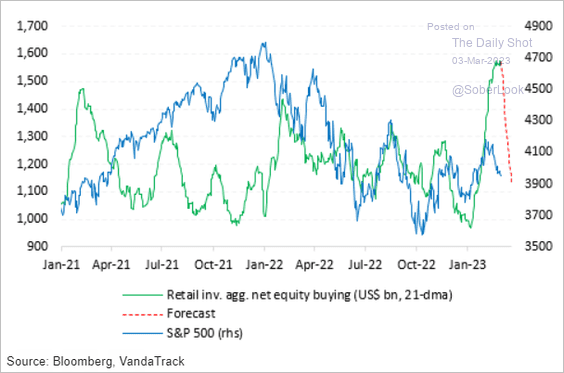 Source: Vanda Research
——————–
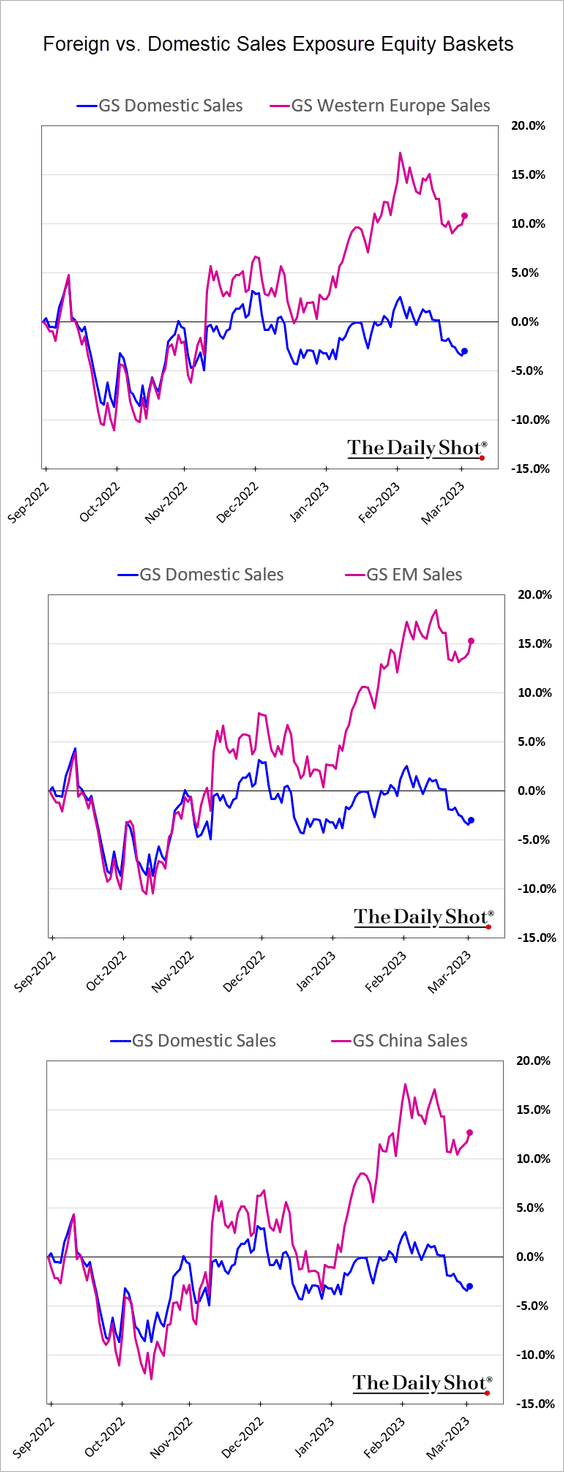
6. Companies with significant sales exposure to non-US markets have been outperforming.
7. AI-related stocks have been hot.
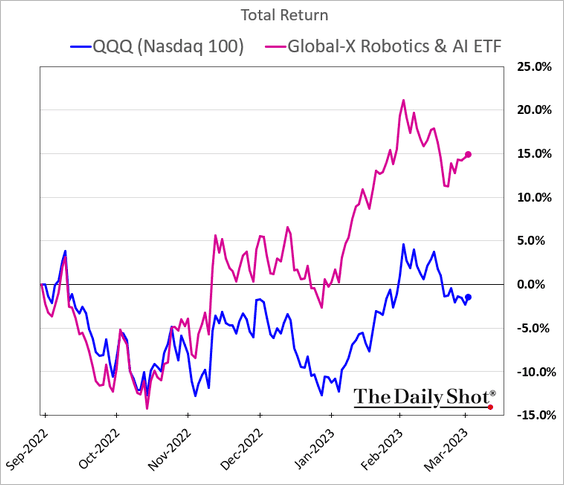
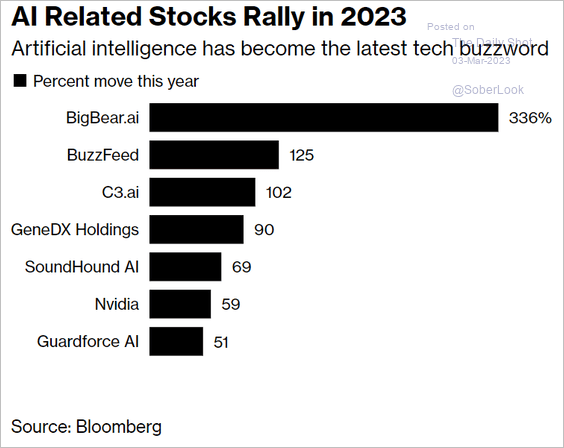 Source: @Subrat_Patnaik, @technology Read full article
——————–
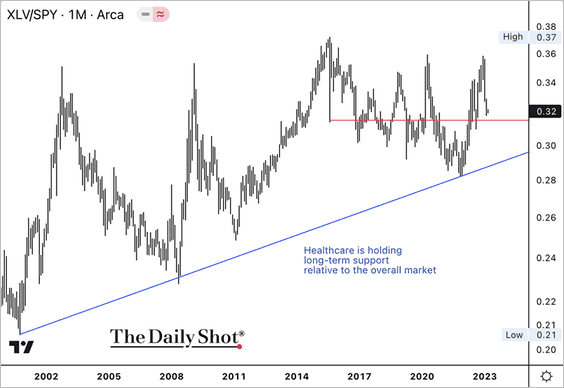
8. So far, the Health Care SPDR ETF (XLV) is underperforming the S&P 500 this year, but relative support is nearby.
9. Which key events is the volatility market focused on? Here is the S&P 500 implied vol term structure.
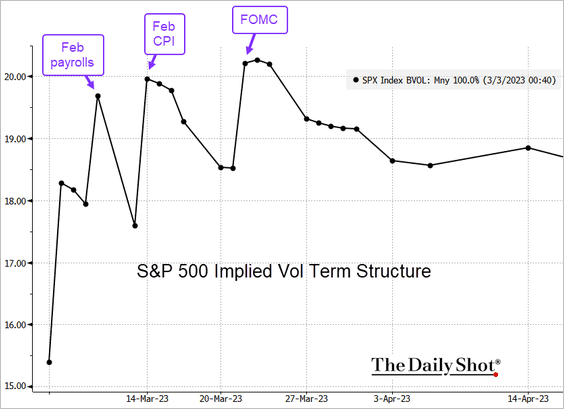 Source: @TheTerminal, Bloomberg Finance L.P.
Back to Index
Rates
1. The 10-year Treasury yield is above its “fair value” level of 2.5%.
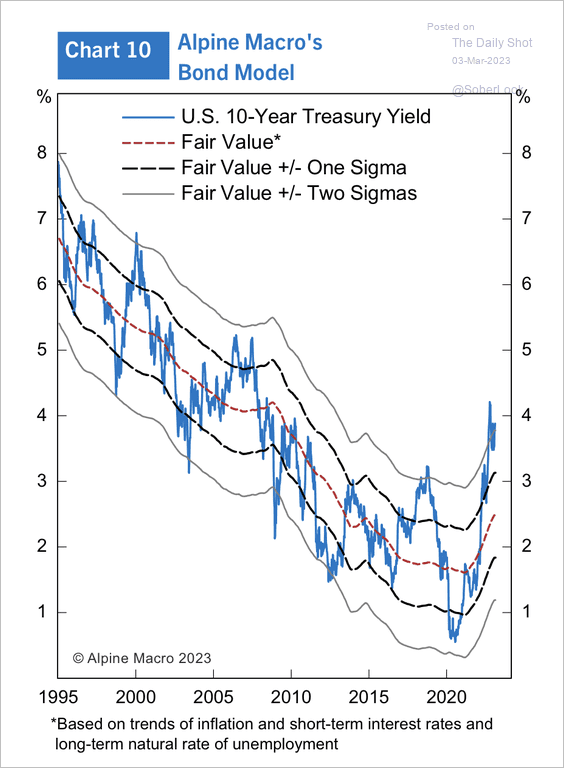 Source: Alpine Macro
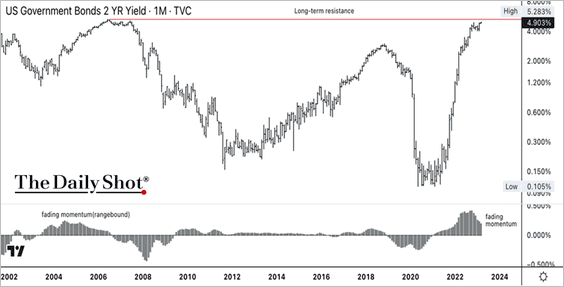
2. The 2-year Treasury yield is approaching long-term resistance near its 2007 high of 5.2%.
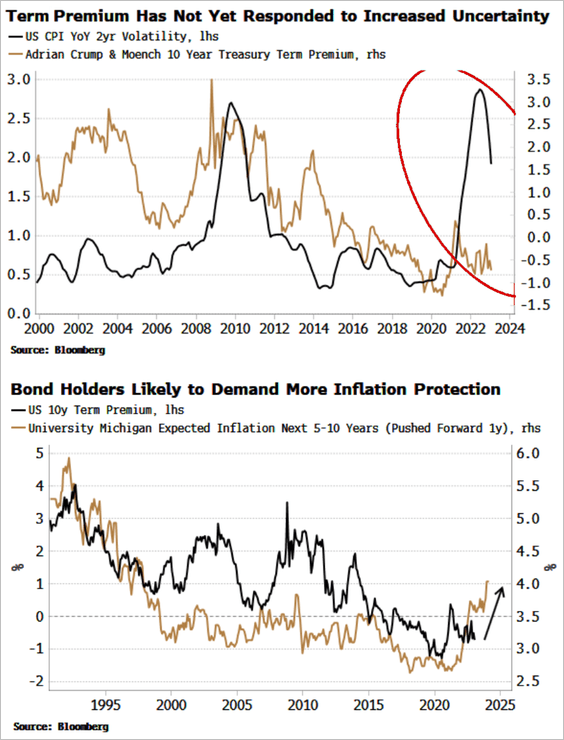
3. Risks are tilted to the upside for Treasury term premium amid concerns about sticky inflation.
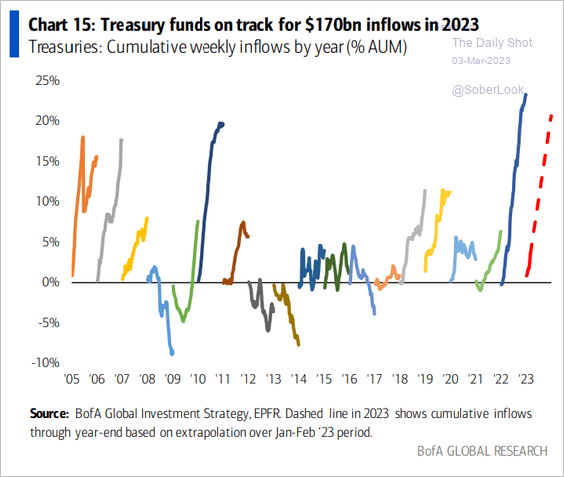
4. Treasury funds could see substantial inflows this year.
 Source: BofA Global Research
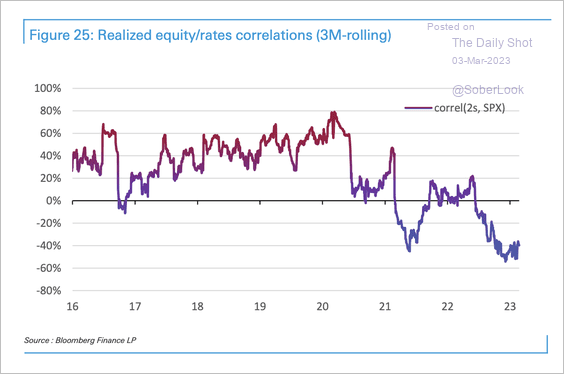
5. Realized correlations between the S&P 500 and the front end of the Treasury curve are deeply negative.
 Source: Deutsche Bank Research
Back to Index
Food for Thought
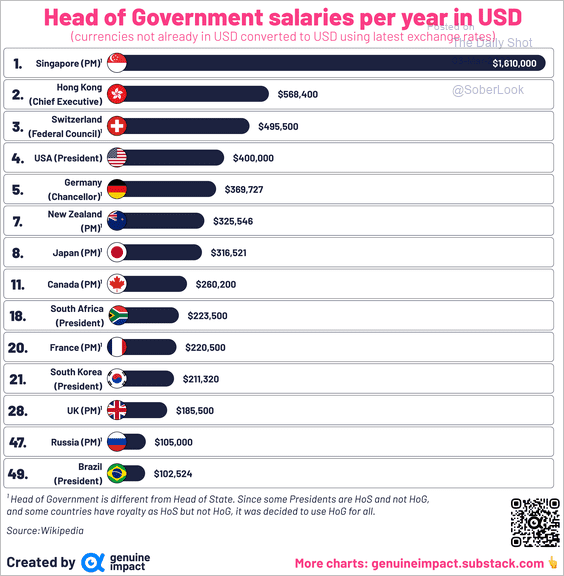
1. Head-of-government salaries:
 Source: @genuine_impact
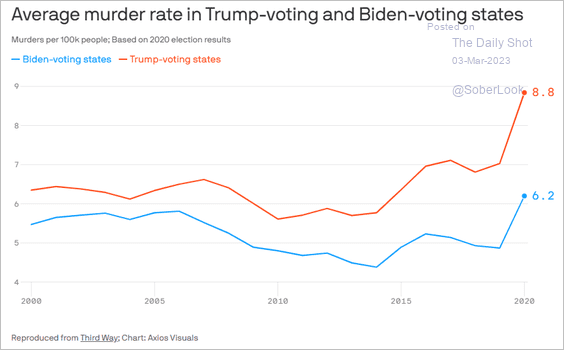
2. Murder rates in red and blue states:
 Source: @axios Read full article
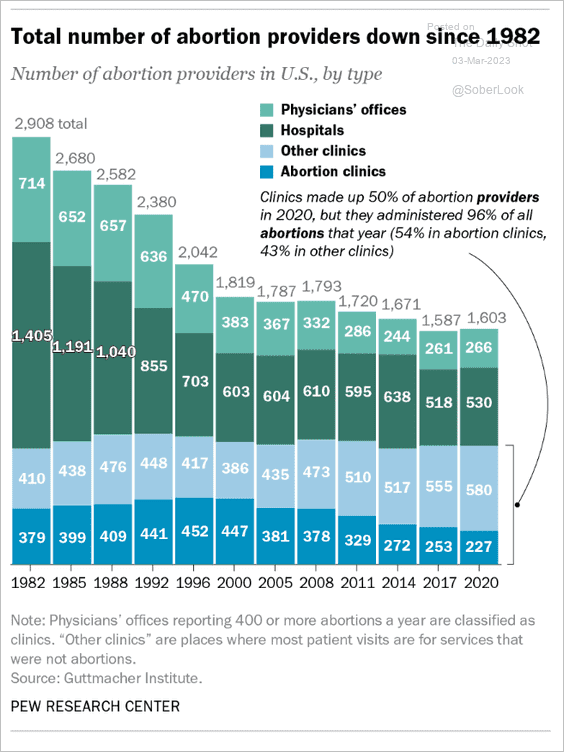
3. Number of US abortion providers since 1982:
 Source: Pew Research Center Read full article
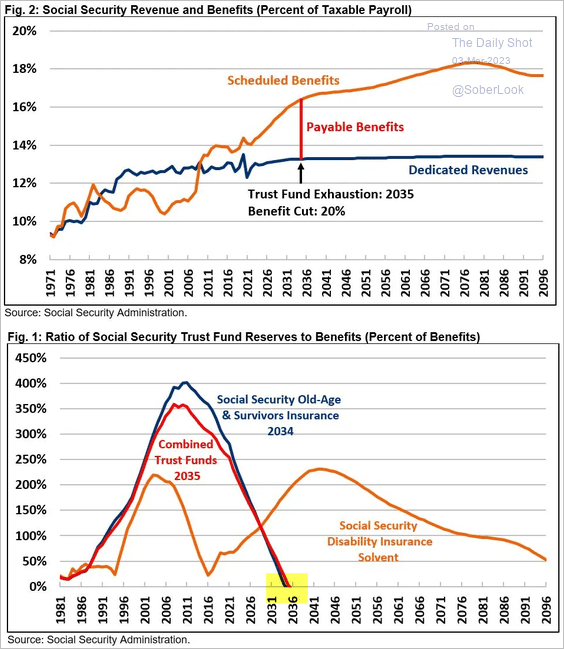
4. The Social Security trust fund will be exhausted by 2035.
 Source: @BudgetHawks
5. Women CEOs in the S&P 500:
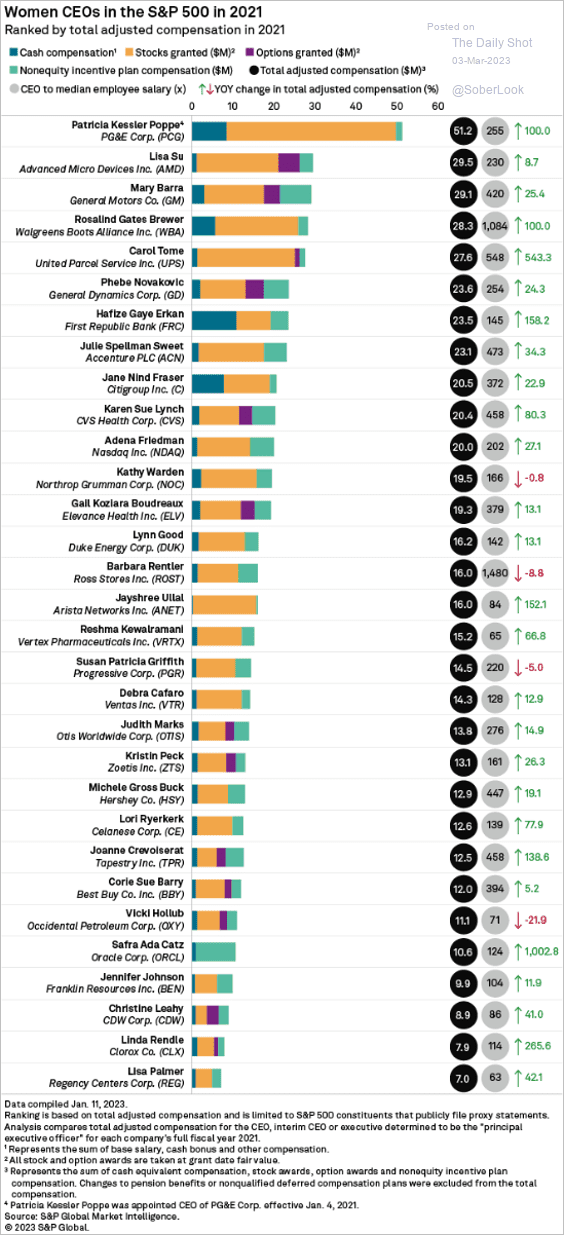 Source: S&P Global Market Intelligence
6. AI-related research:
 Source: The Economist Read full article
7. A survey on sports and activities:
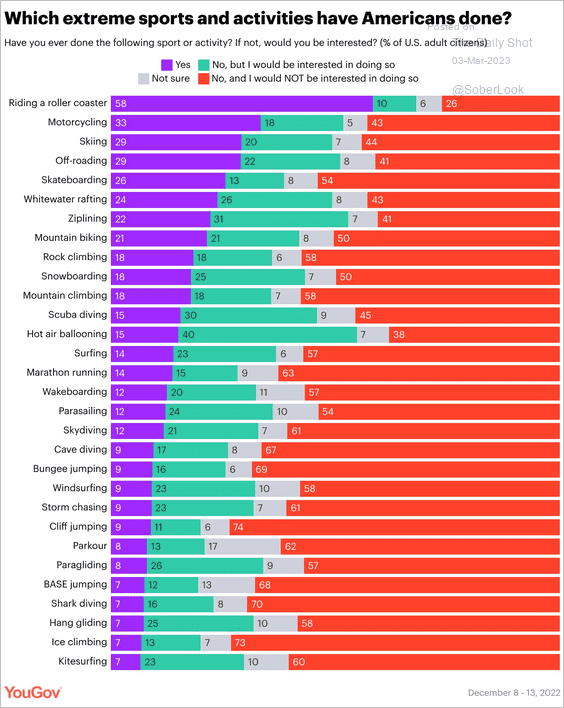 Source: @YouGovAmerica Read full article
——————–
Have a great weekend!
Back to Index