
The Daily Shot: 07-Mar-23
• The United States
• The United Kingdom
• The Eurozone
• Europe
• Japan
• Australia
• China
• Emerging Markets
• Cryptocurrency
• Energy
• Equities
• Rates
• Global Developments
• Food for Thought
The United States
1. Let’s begin with the housing market.
• Home prices saw a small decline in January, according to Black Knight.
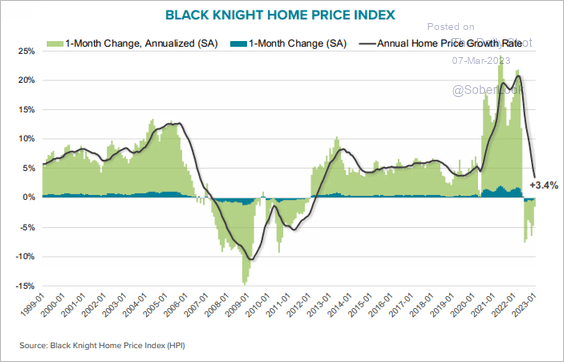 Source: Black Knight
• According to CoreLogic, home prices in January of 2024 are projected to increase by 3% compared to the levels seen in January 2023.
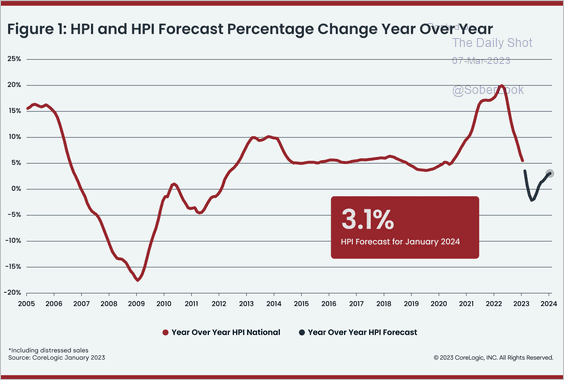 Source: CoreLogic
• The median listing price continues to climb.
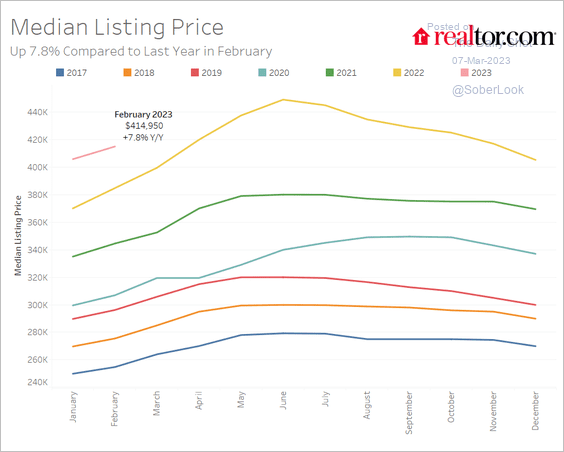 Source: realtor.com
• Housing affordability remains near record lows.
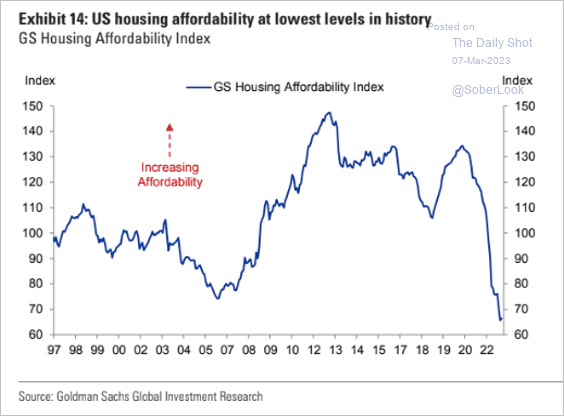 Source: Goldman Sachs; @MikeZaccardi
Here are the drivers of housing affordability, according to Wells Fargo.
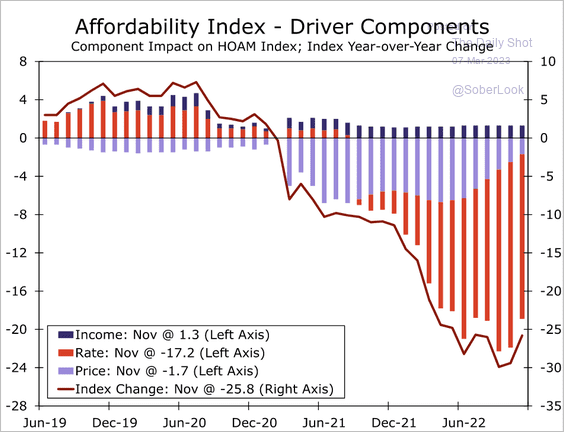 Source: Wells Fargo Securities
• New listings are down sharply from last year (2 charts).
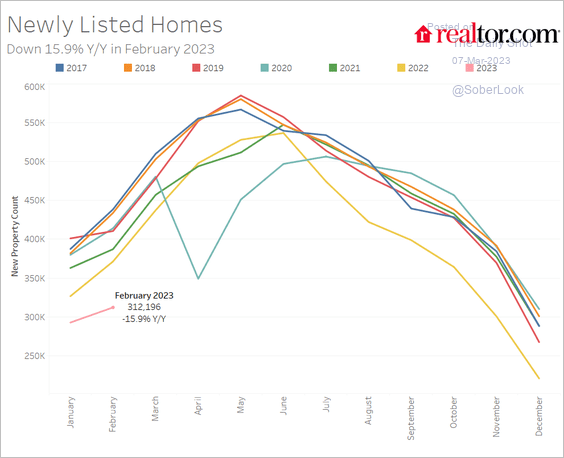 Source: realtor.com
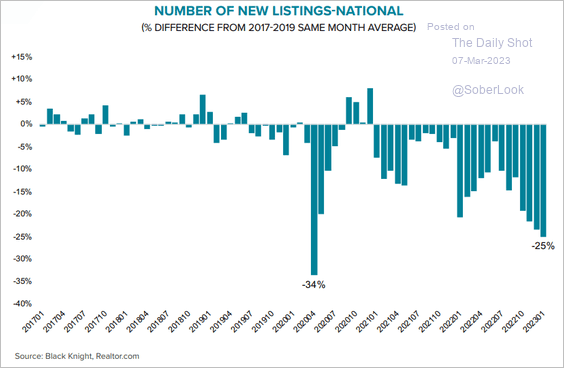 Source: Black Knight
• Next, we have the share of listings with price cuts.
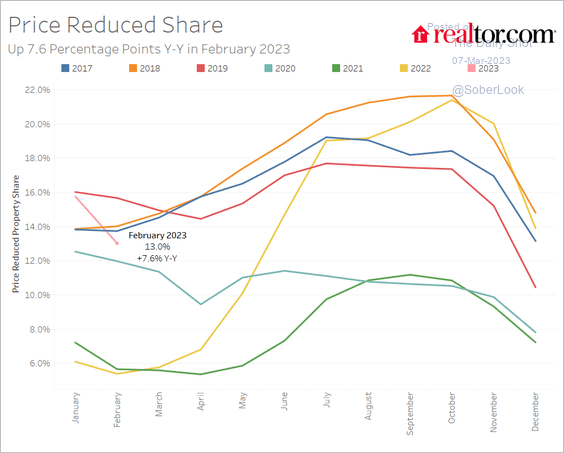 Source: realtor.com
• Here is the distribution of outstanding mortgage loans by vintage.
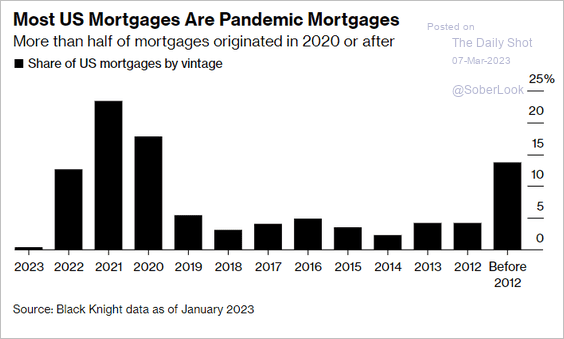 Source: @BenHollandDC, @economics Read full article
And this chart shows the distribution of outstanding loans by interest rate.
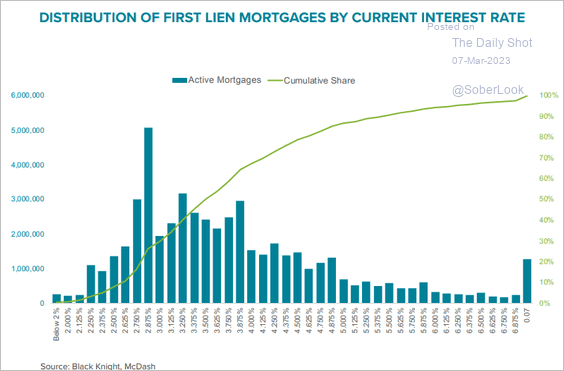 Source: Black Knight
• What happened to mortgages that exited COVID-era forbearance programs?
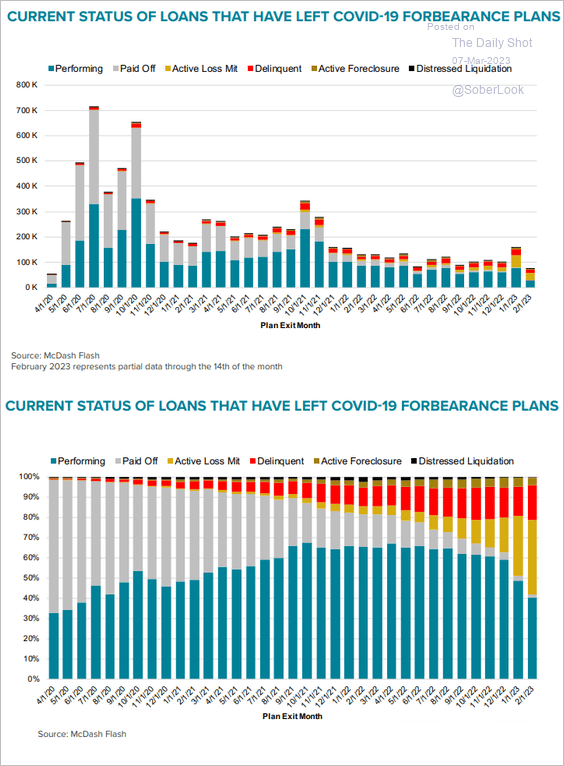 Source: Black Knight
——————–
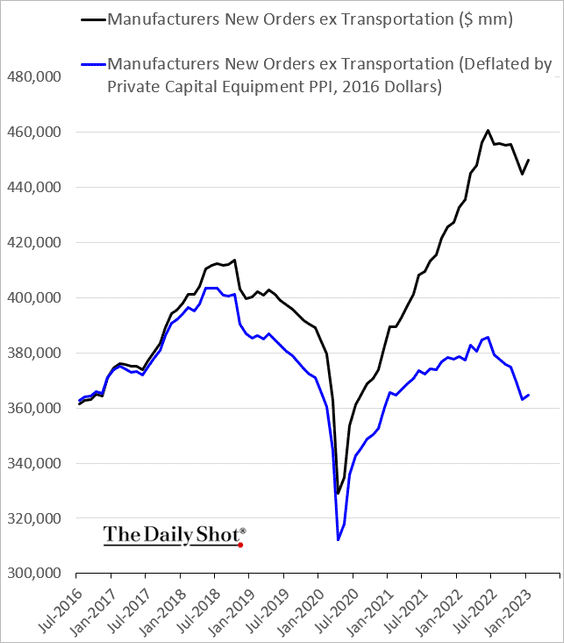
2. Manufacturing orders improved in January after months of weakness.
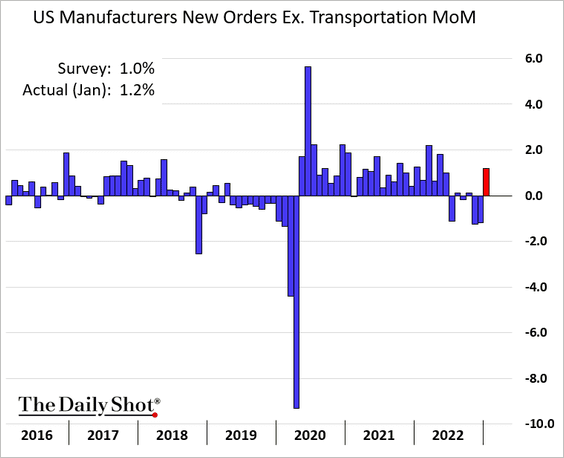
Here is the manufacturing orders index adjusted for inflation.
——————–
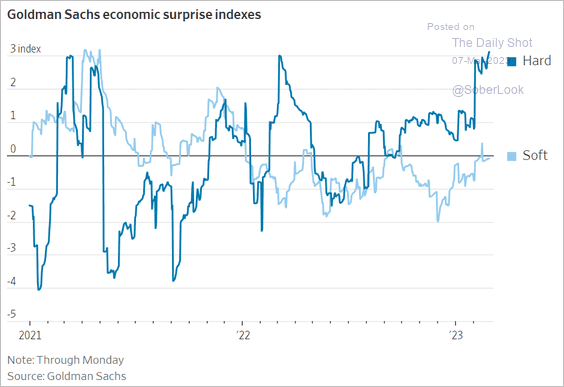
3. Hard economic indicators have been outpacing soft data (surveys).
 Source: @WSJ Read full article
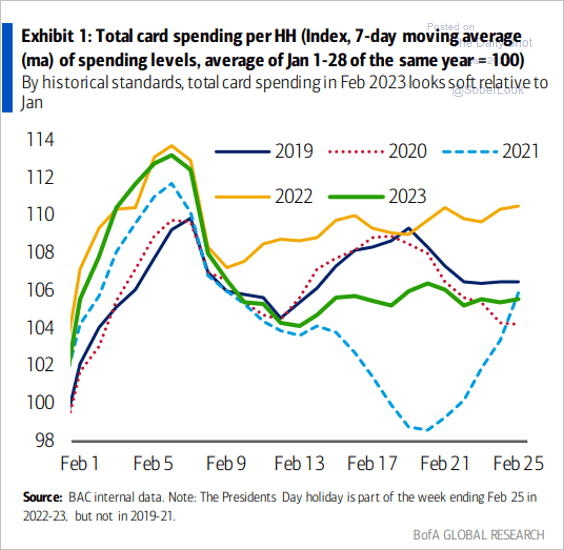
4. Credit card spending was soft in February compared to 2022.
 Source: BofA Global Research
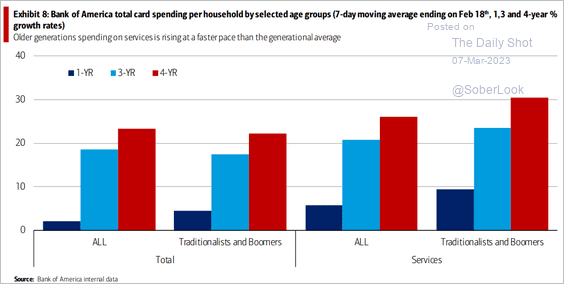
Spending by older Americans has been rising at a faster rate than that of the general population.
 Source: BofA Global Research
——————–
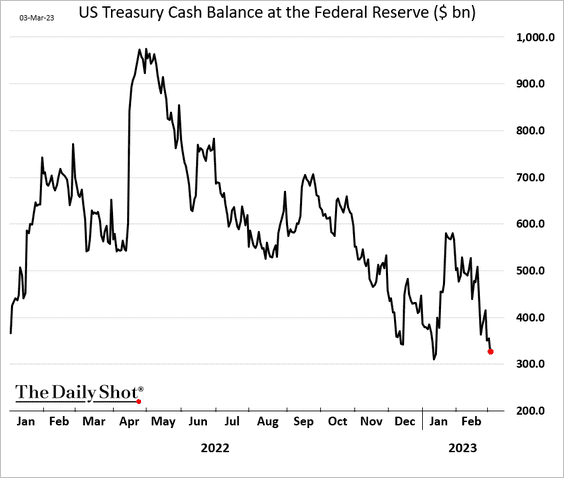
5. The US Treasury’s cash holdings are dwindling again. Analysts have differing opinions on the timing of the X-date.
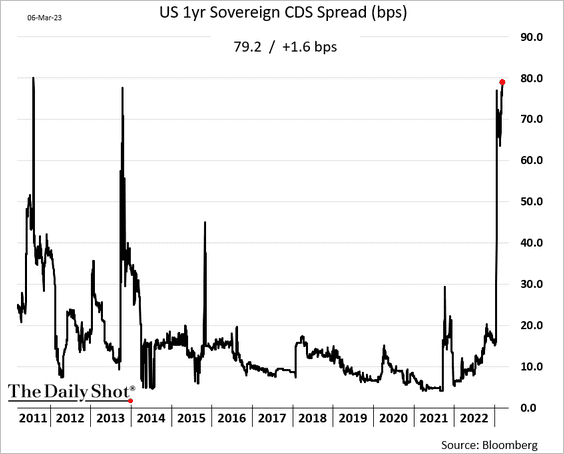
The one-year sovereign credit default swap spread hit its highest level since 2011 when the debt ceiling impasse resulted in a US debt downgrade.
Back to Index
The United Kingdom
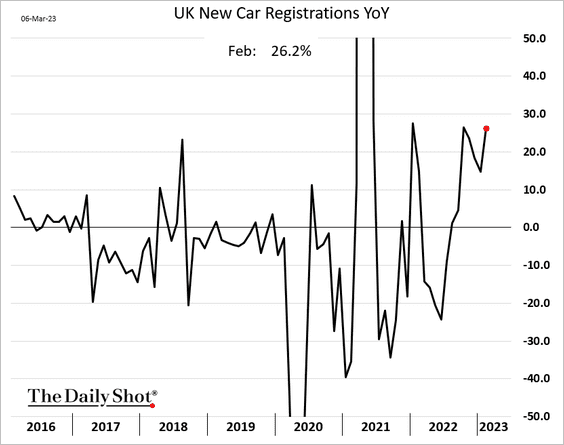
1. New car registrations showed further improvement last month.
 Source: Reuters Read full article
——————–
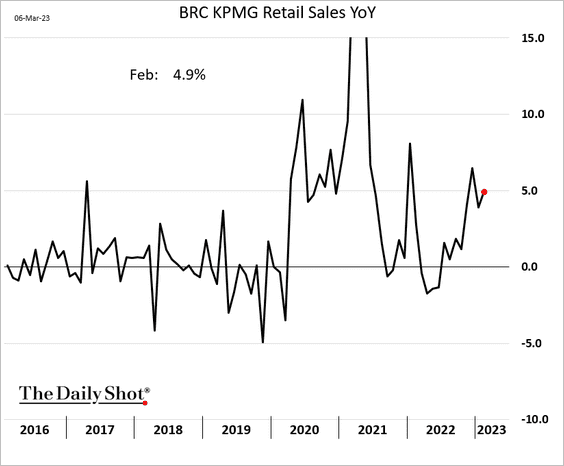
2. The BRC/KPMG retail sales index remains above last year’s levels.
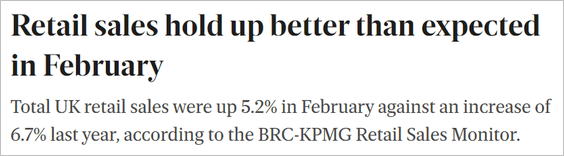 Source: Evening Standard Read full article
——————–
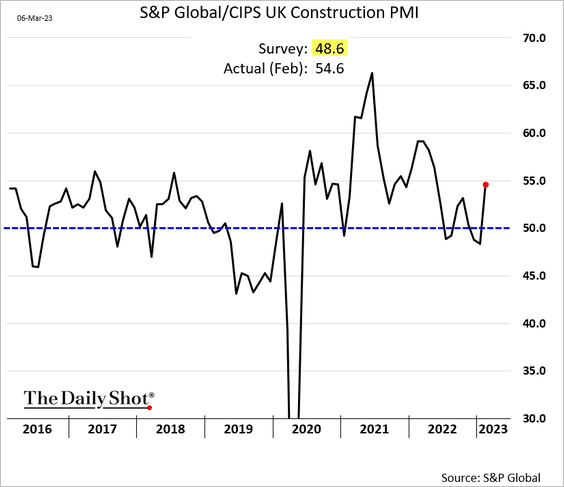
3. Construction PMI is back in growth territory.
Back to Index
The Eurozone
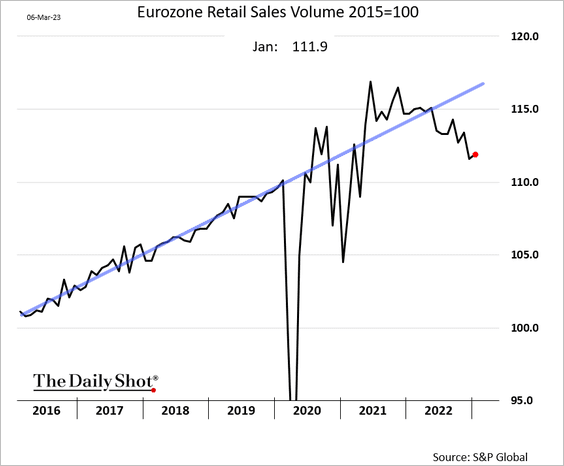
1. Retail sales edged higher in January, but the increase was lower than expected.
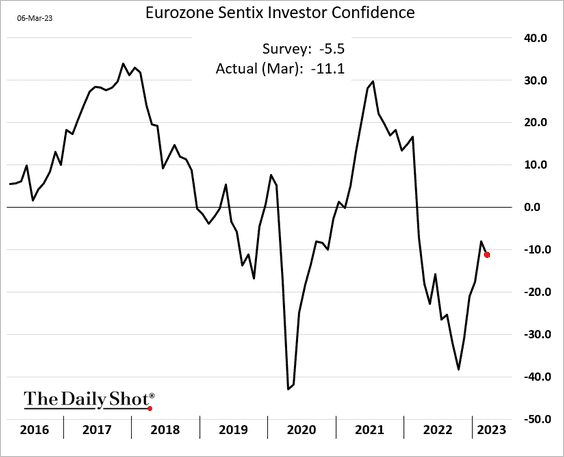
2. The Sentix investor confidence index unexpectedly declined this month.
3. Inflation gave companies cover to boost prices.
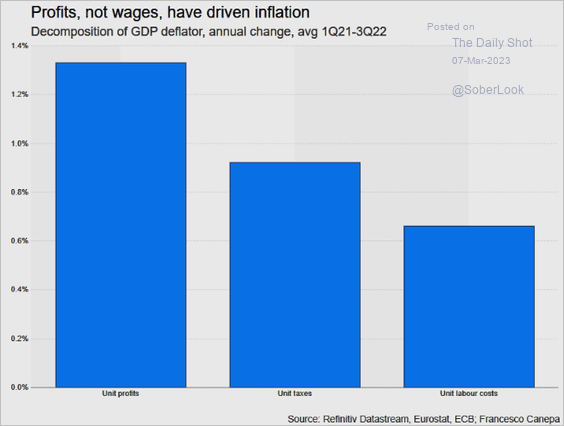 Source: Reuters Read full article
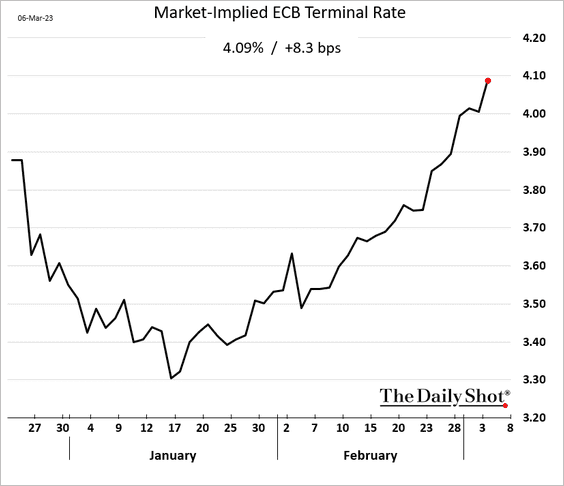
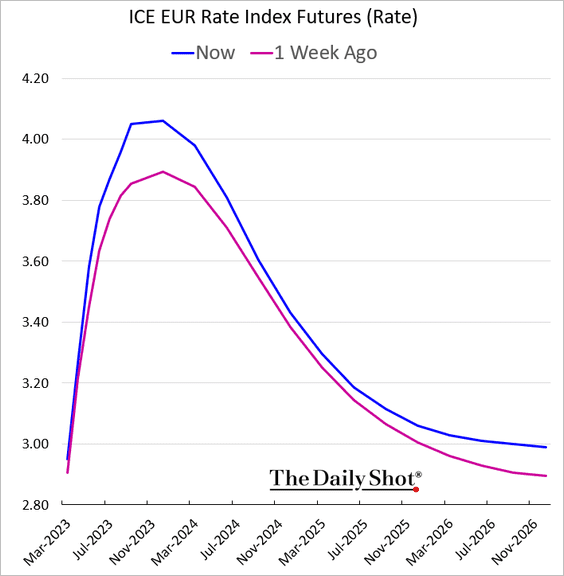
4. The market-implied ECB terminal rate continues to climb, breaching 4% in recent days.
Back to Index
Europe
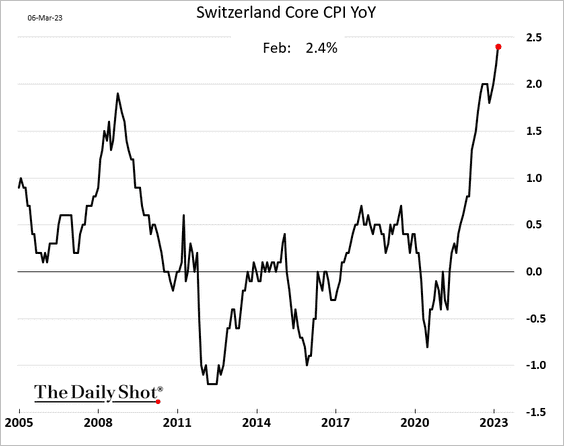
1. Switzerland’s core CPI is hitting multi-year highs.
2. European shares have widened their outperformance vs. the US.
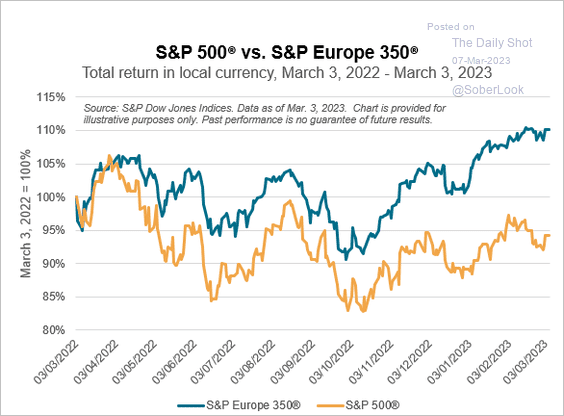 Source: S&P Dow Jones Indices
3. Bankruptcies have been surging in the EU.
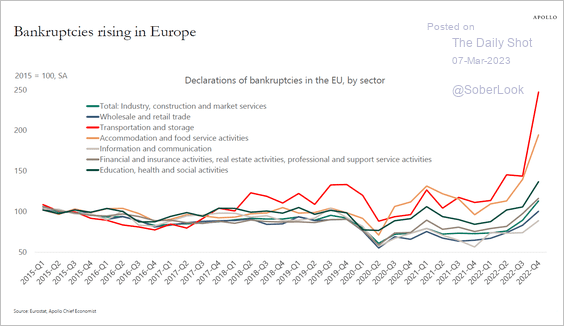 Source: Torsten Slok, Apollo
4. Next, we have Ukraine’s share of EU imports for select products.
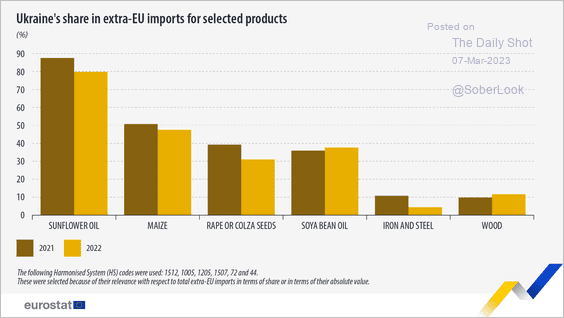 Source: Eurostat Read full article
Back to Index
Japan
1. Real wages tumbled in January.
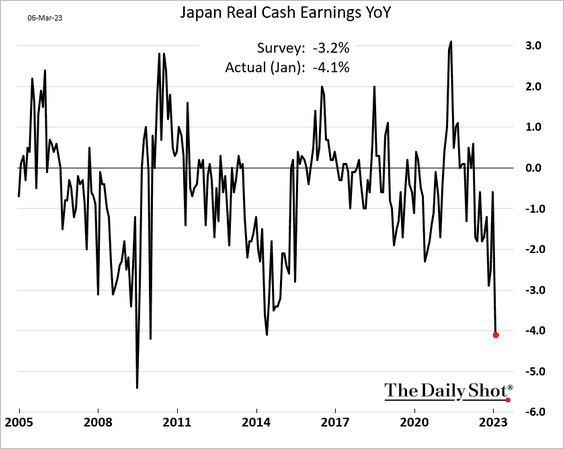
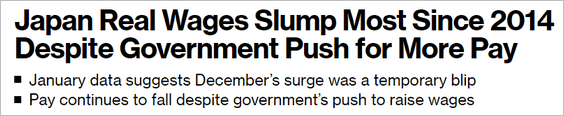 Source: @erica_yokoyama, @economics Read full article
——————–
2. Japanese banks and real estate stocks have underperformed over the past decade, but the downtrend is starting to stabilize.
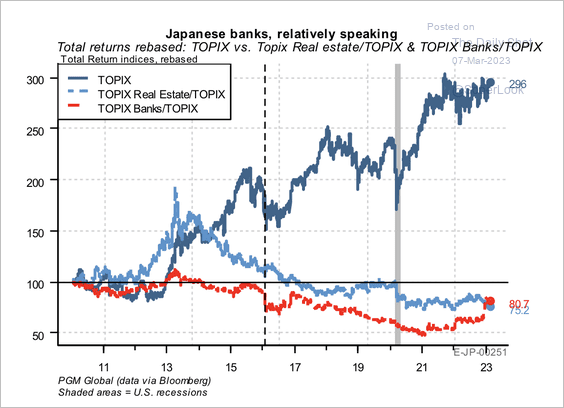 Source: PGM Global
Back to Index
Australia
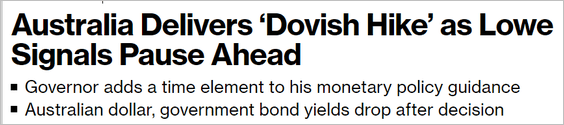
1. The RBA raised rates again, …
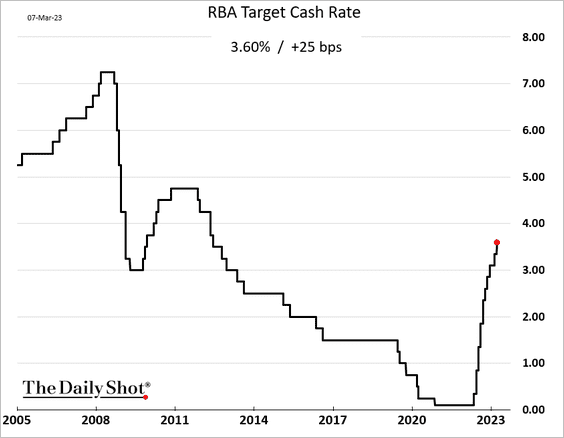
… in what analysts dubbed a “dovish hike.”
 Source: @Swatisays, @economics Read full article
2. The Aussie dollar and bond yields dropped.
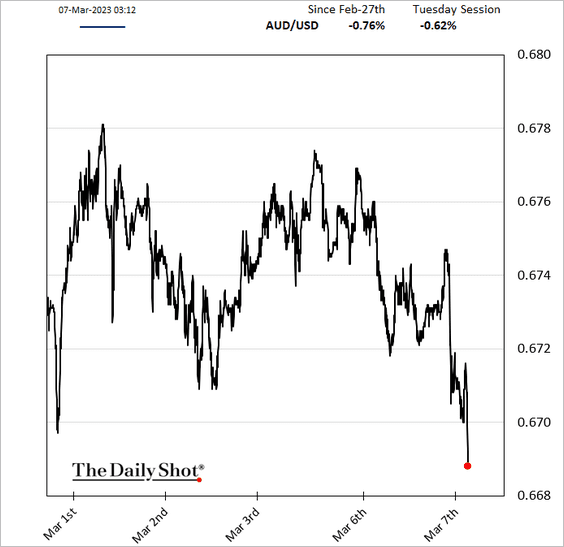
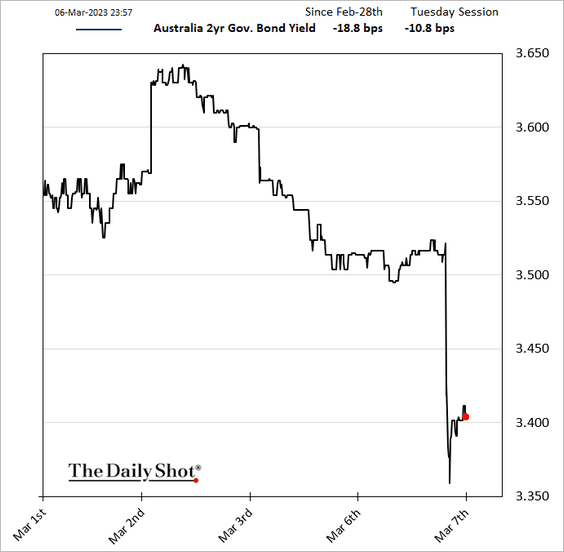
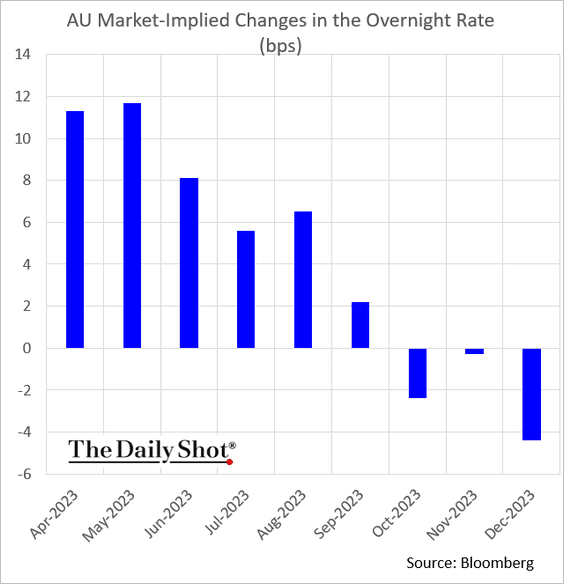
But the market still sees some additional rate hikes ahead.
——————–
3. Here is the CPI forecast from Capital Economics.
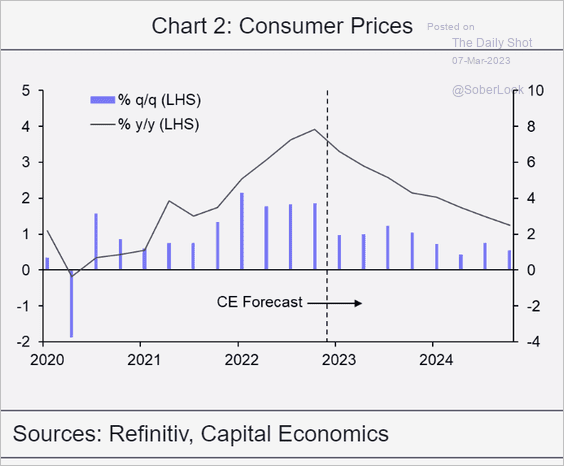 Source: Capital Economics
4. Consumer confidence remains depressed.
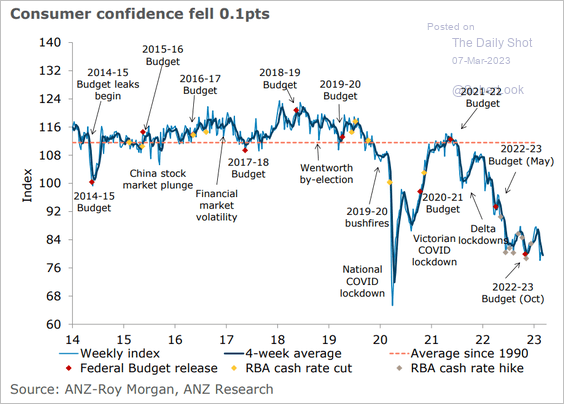 Source: @ANZ_Research
5. Falling housing finance commitments will continue to pressure home prices, according to Capital Economics.
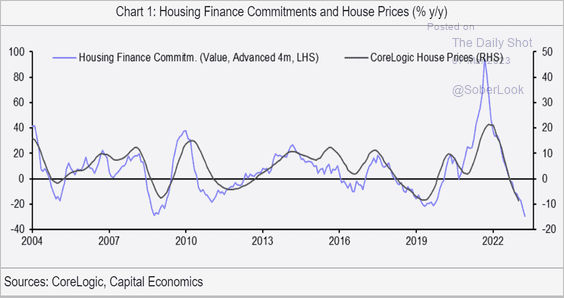 Source: Capital Economics
Back to Index
China
1. China’s benchmark equity index continues to test support at the 200-day moving average.
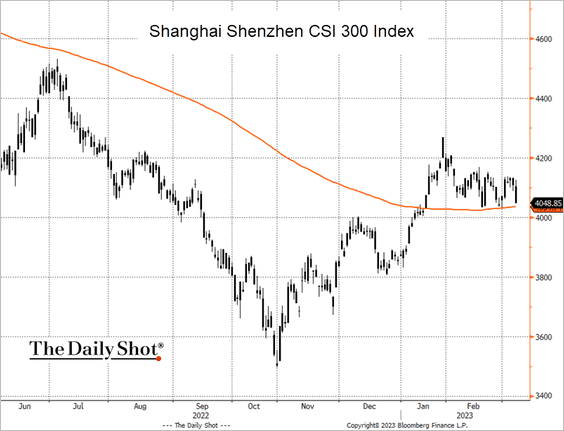 Source: @TheTerminal, Bloomberg Finance L.P.
2. China’s money supply growth has been outpacing other large economies.
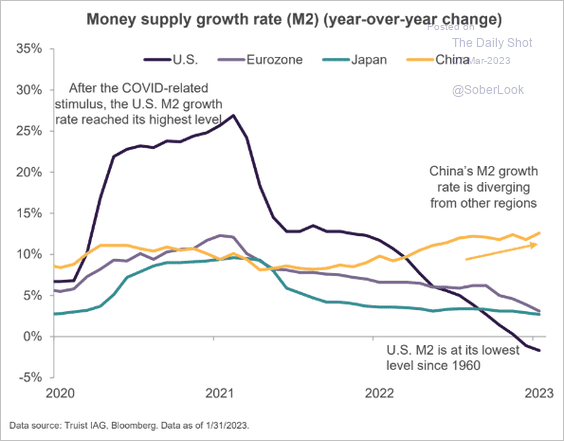 Source: Truist Advisory Services
3. Beijing is targeting 5% growth for this year.
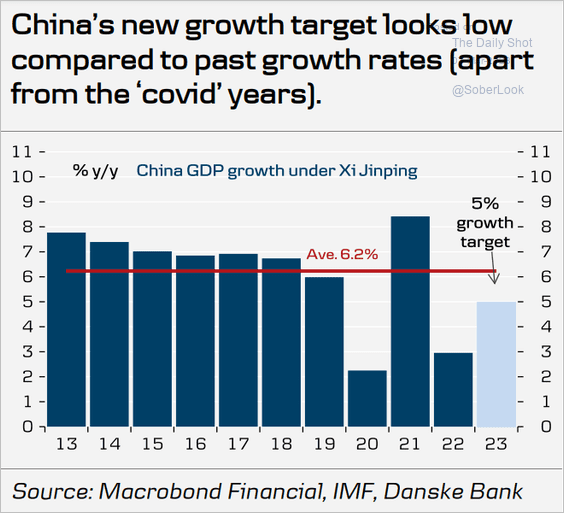 Source: Danske Bank
4. Many wealth management products (WMPs) have been trading below par.
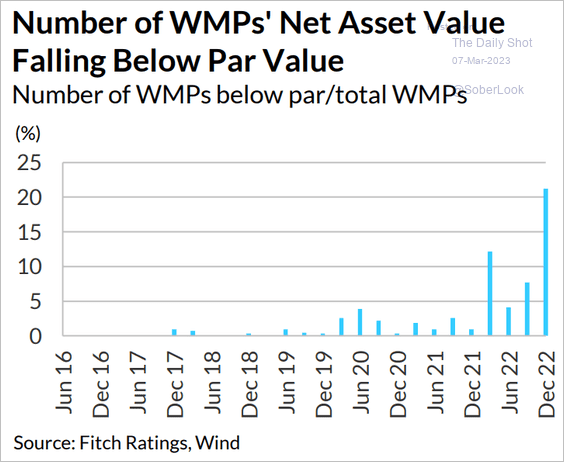 Source: Fitch Ratings
What do these products hold?
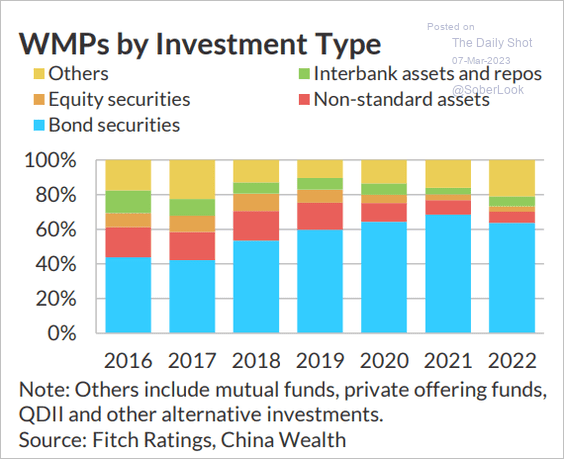 Source: Fitch Ratings
Back to Index
Emerging Markets
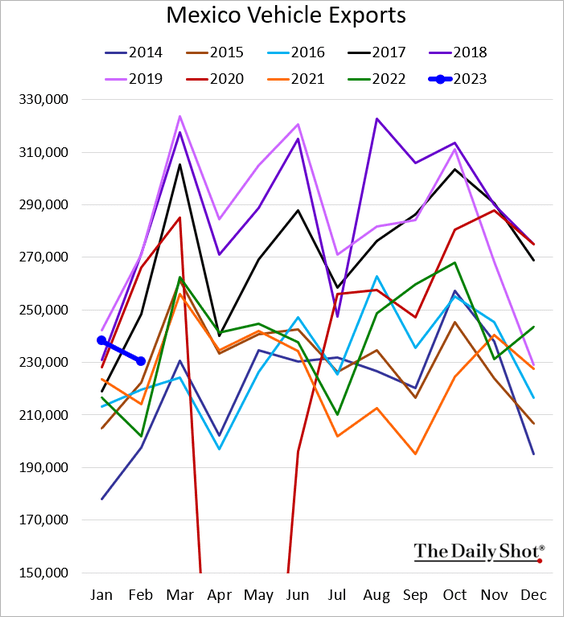
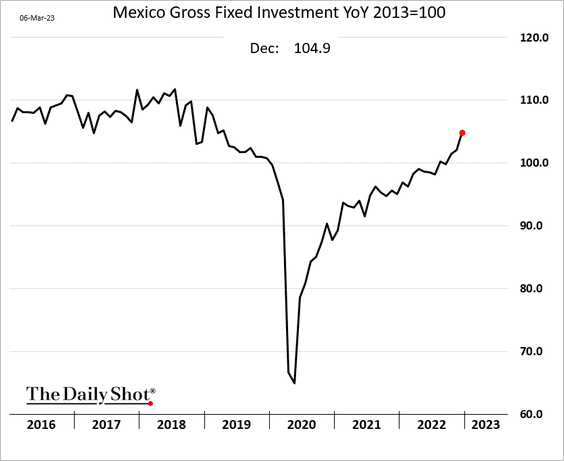
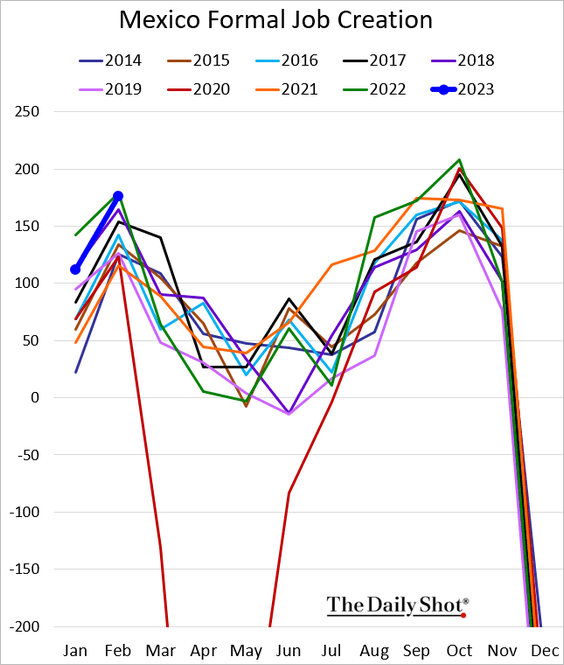
1. Let’s begin with Mexico.
• Vehicle exports (well above last year’s levels):
• Investment (still climbing):
• Formal job creation (in line with 2022):
——————–
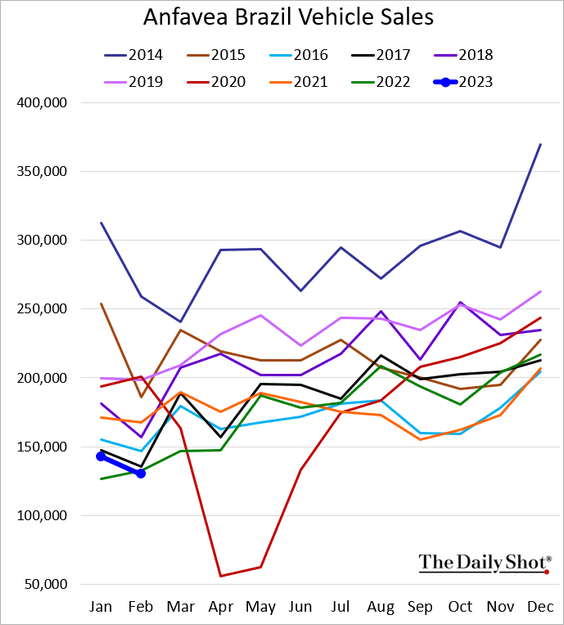
2. Brazil’s vehicle sales hit a multi-year low.
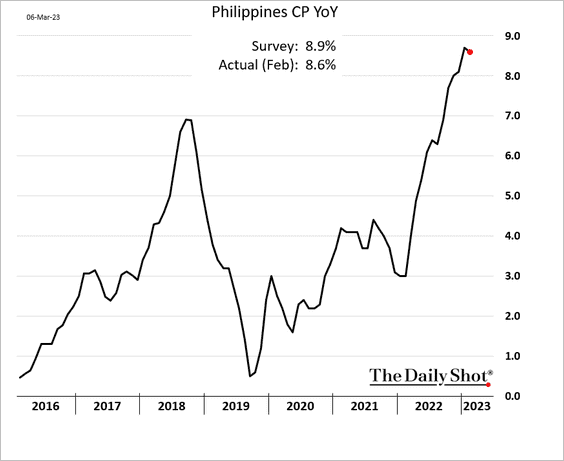
3. Philippine inflation appears to have peaked.
4. India’s trade policy remains very protectionist.
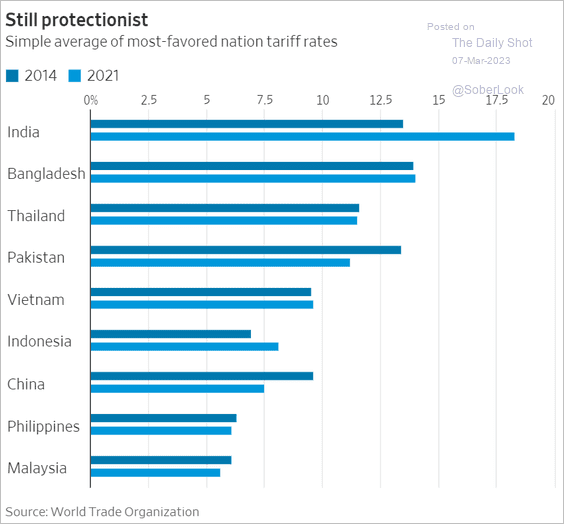 Source: @WSJ Read full article
5. EM equities continue to underperform.
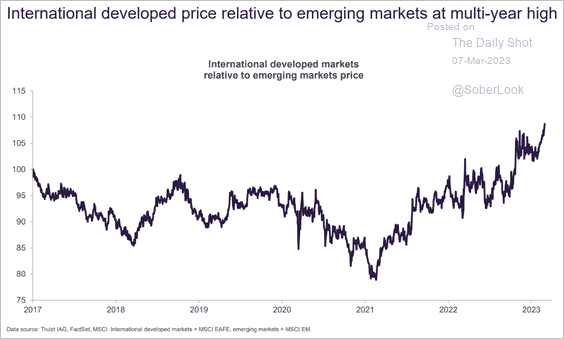 Source: Truist Advisory Services
Back to Index
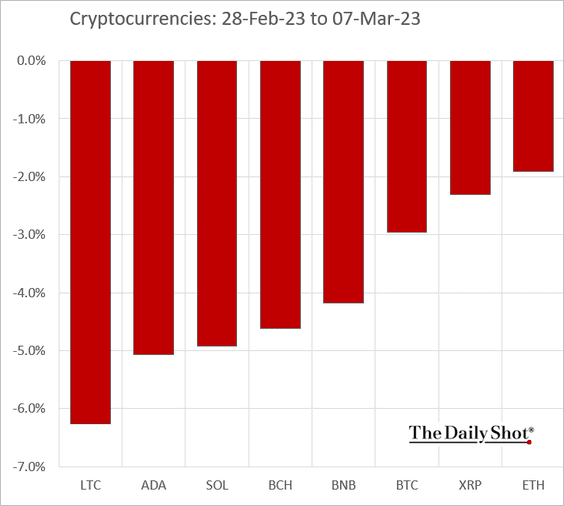
Cryptocurrency
1. Cryptos started the month on a weak note.
2. The Crypto Fear & Greed Index declined from “greed” territory over the past month. It is now neutral.
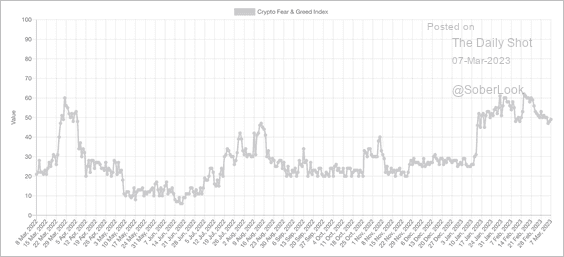 Source: Alternative.me
3. Last week’s sell-off triggered a spike in BTC long liquidations.
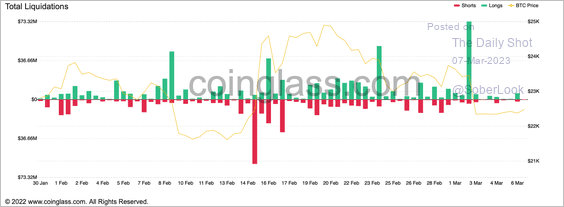 Source: Coinglass
4. Crypto funds saw their fourth consecutive week of outflows, led by long-bitcoin products.
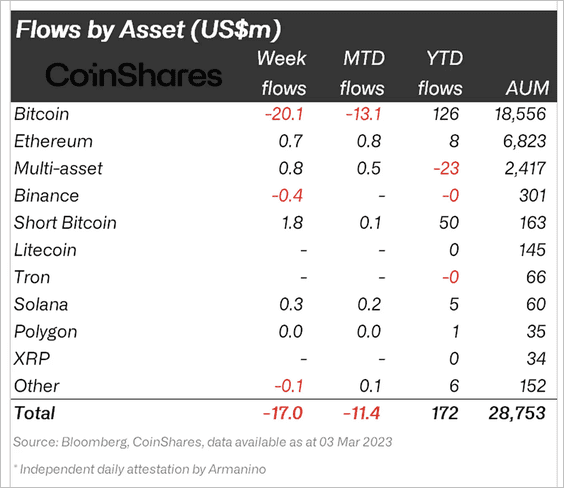 Source: CoinShares Read full article
5. WIll Grayscale be able to unlock the massive GBTC discount to NAV?
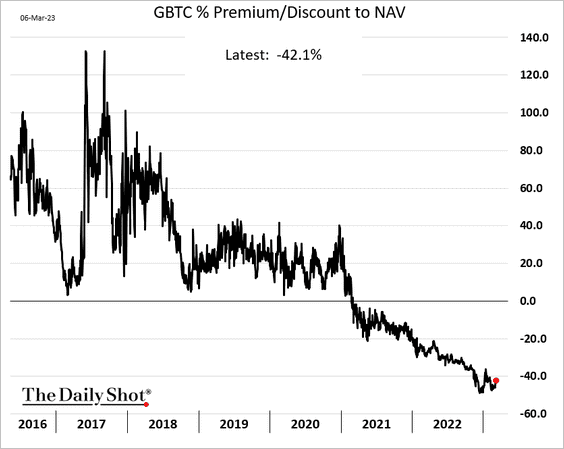
 Source: Bloomberg Law Read full article
Back to Index
Energy
1. Coal equities have been performing well.
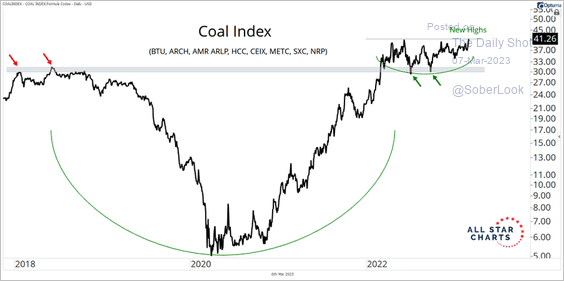 Source: @sstrazza
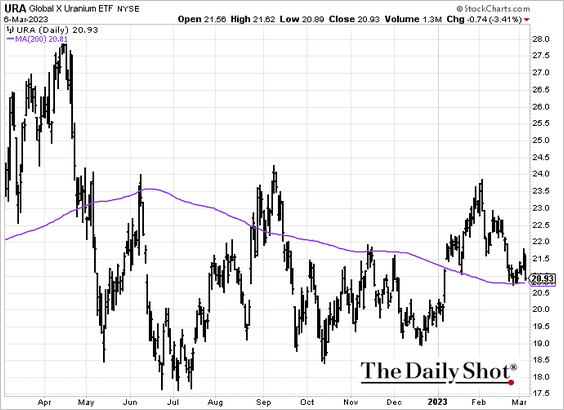
2. The Global X Uranium ETF is back at support at the 200-day moving average.
3. This chart shows US utility-scale energy storage capacity additions.
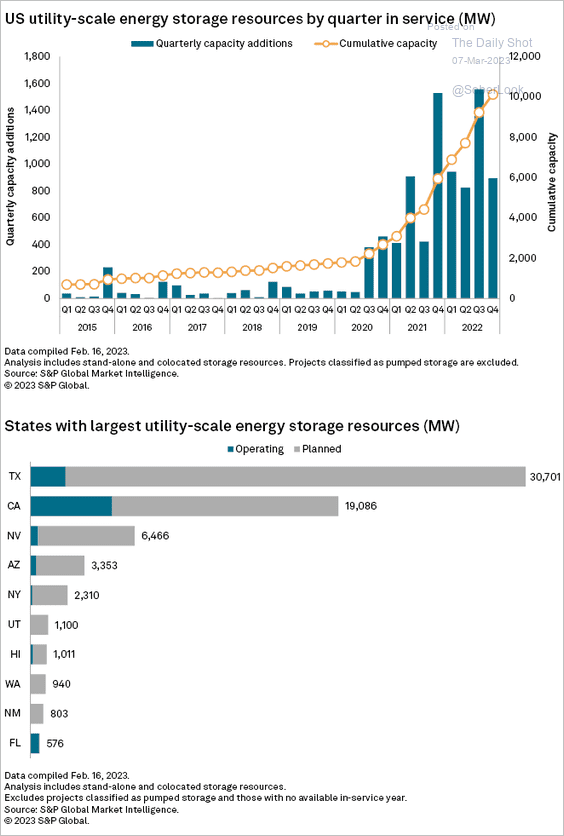 Source: S&P Global Market Intelligence
Back to Index
Equities
1. For the S&P 500 tech sector, expectations for quarterly earnings growth throughout 2023 have softened.
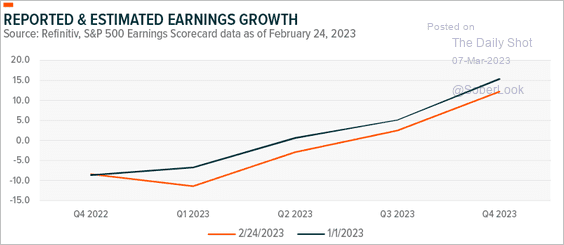 Source: Global X ETFs Read full article
• 2023 tech earnings are expected to be down on a year-over-year basis, which hasn’t happened in a while.
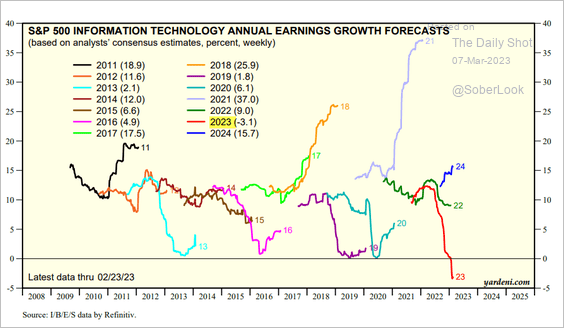 Source: Yardeni Research
• Technology, media, and telecom (TMT) stocks accounted for roughly 40% of the US market cap at their recent peak, similar to the tech bubble in 2000.
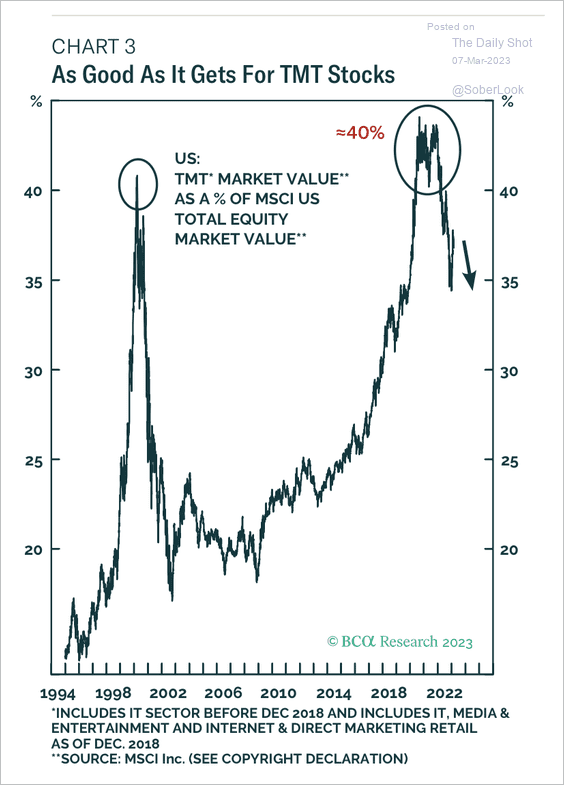 Source: BCA Research
A similar rotation out of TMT and into non-TMT stocks occurred over the past year. Repositioning may be temporary as the broader bear market takes hold.
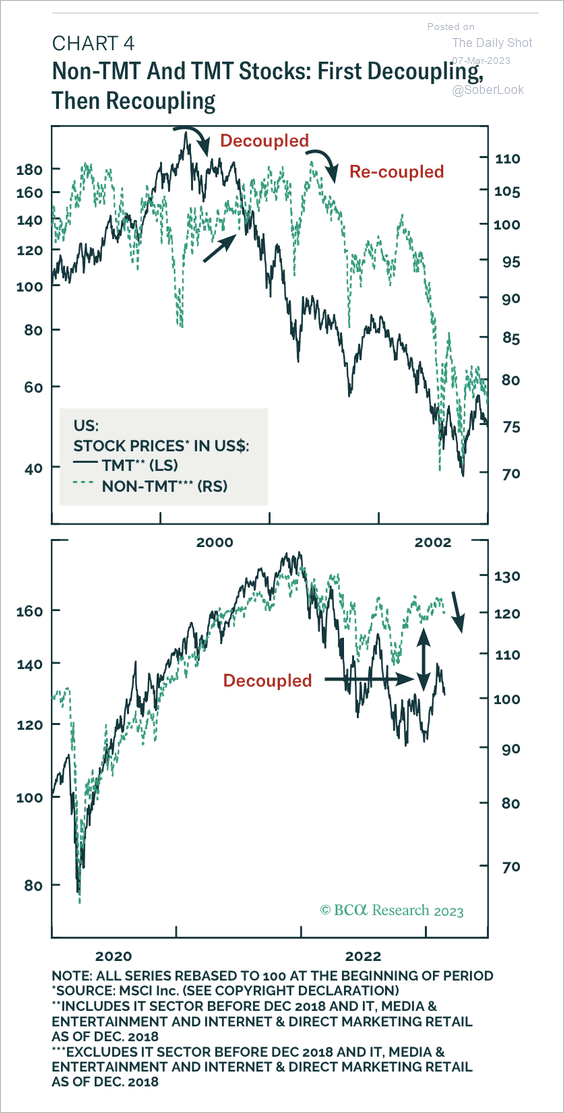 Source: BCA Research
——————–
2. Next, we have some data on stock buybacks.
• Buybacks by sector:
– Actual:
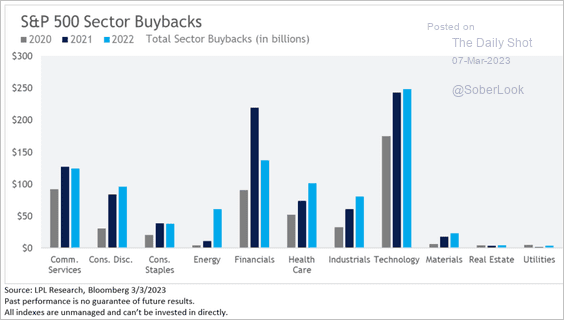 Source: LPL Research
– Announced:
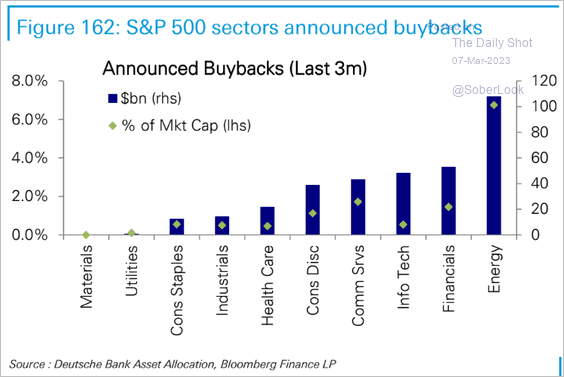 Source: Deutsche Bank Research
• Buybacks’ contribution to returns:
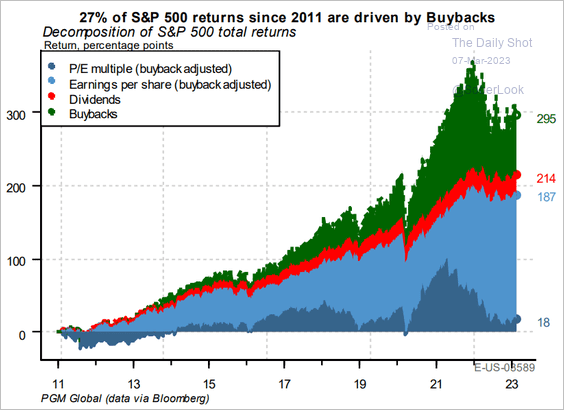 Source: PGM Global
• The buyback index (long-term performance):
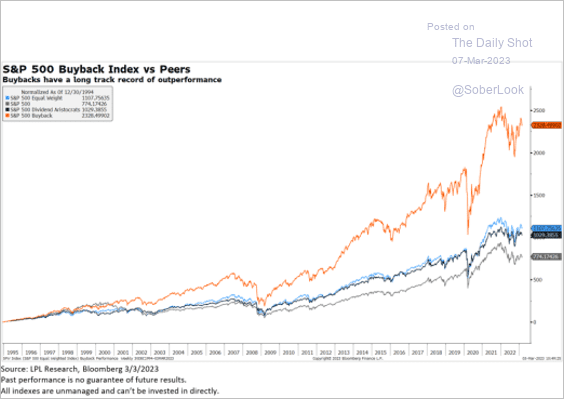 Source: LPL Research
• The buyback index vs. the pure growth factor (a breakdown in correlation since COVID):
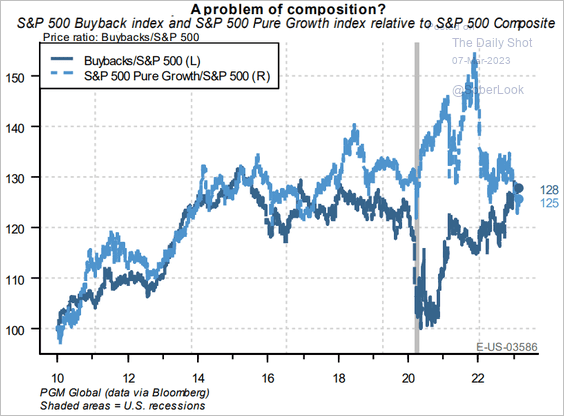 Source: PGM Global
——————–
3. Here is the evolution of management’s focus, based on earnings calls.
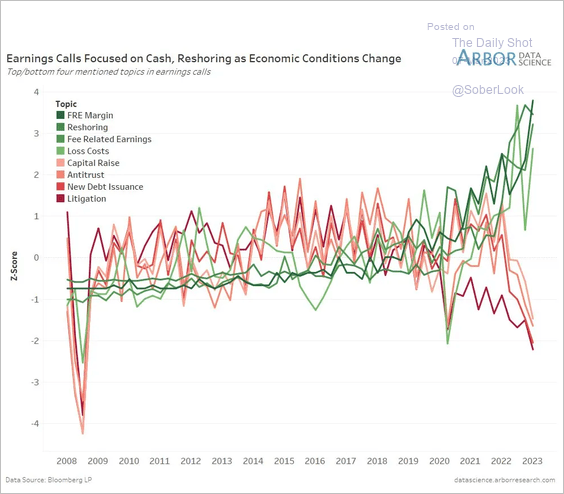 Source: @LizAnnSonders, @DataArbor, @Bloomberg
4. Industrials have outperformed in recent months.
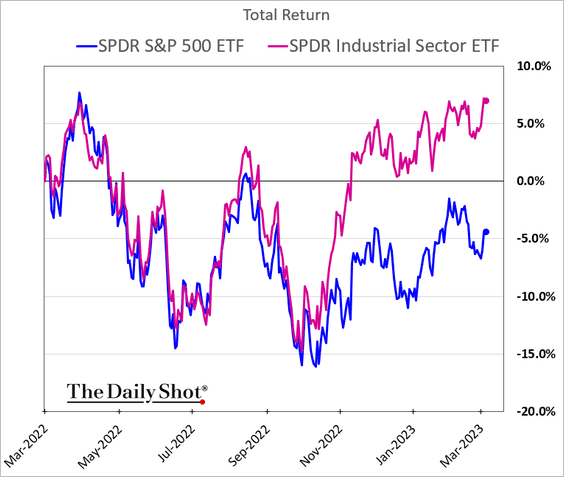 h/t @themarketear
5. The S&P 500 trailing earnings yield is now the same as the one-year T-Bill yield.
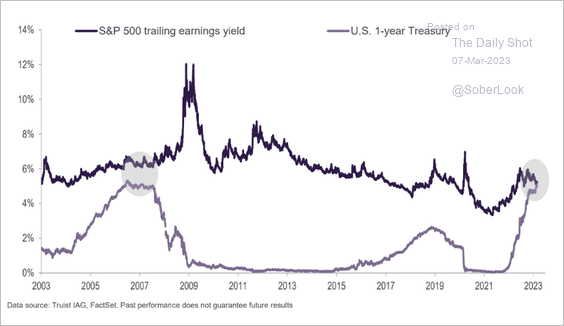 Source: Truist Advisory Services
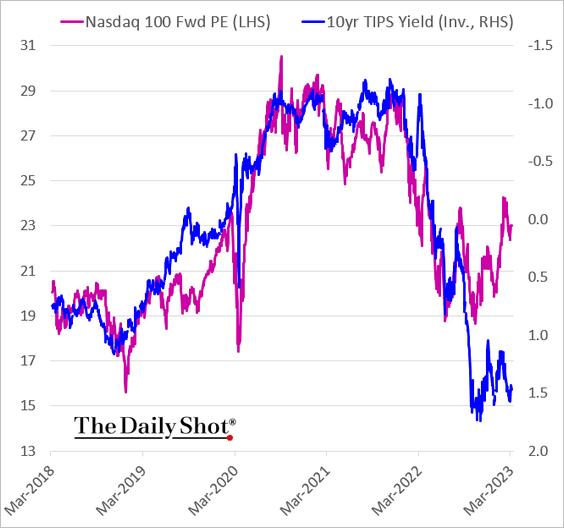
6. The Nasdaq 100 1-year forward PE ratio has decoupled from real yields.
7. The S&P 500 remains correlated to long-term Treasury prices, …
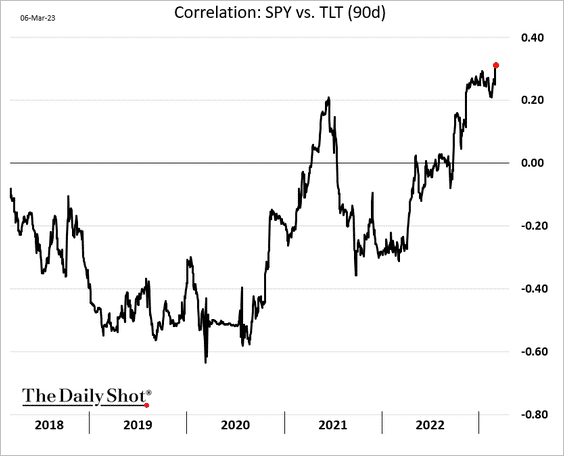
… and inversely correlated to Treasury implied vol.
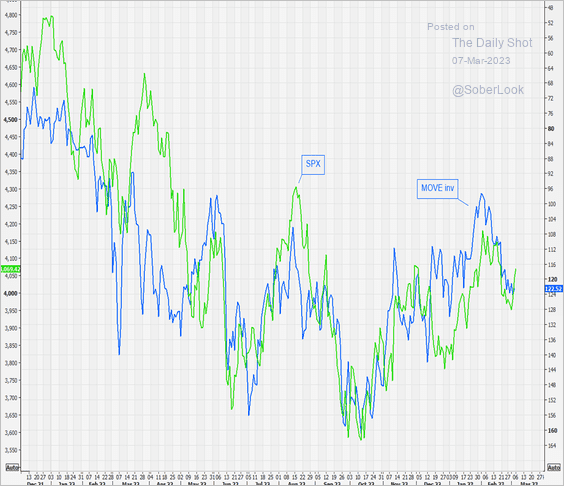 Source: @themarketear
Back to Index
Rates
1. Treasury market bearish bets are hitting new extremes.
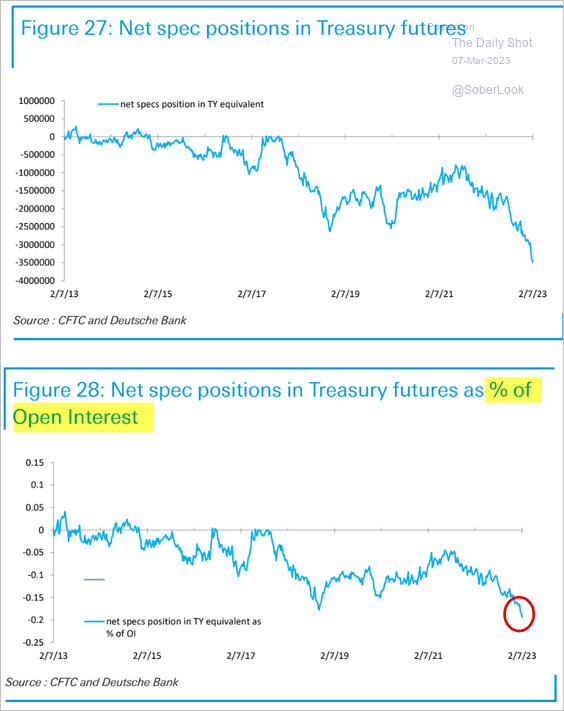 Source: Deutsche Bank Research
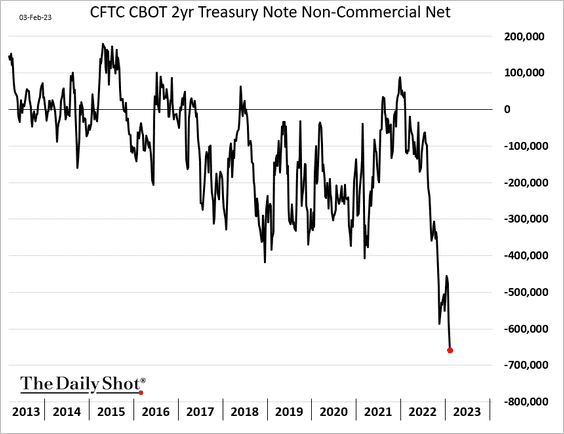
Here is the 2-year note futures positioning.
——————–
2. The 2s10s curve reaches its most inverted level around three months prior to a recession. Afterward, roughly 12-18 months of steepening occurs. Deutsche Bank estimates the US is about six months away from a recession.
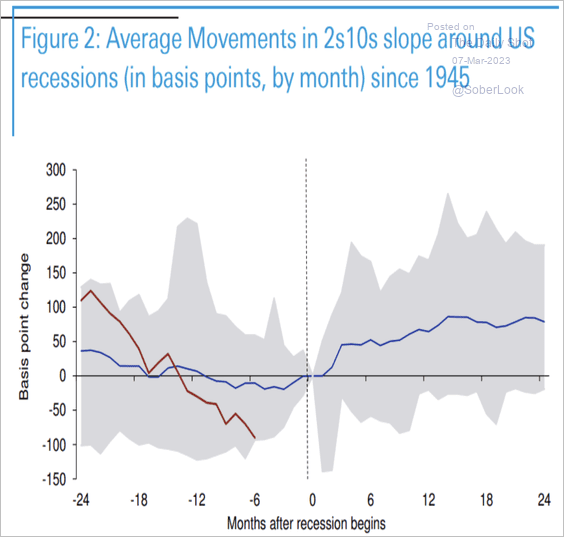 Source: Deutsche Bank Research
3. Will Japanese investors continue buying Treasuries?
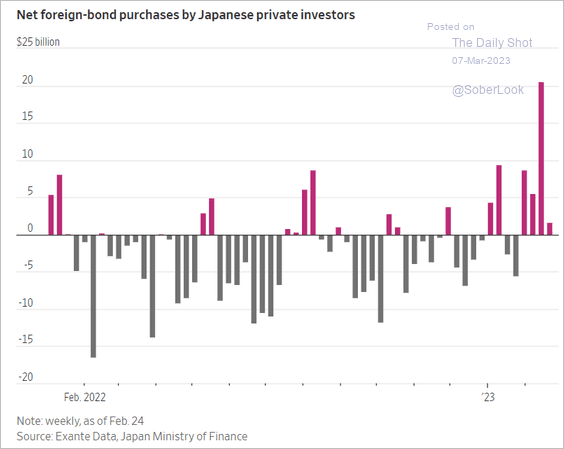 Source: @WSJ Read full article
Back to Index
Global Developments
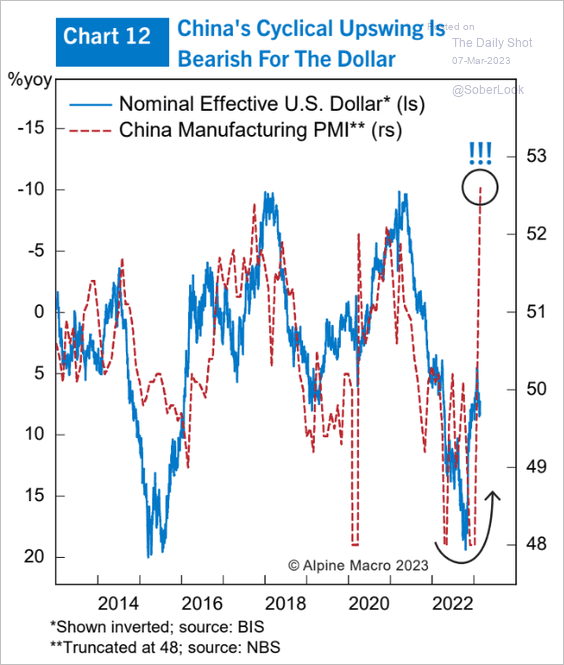
1. China’s reopening is bearish for the US dollar.
 Source: Alpine Macro
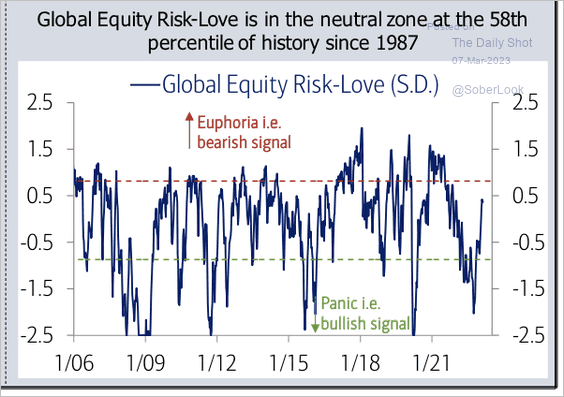
2. Global equity sentiment improved, but is not yet euphoric, according to BofA.
 Source: BofA Global Research
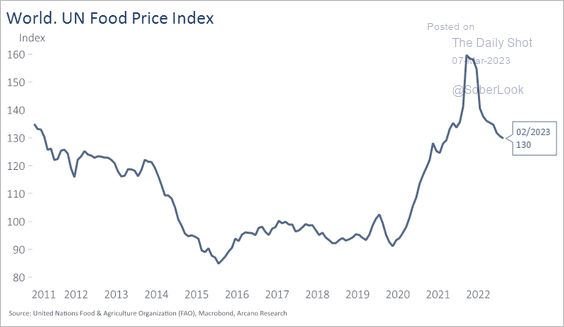
3. Food prices continue to ease.
 Source: Arcano Economics
——————–
Food for Thought
1. PC/notebook market share:
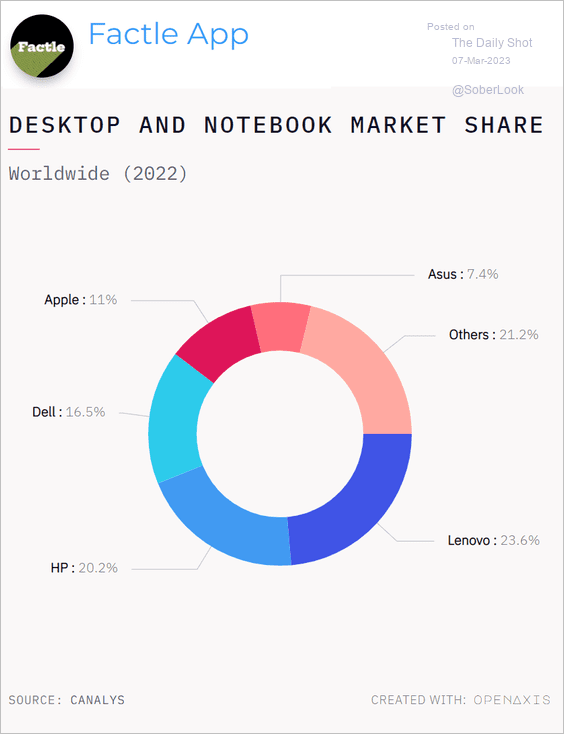 Source: @OpenAxisHQ
2. Most visited websites:
 Source: Visual Capitalist Read full article
3. Demand for tech skills:
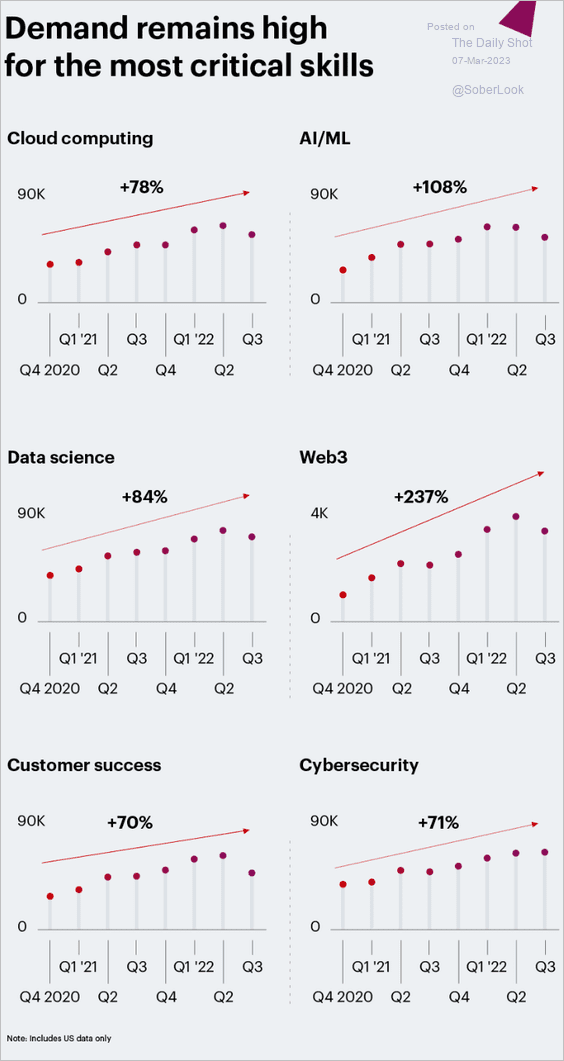 Source: Bain & Company
4. The global democracy index:
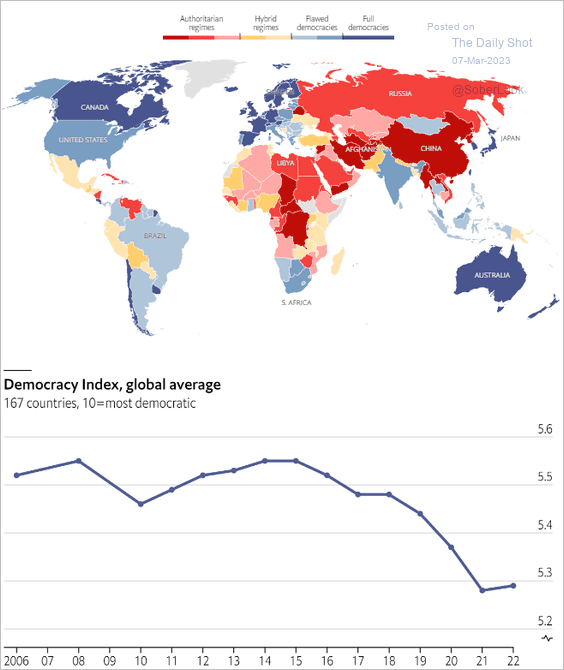 Source: The Economist Read full article
5. Growing polarization in the US:
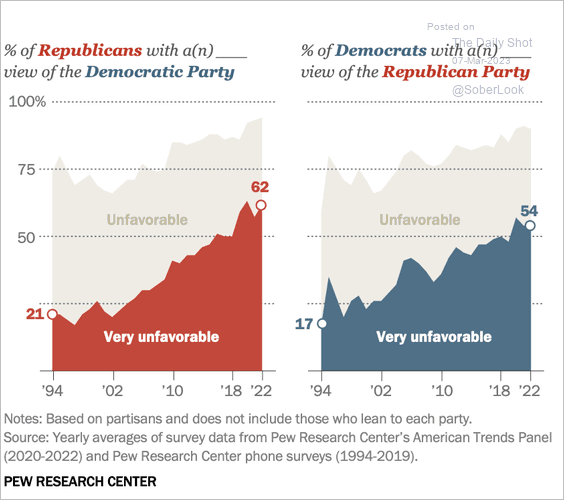 Source: Pew Research Center Read full article
6. For some countries, remittances are such a substantial component of GDP that they have few incentives to stem emigration.
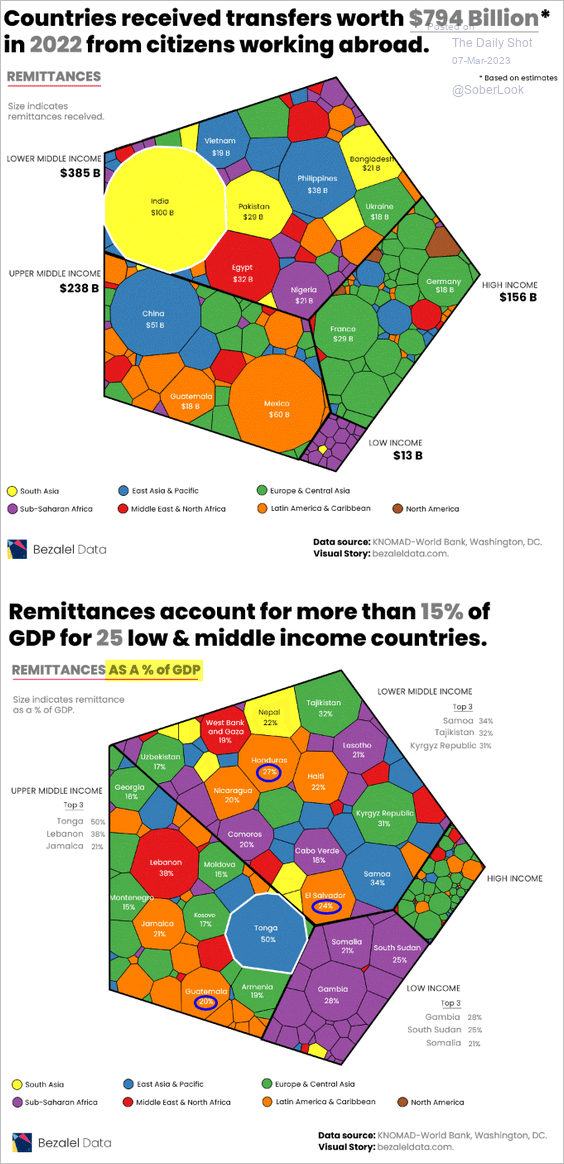 Source: Visual Capitalist Read full article
7. Odds of death:
 Source: Visual Capitalist Read full article
——————–
Back to Index