
The Daily Shot: 14-Mar-23
• The United States
• Canada
• The Eurozone
• Europe
• Asia – Pacific
• China
• Emerging Markets
• Cryptocurrency
• Commodities
• Energy
• Equities
• Credit
• Rates
• Global Developments
• Food for Thought
The United States
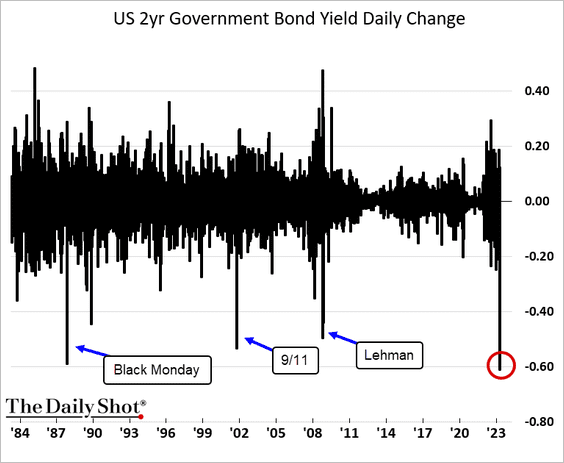
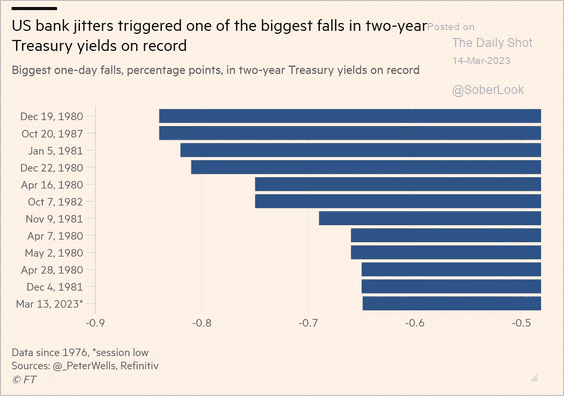
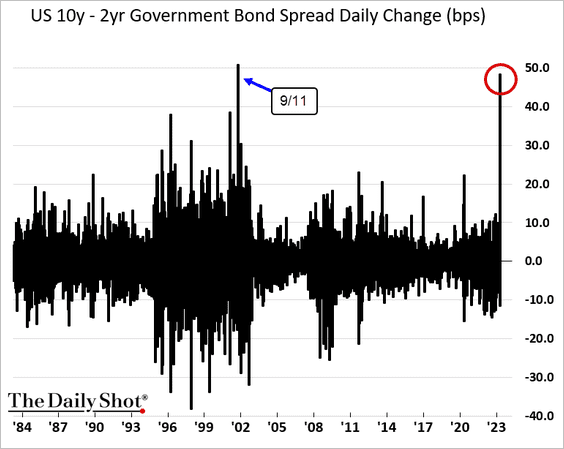
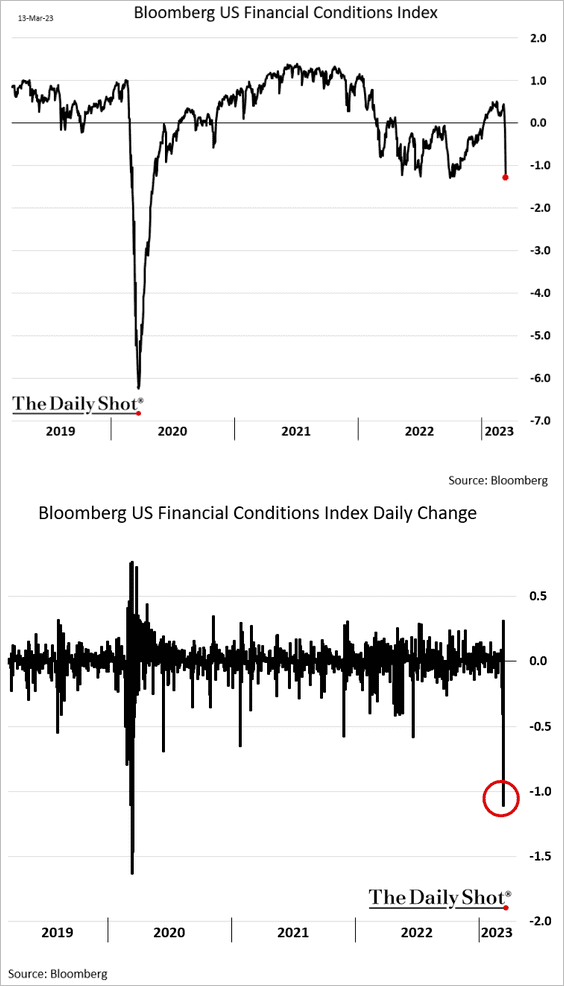
1. Let’s begin with some market reactions to the SVB collapse.
• The 2-year Treasury yield saw its biggest one-day decline in decades (dipping below 4%), as the market repriced Fed rate hike expectations (3 charts).
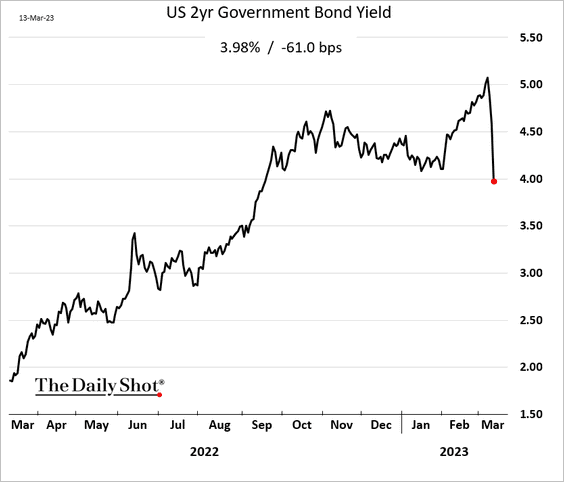
 Source: @financialtimes Read full article
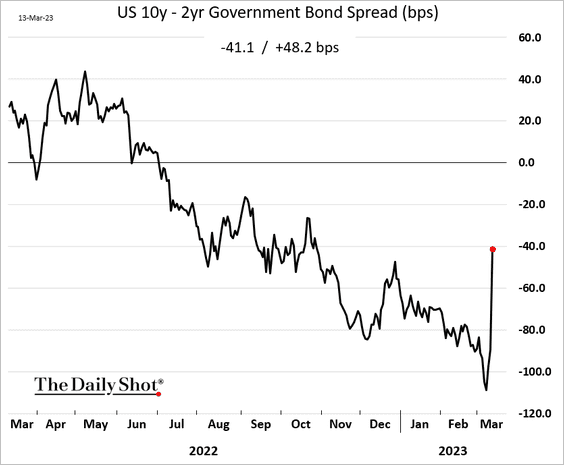
• The Treasury curve steepened sharply.
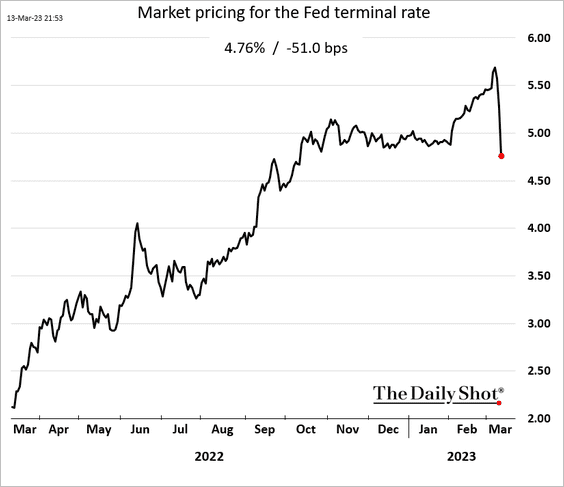
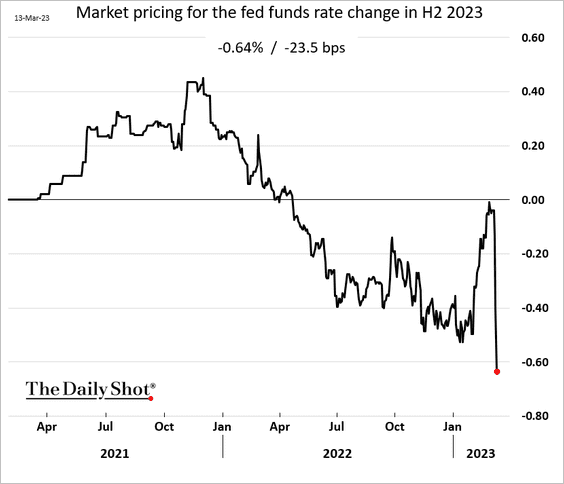
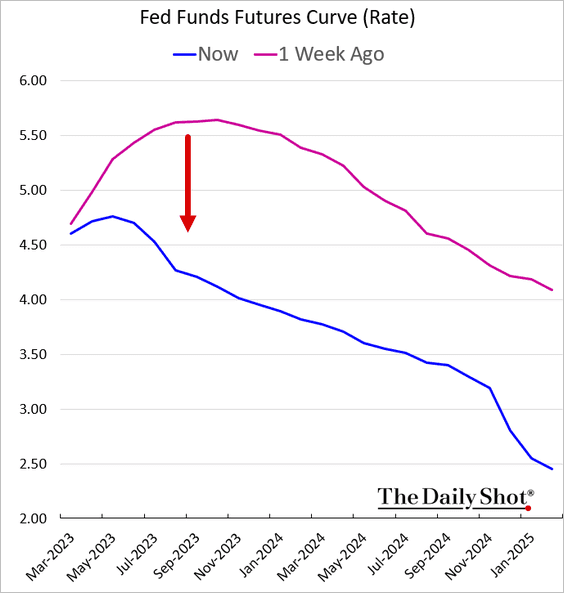
• The market removed over 50 bps worth of rate hikes, …
…and added substantial rate cuts later this year.
• Financial conditions tightened meaningfully on Monday.
——————–
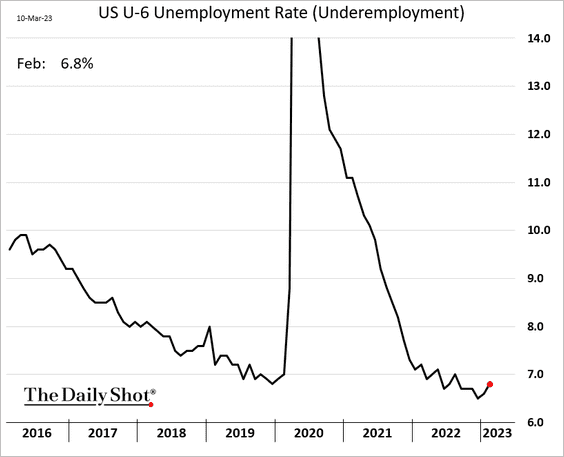
2. Next, we have some updates on the labor market.
• Underemployment ticked higher last month as more Americans entered the labor force.
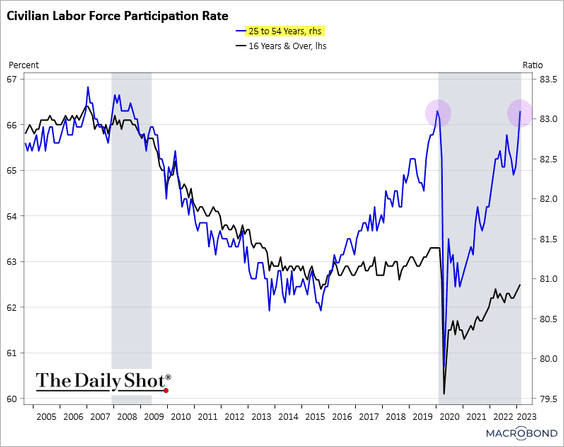
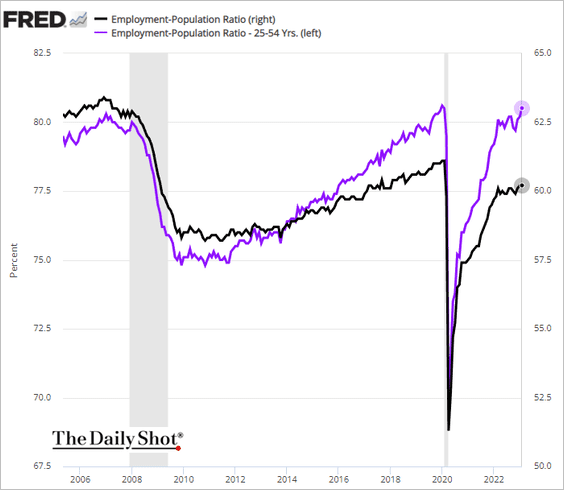
• The prime-age labor force participation rate is back at pre-COVID levels.
 Source: Chart and data provided by Macrobond
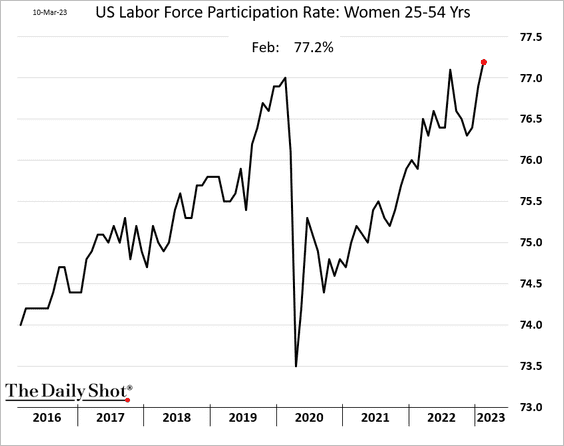
– The participation rate among prime-age women is now well above pre-COVID levels.
– Here is the employment-to-population ratio.
– Labor force participation among Americans aged 55 and over is nearing the COVID-era lows, …
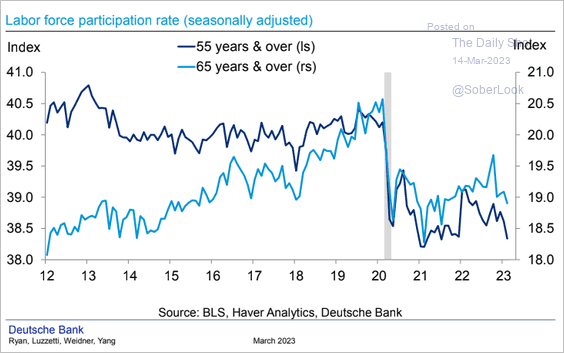 Source: Deutsche Bank Research
… with “excess” retirements holding at the highs.
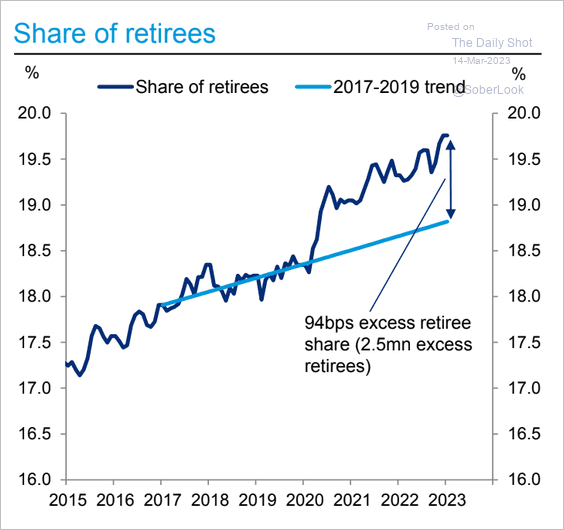 Source: Deutsche Bank Research
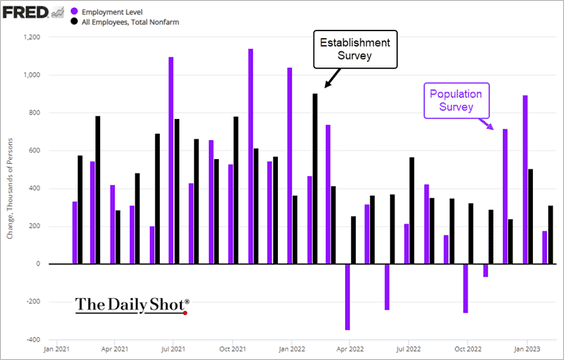
• The Population Survey showed lower job gains than the official nonfarm figure.
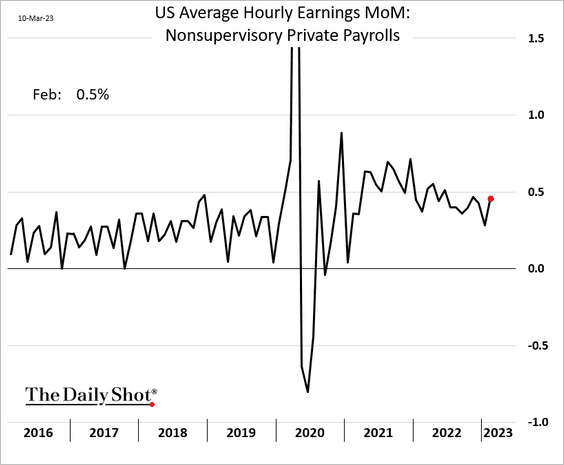
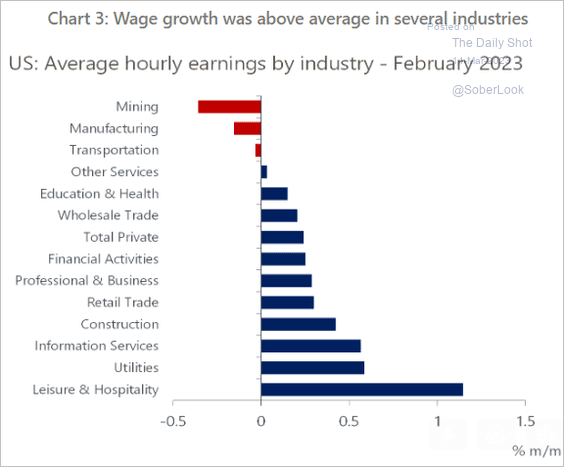
• Despite slower overall wage increases, nonsupervisory hourly earnings growth strengthened.
Here is the breakdown by industry.
 Source: Oxford Economics
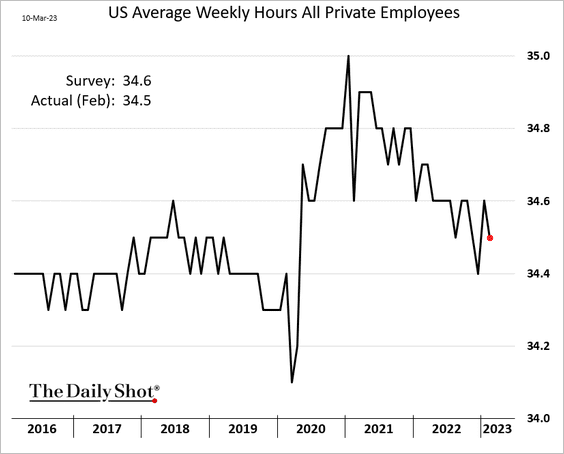
• Hours worked edged lower.
• The proportion of industries adding jobs eased.
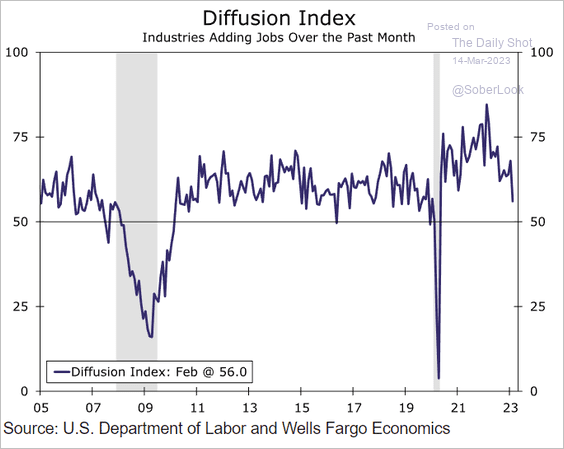 Source: Wells Fargo Securities
• Leading indicators signal a softer labor market ahead.
– NFIB:
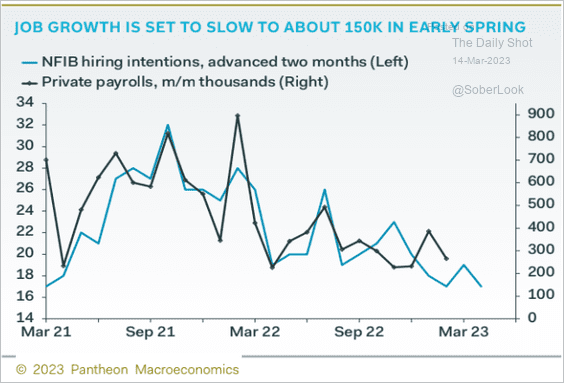 Source: Pantheon Macroeconomics
– MarketDesk’s leading unemployment index:
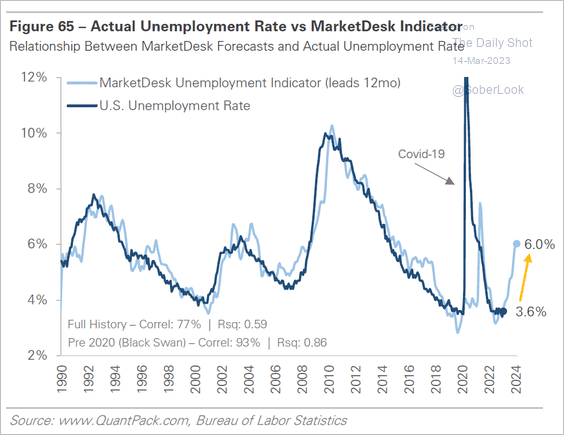 Source: MarketDesk Research
• According to the NY Fed’s consumer survey, Americans remain relatively unconcerned about losing their job.
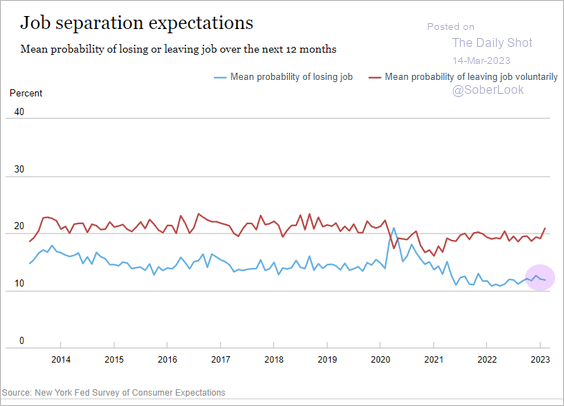 Source: Federal Reserve Bank of New York
——————–
3. Consumer inflation expectations continue to ease.
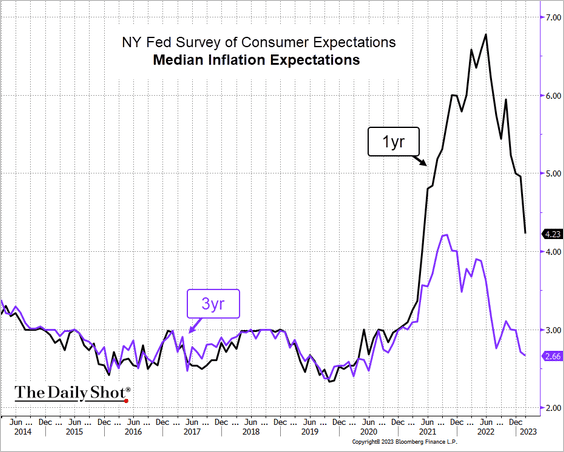 Source: @TheTerminal, Bloomberg Finance L.P.
4. Morgan Stanley expects consumption to slow significantly this year. A gradual rebound will likely remain below potential.
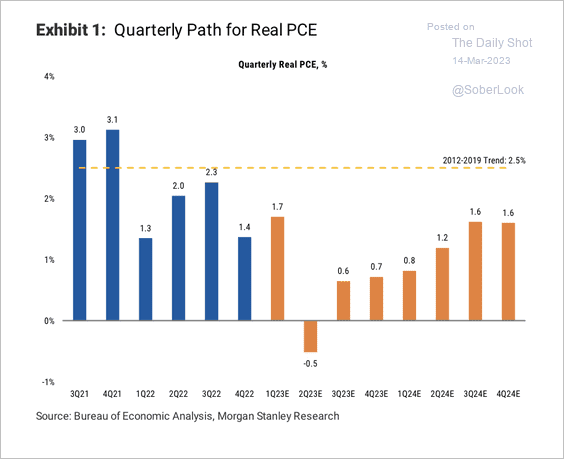 Source: Morgan Stanley Research
• BofA’s credit card data points to a goods-to-services spending rotation last month.
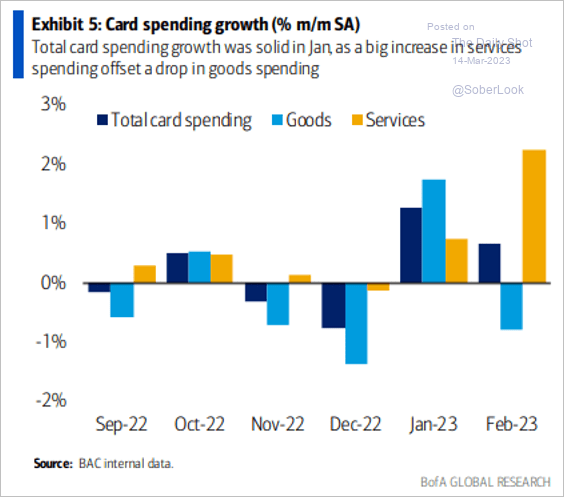 Source: BofA Global Research; @MikeZaccardi
Back to Index
Canada
1. The market sees a rate cut as the next BoC action.
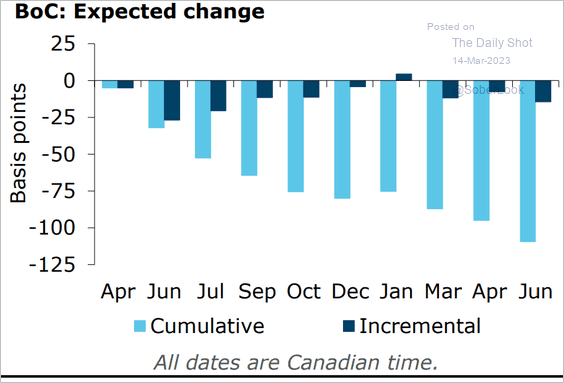 Source: @ANZ_Research
2. Total hours worked is tracking a big jump this quarter.
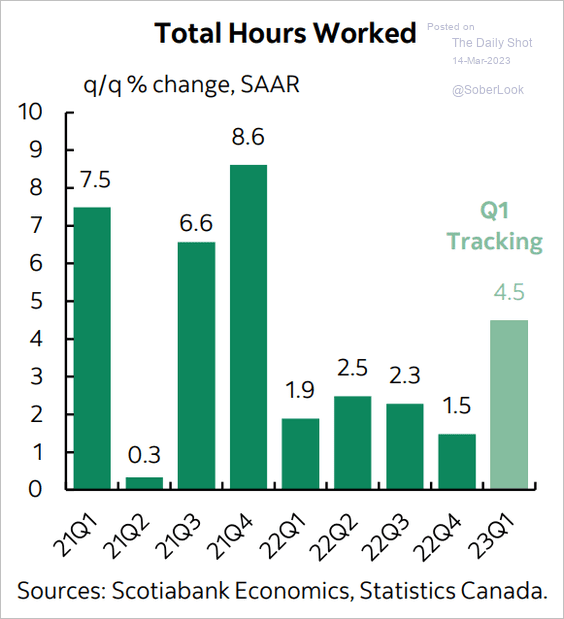 Source: Scotiabank Economics
Back to Index
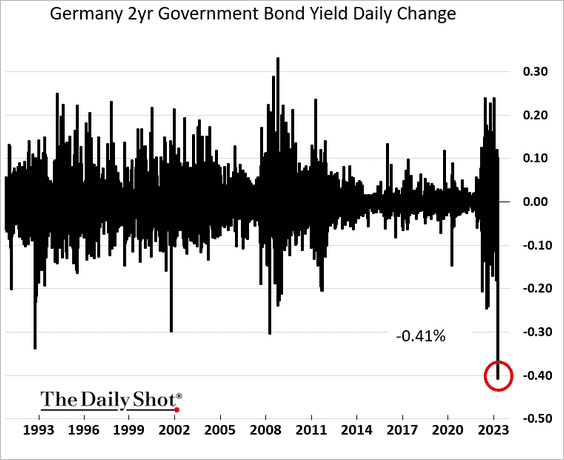
The Eurozone
1. The 2-year Bund yield tumbled with Treasuries, …
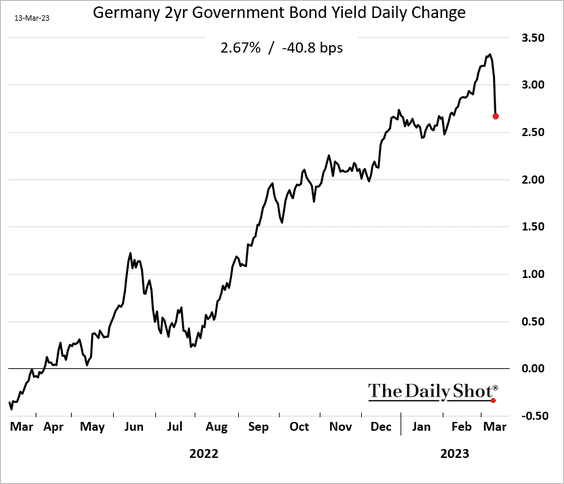
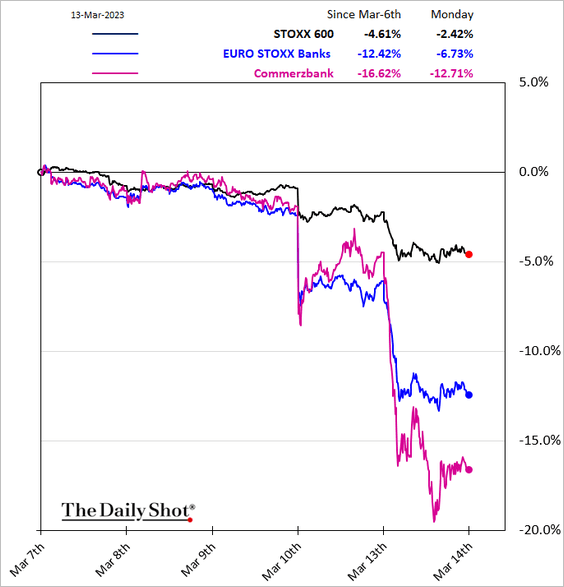
… as European bank shares tumbled.
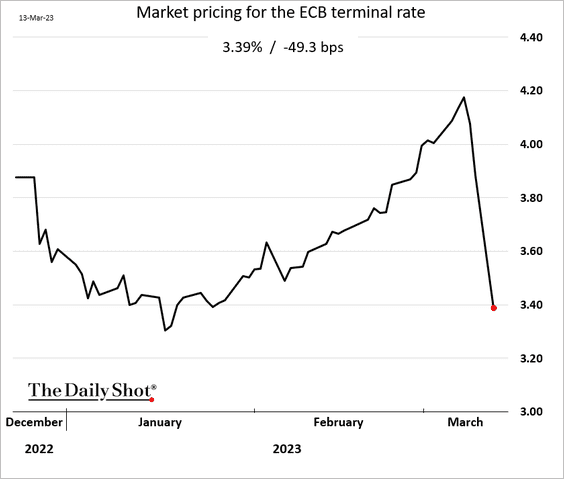
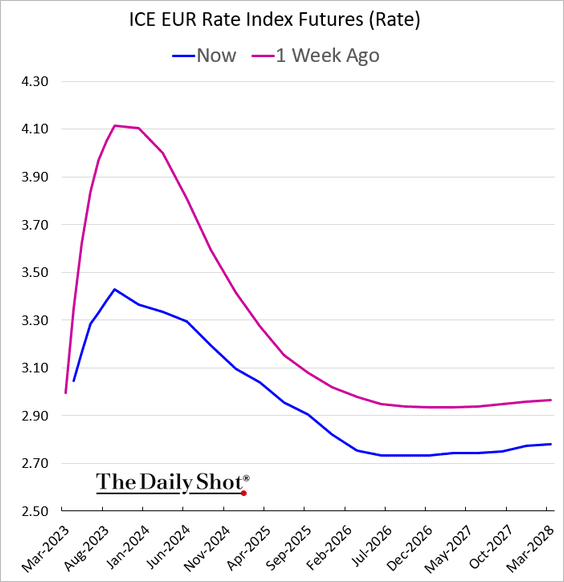
• The market has massively repriced the ECB terminal rate (2 charts).
——————–
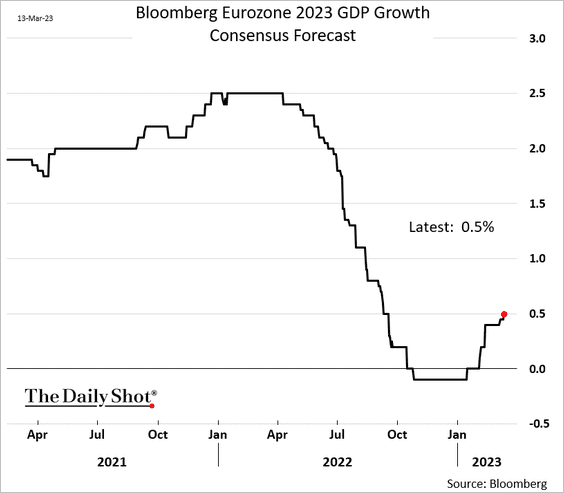
2. Economists boosted their GDP forecasts again.
3. How will the market respond to the ECB under different scenarios?
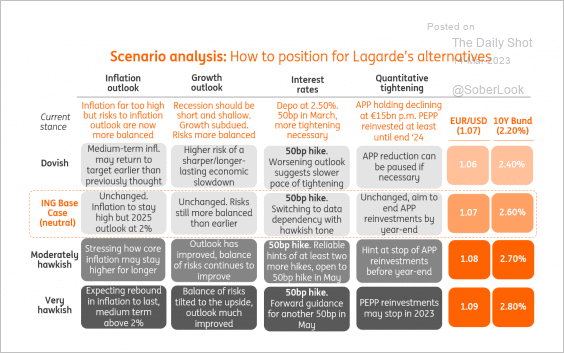 Source: ING
4. Eurozone investment-grade debt is vulnerable.
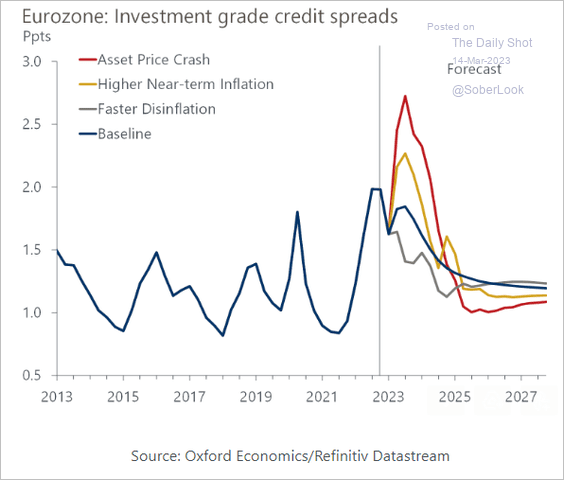 Source: Oxford Economics
Back to Index
Europe
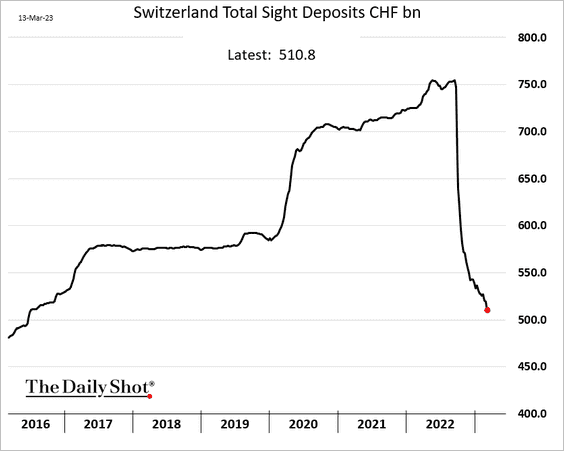
1. Switzerland’s central bank continues to tighten monetary conditions amid stubbornly high core inflation.
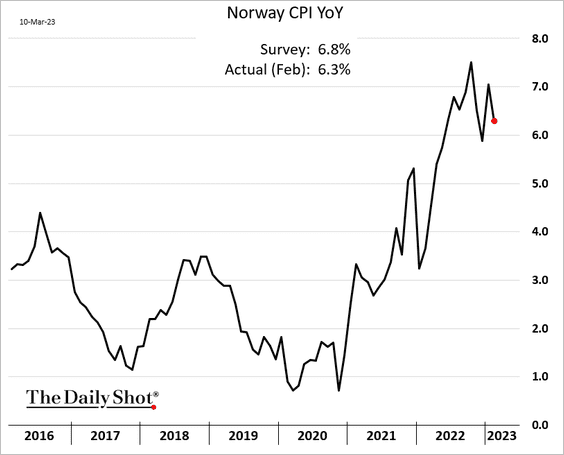
2. Norway’s CPI was lower than expected.
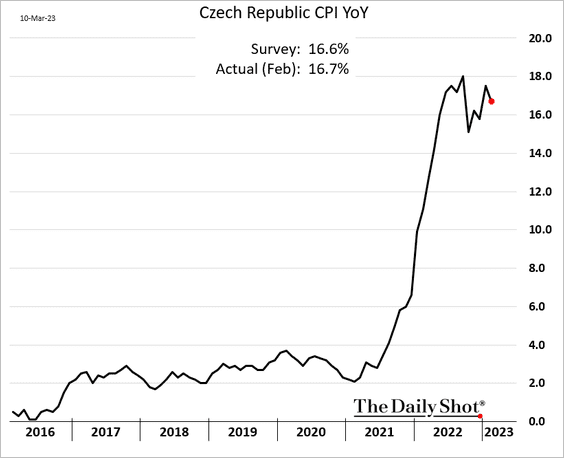
3. Czech inflation remains persistently high.
Back to Index
Asia – Pacific
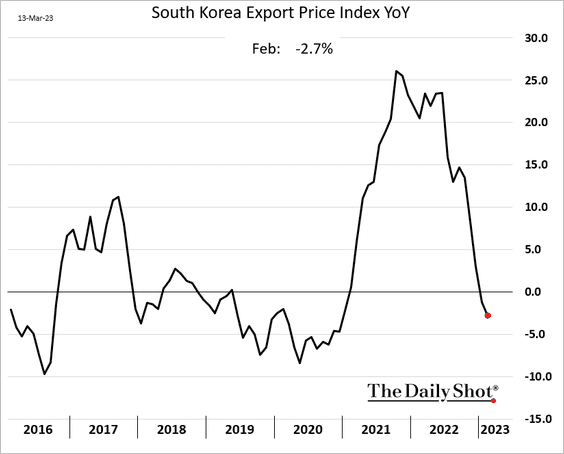
1. South Korea’s export prices continue to decline.
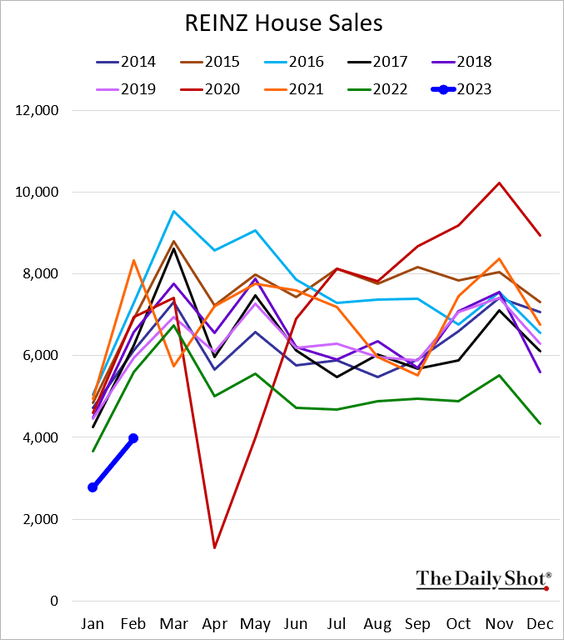
2. New Zealand’s home sales remain at multi-year lows.
3. Australia’s consumer and business sentiment is not rebounding.
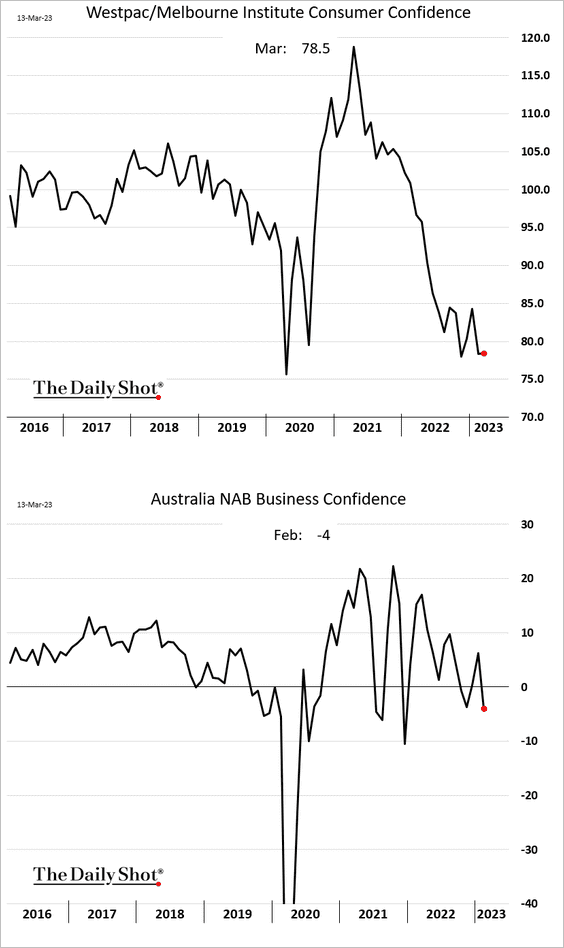
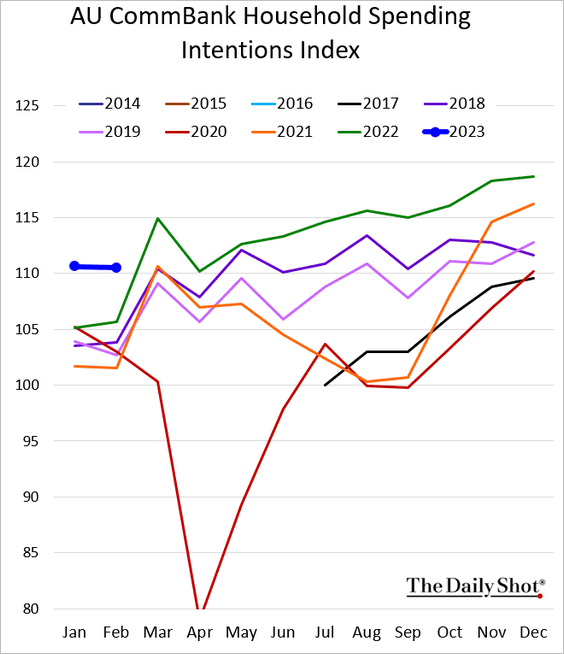
But households’ spending intentions are strong.
Back to Index
China
1. Subpar growth could add pressure on the PBoC to remain accommodative.
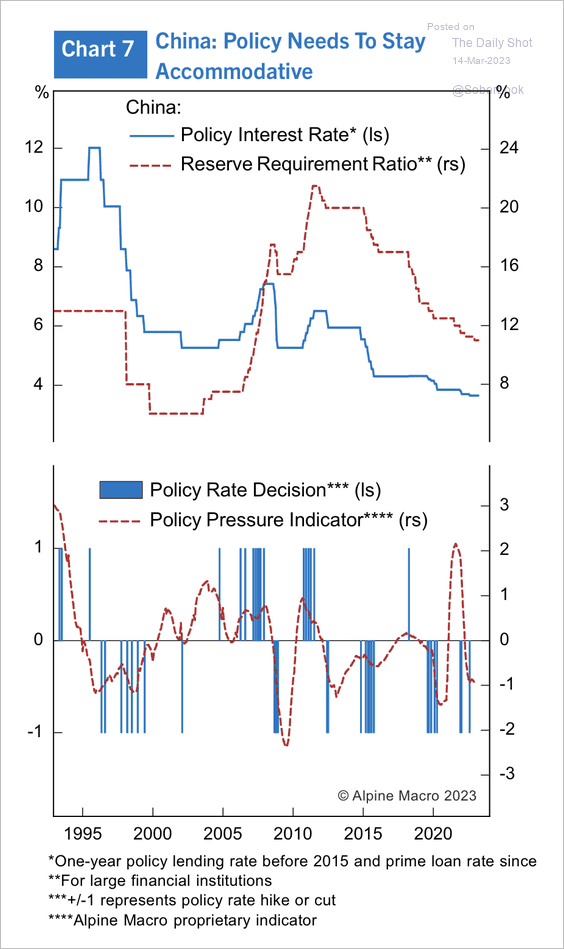 Source: Alpine Macro
2. Will infrastructure spending slow?
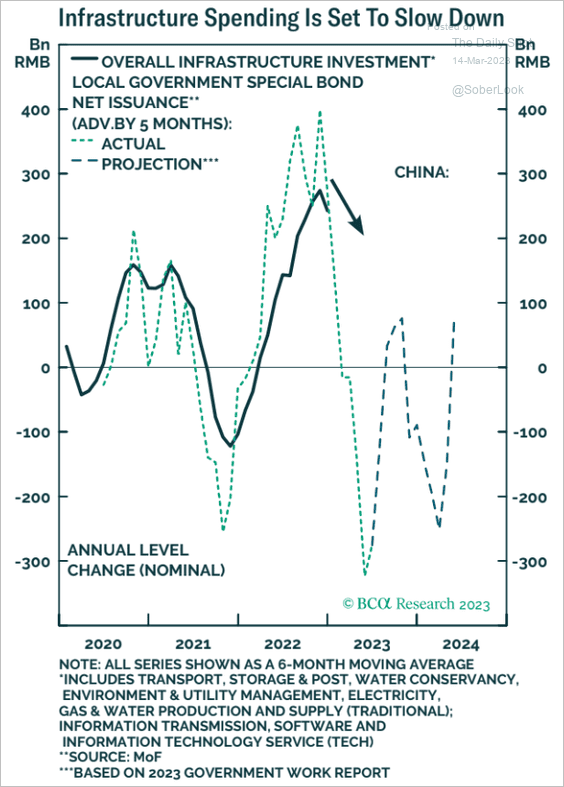 Source: BCA Research
Back to Index
Emerging Markets
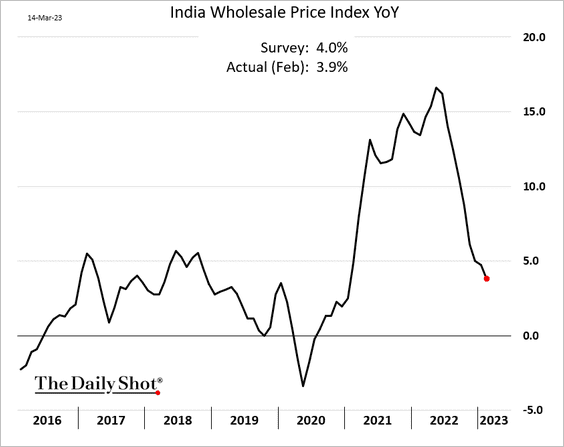
1. India’s consumer inflation remains elevated.
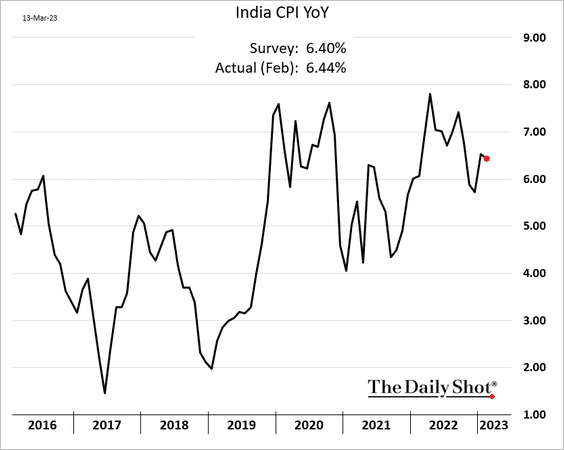
But wholesale prices are easing. The market still expects an RBI rate hike ahead.
——————–
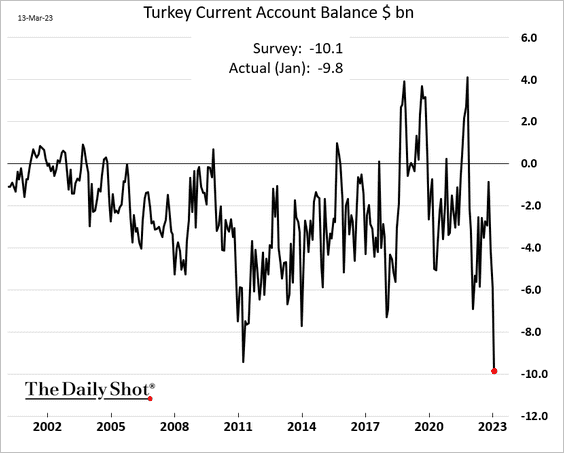
2. Turkey’s current account deficit widened to a record.
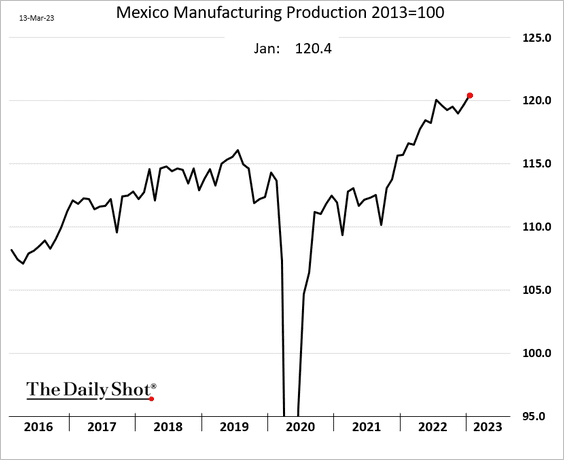
3. Mexico’s manufacturing output continues to grow.
Back to Index
Cryptocurrency
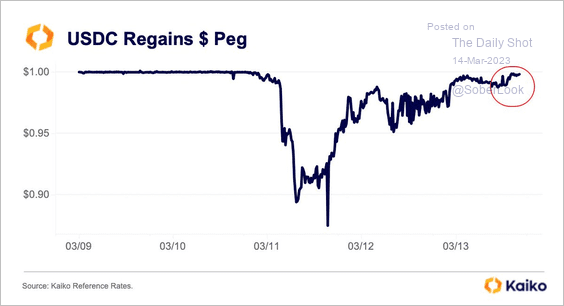
1. Circle’s USDC stablecoin regained its dollar-peg.
 Source: Kaiko Read full article
 Source: CNBC Read full article
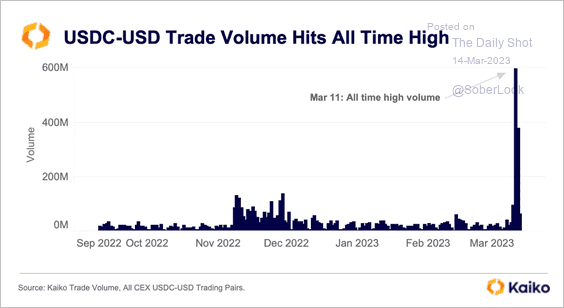
• USDC trading volume hit a record high over the weekend.
 Source: Kaiko Read full article
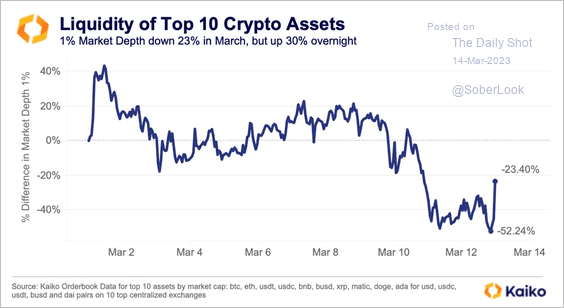
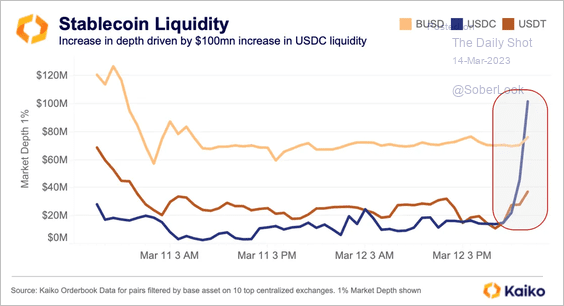
• Low liquidity added to crypto price swings over the past week. However, the recent uptick in market depth is possibly due to market makers offering liquidity for USDC pairs as the stablecoin moved closer to its peg. (2 charts)
 Source: Kaiko Read full article
 Source: Kaiko Read full article
——————–
2. Coinbase suspended trading for Binance USD (BUSD) stablecoin on Monday.
 Source: CoinDesk Read full article
3. The BTC/ETH price ratio continues to hold support. A breakout above resistance could signal risk-off conditions.
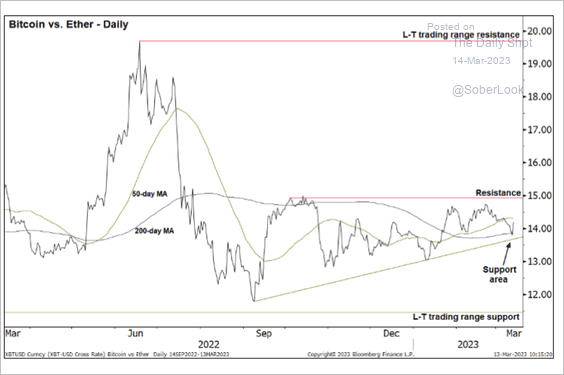 Source: @StocktonKatie
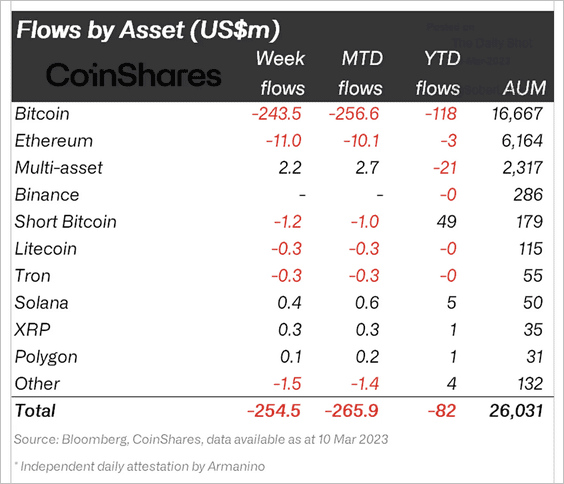
4. Crypto funds saw outflows for the fifth consecutive week, the largest weekly outflow on record.
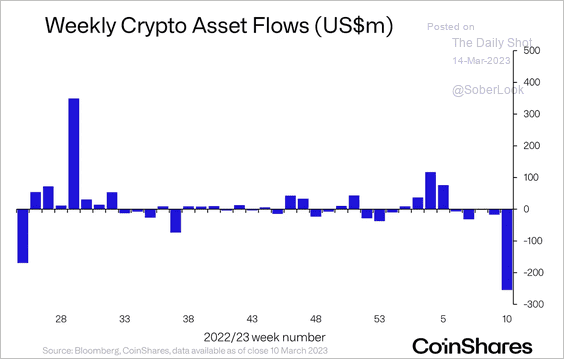 Source: CoinShares Read full article
 Source: CoinShares Read full article
Back to Index
Commodities
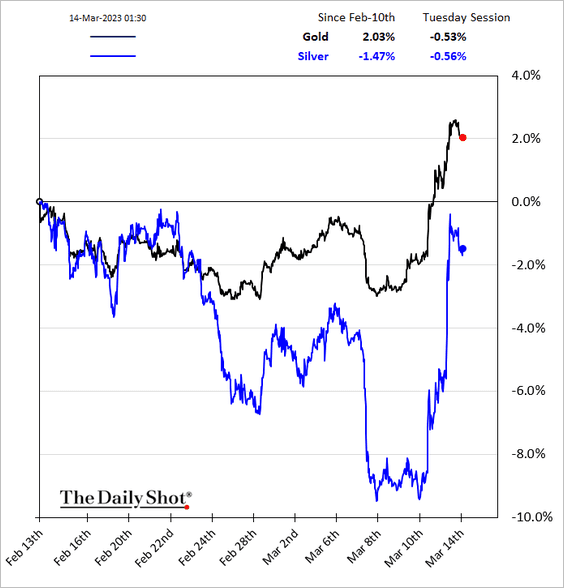
1. Despite a massive rebound, silver is still down over the past 30 days.
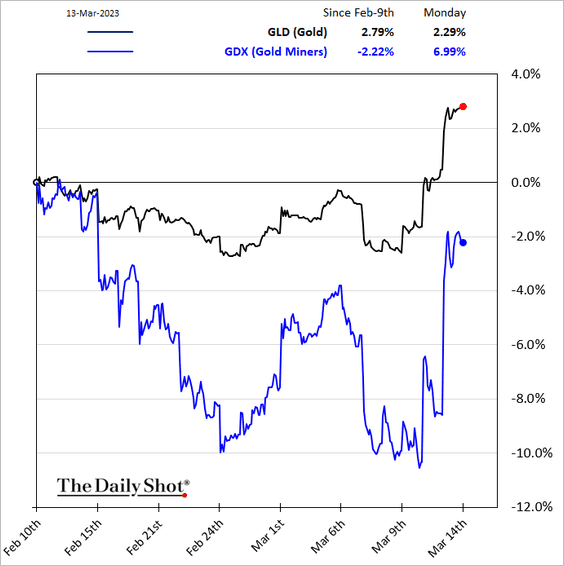
The same holds true for gold miners.
——————–
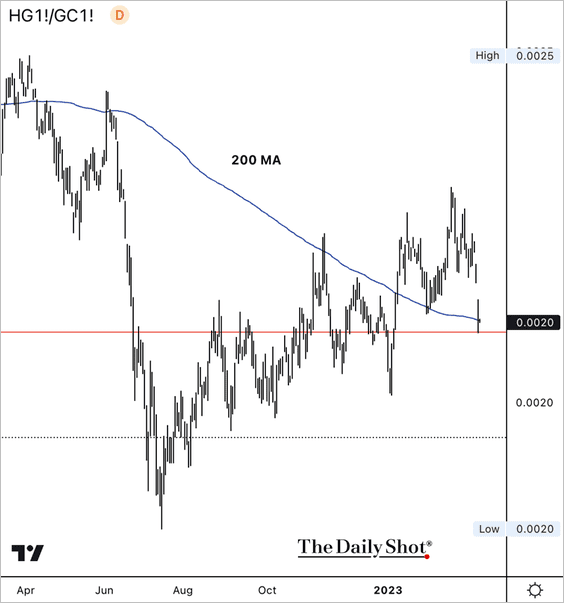
2. The copper/gold ratio declined along with Treasury yields. It is testing initial support at the 200-day moving average, but momentum remains negative.
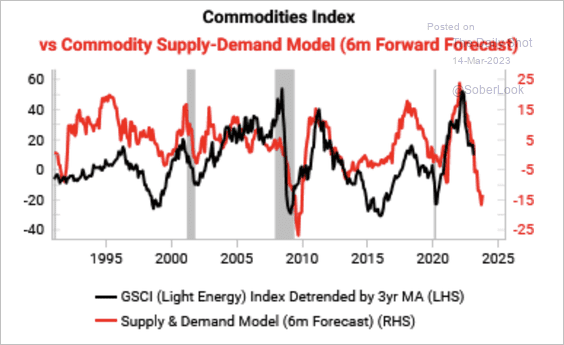
3. Variant Perception’s supply/demand model points to downside risk for commodities.
 Source: Variant Perception
Back to Index
Energy
1. US total refined product demand has been soft.
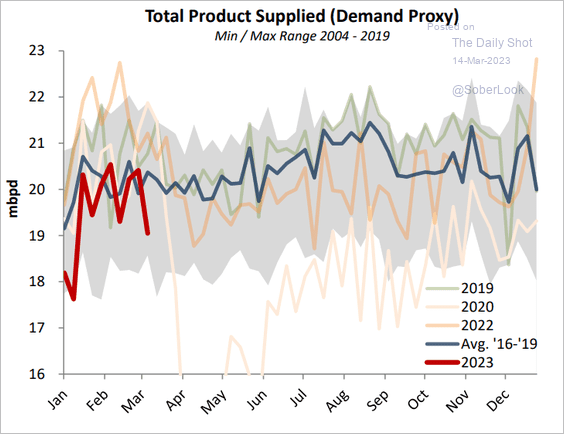 Source: Princeton Energy Advisors
2. This chart shows US power capacity additions and retirements.
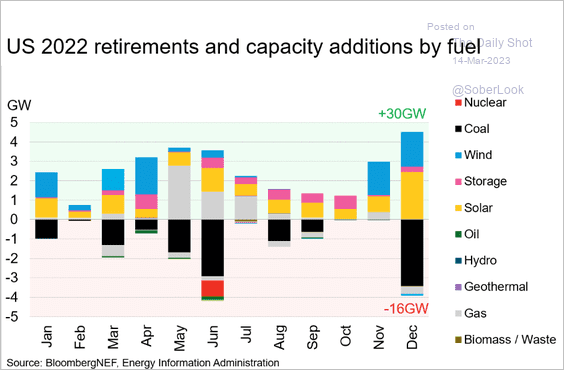 Source: Enrique Gonzalez, BloombergNEF Read full article
Back to Index
Equities
1. Bank shares remained under pressure on Monday.
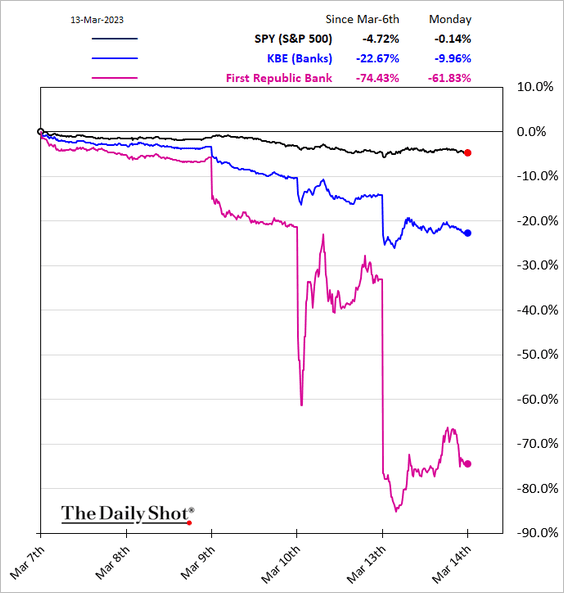
 Source: @WSJ Read full article
Banks once again trade below book value.
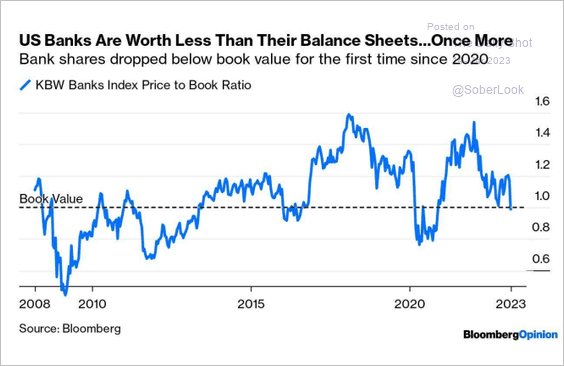 Source: @johnauthers
——————–
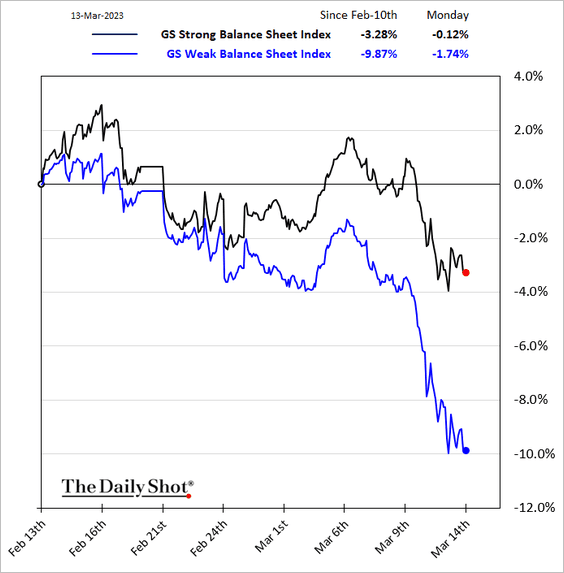
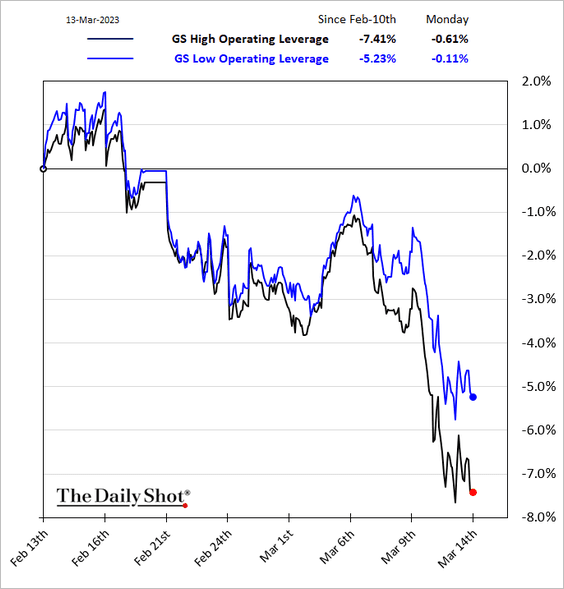
2. Balance sheet strength is in focus again.
• Companies with high operating leverage have been underperforming.
——————–
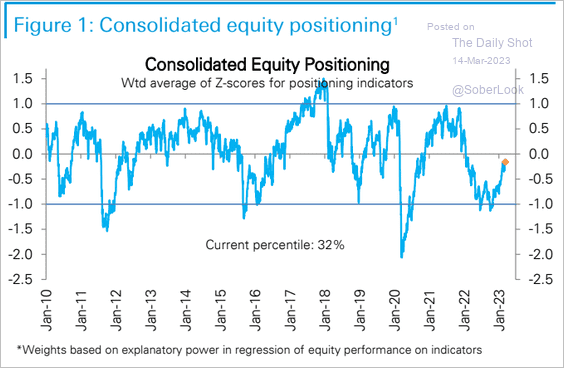
3. Deutsche Bank’s positioning index is in “neutral” territory.
 Source: Deutsche Bank Research
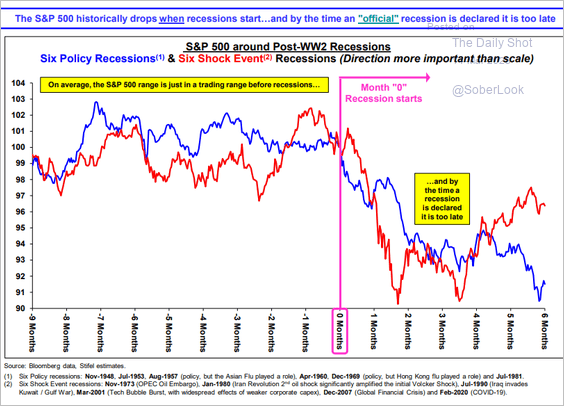
4. Stocks tend to drop when the “official” recession starts. But by the time recession is announced, the decline has already taken place.
 Source: Stifel
• Which sectors are most concerned about recession?
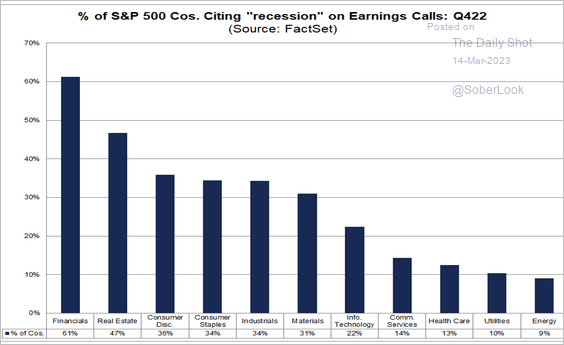 Source: @FactSet Read full article
——————–
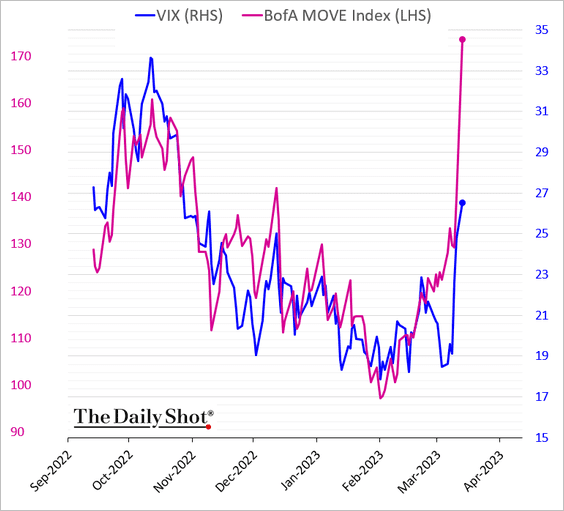
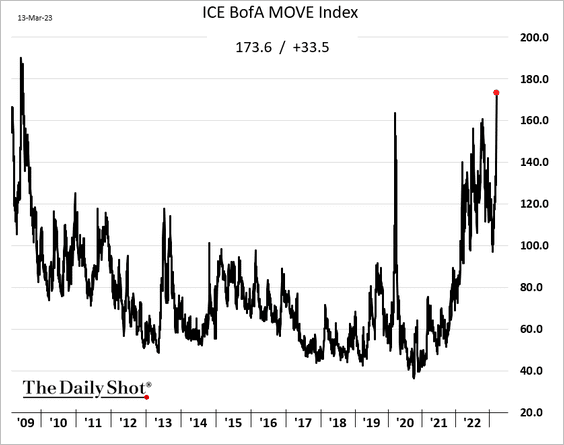
5. The rates market implied volatility index (MOVE) has massively outpaced VIX.
Back to Index
Credit
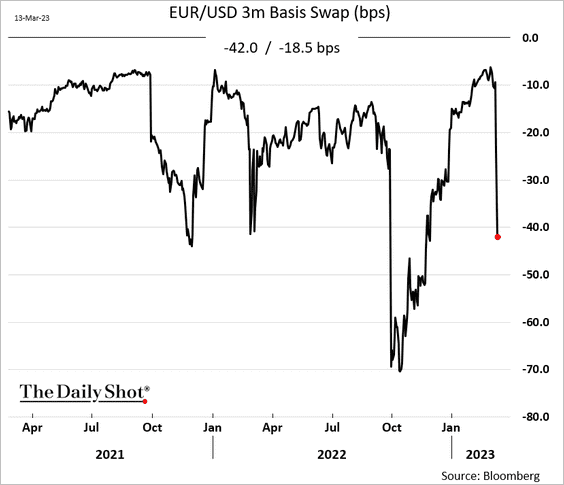
1. Dollar funding liquidity continues to tighten.
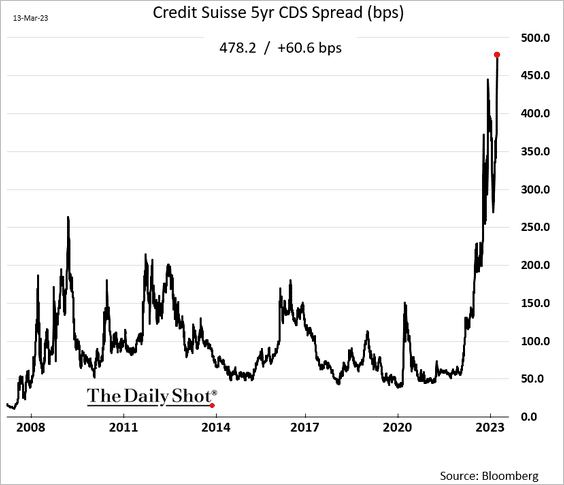
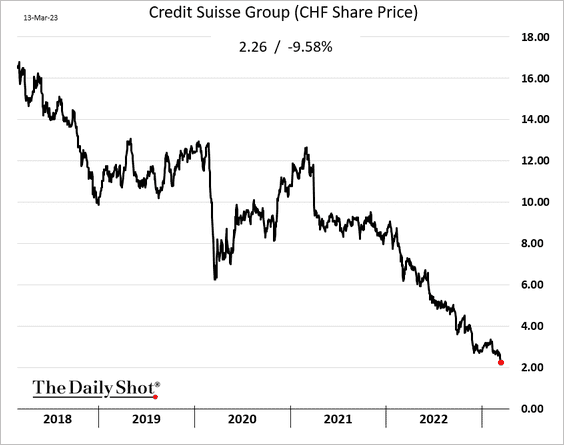
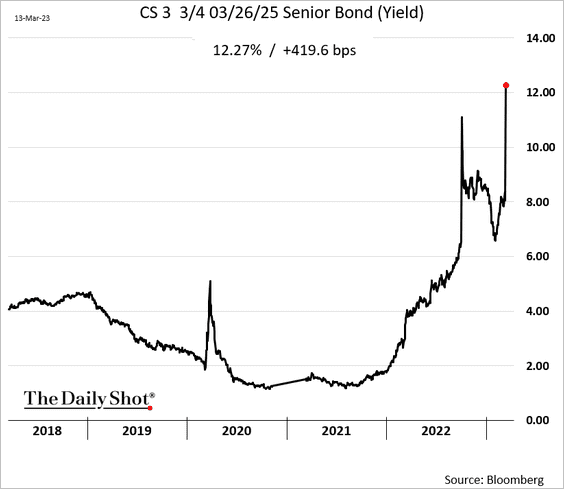
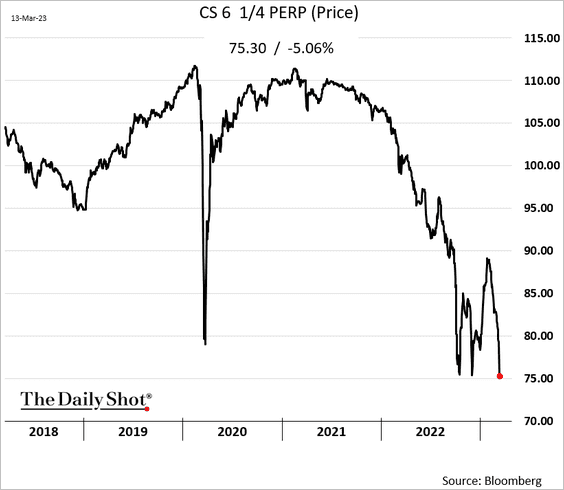
2. Credit Suisse’s market indicators keep worsening.
• CDS spread (new high):
• Share price (new low):
• Senior bond yield:
• CoCo price:
——————–
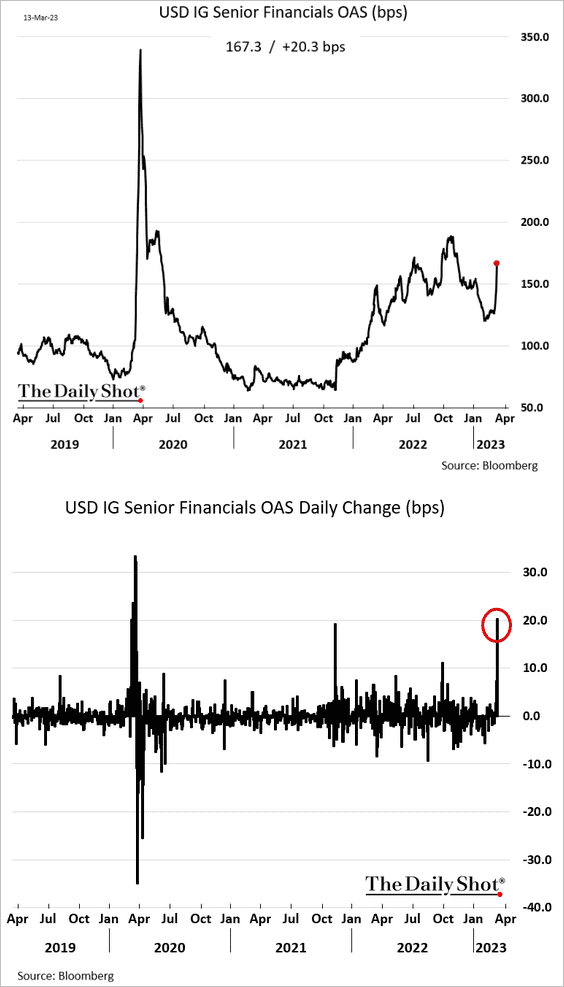
3. US financials’ bond spreads widened sharply on Monday.
4. Next, let’s take a look at some US banking sector data.
• Here are the banking sector metrics the market is focused on these days.
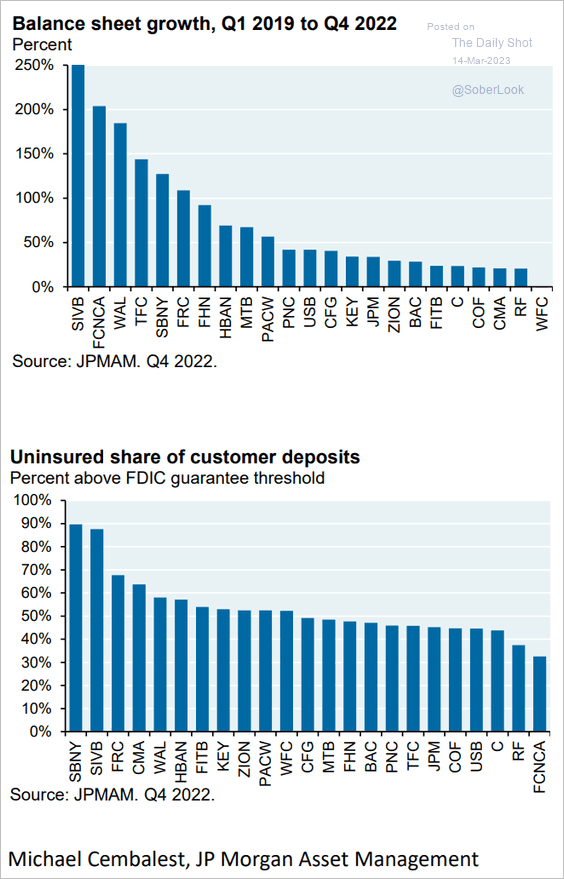 Source: J.P. Morgan Asset Management
• This scatterplot shows each bank’s proportion of retail deposits vs. asset-deposit-ratio.
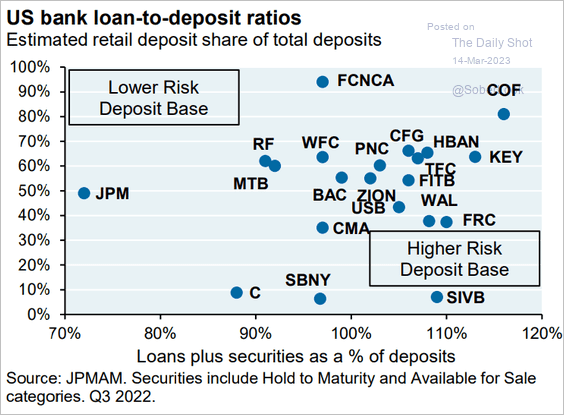 Source: J.P. Morgan Asset Management
• How would the capital ratios be impacted if banks had to crystallize unrealized losses on bonds?
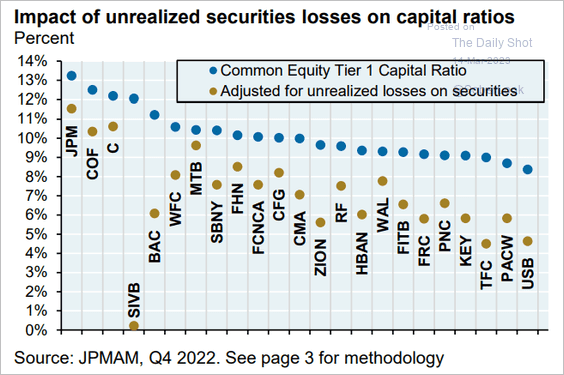 Source: J.P. Morgan Asset Management
• “Hot” deposits got the two shattered banks into trouble.
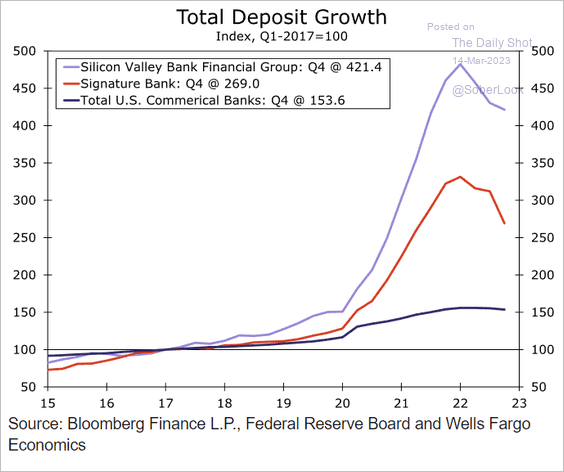 Source: Wells Fargo Securities
– SVB had some very lumpy deposits.
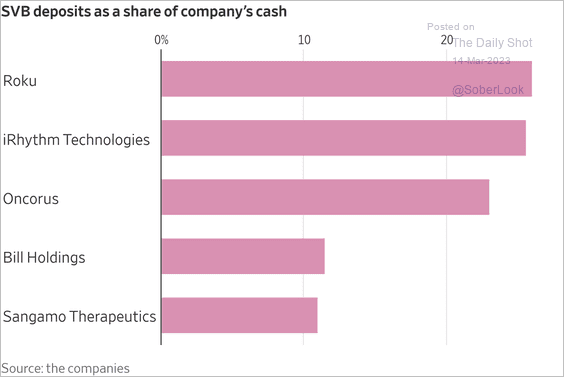 Source: @WSJ Read full article
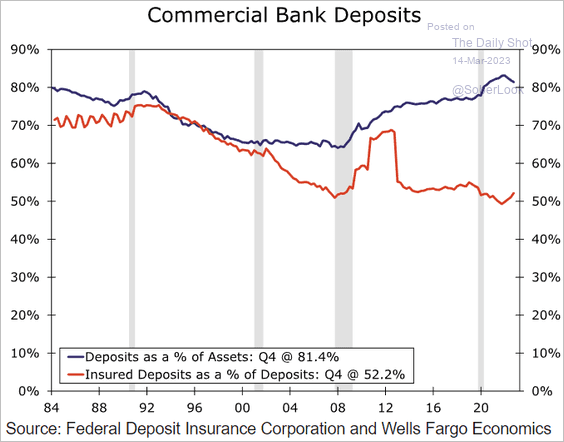
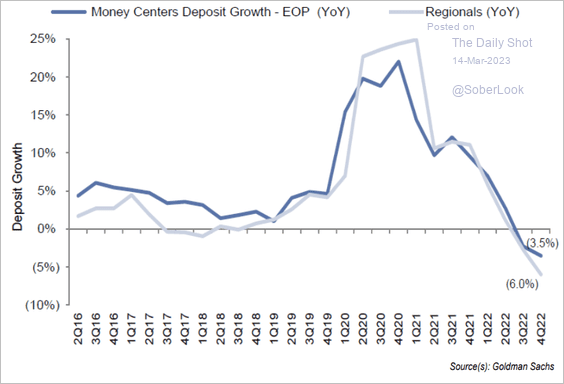
• Banking sector deposit growth has been driven by corporate cash.
 Source: Wells Fargo Securities
• Deposit balances have been declining, driven by the Fed’s QT.
 Source: Goldman Sachs; III Capital Management
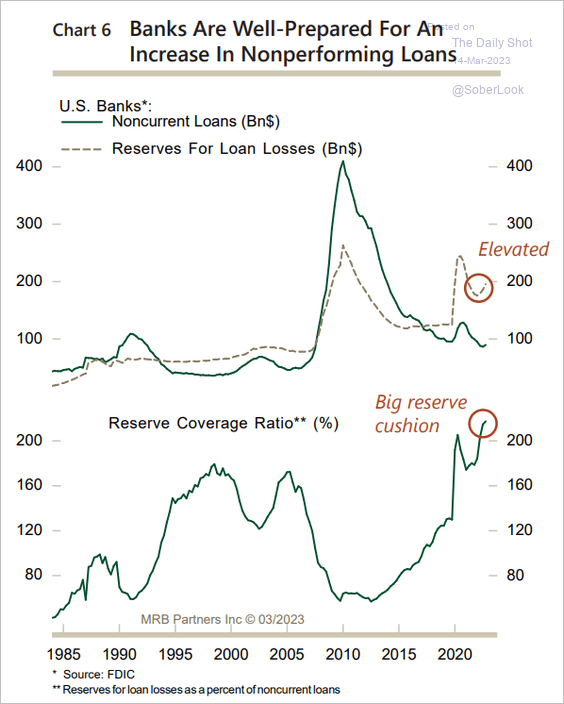
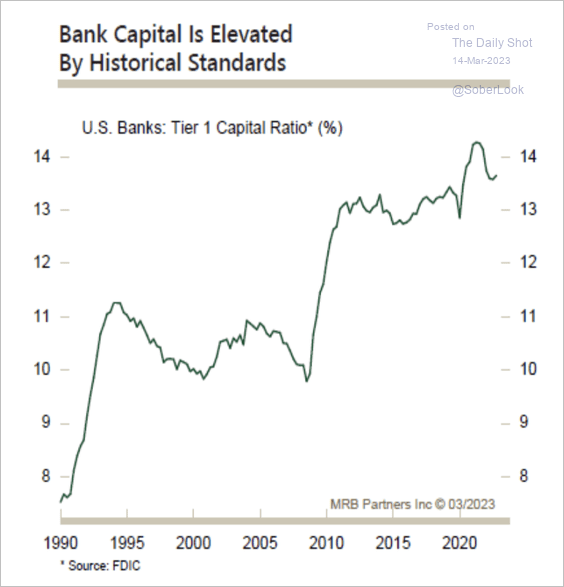
• Overall, US banks are well positioned for a recession.
 Source: MRB Partners
Banks have strong capital positions and liquid balance sheets. At this time, MRB does not see the need for banks to sell their holdings of securities for funding purposes.
 Source: MRB Partners
• Banks hold a lot of agency MBS.
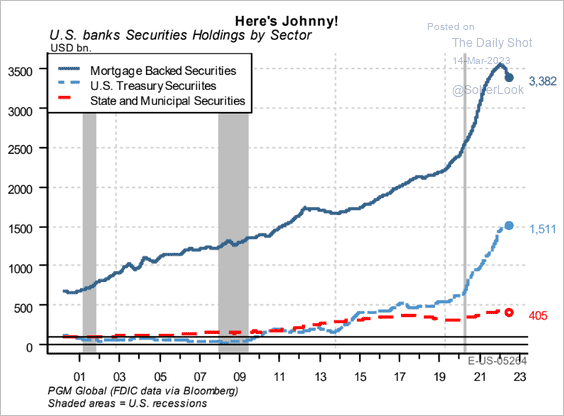 Source: PGM Global
Many of these bonds are under water due to higher rates and extended durations (rate-related losses, not credit).
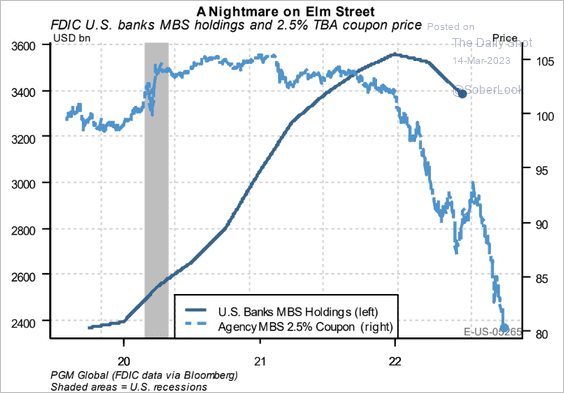 Source: PGM Global
Most of these bonds are held to maturity (mark-to-market not hitting P&L).
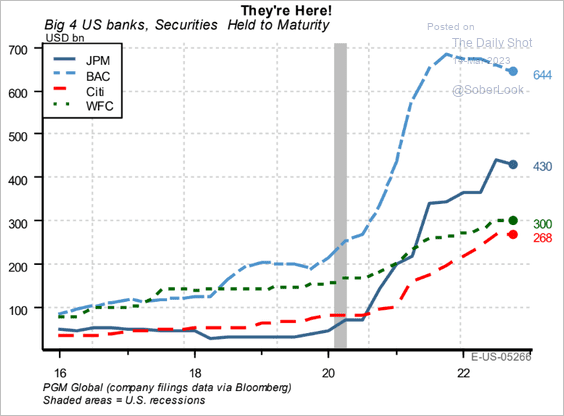 Source: PGM Global
——————–
5. The cost of developed market corporate debt soared by about 3.5 percentage points over the past two years.
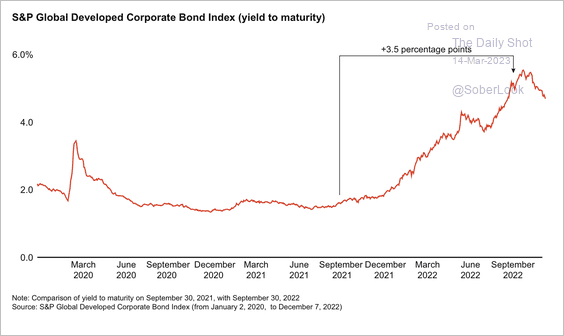 Source: Bain & Company
Back to Index
Rates
1. Treasury market implied vol surged on Monday.
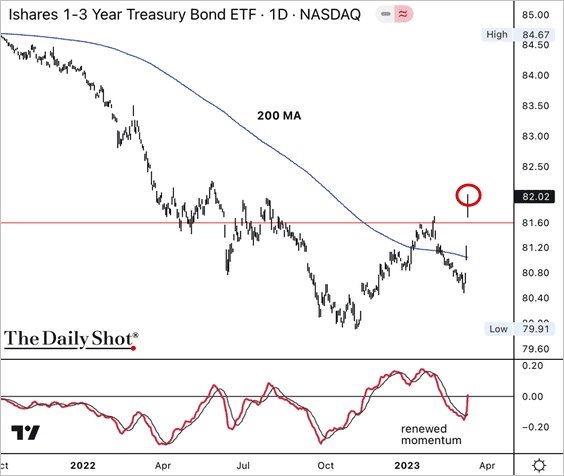
2. The iShares 1-3 year Treasury Bond ETF (SHY) broke above its 200-day moving average.
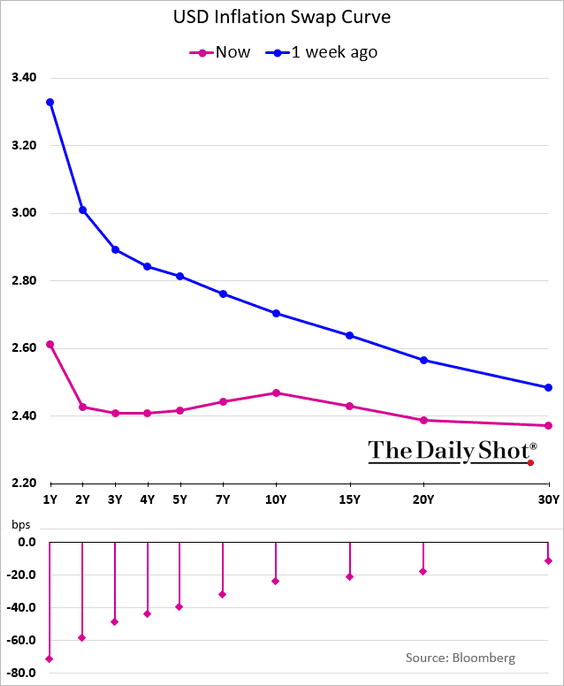
3. There was a massive repricing in US inflation expectations term structure on Monday.
4. The Fed wants to avoid a 1970s-style flip-flopping on rates.
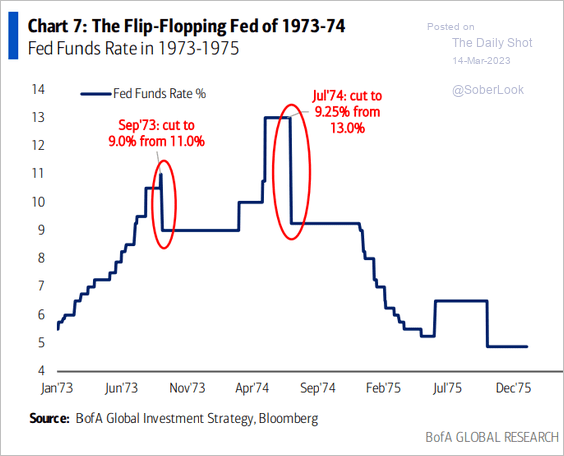 Source: BofA Global Research
Back to Index
Global Developments
1. Elevated rates volatility leaves room for FX vol to move higher.
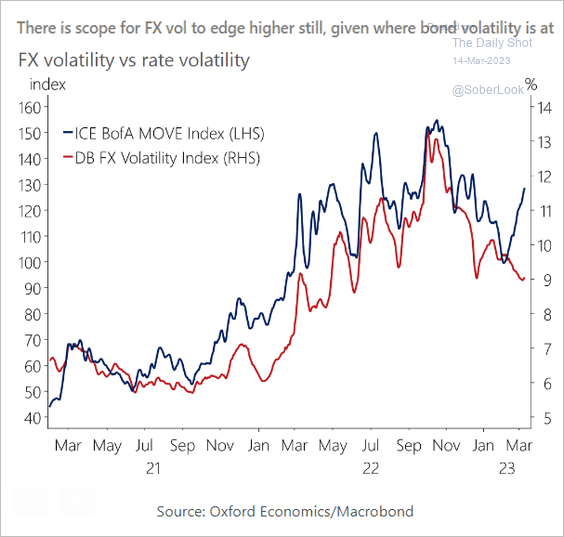 Source: Oxford Economics
2. Countries with high household debt such as Canada and Australia remain vulnerable to falling house prices.
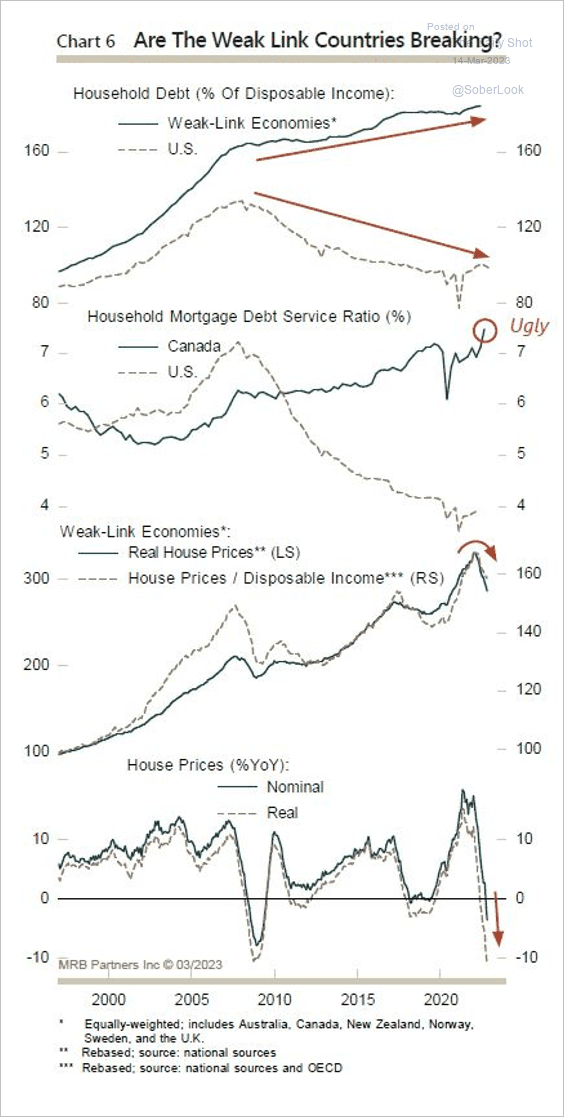 Source: MRB Partners
——————–
Food for Thought
1. Women with school-age children have been returning to work:
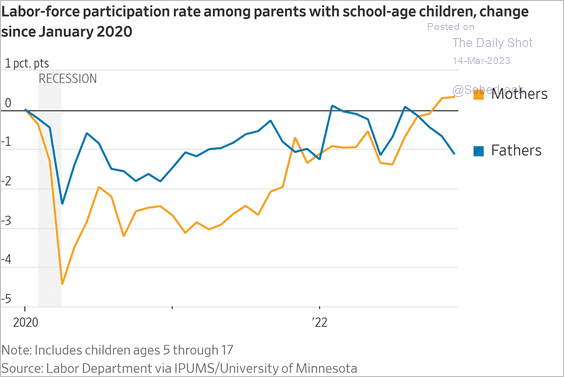 Source: @WSJ Read full article
2. Who works from home?
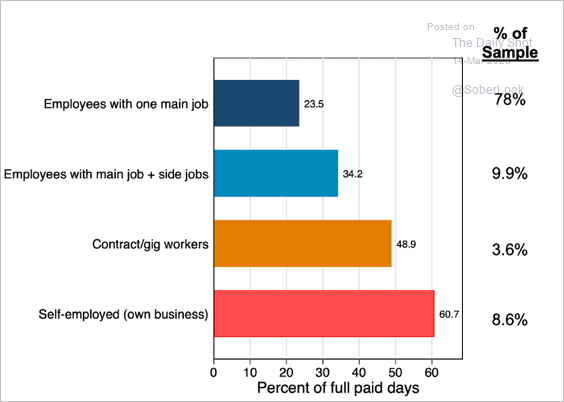 Source: WFH Research Read full article
• Fully-remote employees:
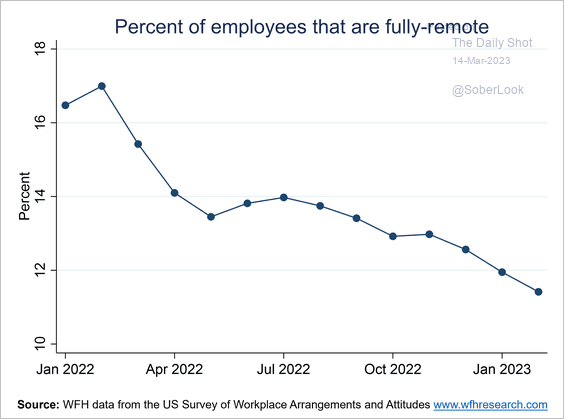 Source: @I_Am_NickBloom
3. Employment by levels of job digitalization:
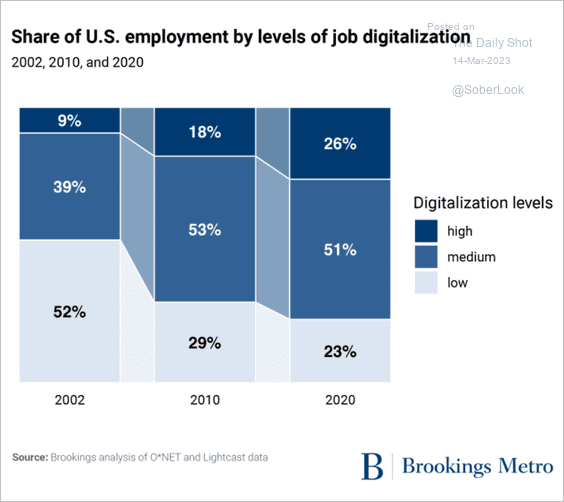 Source: Brookings Read full article
4. Online travel platforms showing increasing interest in rural accommodations:
 Source: Statista
5. Low Earth orbit:
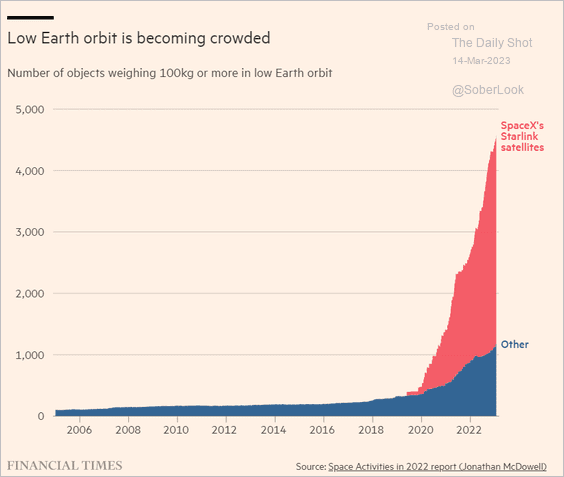 Source: @financialtimes Read full article
6. Gun assault rate in the 11 US cities with available data:
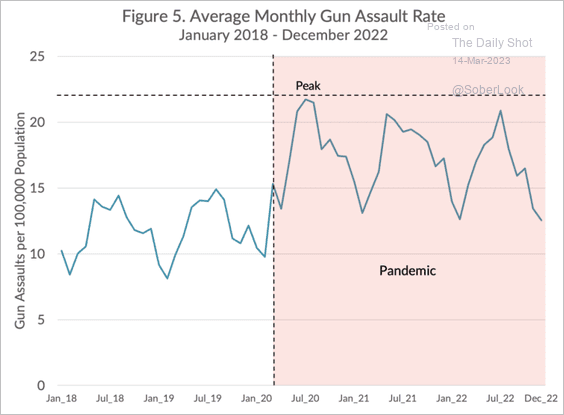 Source: Council on Criminal Justice
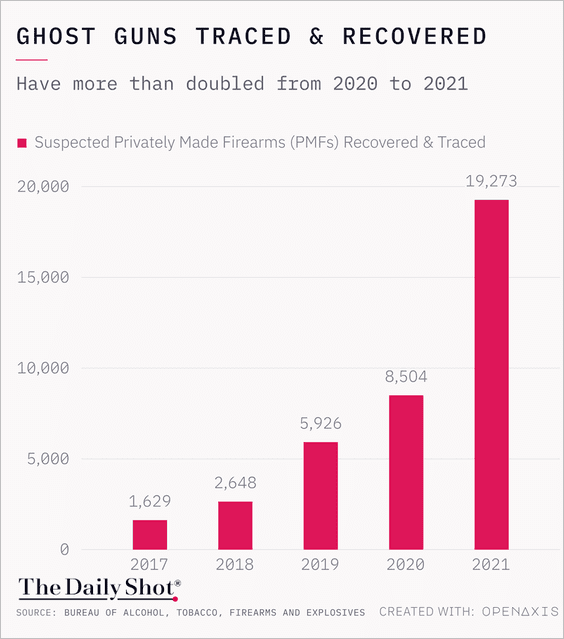
7. Ghost guns traced and recovered:
 Further reading
8. Generational composition of US Congress members over time:
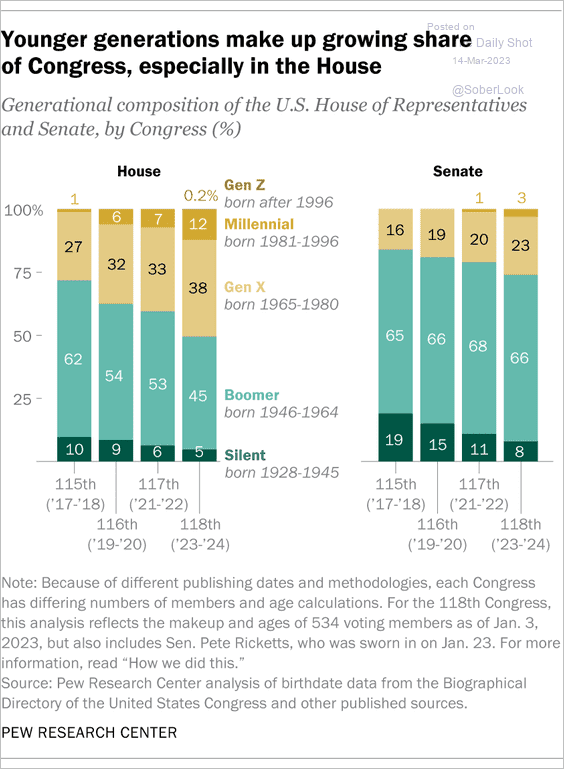 Source: Pew Research Center Read full article
9. Where in the US are people dying from fentanyl overdoses?
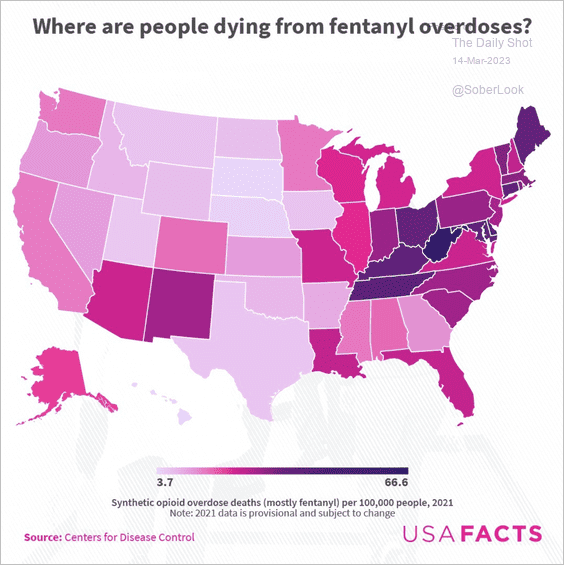 Source: USAFacts
10. Percentage of bald adult men in Europe:
 Source: @loverofgeography Read full article
——————–
Back to Index