
The Daily Shot: 17-Mar-23
• The United States
• The Eurozone
• Europe
• Asia – Pacific
• Emerging Markets
• Cryptocurrency
• Energy
• Equities
• Credit
• Rates
• Global Developments
• Food for Thought
The United States
1. Banks have borrowed $165 billion from the Fed over the past week:
– $152.85 billion via the discount window and …
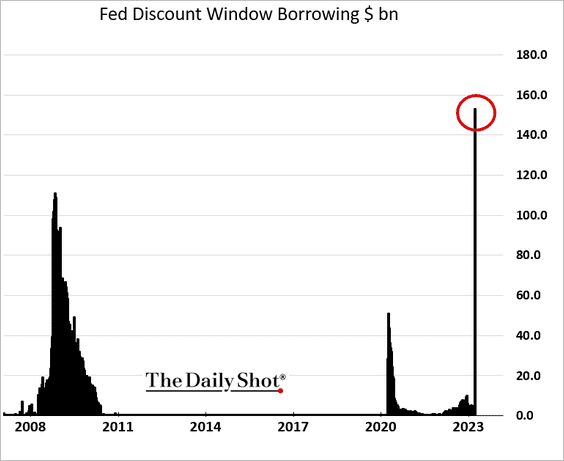
– $11.9 billion via the Fed’s new emergency facility (Bank Term Funding Program). And there is more to come …
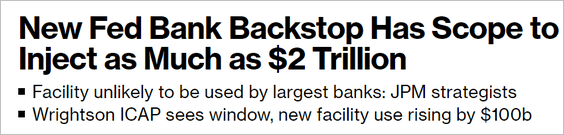 Source: @markets Read full article
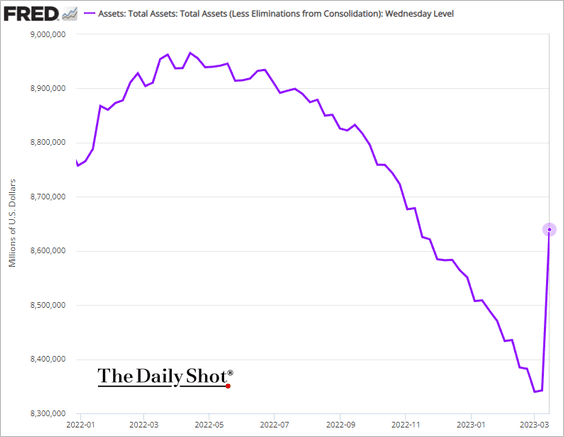
• The Fed’s balance sheet surged, reversing four months of quantitative tightening in a week.
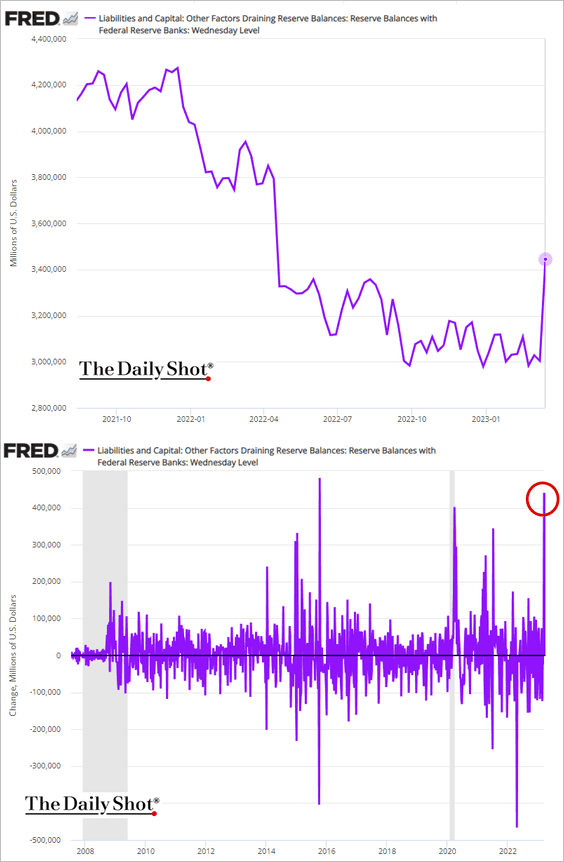
• This chart shows the changes in the Fed’s reserve balances.
——————–
2. The terminal rate is nearing 5% again.
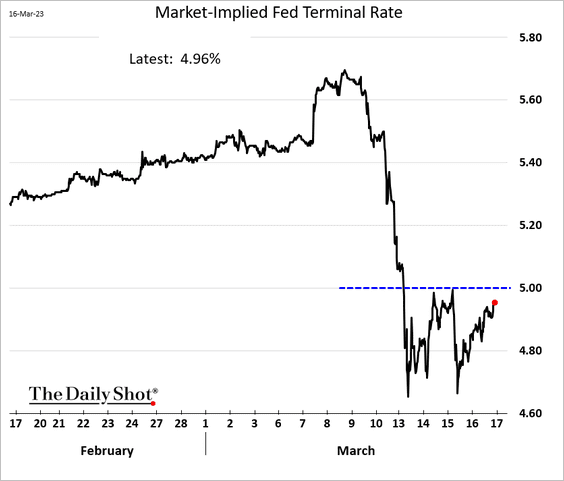
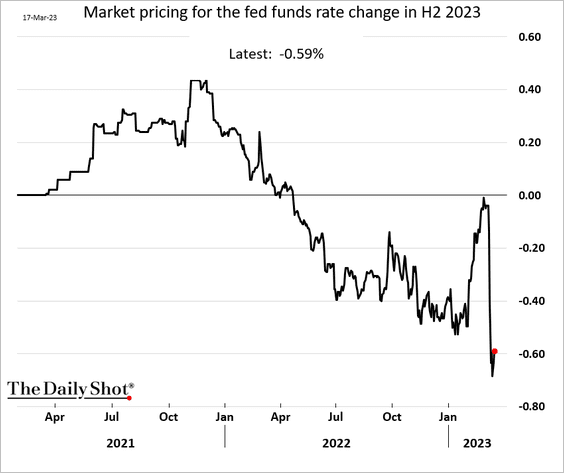
The market still expects substantial rate cuts later this year.
——————–
3. Next, we have some updates on the housing market.
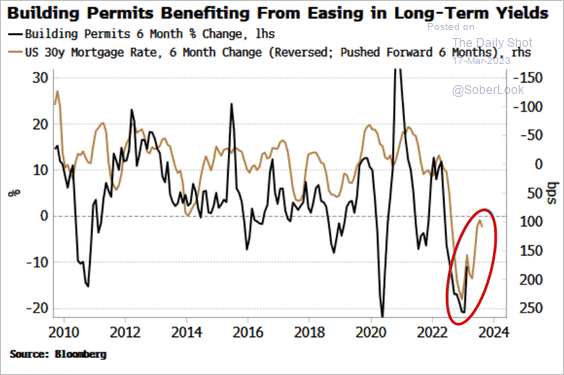
• Residential construction topped expectations in February.
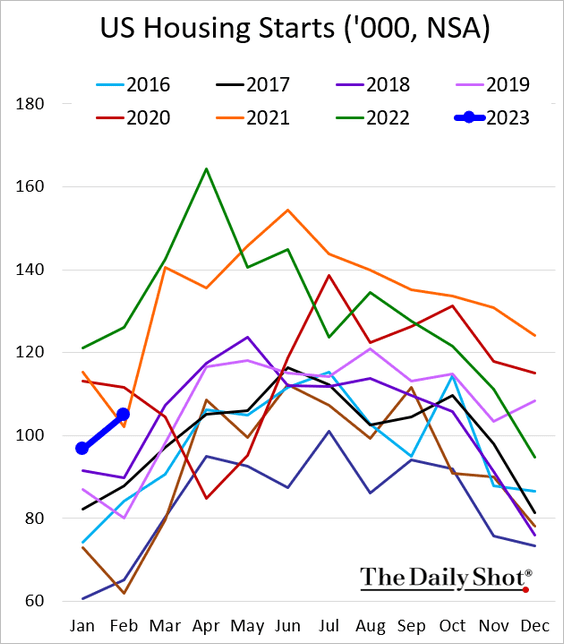
– Mortgage rates coming off the peak have been helpful.
 Source: Simon White, Bloomberg Markets Live Blog
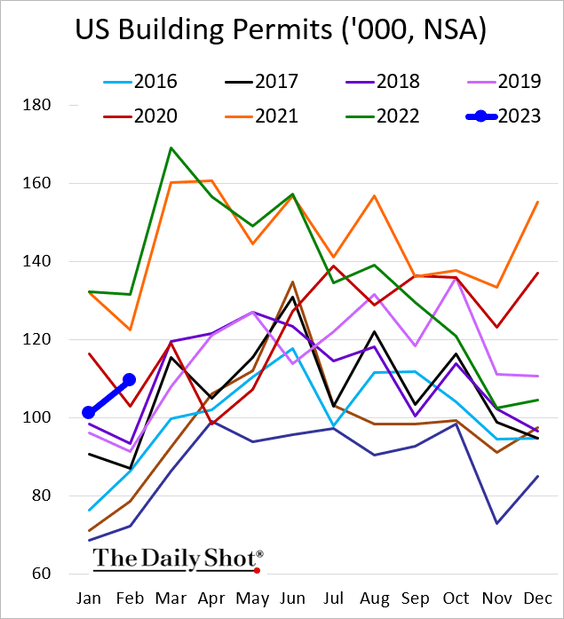
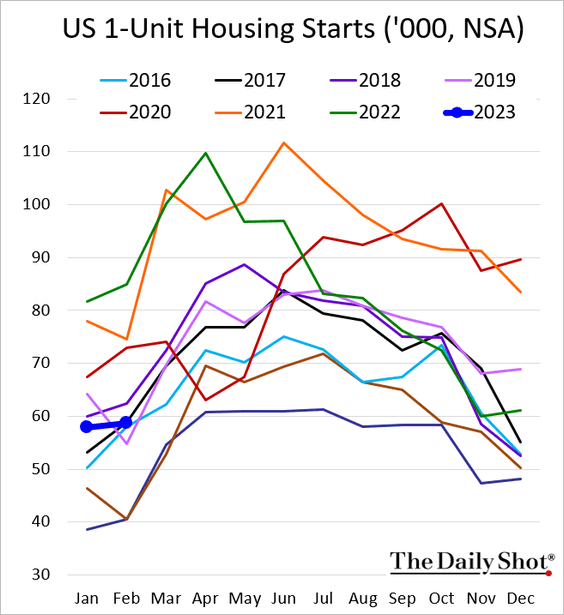
– Single-family starts remain weak.
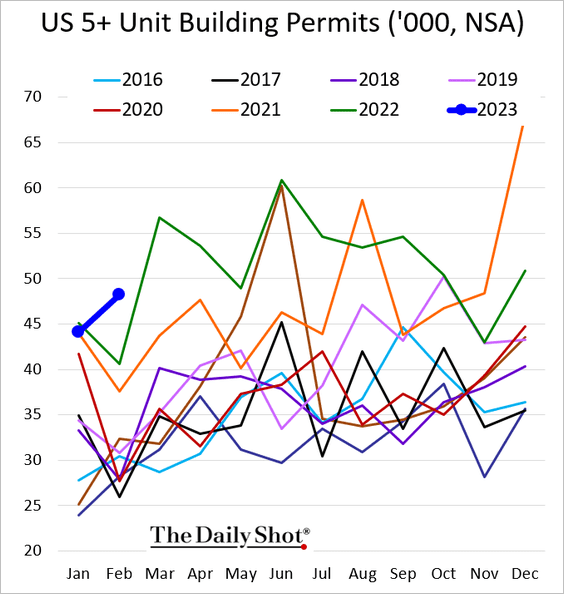
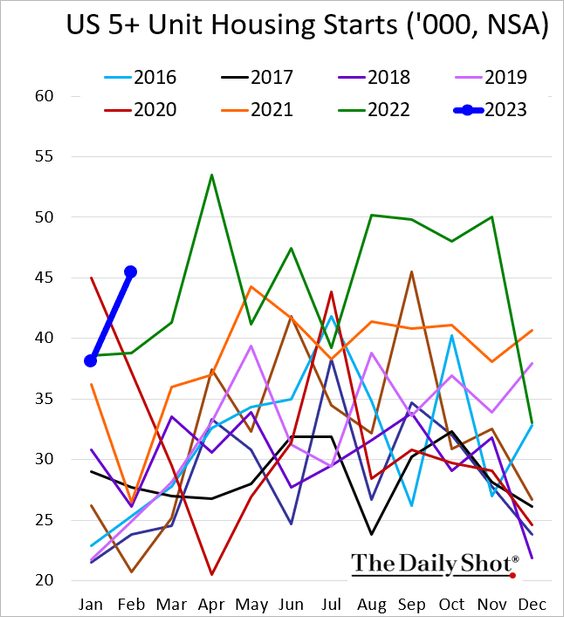
– But multifamily starts and building permits hit a multi-year high for this time of the year.
– Here are multifamily building permits by region.
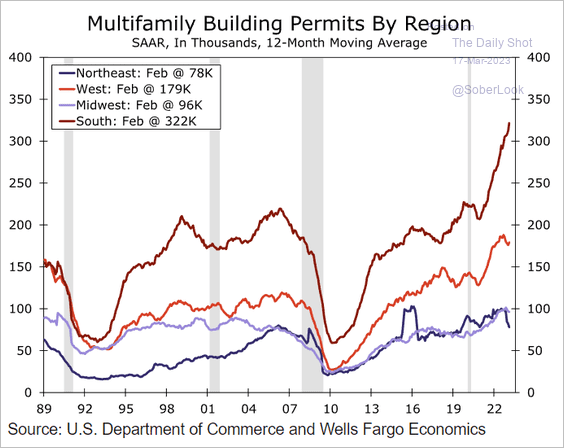 Source: Wells Fargo Securities
– Construction backlog has shifted to multi-family housing.
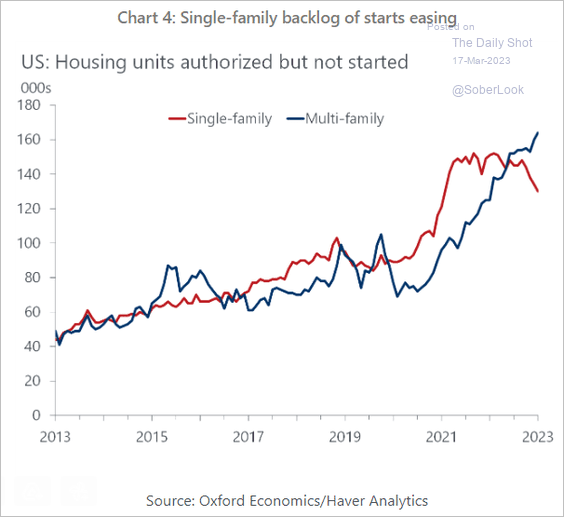 Source: Oxford Economics
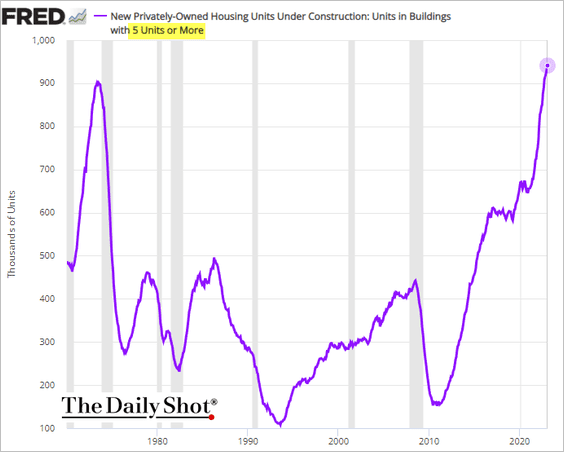
– The number of multifamily housing units currently under construction hit another record high.
– This chart shows single-family construction by stage.
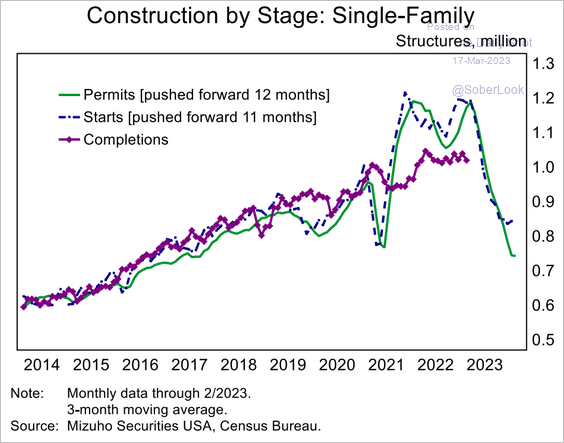 Source: Mizuho Securities USA
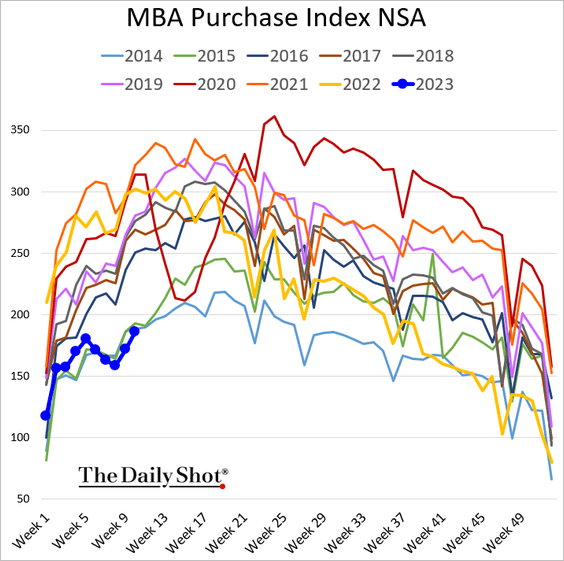
• Mortgage applications are running below 2014 levels.
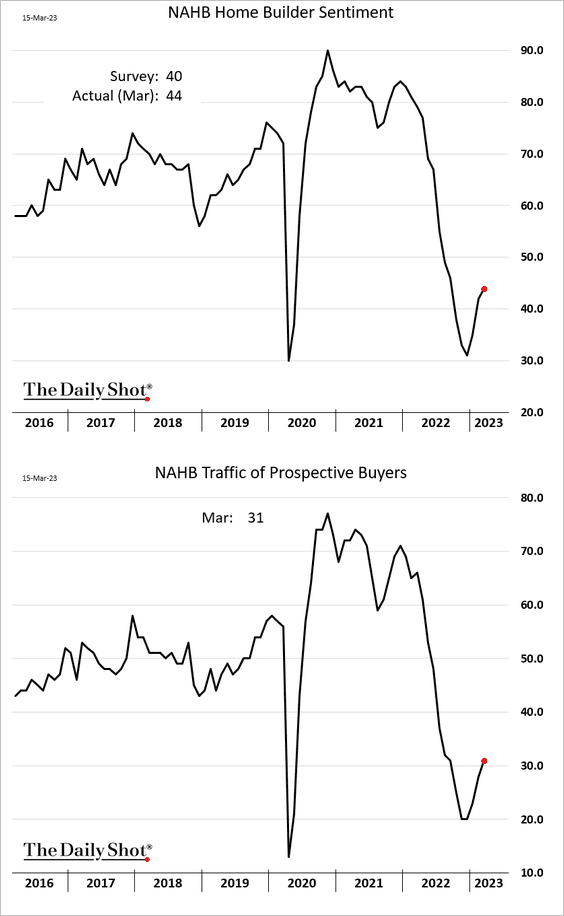
• Homebuilder sentiment is off the lows.
– This chart shows construction cancellation rates.
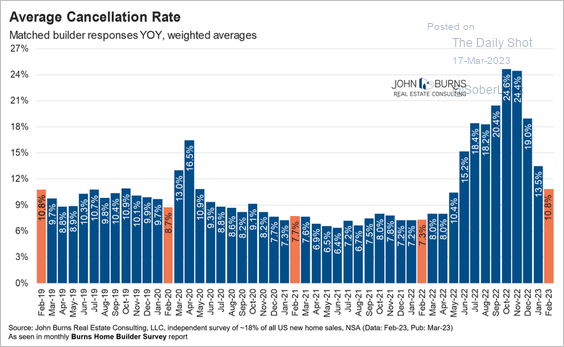 Source: @RickPalaciosJr
– But soft mortgage applications signal weakness ahead.
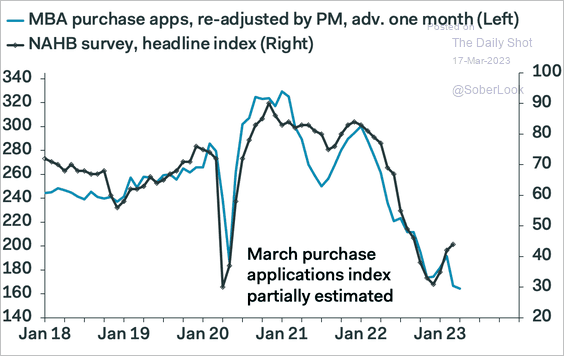 Source: Pantheon Macroeconomics
• Residential investment has been relatively low since the GFC.
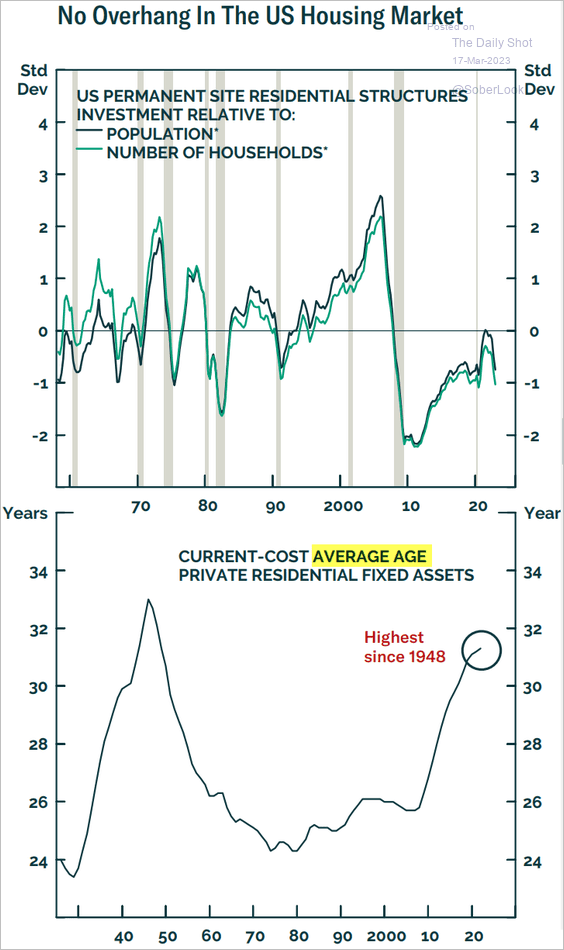 Source: BCA Research
• This chart shows new home sales as a share of total sales.
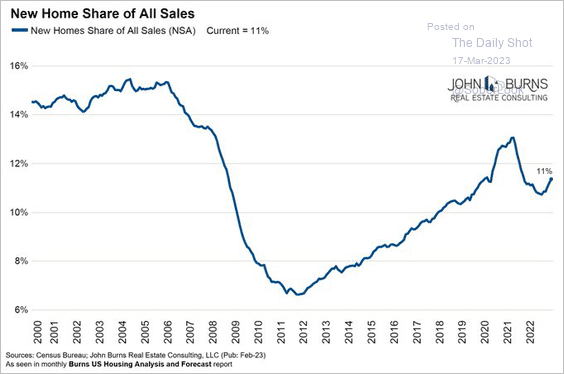 Source: @RickPalaciosJr
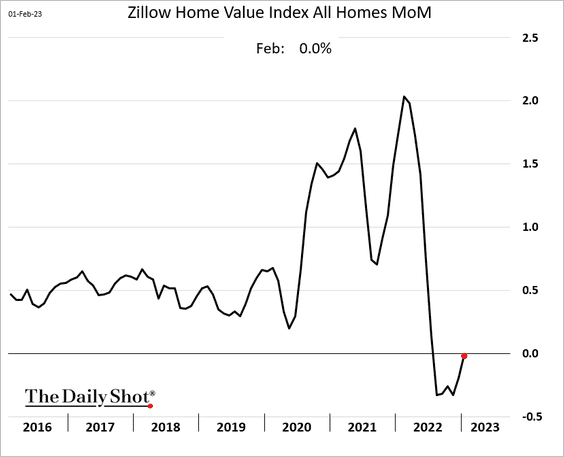
• After six months of declines, home prices were flat last month, according to Zillow.
——————–
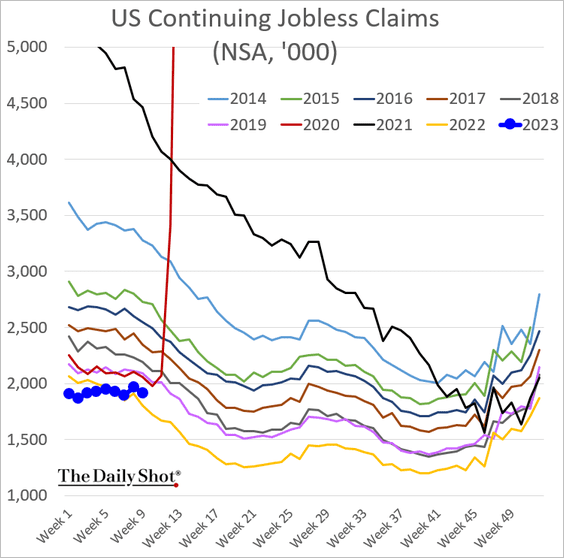
3. Initial jobless claims remain above the average of 2018, 2019, and 2022, but not climbing much for now.
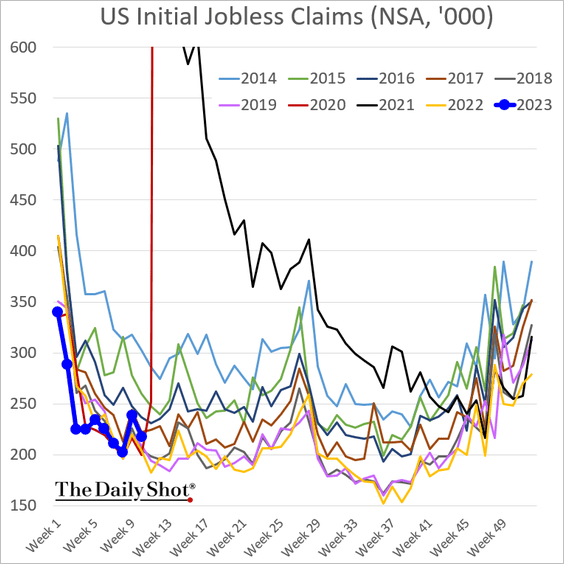
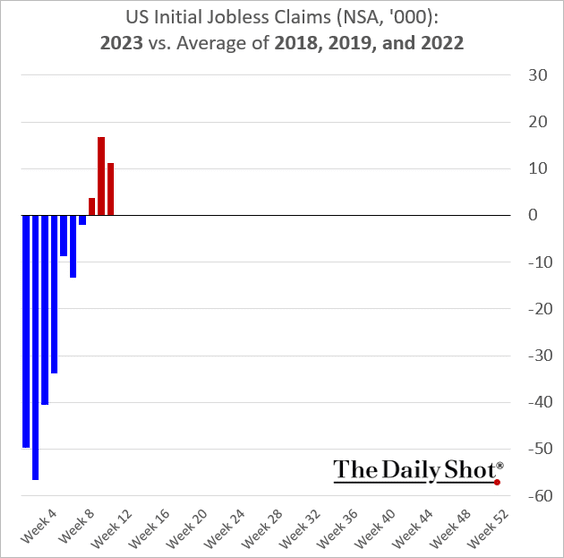
Continuing claims are holding above last year’s levels.
——————–
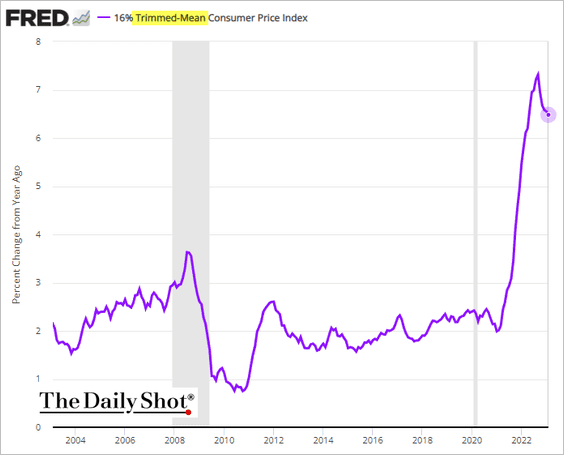
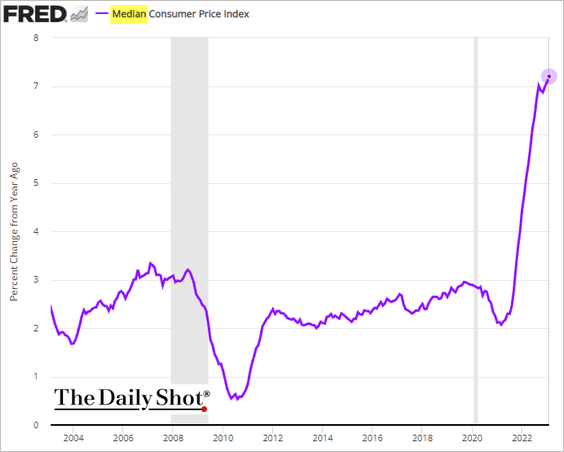
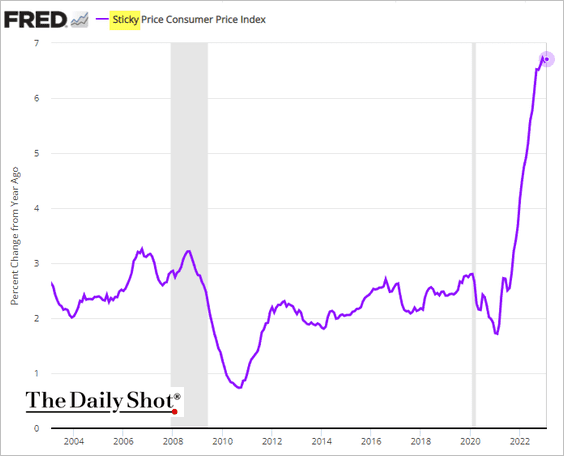
4. Next, we have some data on inflation.
• Let’s start with alternative measures of core inflation.
– Trimmed-mean CPI (year-over-year):
– Median CPI:
– Sticky CPI:
– Monthly changes:
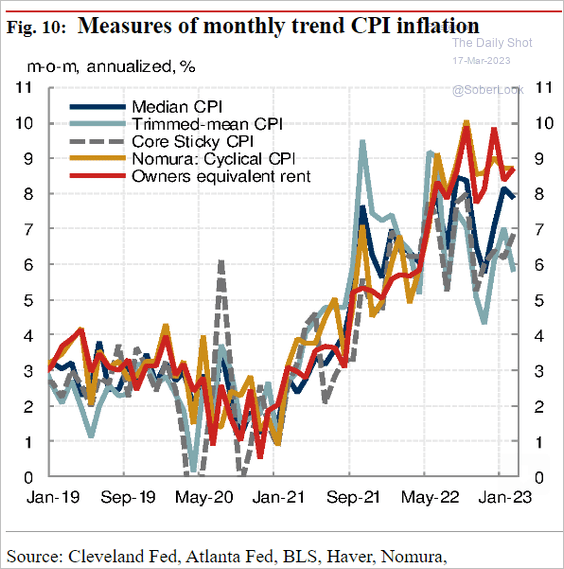 Source: Nomura Securities
• The declines in natural gas prices are yet to filter through to utility services CPI.
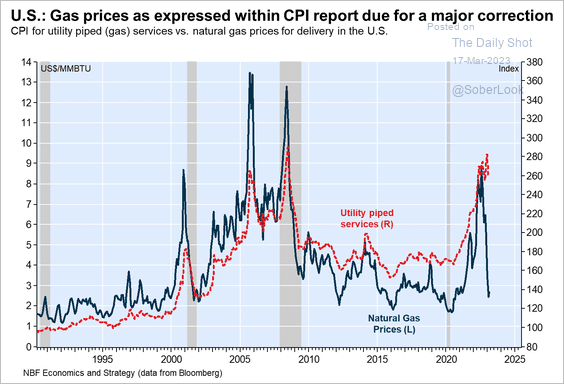 Source: Economics and Strategy Group, National Bank of Canada
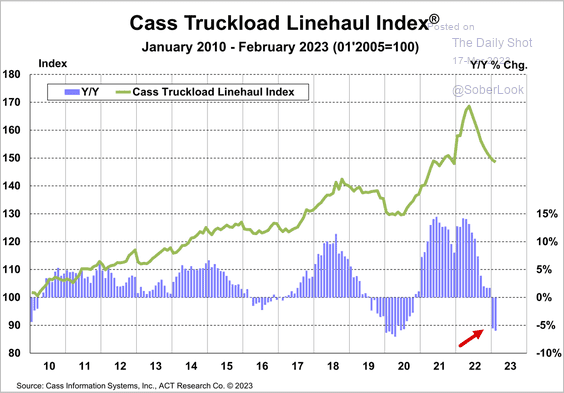
• Freight inflation continues to ease (2 charts).
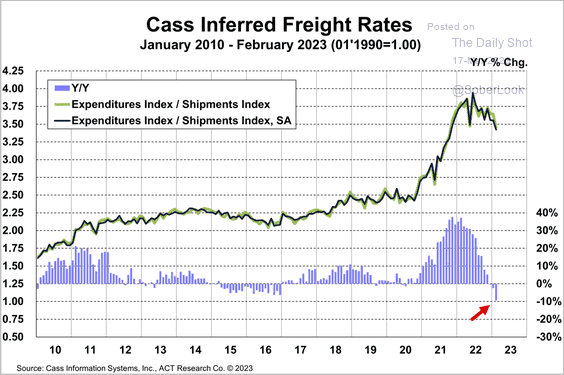 Source: Cass Information Systems
 Source: Cass Information Systems
• Here is compensation as a share of consumer prices, by CPI component.
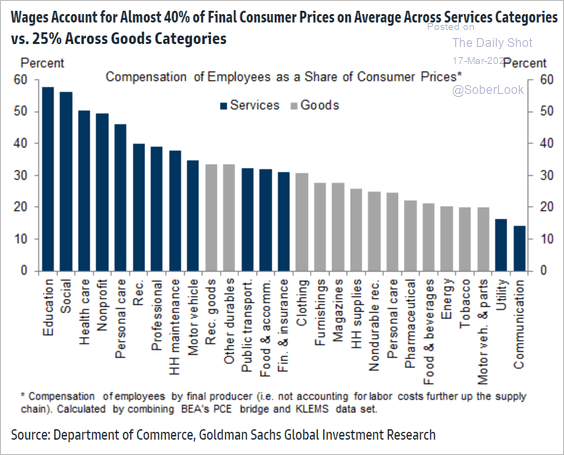 Source: Goldman Sachs
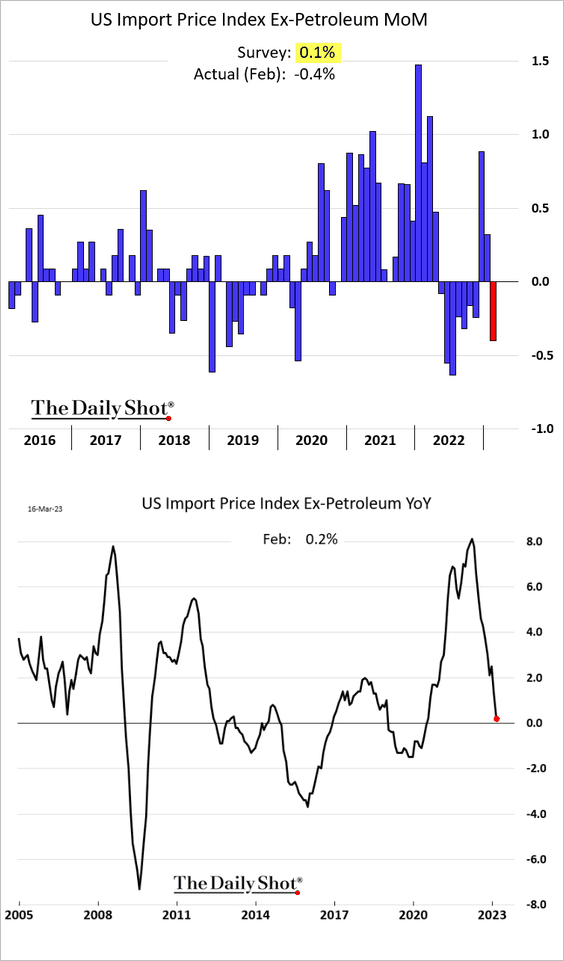
• Import prices declined in February.
• Business inflation expectations are bottoming.
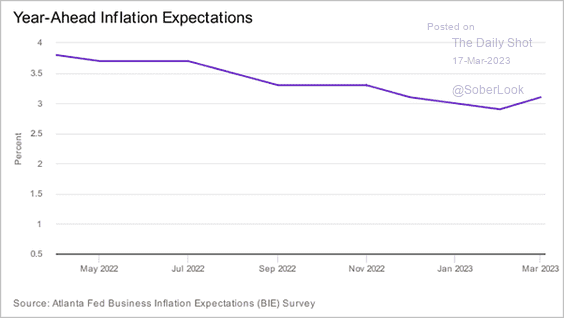 Source: @AtlantaFed
——————–
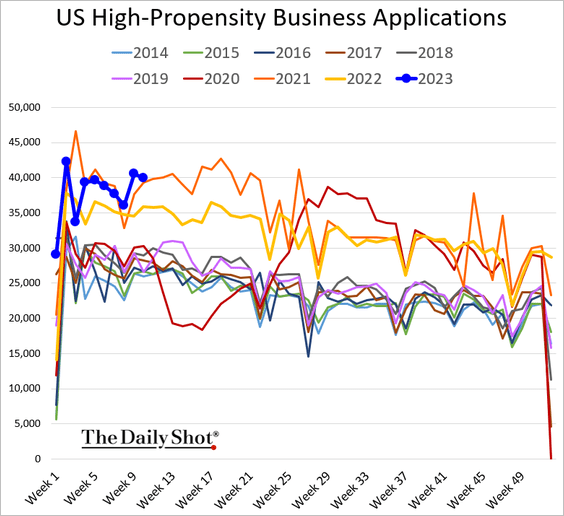
5. Business applications remain robust.
Back to Index
The Eurozone
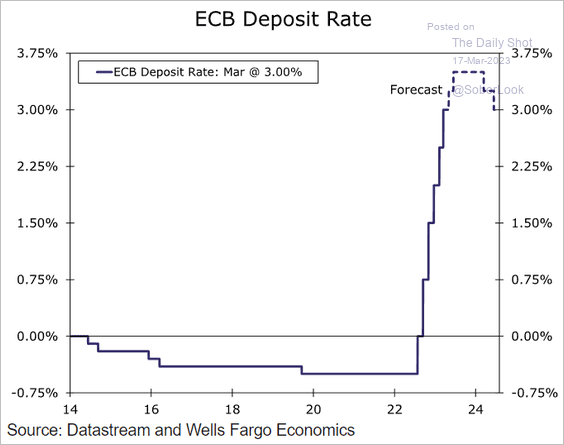
• Despite the banking jitters, the ECB delivered another jumbo rate hike …
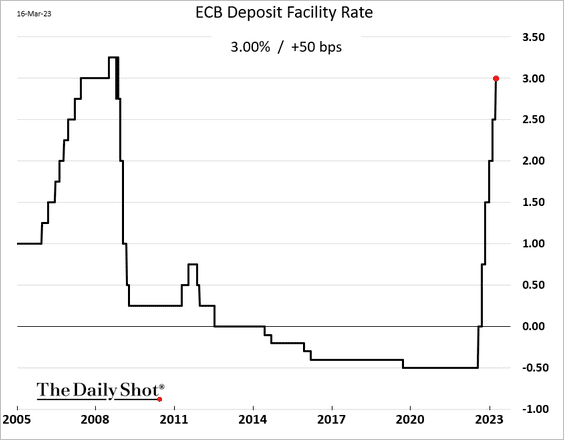
 Source: Reuters Read full article
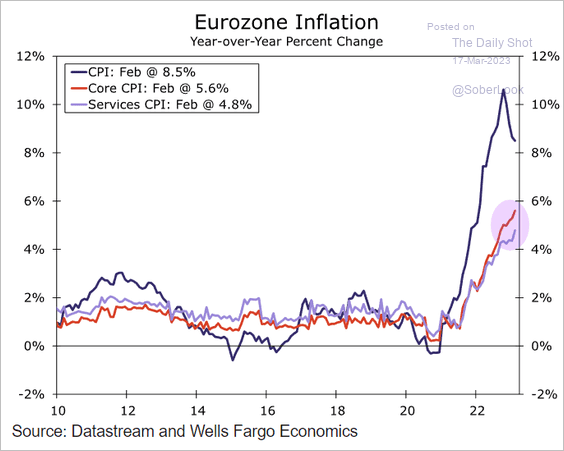
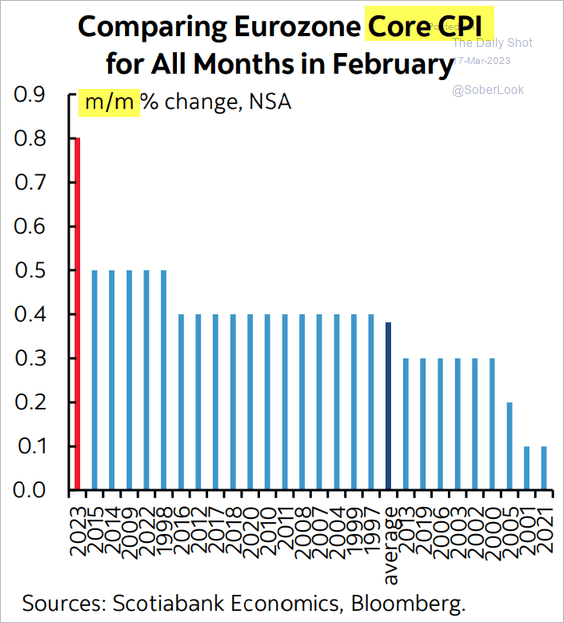
… as core inflation continues to run hot (2 charts).
 Source: Wells Fargo Securities
 Source: Scotiabank Economics
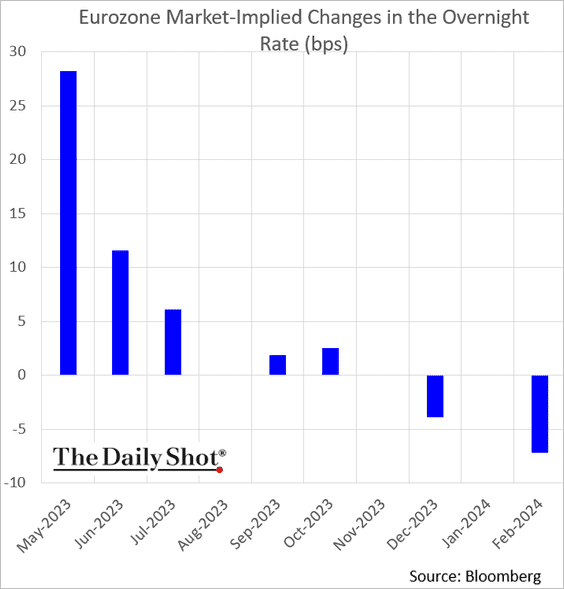
• The central bank’s hawkish action shifted rate trajectory expectations sharply higher.
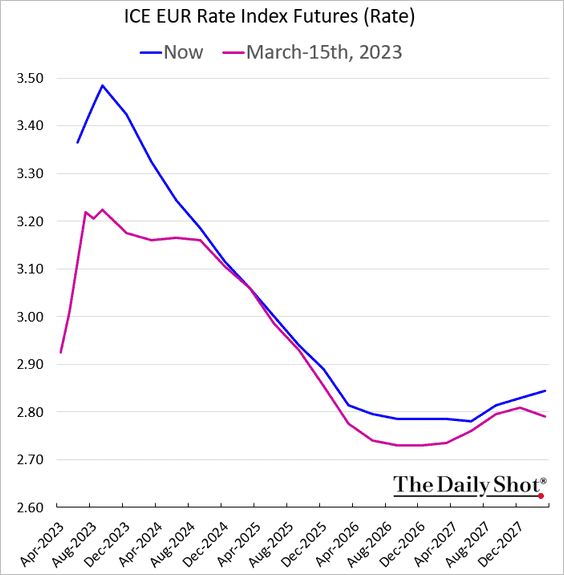
– The market is pricing in another 50 bps of rate hikes before the ECB is done.
– Here is a forecast from Wells Fargo.
 Source: Wells Fargo Securities
• The ECB revised its headline CPI forecasts lower.
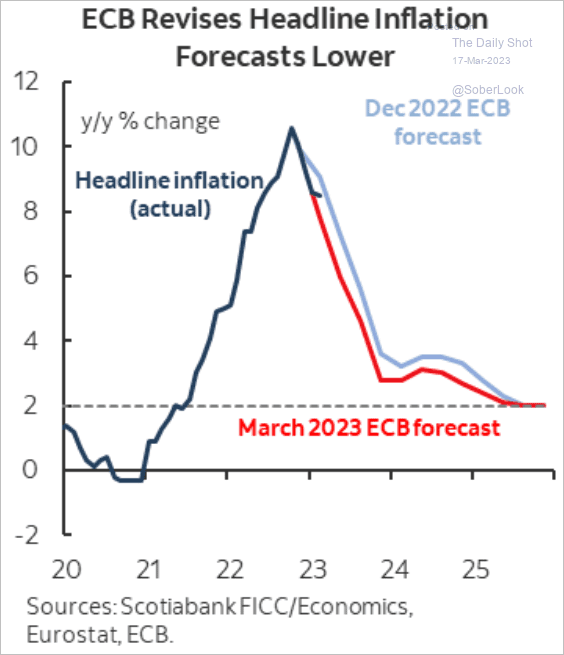 Source: Scotiabank Economics
But forecasts remain above the ECB’s target.
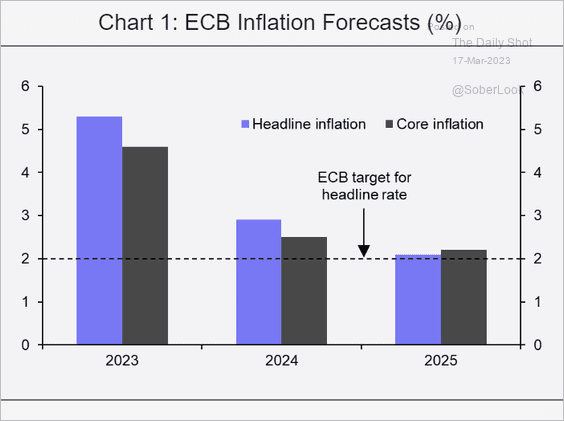 Source: Capital Economics
Back to Index
Europe
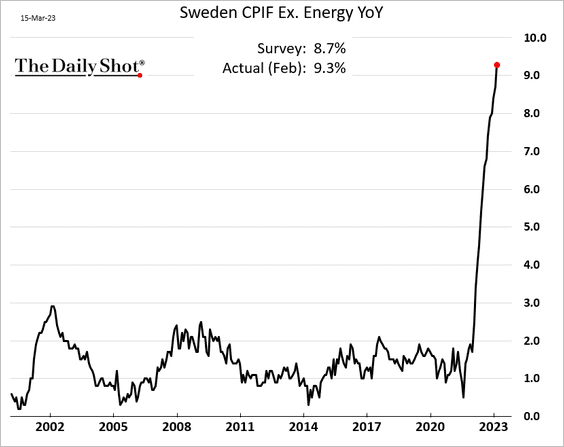
1. Sweden’s inflation continues to surge.
 Source: Reuters Read full article
——————–
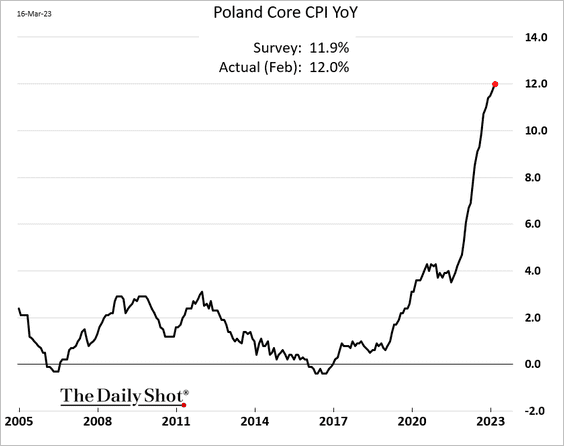
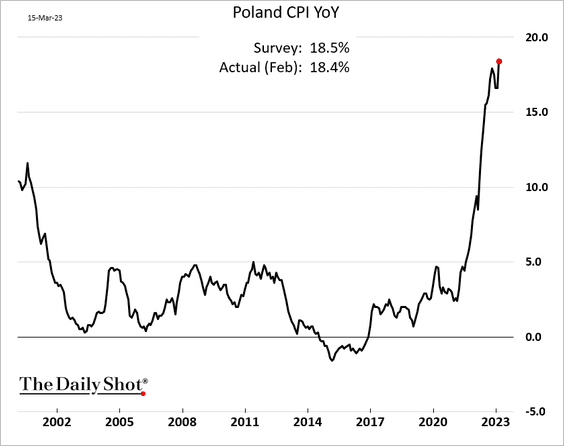
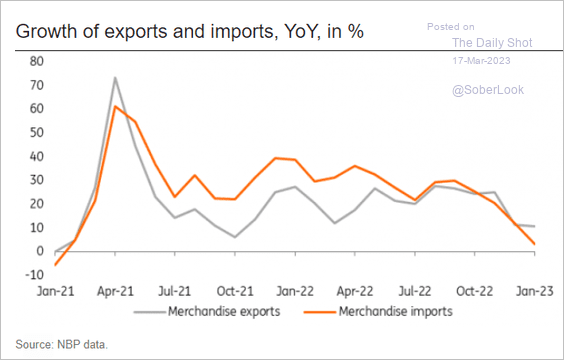
2. Poland’s core CPI hit 12% last month.
Here is the headline CPI.
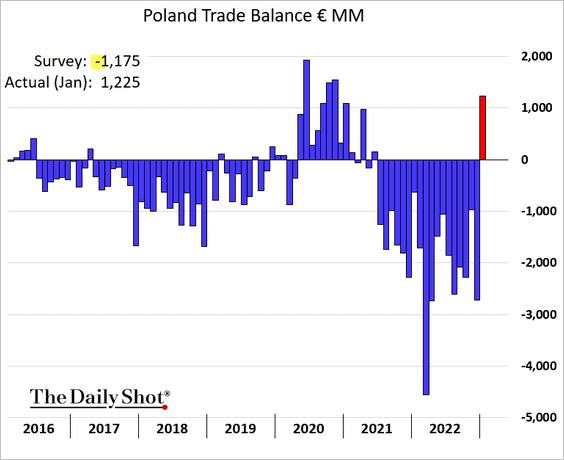
Poland’s trade growth has slowed.
 Source: ING
The trade balance unexpectedly shot into surplus.
Back to Index
Asia – Pacific
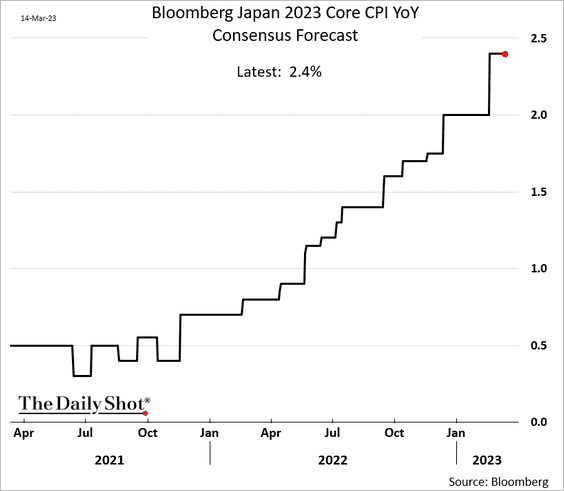
1. Economists keep boosting their forecasts for Japan’s core CPI.
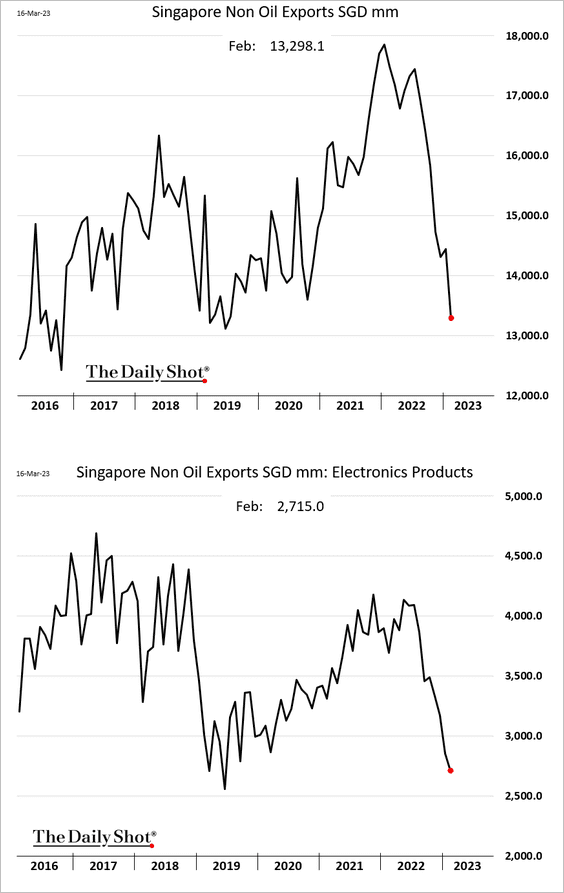
2. Singapore’s exports are slowing.
3. Australia’s rental vacancies have declined over the past few years.
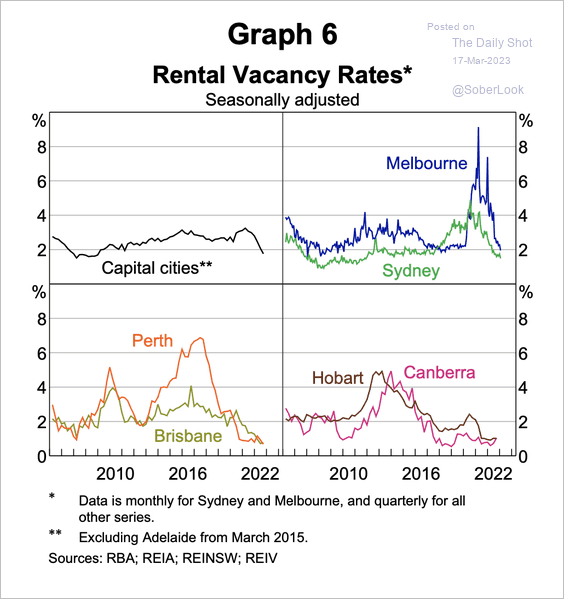 Source: RBA Read full article
The average household size is near all-time lows, spurring demand for rental homes.
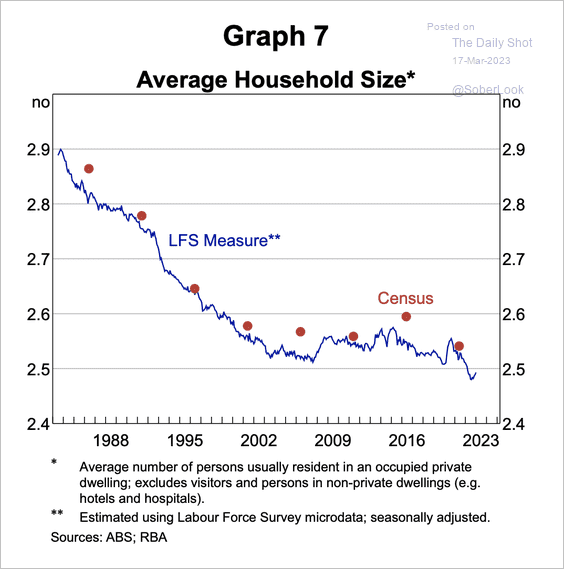 Source: RBA Read full article
Back to Index
Emerging Markets
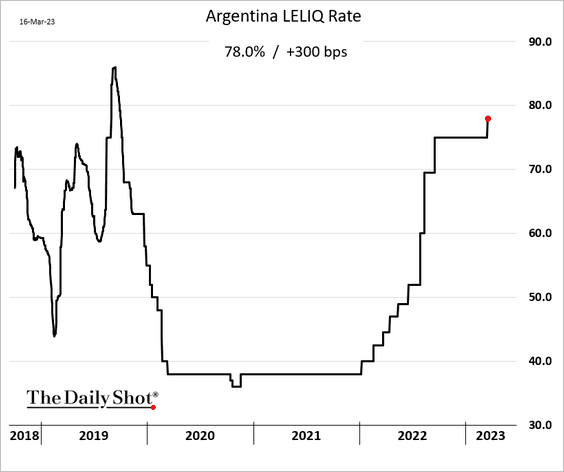
1. Argentina’s central bank hiked rates as inflation exceeds 100%.
 Source: Reuters Read full article
——————–
2. Will Asian import prices decline further?
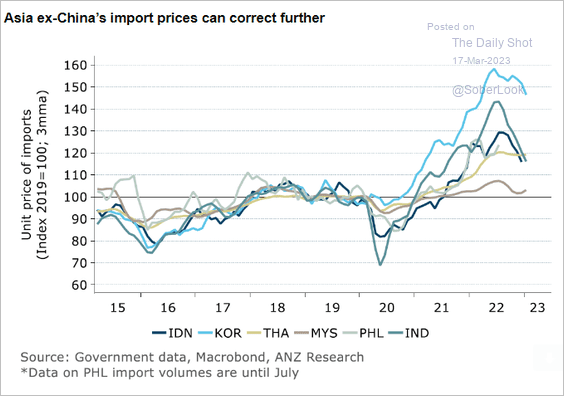 Source: @ANZ_Research
Back to Index
Cryptocurrency
1. Cryptos advanced over the past week with bitcoin outperforming other major tokens.
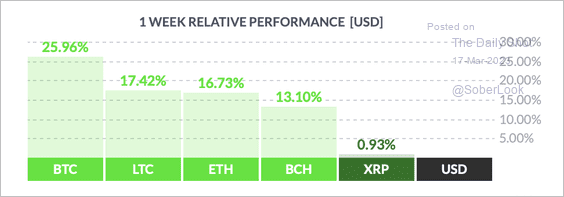 Source: FinViz
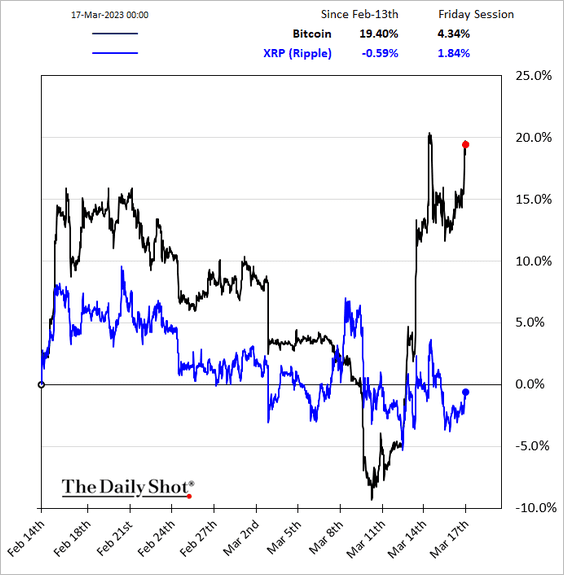
• XRP is not participating in the rebound.
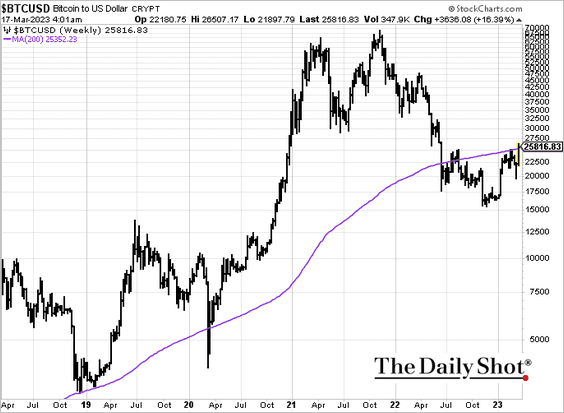
• Bitcoin is testing resistance at the 200-week moving average.
——————–
2. Bitcoin’s trading volume spiked over the past few days.
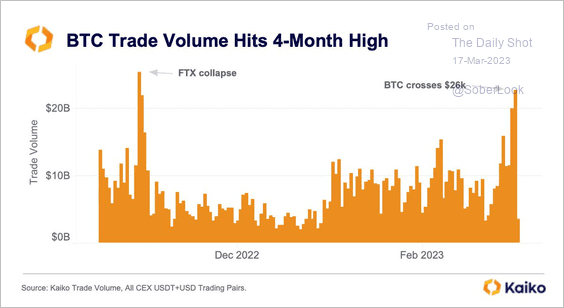 Source: @KaikoData
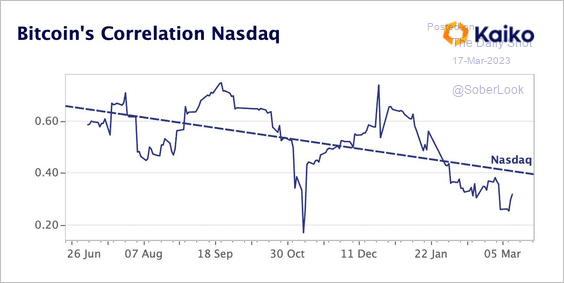
3. Bitcoin’s correlation with the Stoxx 600 and Nasdaq 100 has declined. (2 charts)
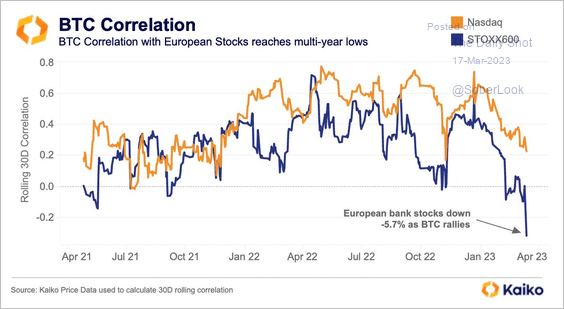 Source: @KaikoData
 Source: @KaikoData
——————–
4. The Crypto Fear & Greed Index quickly snapped out of fear territory and returned to neutral.
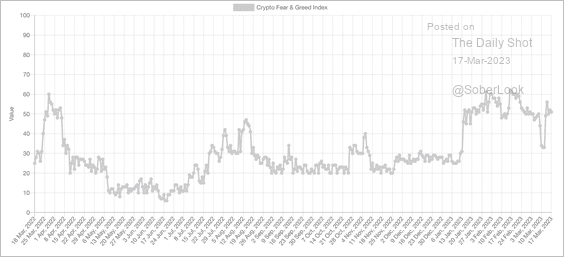 Source: Alternative.me
Back to Index
Energy
1. Crude oil appears to be oversold.
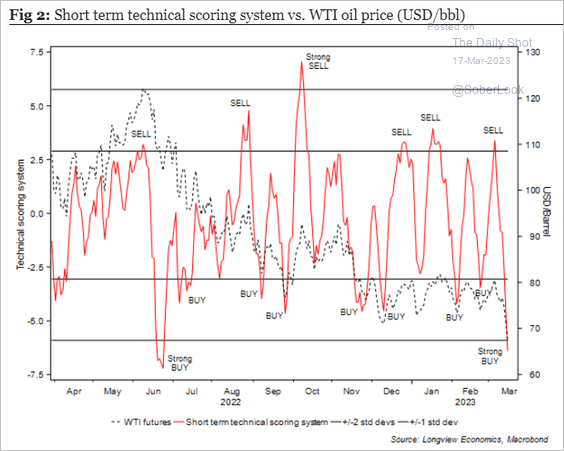 Source: Longview Economics
2. Russian oil exports via tankers are holding near the highs.
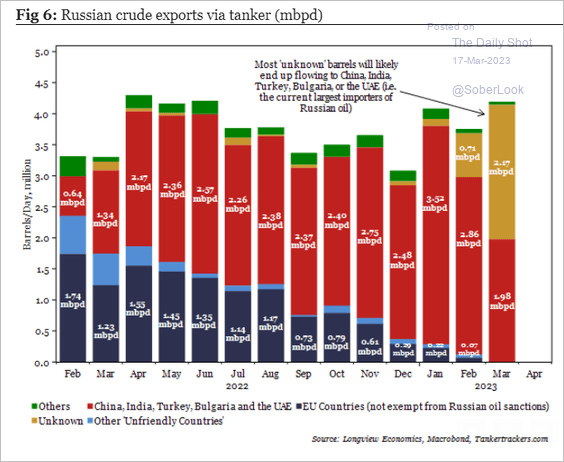 Source: Longview Economics
But oil-export revenues are trending lower.
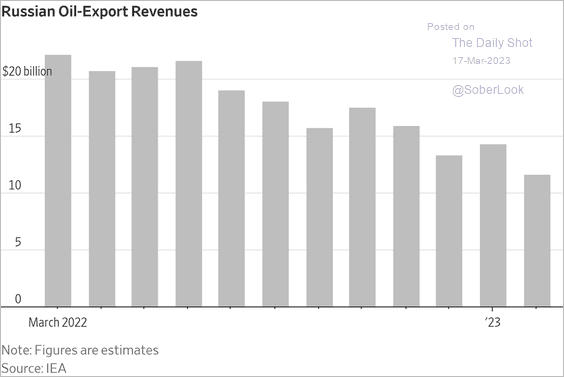 Source: @WSJ Read full article
——————–
3. Retail investors jumped back into energy equities.
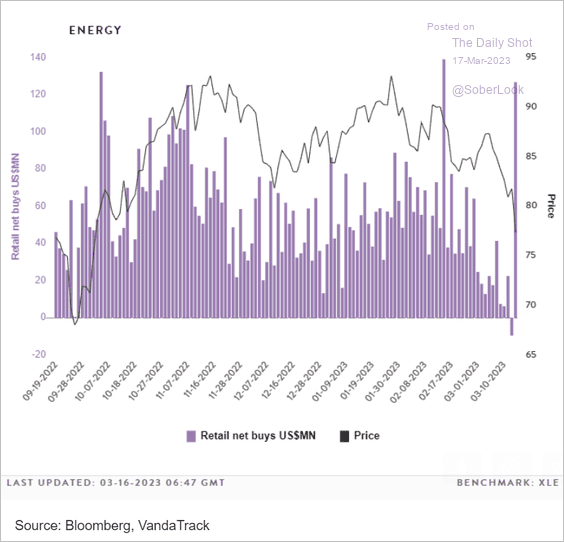 Source: Vanda Research
Back to Index
Equities
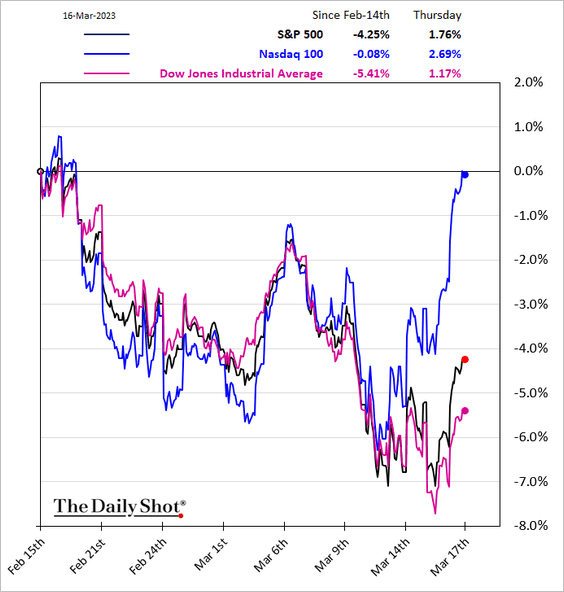
1. The S&P 500 and the Dow have been held back by financials, while the Nasdaq 100 has been showing better performance.
2. This chart shows financial sector performance globally since March 8th.
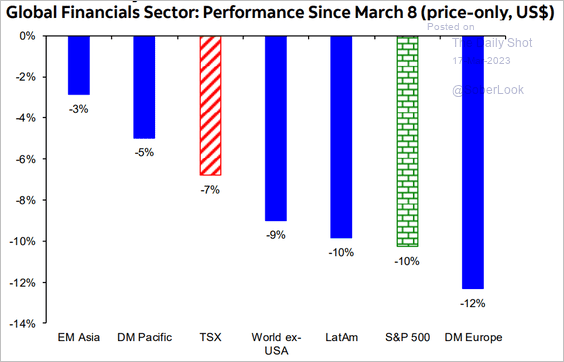 Source: Hugo Ste-Marie, Portfolio & Quantitative Strategy Global Equity Research, Scotia Capital
3. How is the S&P 500 tracking other bear markets?
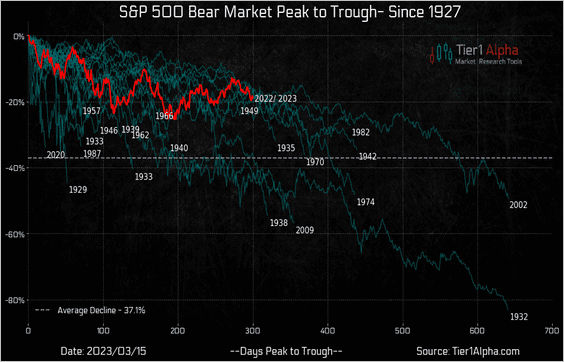 Source: @t1alpha
4. Homebuilding stocks are breaking out relative to the S&P 500, possibly due to the pullback in mortgage rates.
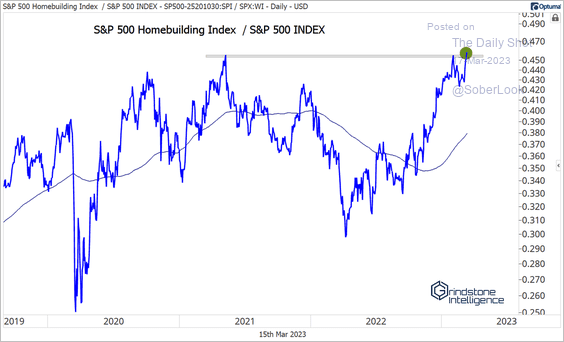 Source: @meanstoatrend
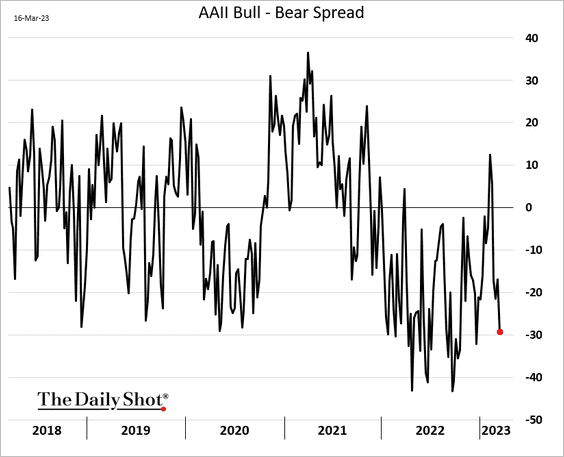
5. Investor sentiment has been moving deeper into bear-market territory.
6. Retail investors have been slowing their purchases of individual stocks. ETF buying bounced this week.
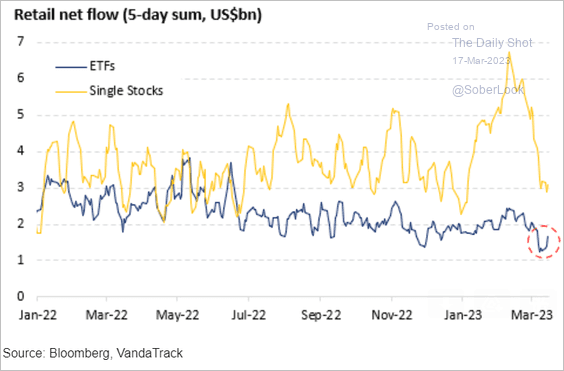 Source: Vanda Research
– The single-name pullback was due to Tesla.
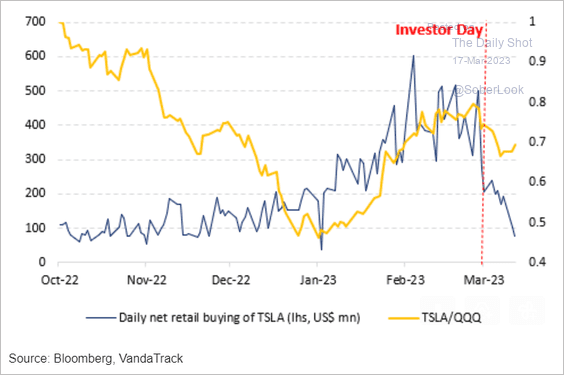 Source: Vanda Research
– The ETF pickup can be explained by financials …
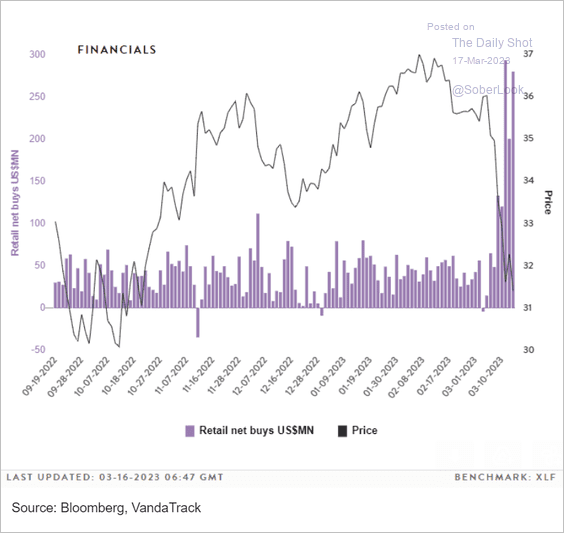 Source: Vanda Research
But retail investors also bought individual bank stocks.
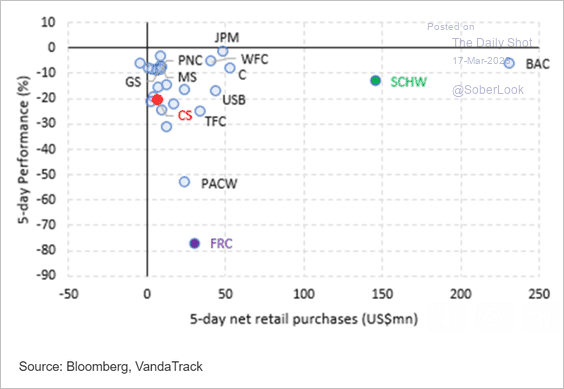 Source: Vanda Research
——————–
7. This chart shows equity factor performance since March 8th.
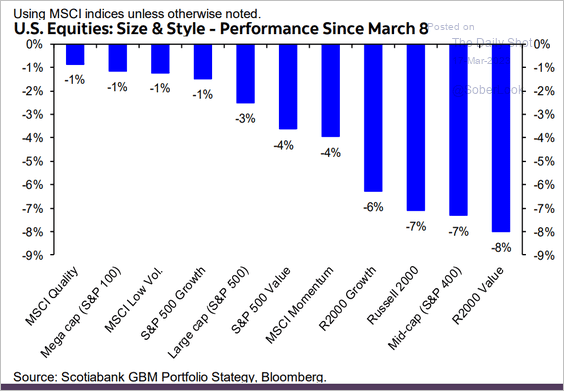 Source: Hugo Ste-Marie, Portfolio & Quantitative Strategy Global Equity Research, Scotia Capital
Back to Index
Credit
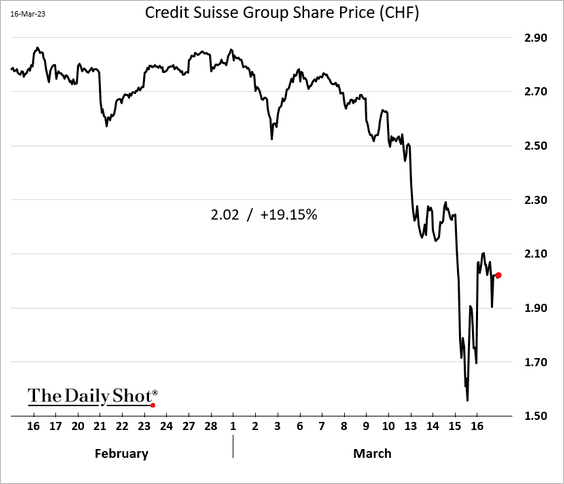
1. Credit Suisse is back from the brink after tapping the $54 billion credit line with the Swiss National Bank.
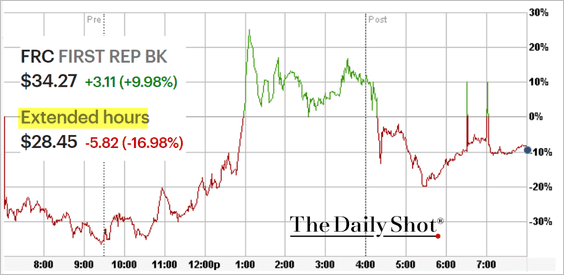
2. First Republic Bank shares stabilized after getting a massive infusion of deposits, orchestrated by the US government.
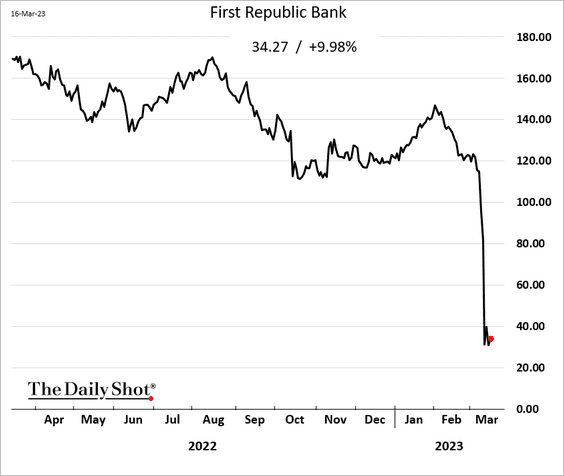
 Source: CNBC Read full article
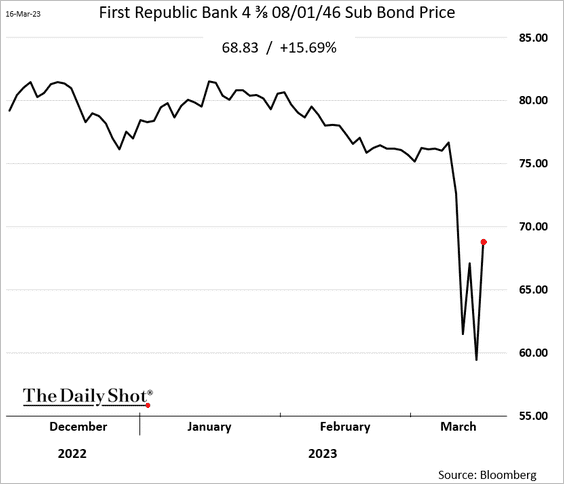
Here is the subordinated bond.
But shares are down again in overnight trading.
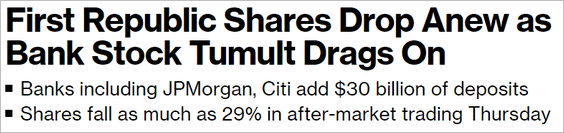 Source: @brebradham, @markets Read full article
——————–
3. Here is why small banks are so important for the US economy.
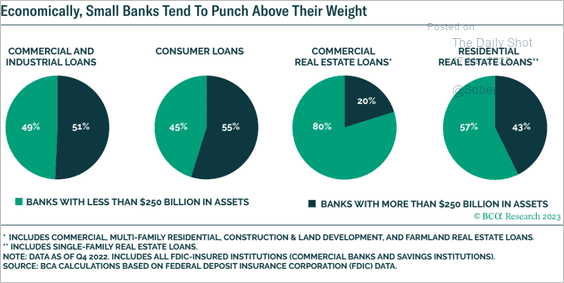 Source: BCA Research
This chart shows loan assets by bank size.
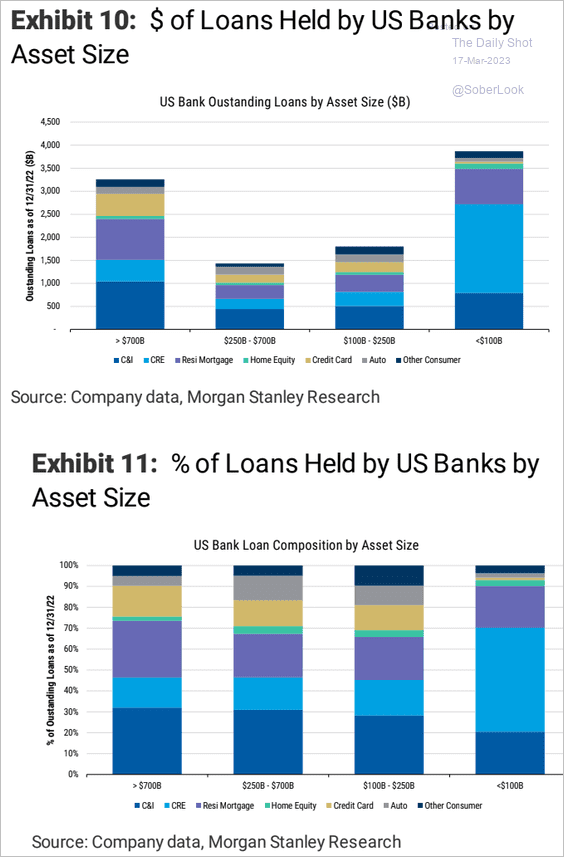 Source: Morgan Stanley Research
——————–
4. Small banks will be forced to boost deposit rates substantially to maintain/attract deposits.
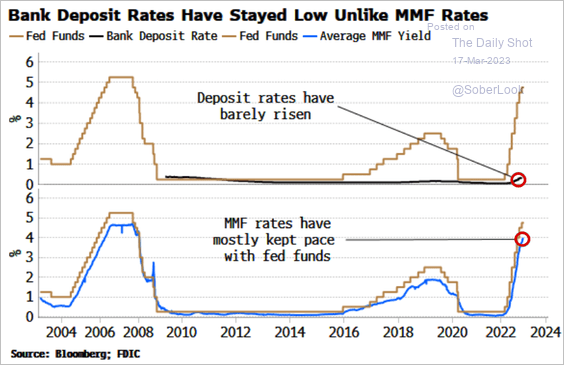 Source: Simon White, Bloomberg Markets Live Blog
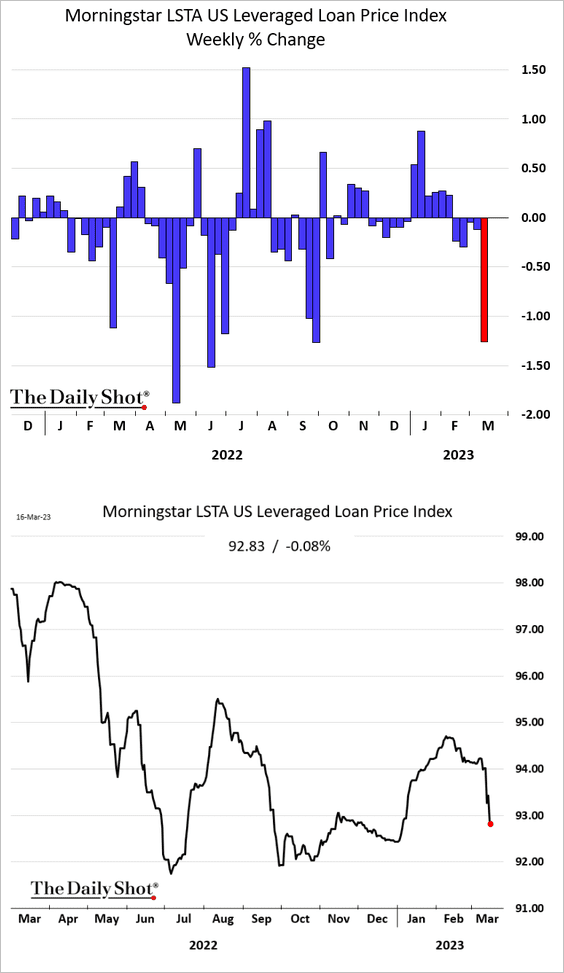
5. Leveraged loan prices took a hit in recent days.
Back to Index
Rates
1. The 2-year Treasury volatility has been exceptionally high (2 charts).
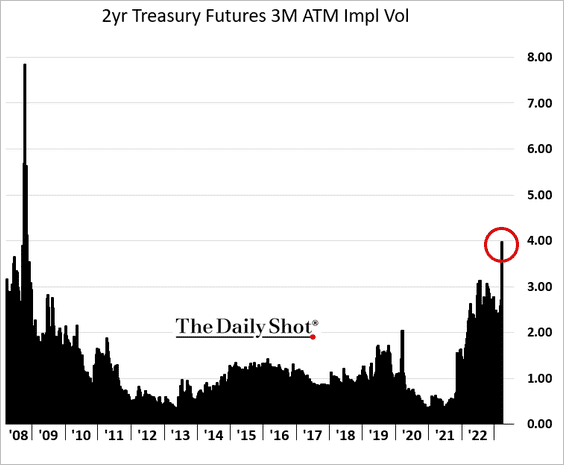
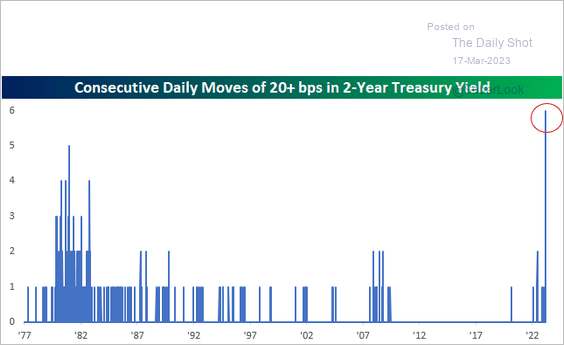 Source: @bespokeinvest
——————–
2. Inflows into Treasury funds remain elevated.
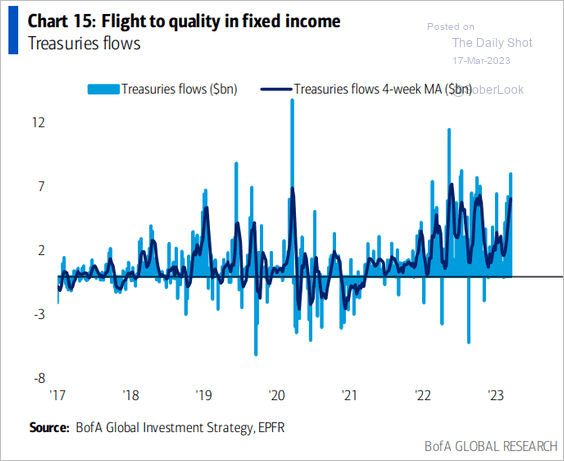 Source: BofA Global Research
Back to Index
Global Developments
1. Inflows into cash have been high this quarter.
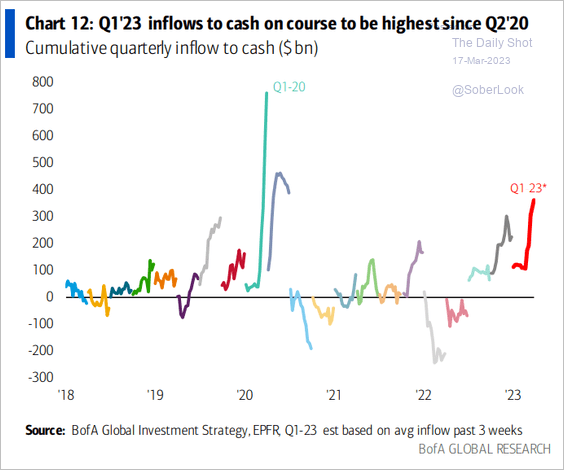 Source: BofA Global Research
2. Few businesses expect an early end to central bank tightening.
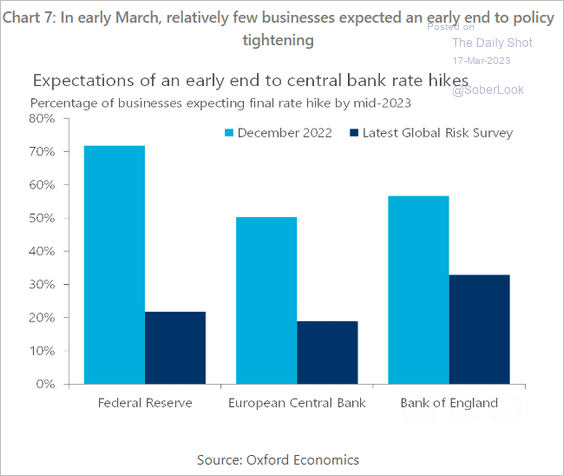 Source: Oxford Economics
——————–
Food for Thought
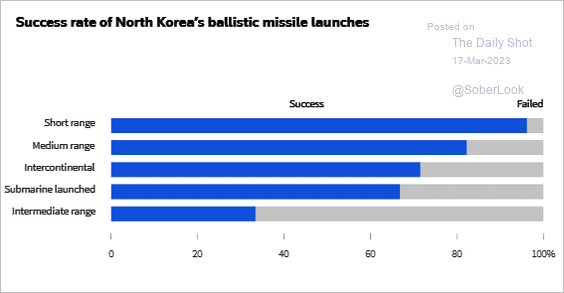
1. North Korea’s missile launches (2 charts):
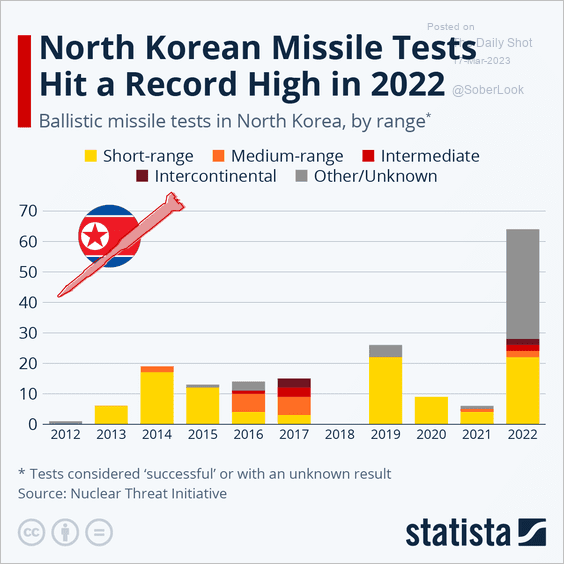 Source: Statista
 Source: Reuters Read full article
——————–
2. Russia’s population pyramid:
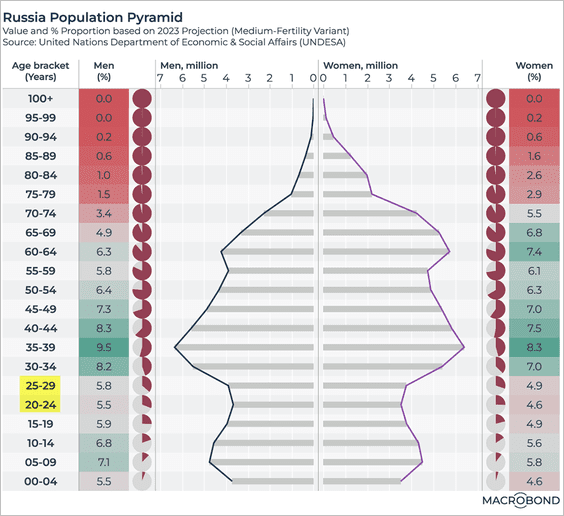 Source: Macrobond
3. Support for Ukraine in the US:
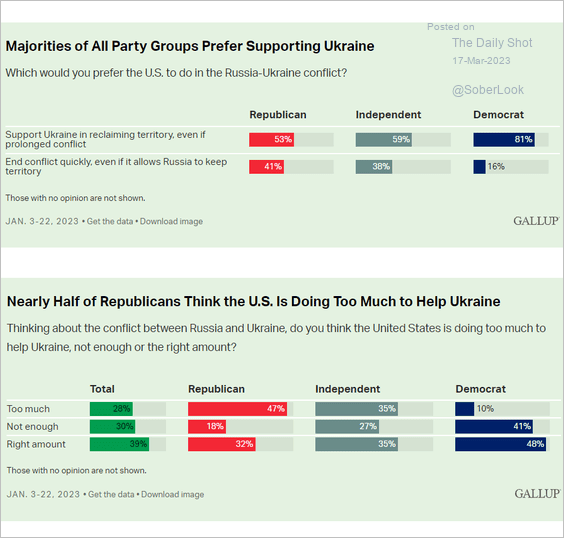 Source: Gallup Read full article
4. Congressional districts with the highest planned clean energy capacity additions (2 charts):
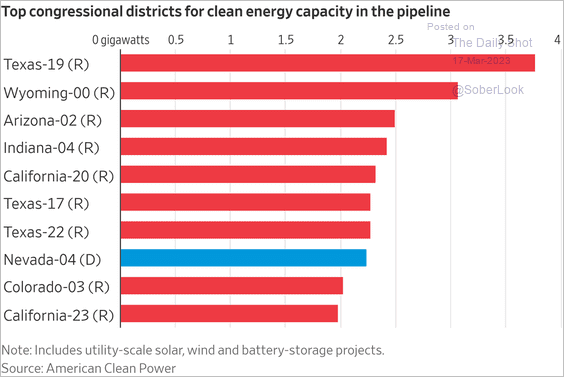 Source: @WSJ Read full article
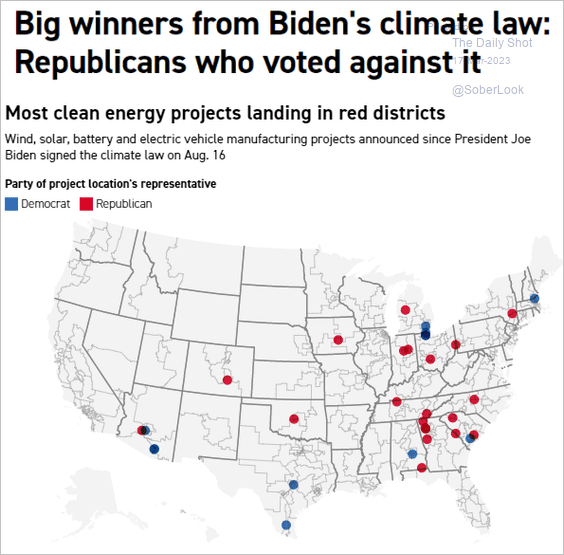 Source: POLITICO Read full article
• Capacity growth with and without the Inflation Reduction Act tax credits:
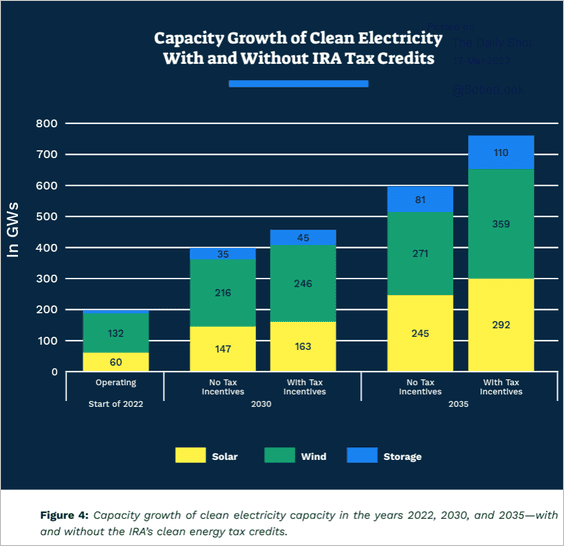 Source: Evergreen Collective Read full article
——————–
5. Projections for Medicare spending:
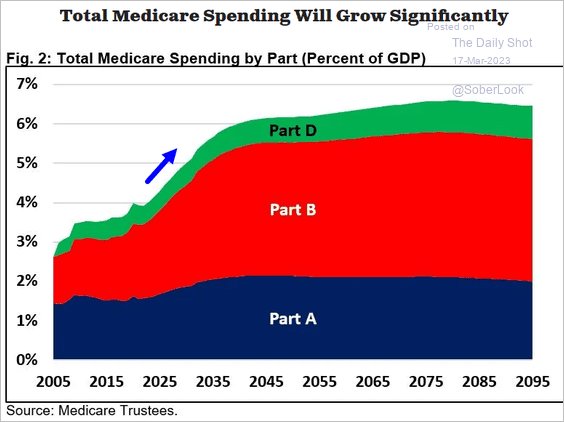 Source: CRFB
6. Distribution of cancer cases by type:
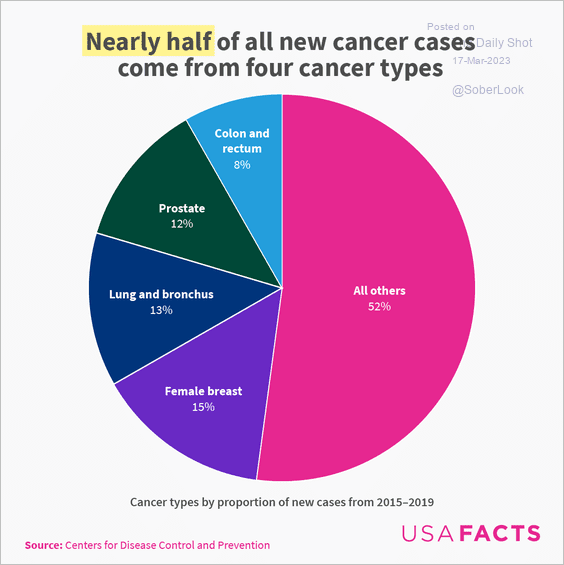 Source: USAFacts
7. Aliens to visit Earth in 2023:
 Source: Statista
——————–
Back to Index