
The Daily Shot: 28-Mar-23
• The United States
• Canada
• The United Kingdom
• The Eurozone
• China
• Emerging Markets
• Cryptocurrency
• Energy
• Equities
• Alternatives
• Credit
• Rates
• Food for Thought
The United States
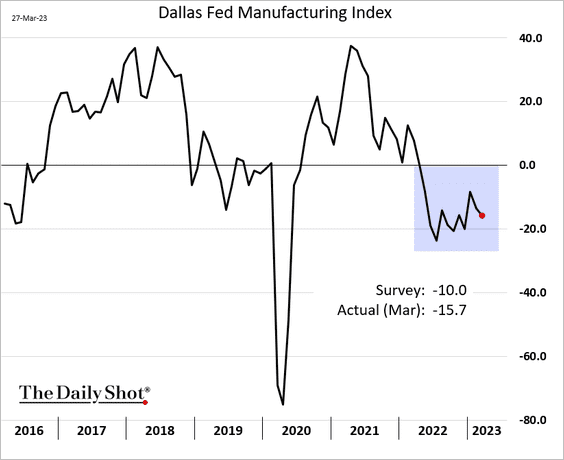
1. The Dallas Fed’s manufacturing index continues to show slowing factory activity in the region.
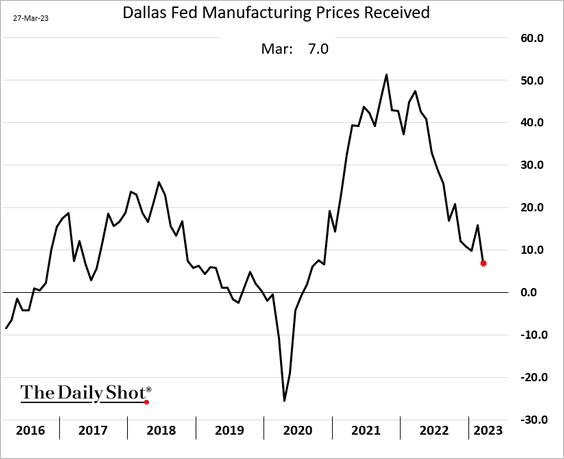
• Fewer companies are boosting prices.
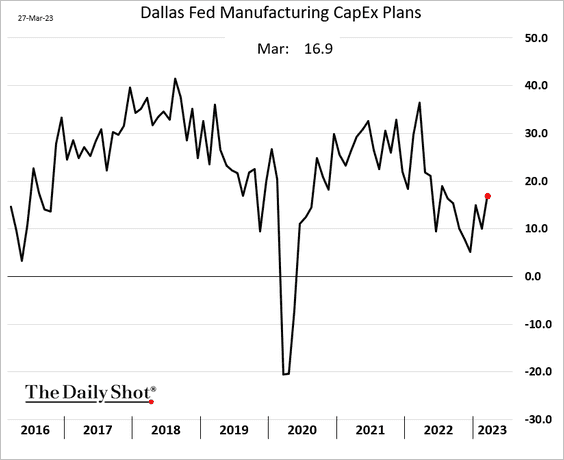
• CapEx plans improved this month.
——————–
2. While there is debate on whether the fed funds rate level (currently at 4.8%) is restrictive enough, tighter financial conditions sent proxy policy rate indicators well into restrictive territory.
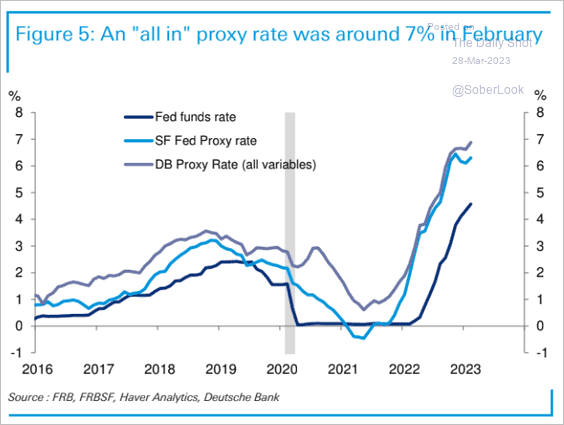 Source: Deutsche Bank Research
3. Since the beginning of the banking turmoil, the Treasury curve has steepened, which is often seen as a warning sign of an upcoming recession.
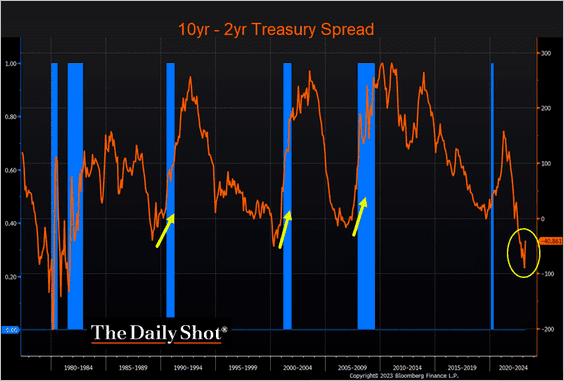 Source: @TheTerminal, Bloomberg Finance L.P.
• Tightening financial conditions typically occur alongside contractions in industrial production.
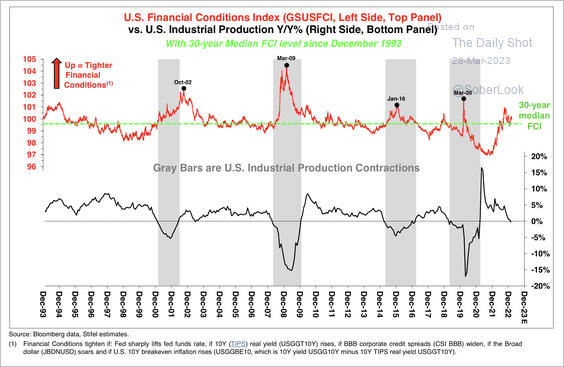 Source: Stifel
• Goldman boosted the odds of a recession in the next 12 months, but the bank’s base case is still no recession.
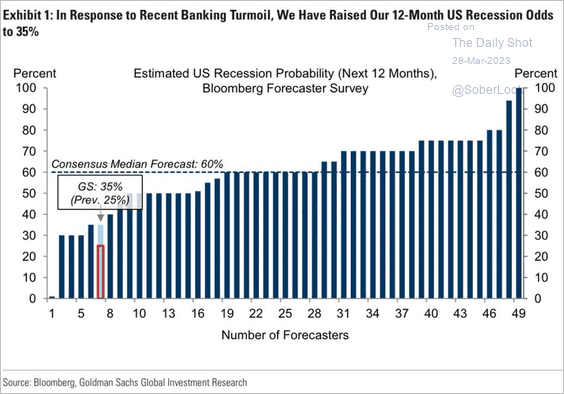 Source: Goldman Sachs; @carlquintanilla
——————–
5. Next, we have some updates on the labor market.
• Alpine Macro’s employment forecasts by sector:
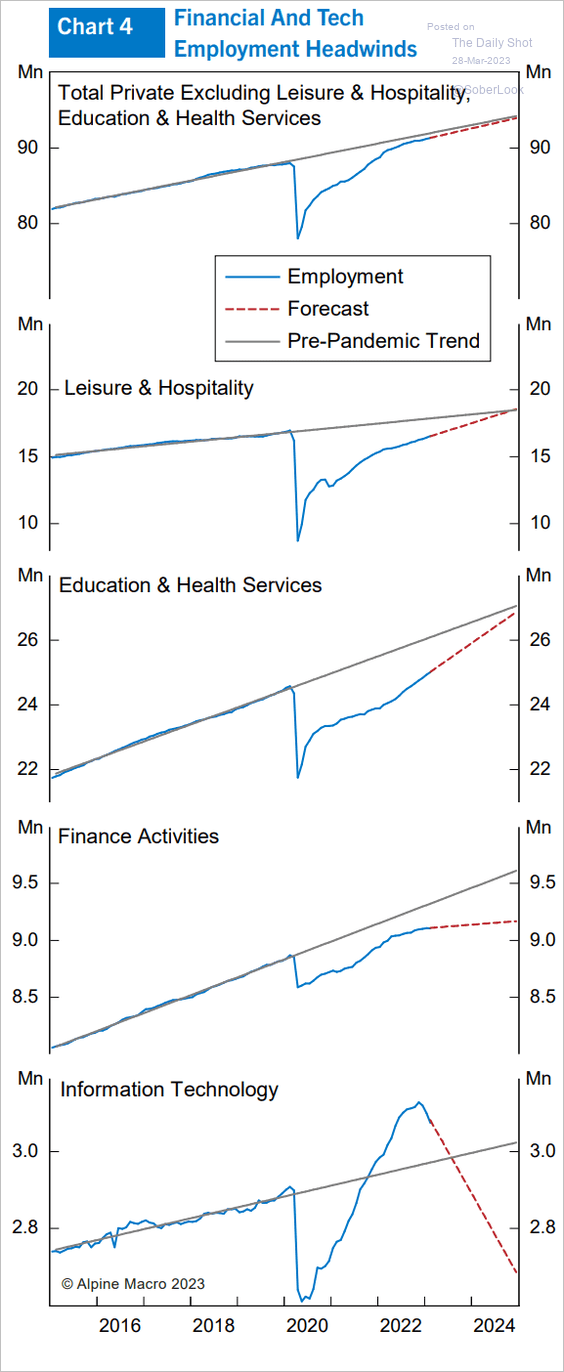 Source: Alpine Macro
• Job cuts by sector:
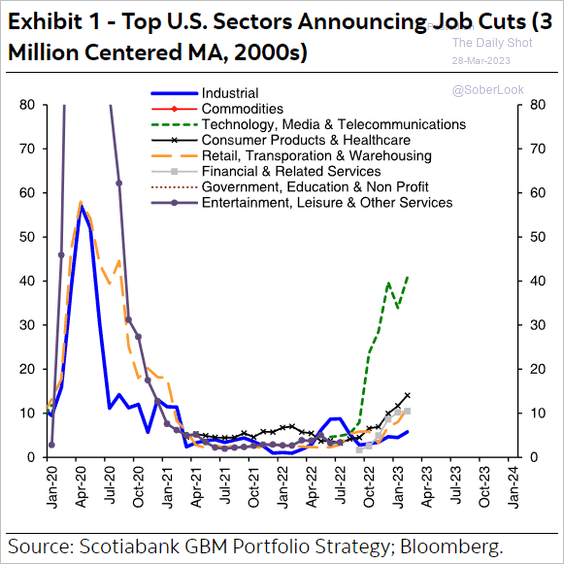 Source: Hugo Ste-Marie, Portfolio & Quantitative Strategy Global Equity Research, Scotia Capital
——————–
6. Wells Fargo suggests that the significant increase in the value of construction put-in-place for manufacturing facilities may indicate a shift towards reshoring activity, particularly in the computer/electronics industry. (2 charts)
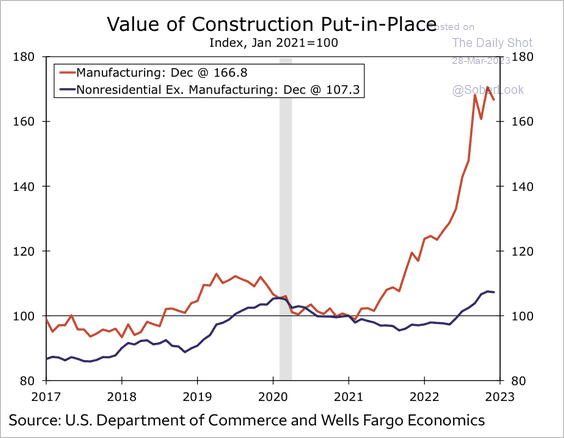 Source: Wells Fargo Securities
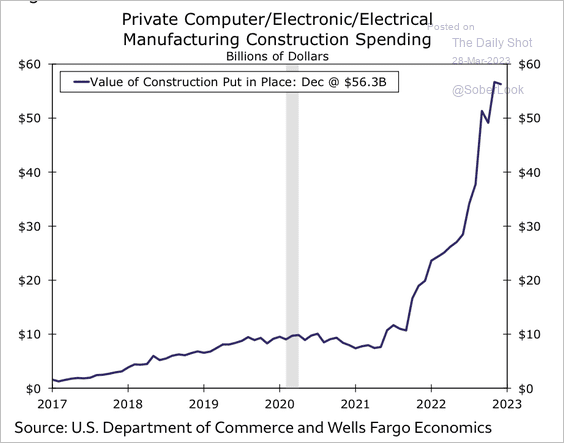 Source: Wells Fargo Securities
Back to Index
Canada
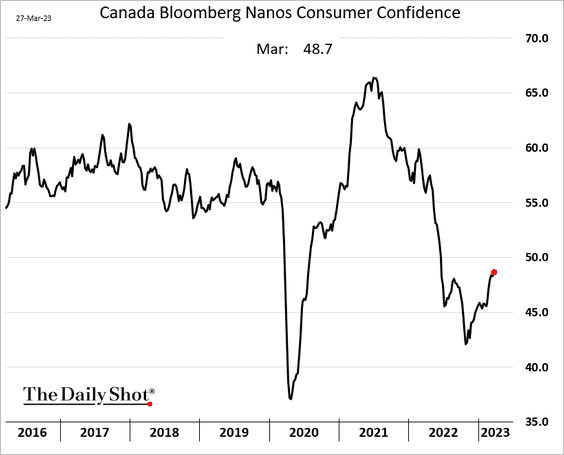
1. Consumer sentiment is grinding higher.
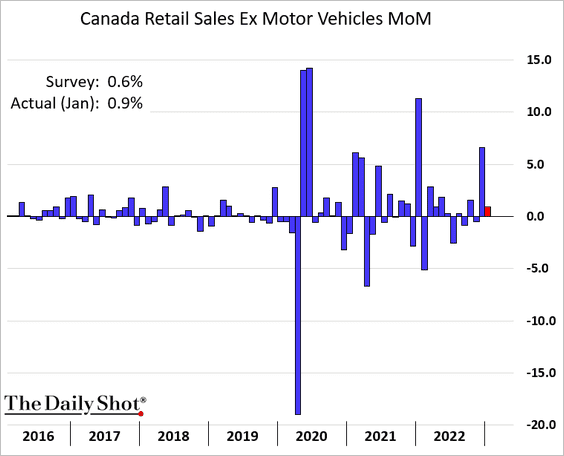
2. Retail sales were firmer than expected in January.
3. Inflation expectations remain elevated.
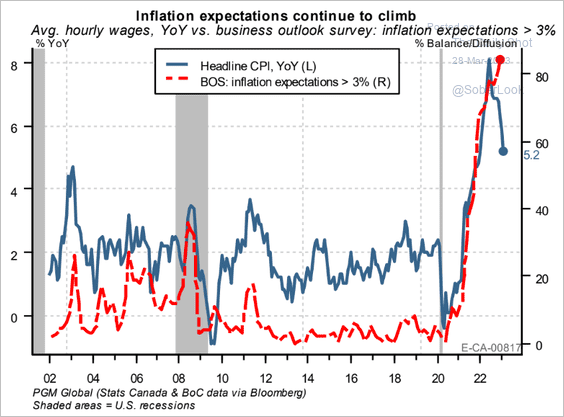 Source: PGM Global
Back to Index
The United Kingdom
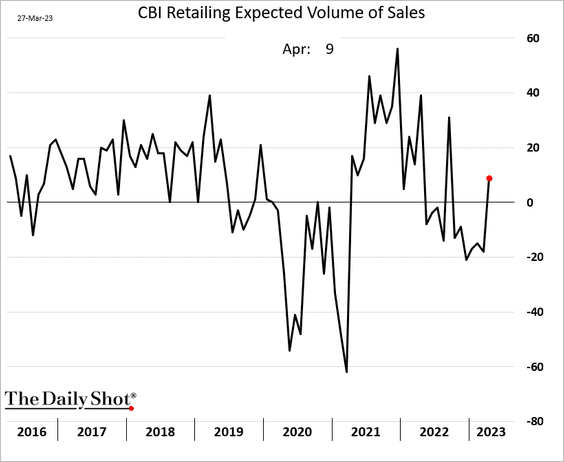
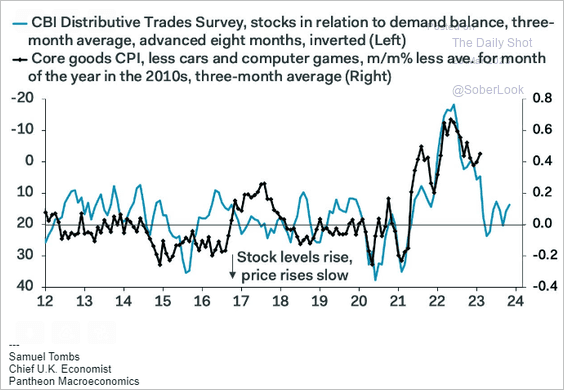
1. The CBI retail sales index held relatively steady this month.
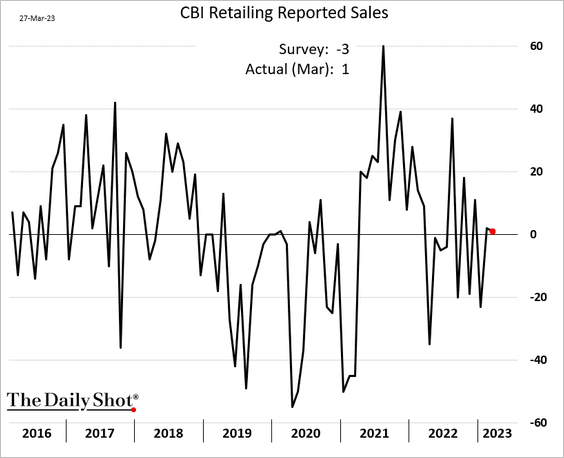
• Retailers expect an improvement going forward.
• Easing supply bottlenecks (based on CBI data) should help reduce inflation.
 Source: Pantheon Macroeconomics
——————–
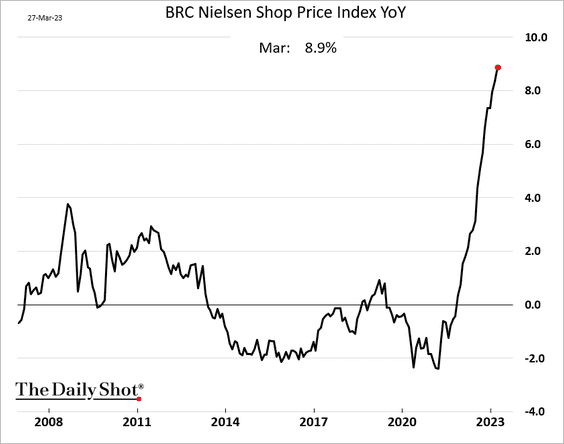
2. For now, retail-sector inflation continues to climb.
3. Rising insolvencies signal higher unemployment ahead.
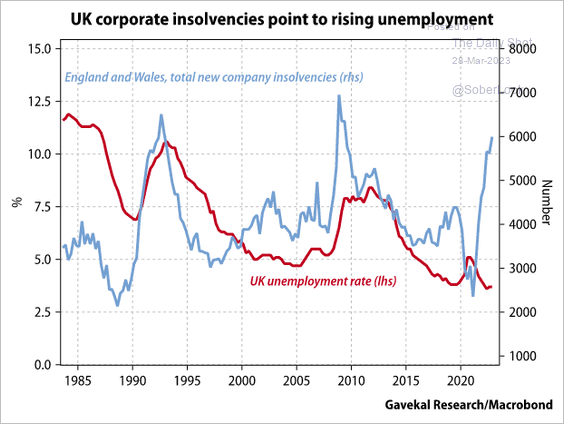 Source: Gavekal Research
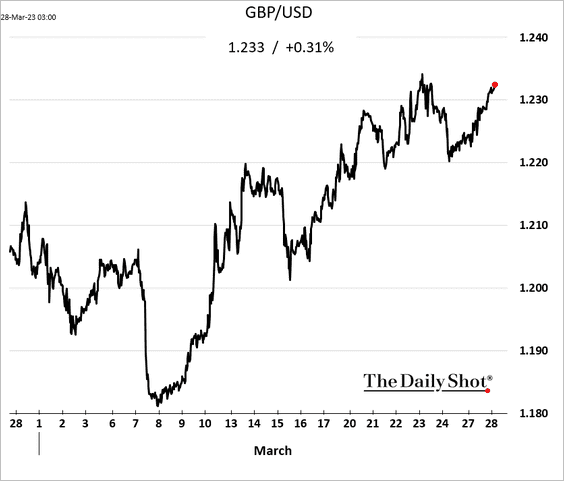
4. It’s been a good month for the pound.
Back to Index
The Eurozone
1. Germany’s Ifo business expectations climbed again this month, surprising to the upside.
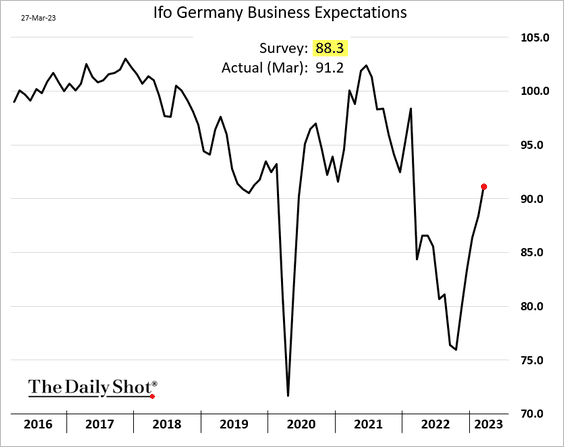
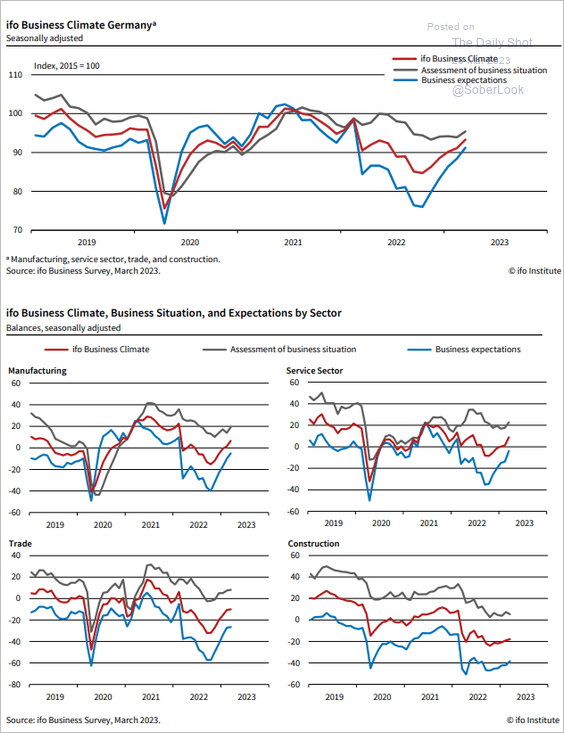 Source: ifo Institute
 Source: Reuters Read full article
——————–
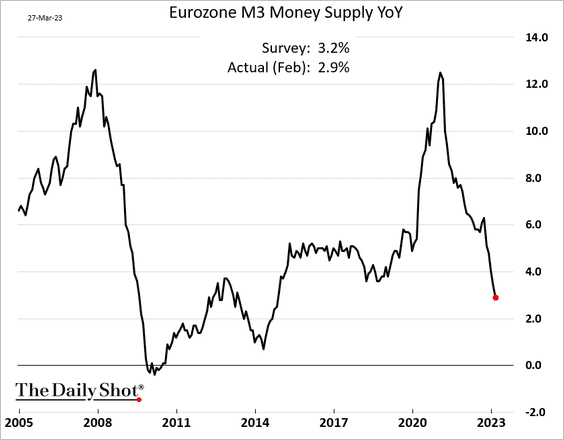
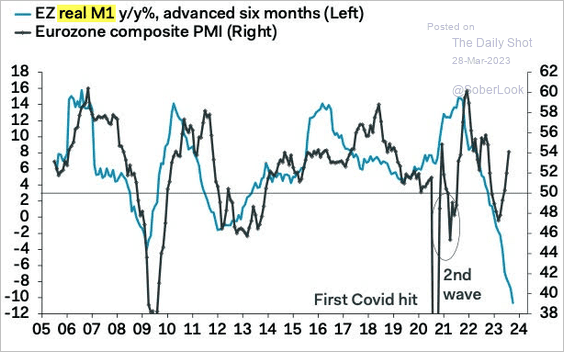
2. Euro-area broad money supply (M3) growth continues to slow.
• The M1 money supply has contracted on a year-over-year basis.
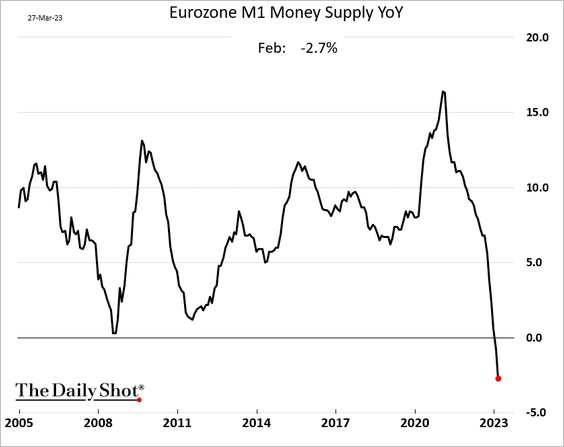
• The real M1 money supply is signaling a deep contraction in business activity.
 Source: Pantheon Macroeconomics
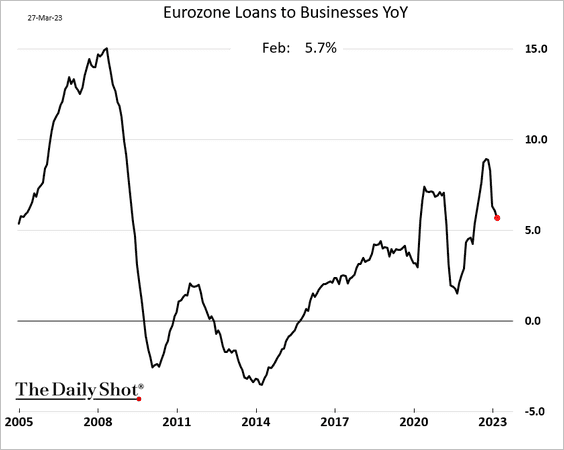
• Loan growth has slowed.
– Business loans:
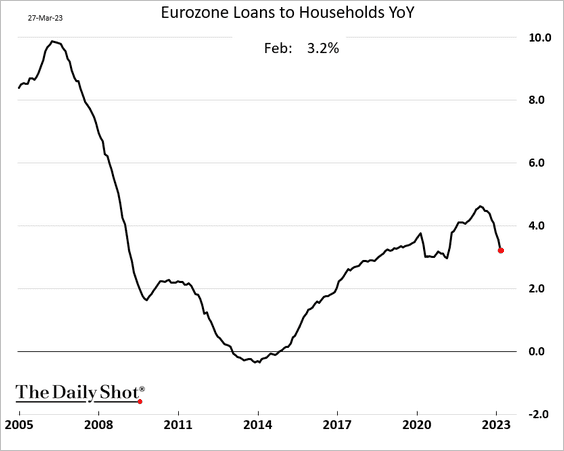
– Loans to households:
• The private sector credit impulse looks recessionary.
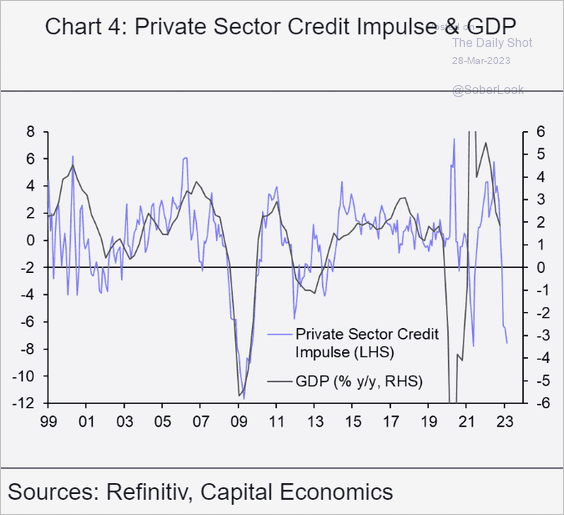 Source: Capital Economics
Back to Index
China
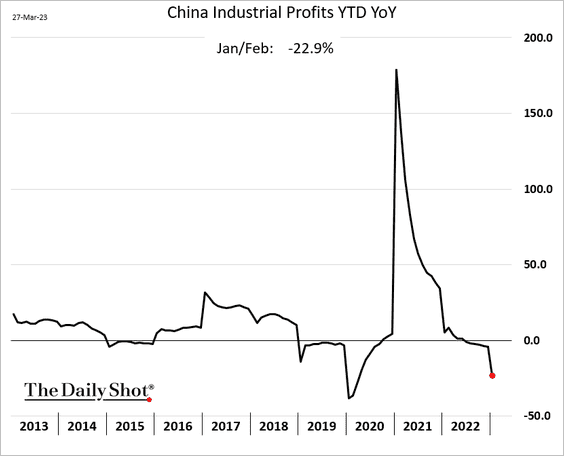
1. Industrial profits took a hit in January and February.
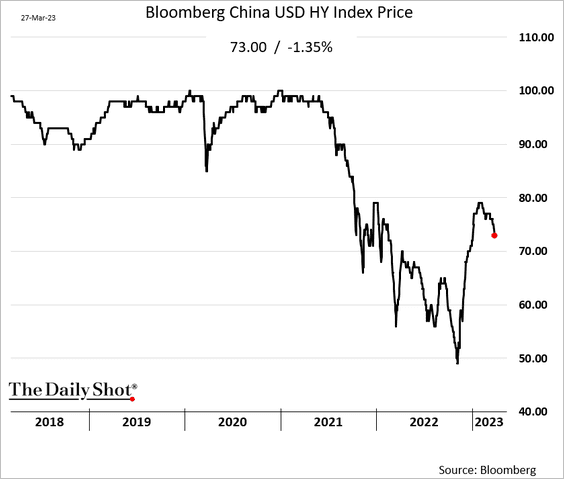
2. The rebound in USD-denominated HY bonds is fading.
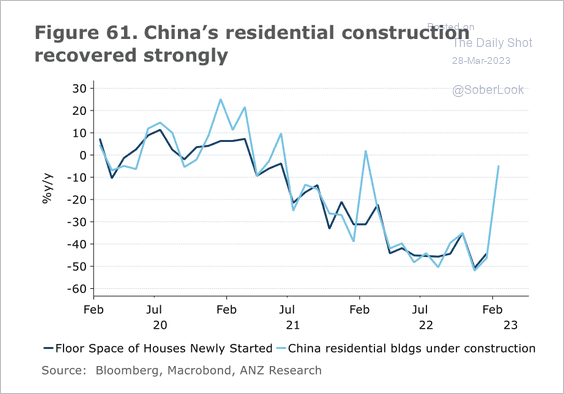
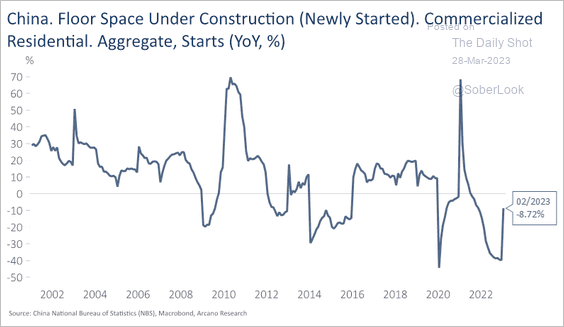
3. Residential construction is recovering (2 charts).
 Source: @ANZ_Research
 Source: Arcano Economics
——————–
4. Steel PMI is back in expansion mode, signaling growth in steel mills’ output.
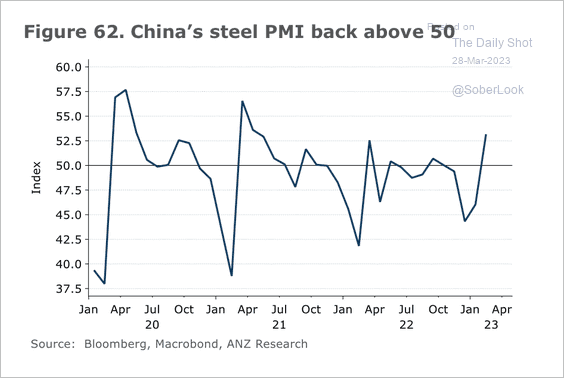 Source: @ANZ_Research
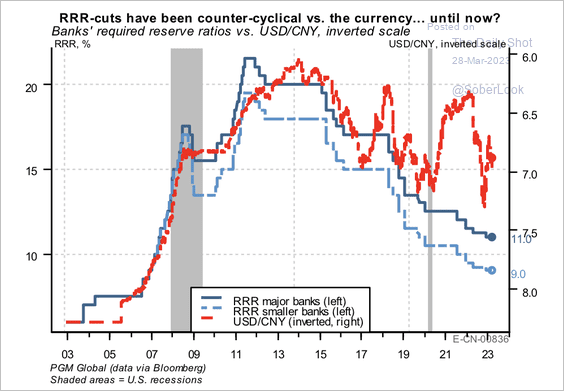
5. Policy easing has taken place within the context of a stronger Chinese yuan.
 Source: PGM Global
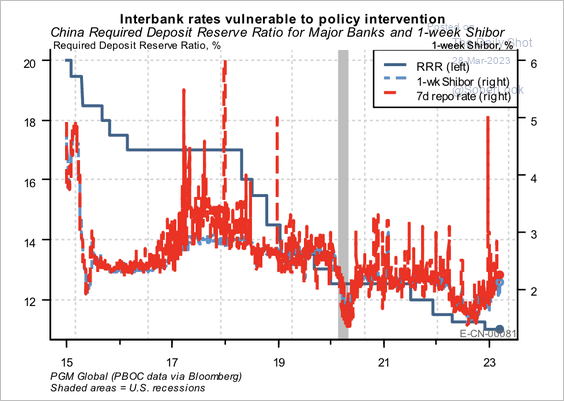
Interbank rates continue to drift higher despite cuts in the reserve requirement ratio. This indicates a liquidity trap, according to PGM Global.
 Source: PGM Global
——————–
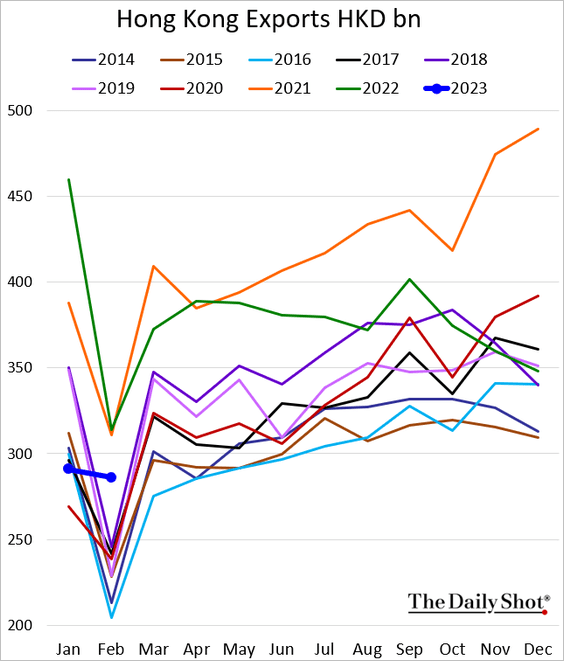
6. Hong Kong’s exports were stronger than expected last month.
Back to Index
Emerging Markets
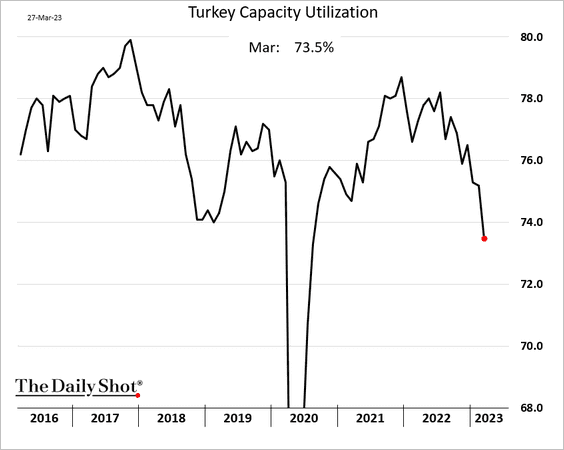
1. Turkey’s manufacturing confidence is recovering.
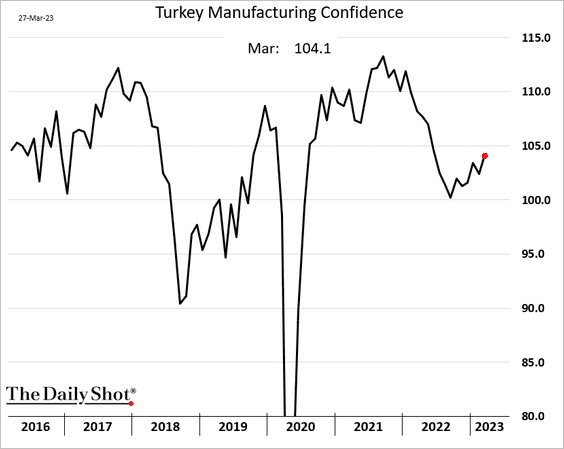
But capacity utilization is tanking.
——————–
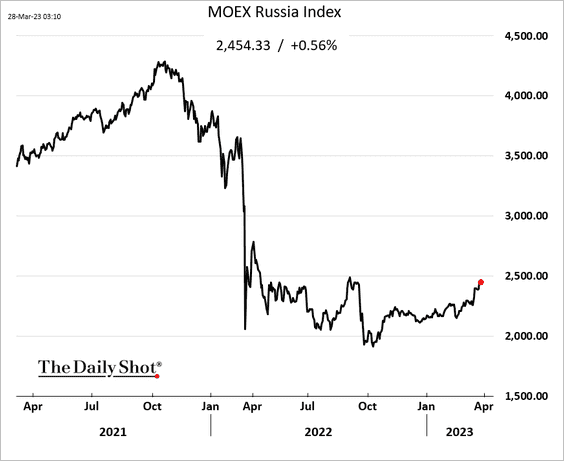
2. Russia’s stock market is rebounding.
3. Brazil’s consumer confidence remains robust.

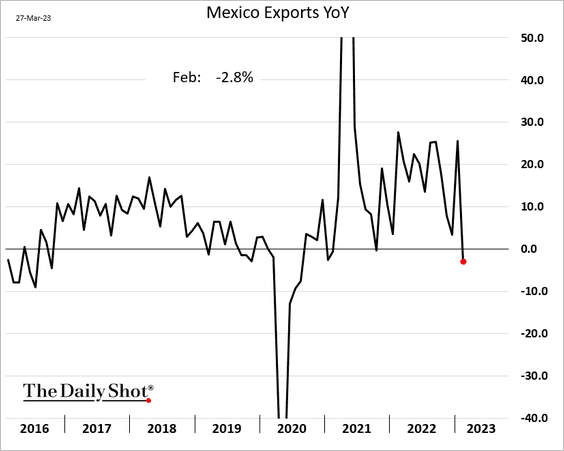
4. Mexico’s exports slowed in February.
Back to Index
Cryptocurrency
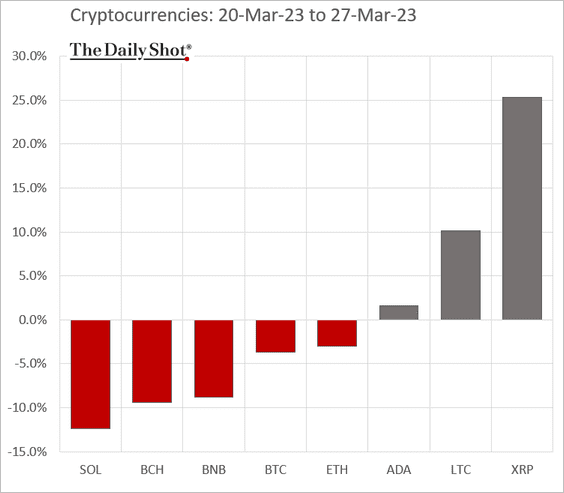
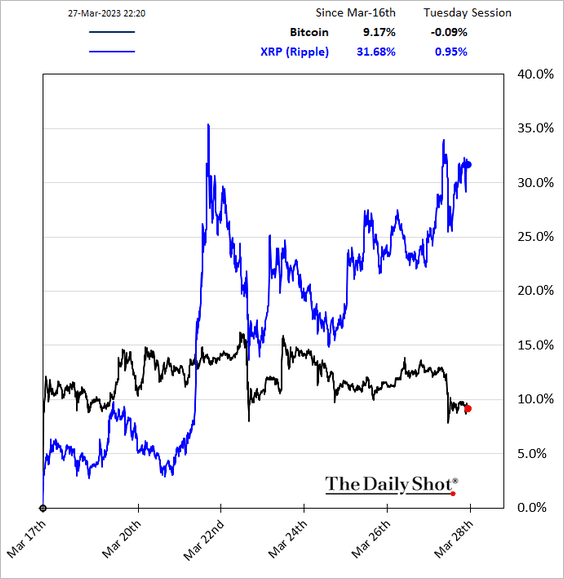
1. XRP has been outperforming, boosted by the Santander story.
——————–
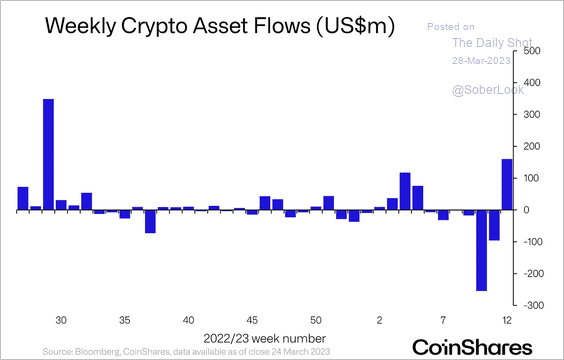
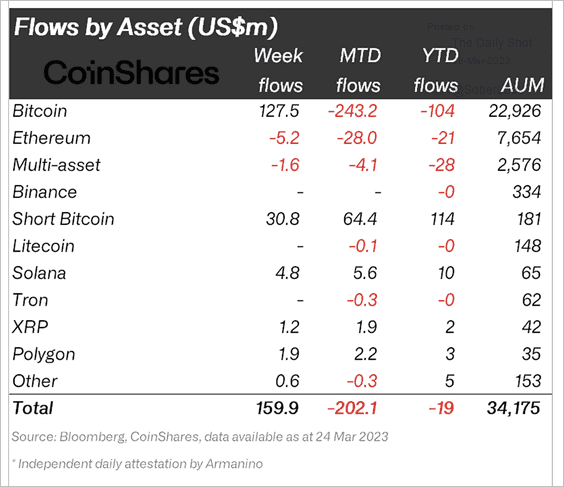
2. Last week, crypto funds saw the largest inflows since July 2022.
 Source: CoinShares Read full article
Bitcoin-focused funds accounted for most inflows, while investors continued to exit multi-asset funds.
 Source: CoinShares Read full article
——————–
3. Binance’s market share has fallen more than 10% since it removed zero-fee trading for BTC pairs.
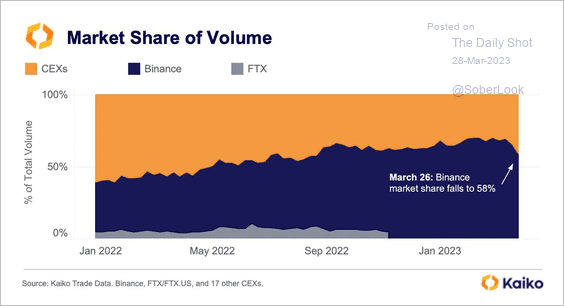 Source: @KaikoData
4. Trade volume for Binance’s BTC/USDT pair is down 90% since zero-fees were eliminated.
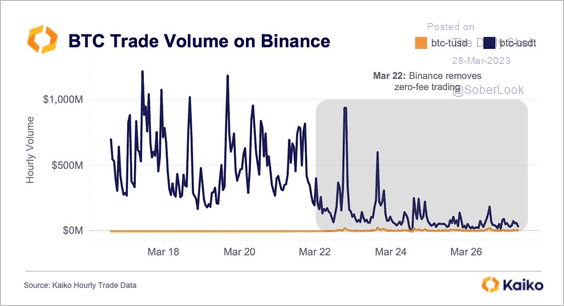 Source: @KaikoData
Back to Index
Energy
1. Money managers have been bearish on crude oil and refined products.
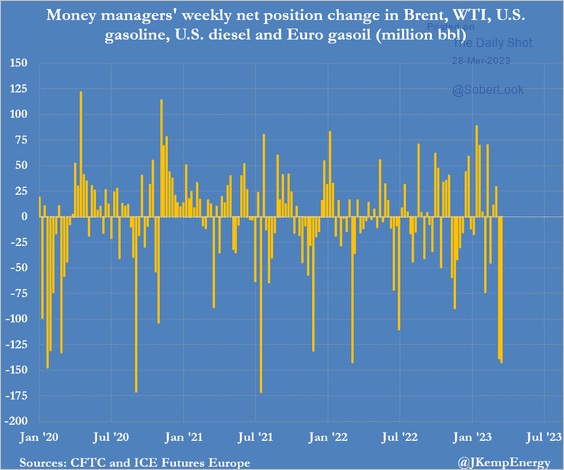 Source: @JKempEnergy
2. Natural gas demand in Europe fell by 55 billion cubic meters in 2022, its steepest drop in history.
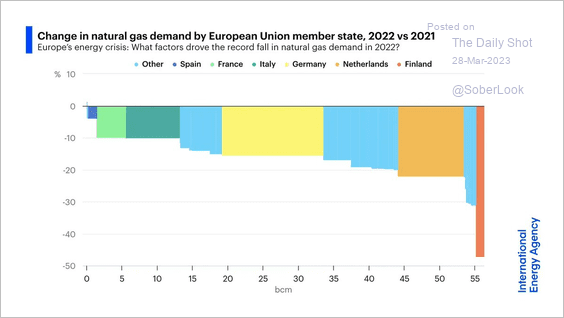 Source: IEA
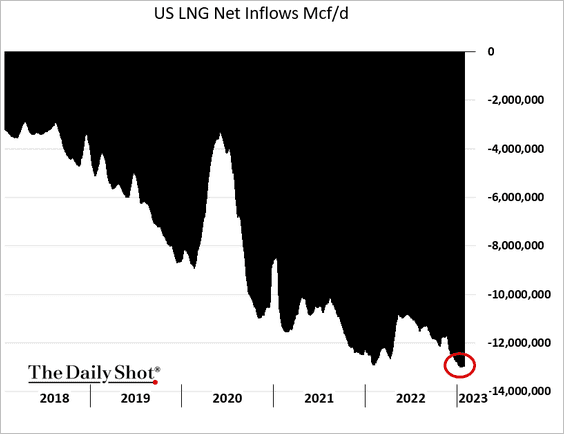
3. US LNG exports continue to climb (the chart shows “net imports”).
4. Next, we have global capacity additions by energy source.
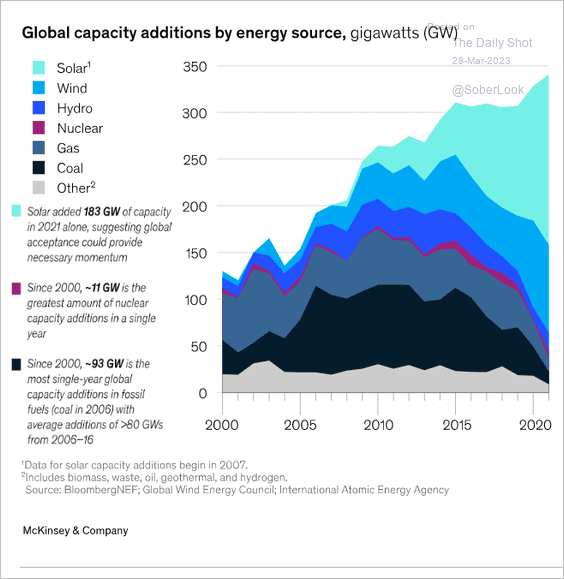 Source: McKinsey & Company Read full article
Back to Index
Equities
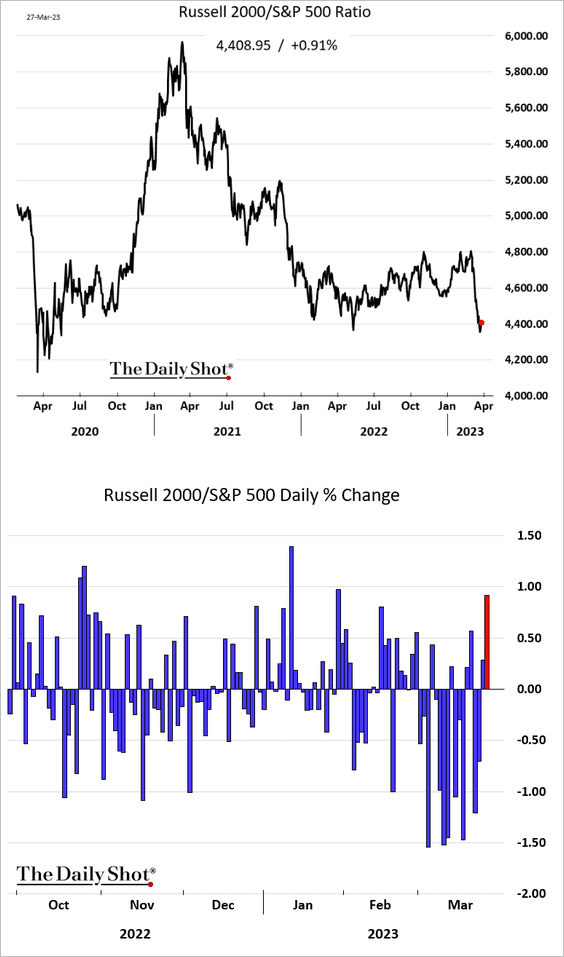
1. Small caps bounced from the lows vs. the S&P 500, boosted by bank shares.
• The iShares Russell 2000 ETF (IWM) has been holding short-term support.
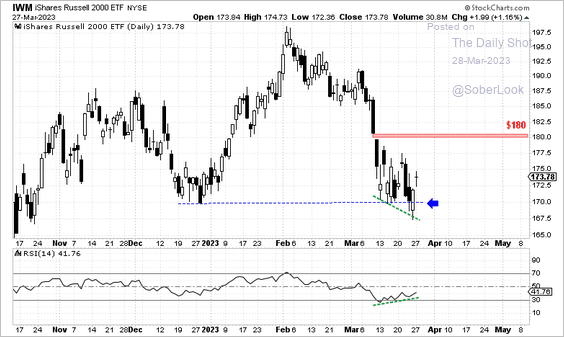 Source: Aazan Habib, Paradigm Capital
• Here is the recent performance by market capitalization.
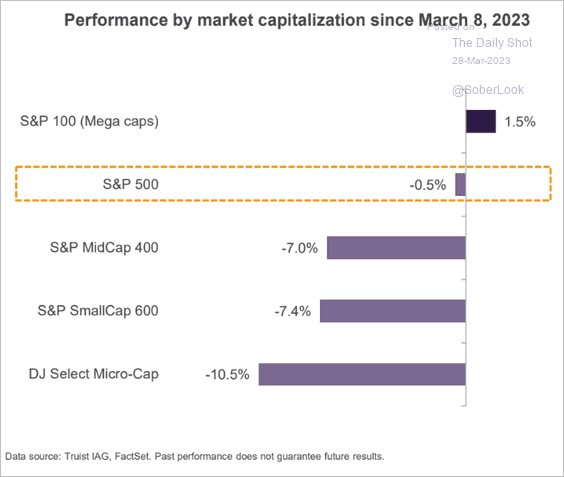 Source: Truist Advisory Services
——————–
2. The top five largest companies in the S&P 500 have been reversing last year’s downtrend.
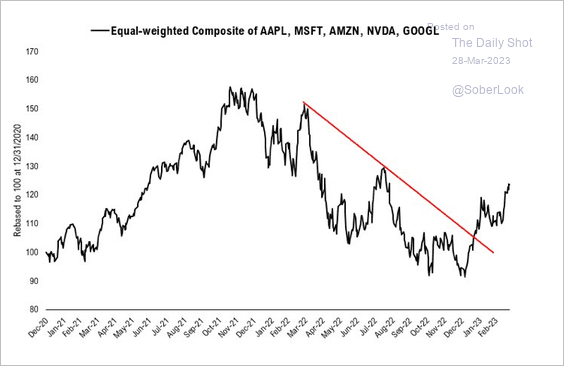 Source: @mattcerminiaro
3. Are earnings projections too upbeat, given the expected slowdown in growth?
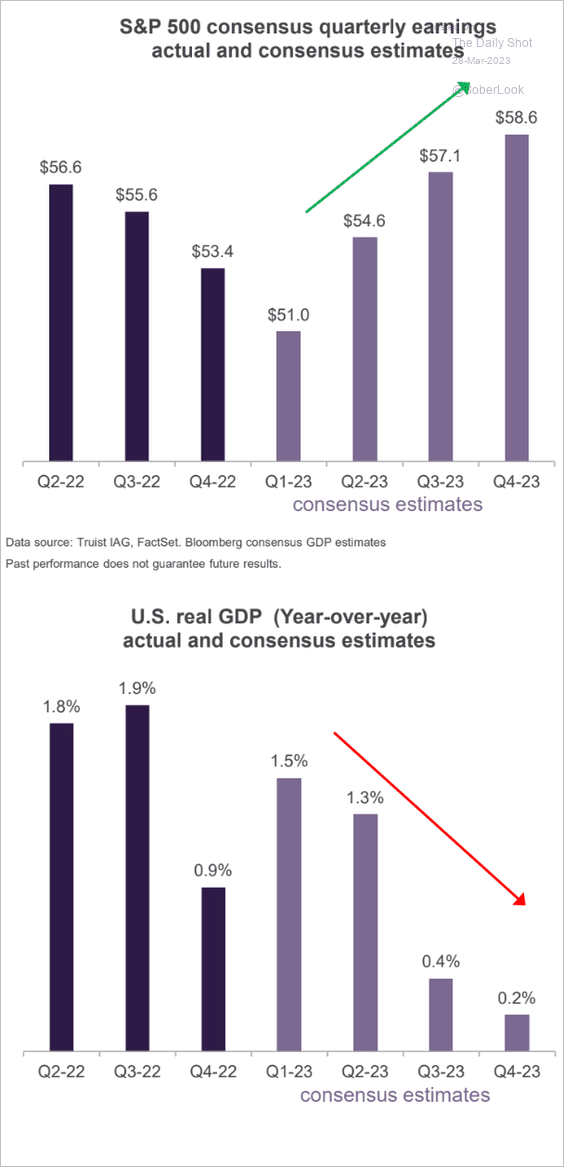 Source: Truist Advisory Services
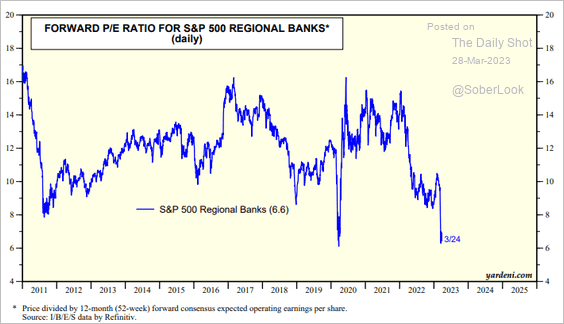
4. The SVB-related reductions in regional banks’ forward earnings estimates weren’t dramatic, especially given the substantial upgrades over the past couple of years (well above pre-COVID levels).
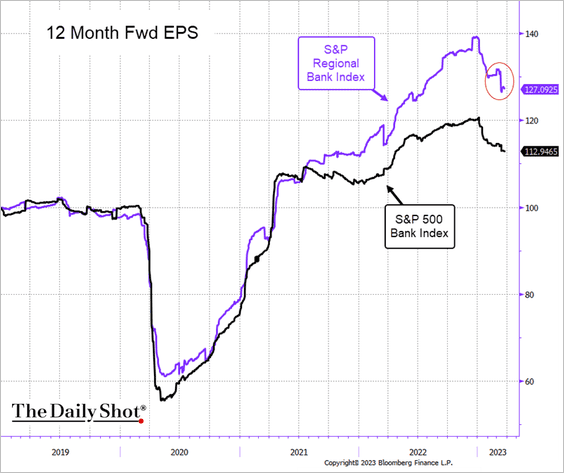
Assuming the above projections hold, regional bank shares are very attractive.
 Source: Yardeni Research
——————–
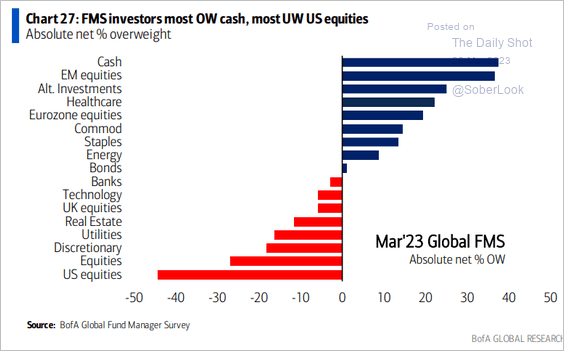
5. Investors are underweight US equities and overweight cash. (2 charts)
 Source: BofA Global Research
 Source: @mattcerminiaro
——————–
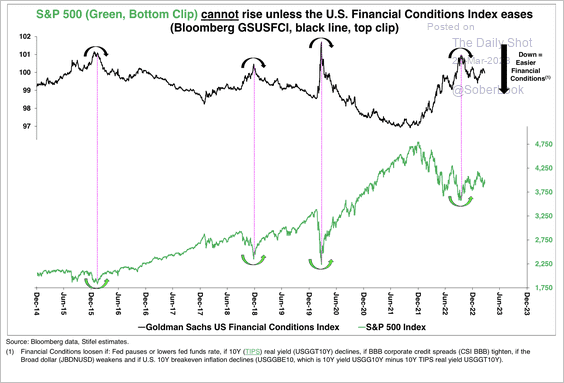
6. A sustained recovery in the S&P 500 would require an easing of financial conditions.
 Source: Stifel
Back to Index
Alternatives
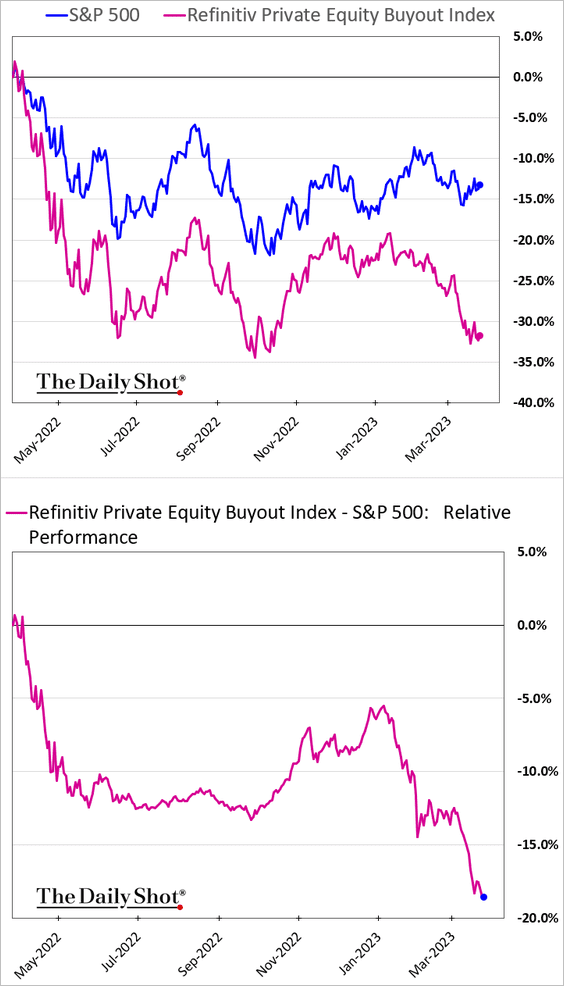
1. Buyout firms haven’t been very successful in picking industries. An index tracking buyout firms’ sector allocations has been widening its underperformance in the public market.
2. PE portfolio company bankruptcies have been elevated.
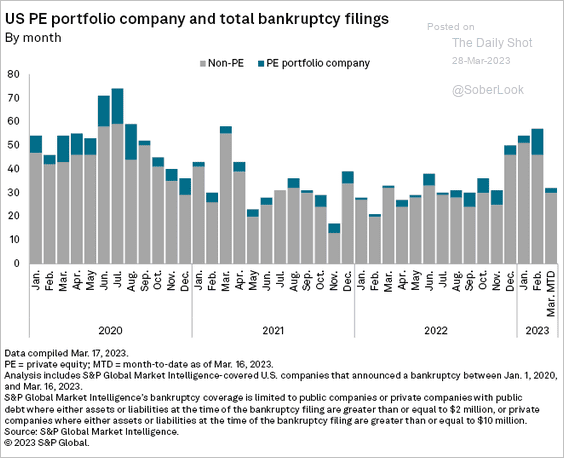 Source: S&P Global Market Intelligence
Here is the distribution by sector.
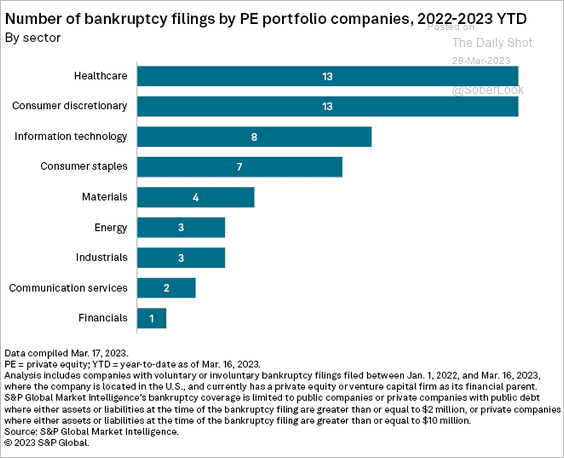 Source: S&P Global Market Intelligence
——————–
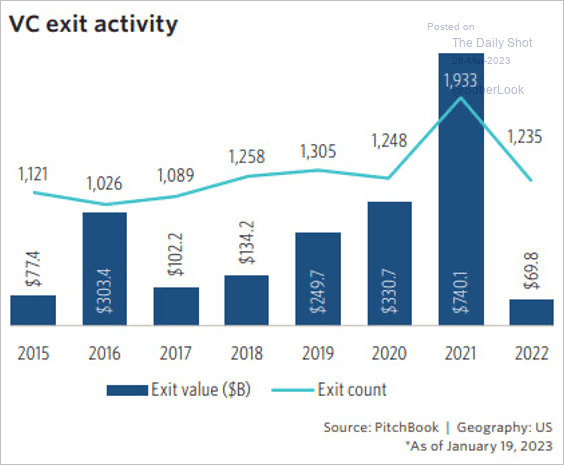
3. Over 200 venture capital startups are ready to go public but are stuck waiting for financial conditions to improve before taking the leap, according to PitchBook.
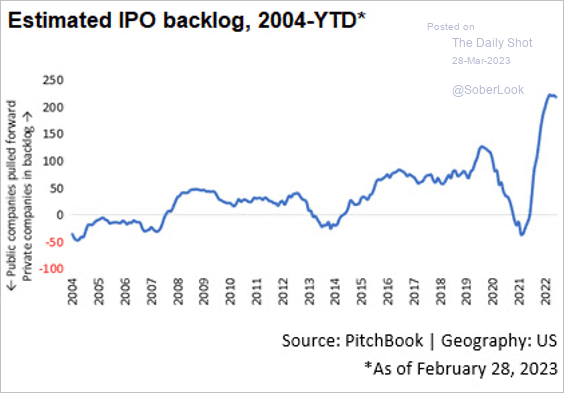 Source: PitchBook
Venture capital exit activity declined substantially last year.
 Source: PitchBook
Back to Index
Credit
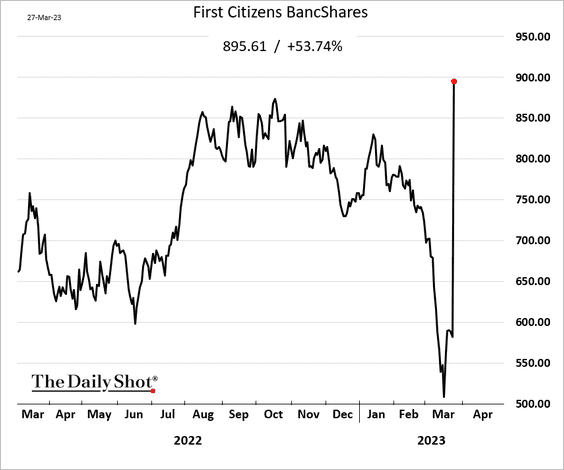
1. First Citizens got a nice deal on SVB’s assets, and the FDIC took $20 billion in losses.
 Source: @EdHammondNY, @MattMonks123, @markets Read full article
——————–
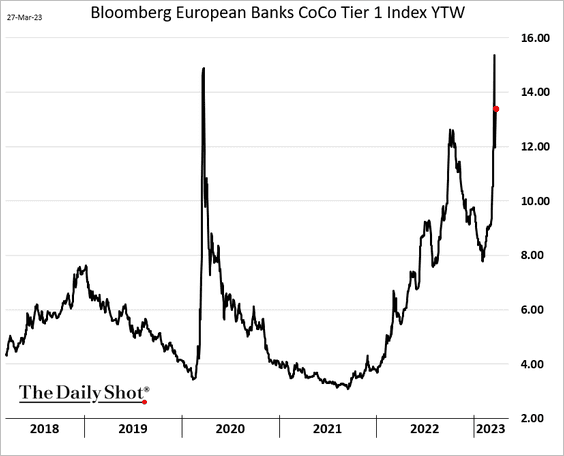
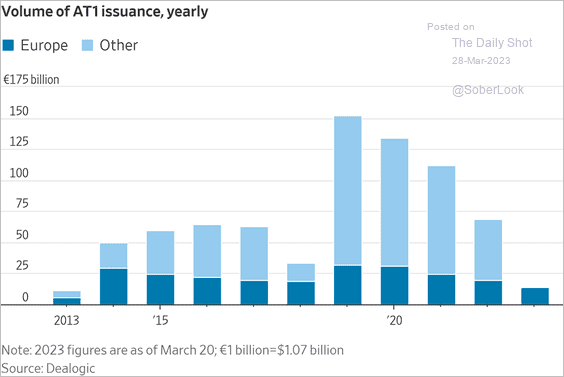
2. After the CS wipeout it will be challenging to rebuild confidence in the AT1 market. This chart shows the yield on Bloomberg’s European CoCo index.
Issuance is likely to stall.
 Source: @WSJ Read full article
——————–
3. This chart shows bank deposits as a share of GDP.
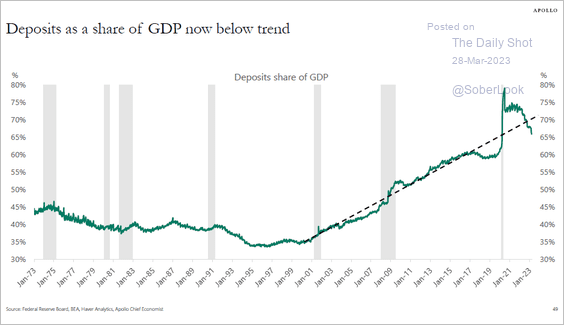 Source: Torsten Slok, Apollo
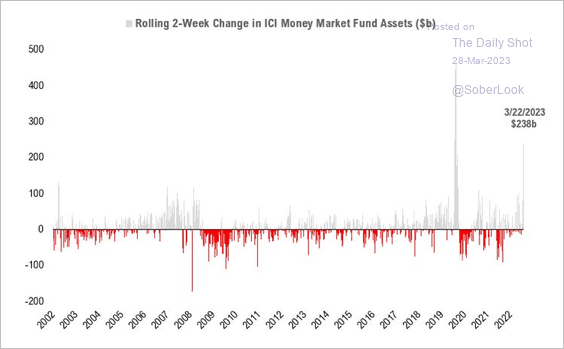
4. Money market funds’ AUM has been surging.
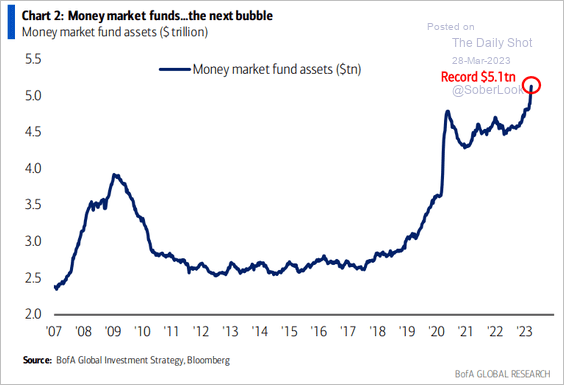 Source: BofA Global Research
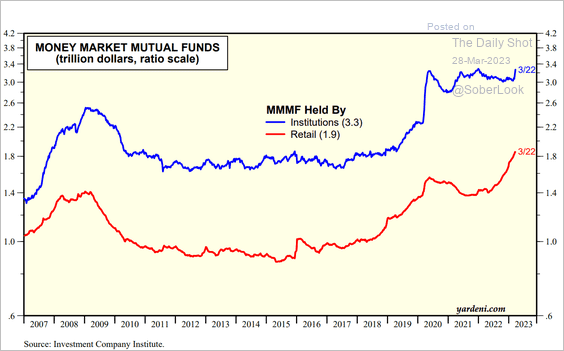 Source: Yardeni Research
Money market funds have been heavy users of the Fed’s RRP facility.
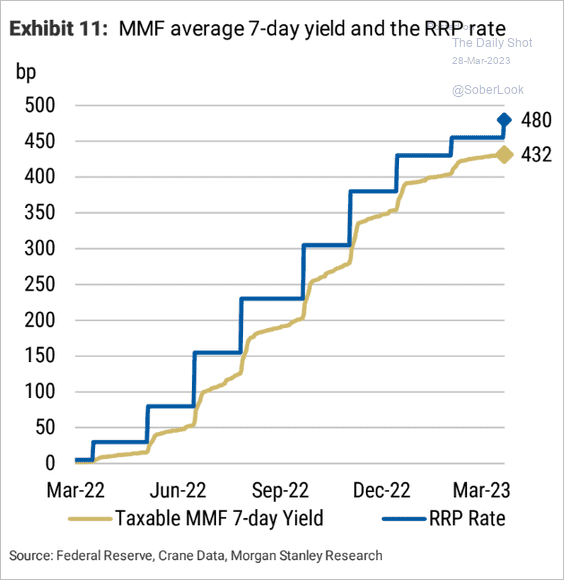 Source: Morgan Stanley Research
Back to Index
Rates
1. Japan is the largest foreign holder of Treasuries. However, Japanese holdings account for only 4.6% of the outstanding Treasury market, according to BCA Research.
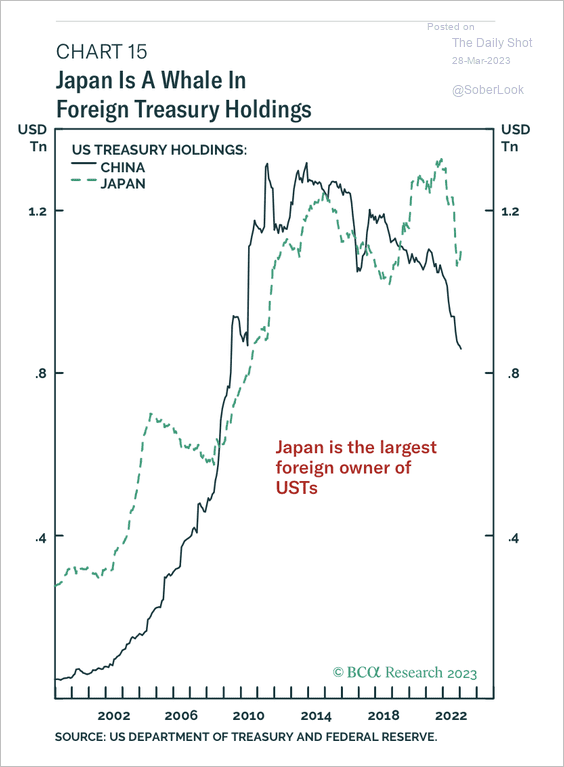 Source: BCA Research
Japan significantly offloaded Treasuries while the Fed was raising rates. Hedging Treasuries into yen has not been attractive.
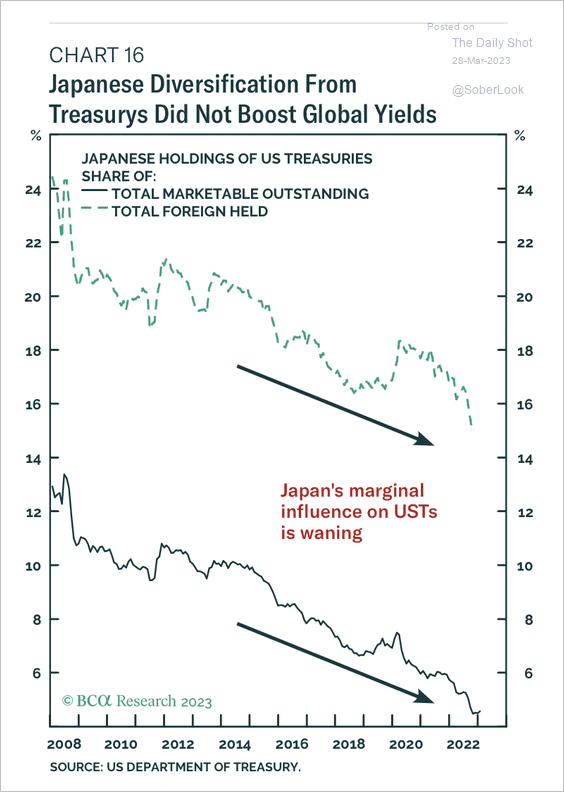 Source: BCA Research
——————–
2. More fixed-income managers are inclined to increase their portfolio duration.
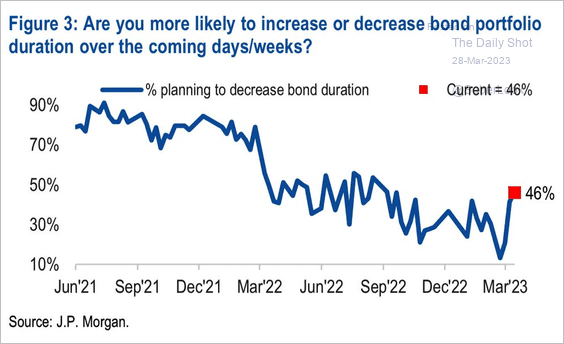 Source: JP Morgan Research; @WallStJesus
3. For the first time since 2019, the percentage of Treasury yields (1-10 years) above their 200-day moving average cycled from 100% to 0%. The abrupt trend reversal, which occurred in only one trading session, is an anomaly.
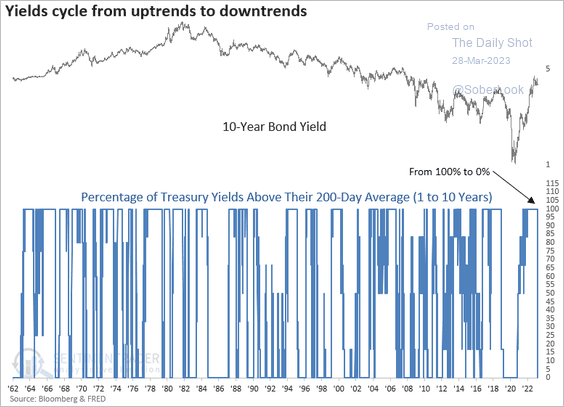 Source: SentimenTrader
4. Treasury futures liquidity has deteriorated.
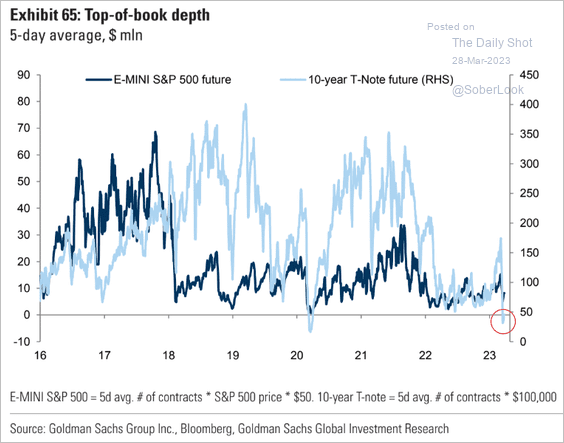 Source: Goldman Sachs; @WallStJesus
5. Treasury yields have diverged from the Citi Economic Surprise Index.
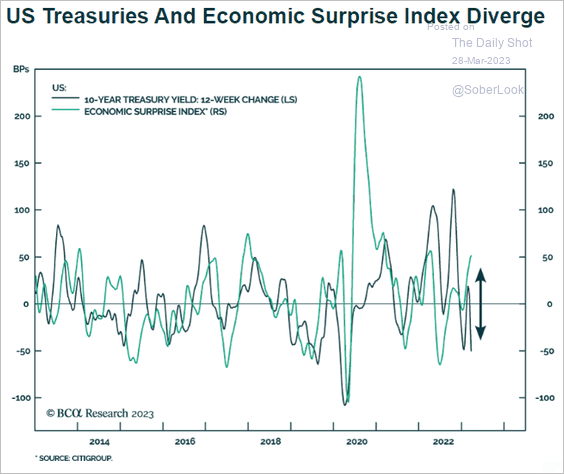 Source: BCA Research
——————–
Food for Thought
1. The shift to electric vehicles:
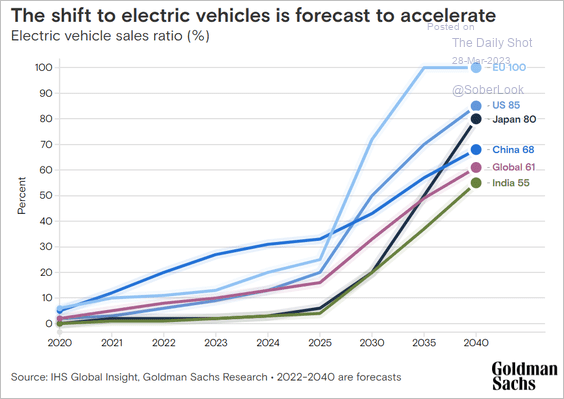 Source: Goldman Sachs
2. Views on food and the food system:
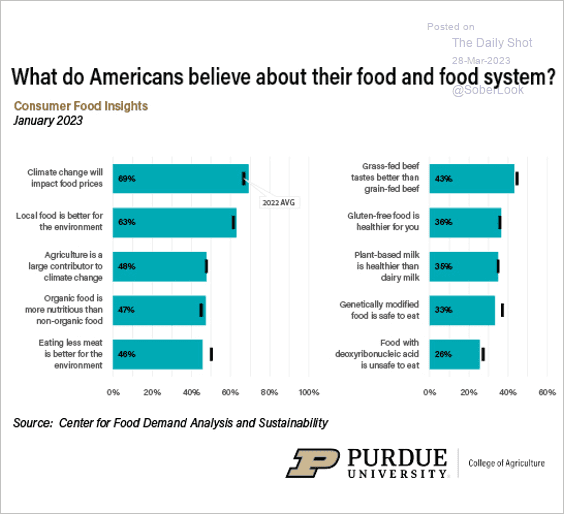 Source: Purdue University Read full article
3. The top 0.01% income share with and without capital gains:
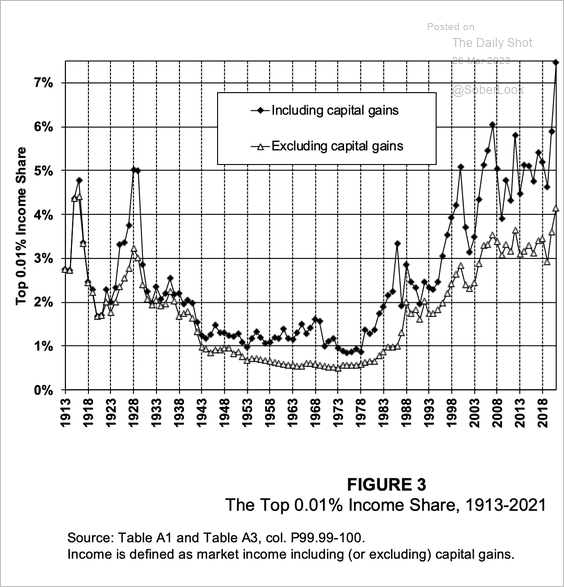 Source: @gabriel_zucman Read full article
4. The plant-based meat industry has been facing challenges.
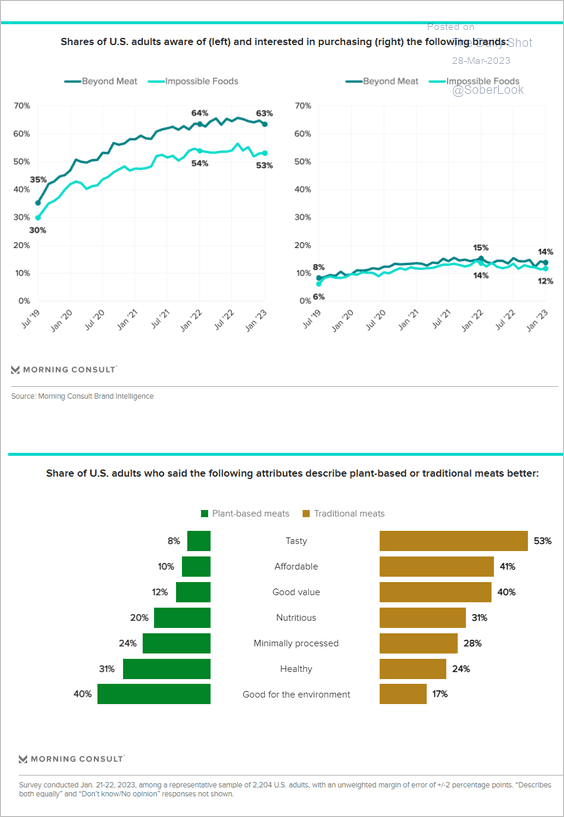 Source: Morning Consult Read full article
5. Cash holdings per capita:
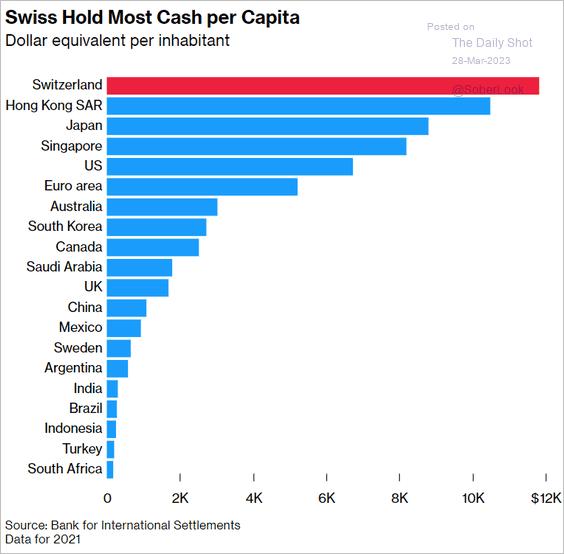 Source: @bbenrath, @bpolitics Read full article
6. Candida auris fungus infections spreading across the US (mostly in healthcare facilities):
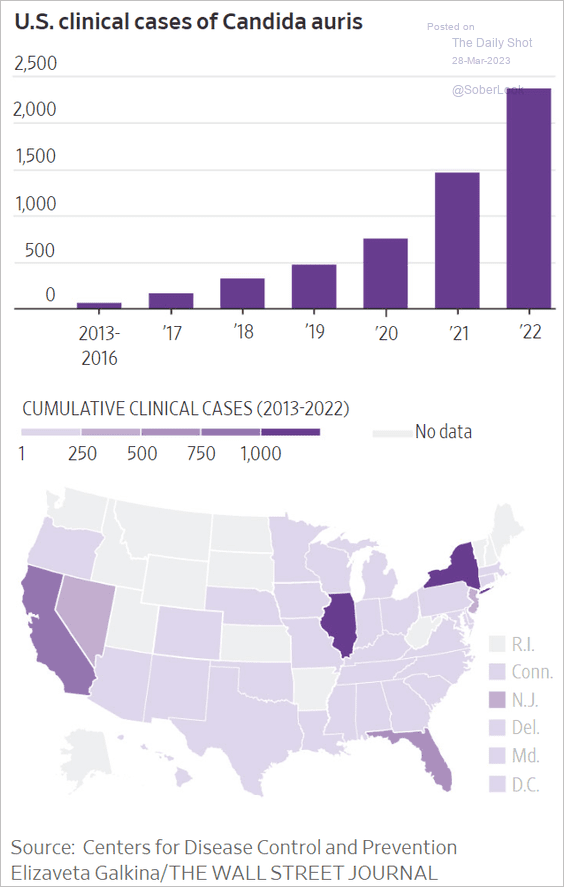 Source: @WSJ Read full article
7. The world’s oldest populations:
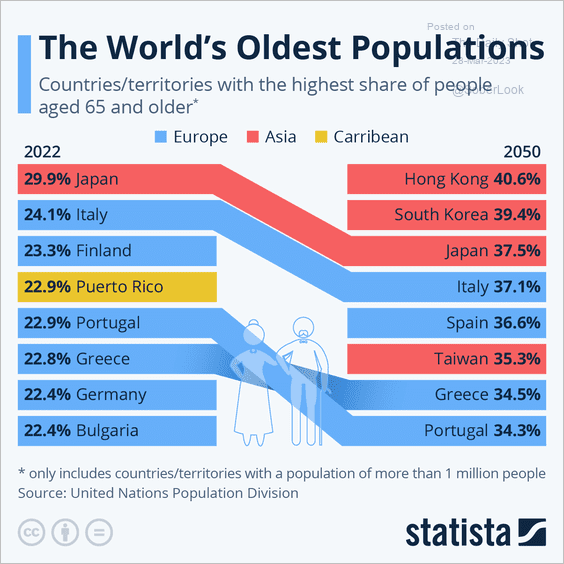 Source: Statista
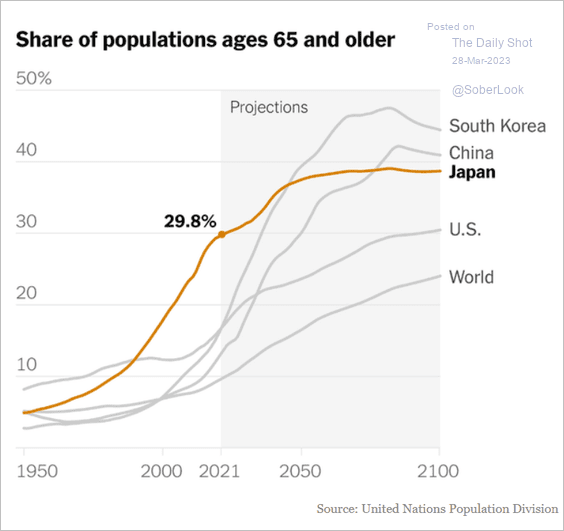 Source: The New York Times Read full article
——————–
8. Migrant fatalities at the US-Mexico border:
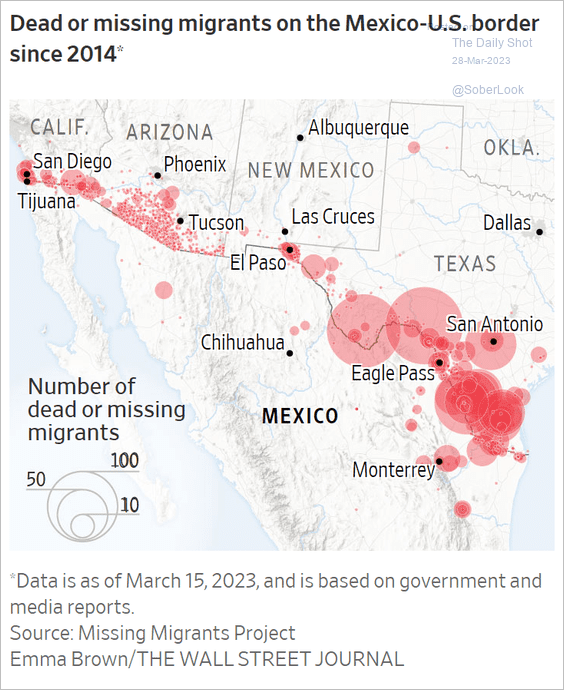 Source: @WSJ Read full article
9. How couples meet:
 Source: @chartrdaily
——————–
Back to Index