
The Daily Shot: 29-Mar-23
• The United States
• Canada
• The Eurozone
• Japan
• Asia – Pacific
• China
• Emerging Markets
• Commodities
• Energy
• Equities
• Credit
• Global Developments
• Food for Thought
The United States
1. Economists have been upgrading their growth forecasts for this year.
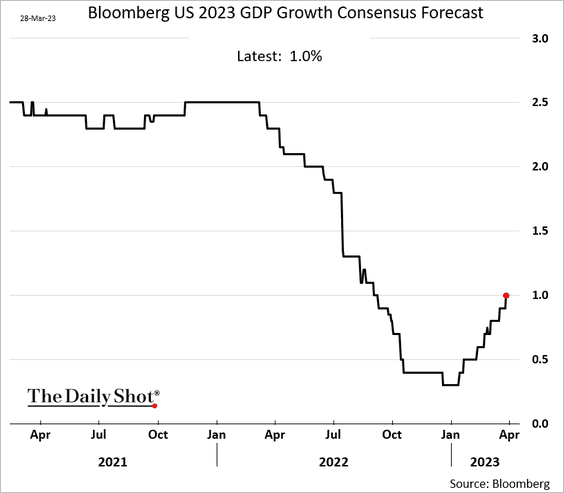
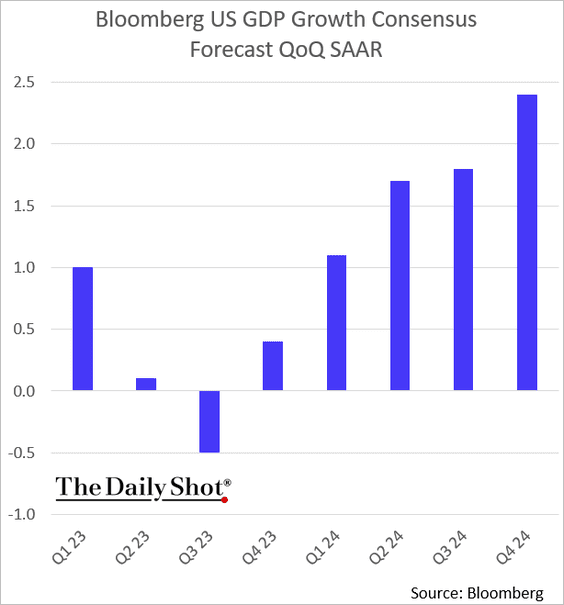
The consensus estimate shows only one down quarter.
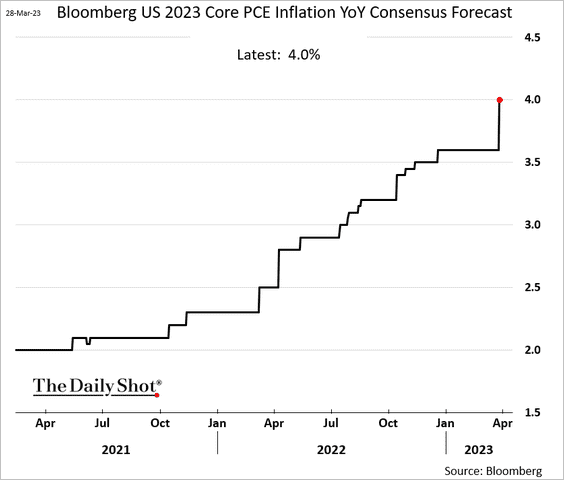
Economists also boosted their projections for US core inflation in 2023.
——————–
2. The Conference Board’s consumer sentiment index edged higher this month, topping expectations. The increase was driven by an improvement in consumer expectations.
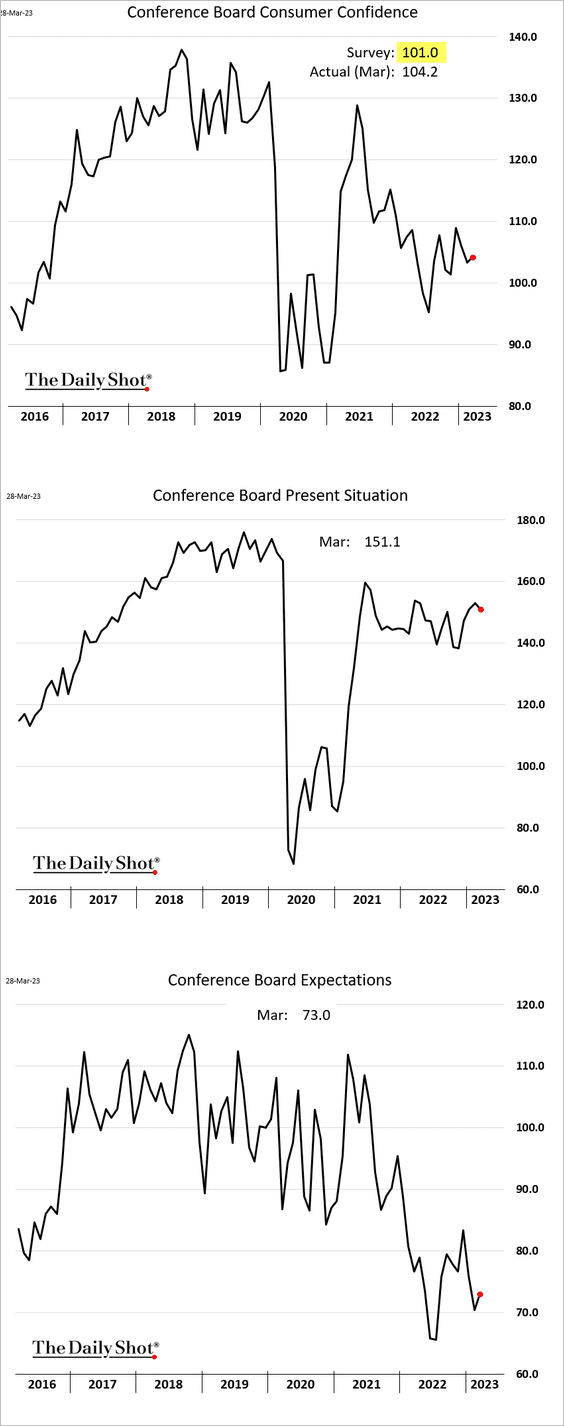
• Labor market strength continues to support sentiment, …
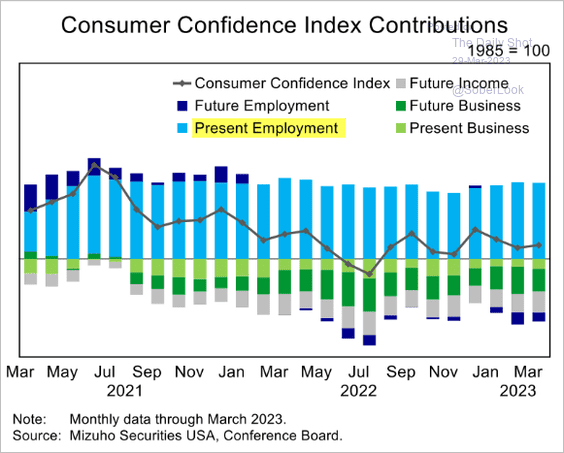 Source: Mizuho Securities USA
… causing a substantial divergence from the U. Michigan’s sentiment index.
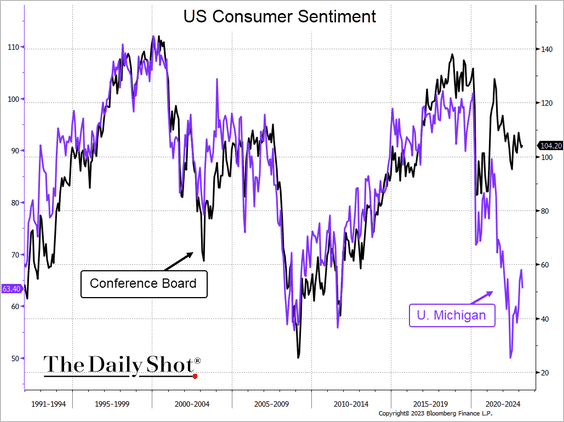 Source: @TheTerminal, Bloomberg Finance L.P.
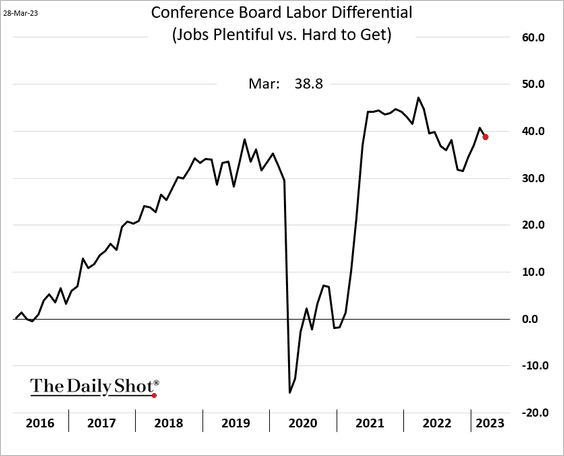
• The labor differential remains above the pre-COVID peak.
• The spread between expectations and current conditions continues to signal a recession ahead.
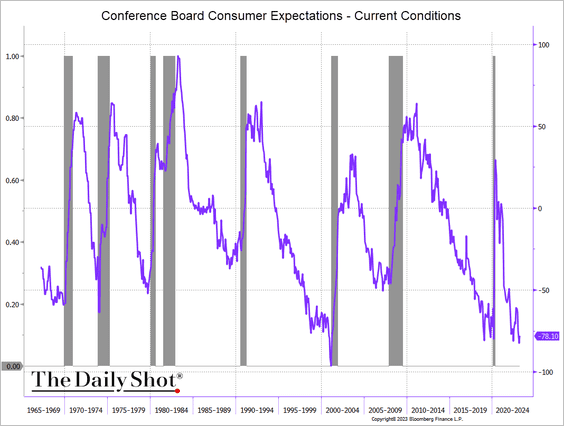 Source: @TheTerminal, Bloomberg Finance L.P.
——————–
3. Next, we have some updates on the housing market.
• Home prices declined again in January, according to the Case-Shiller index.
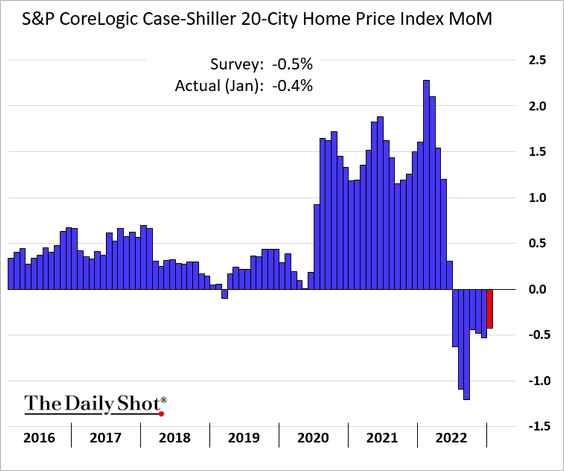
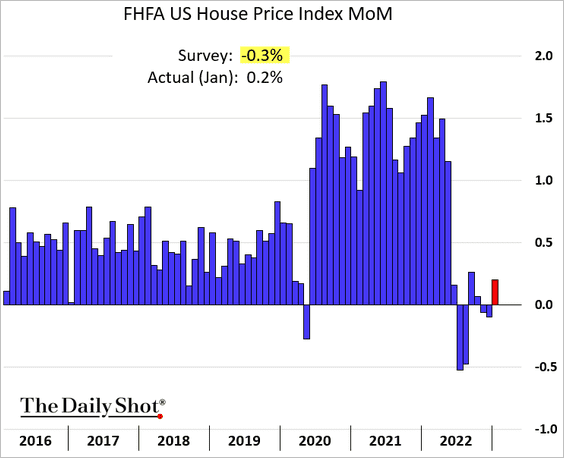
However, the FHFA’s home price index showed a gain in January.
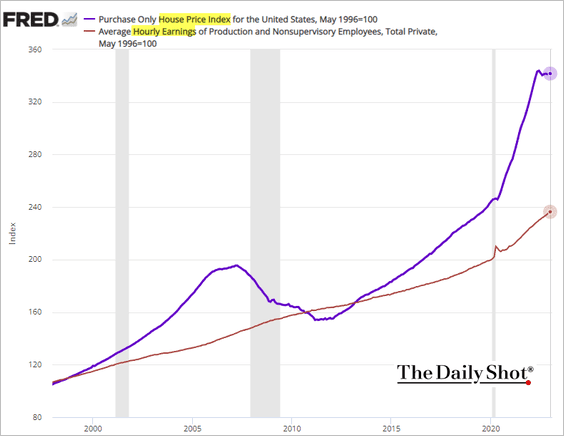
• Affordability will remain a headwind for the housing market for some time. This chart shows home prices and wages.
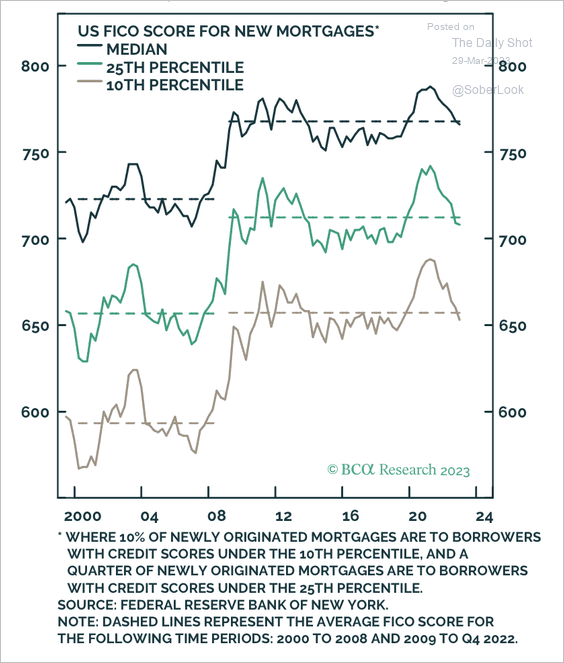
• Credit scores for residential mortgages have improved considerably since pre-financial crisis levels.
 Source: BCA Research
– Real estate loan-to-value ratios (a measure of leverage) have significantly declined over the past decade.
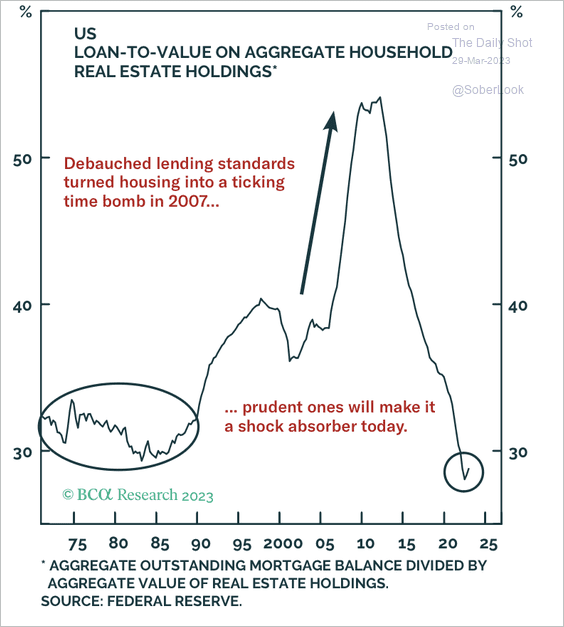 Source: BCA Research
• FHA loans have become a larger percentage of all new mortgages.
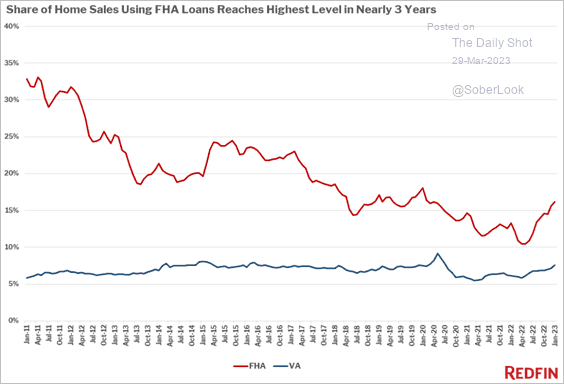 Source: Redfin
• Investors are bearish on real estate.
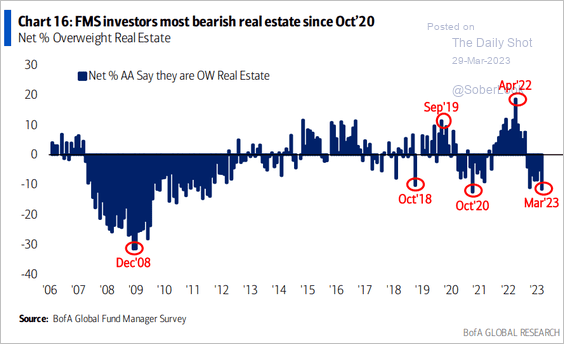 Source: BofA Global Research
——————–
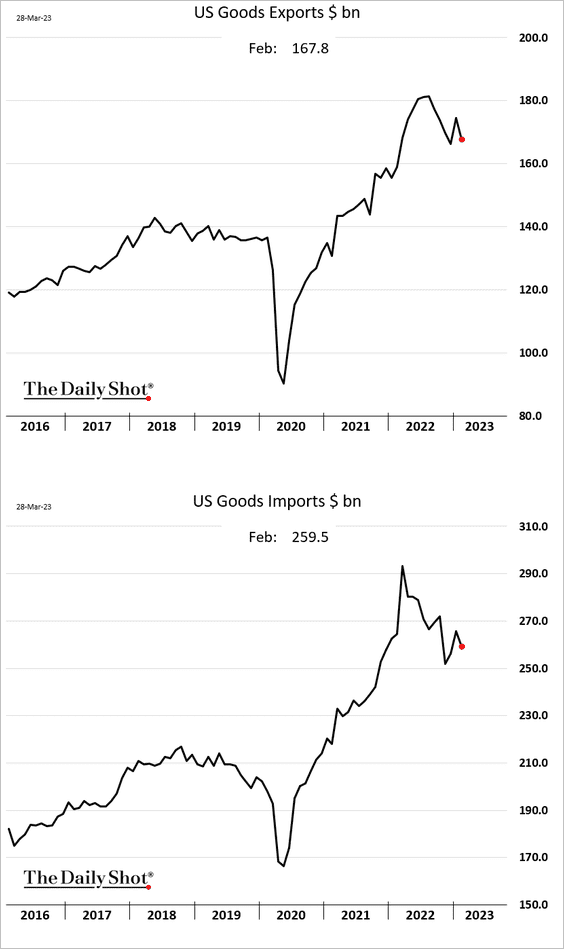
4. The trade balance in goods widened last month.
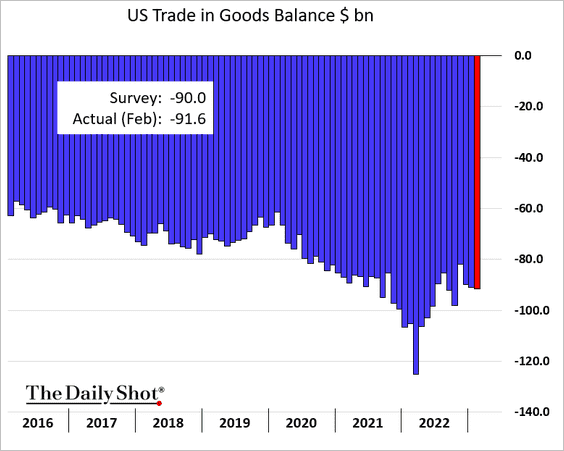
Both imports and exports declined.
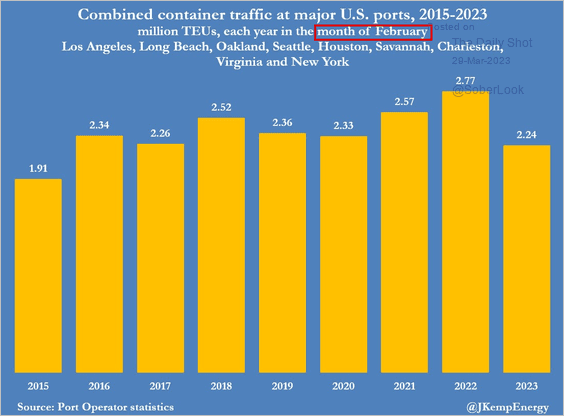
This chart shows US container traffic in February of each year.
 Source: @JKempEnergy
——————–
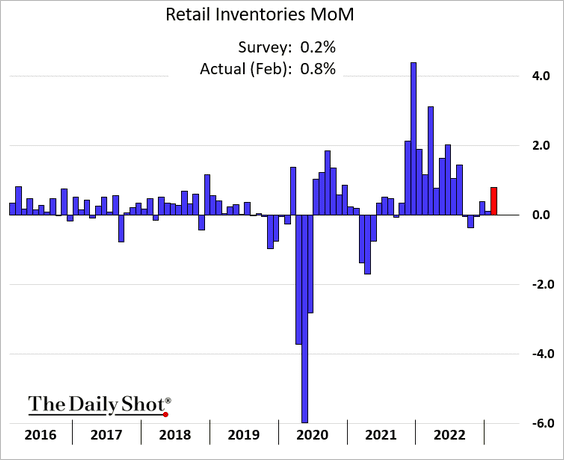
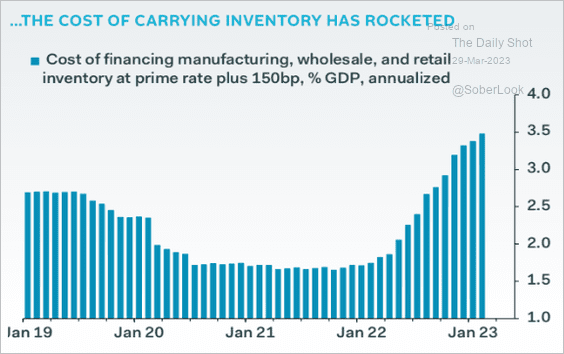
5. Retail inventories jumped last month.
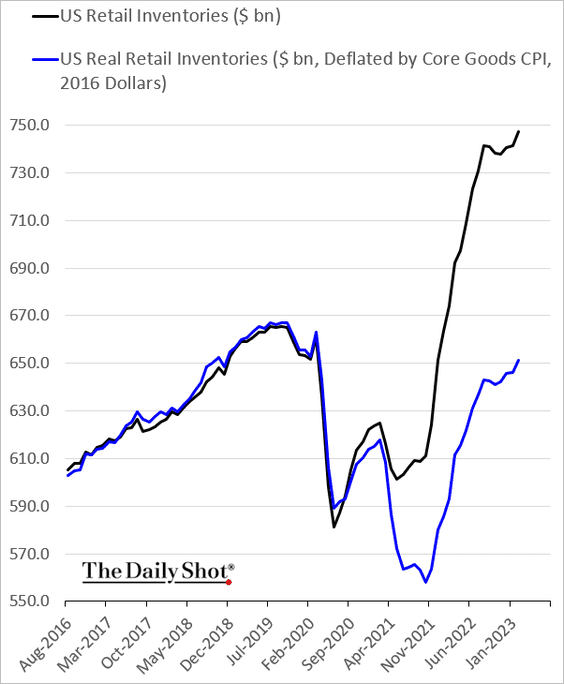
• This chart shows real retail inventories.
• The cost to carry inventories has surged over the past 12 months.
 Source: Pantheon Macroeconomics
——————–
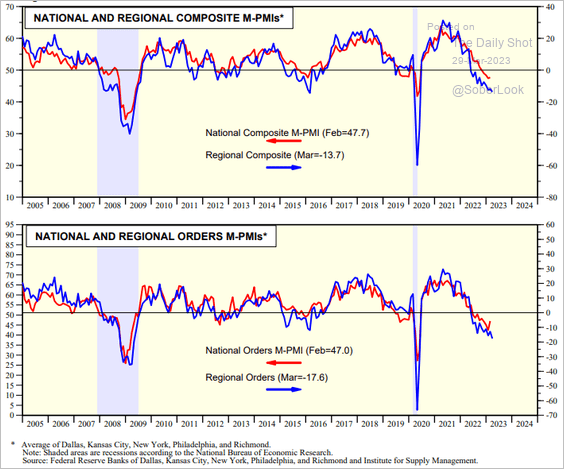
6. Regional Fed surveys point to a worsening manufacturing contraction at the national level (ISM PMI).
 Source: Yardeni Research
Back to Index
Canada
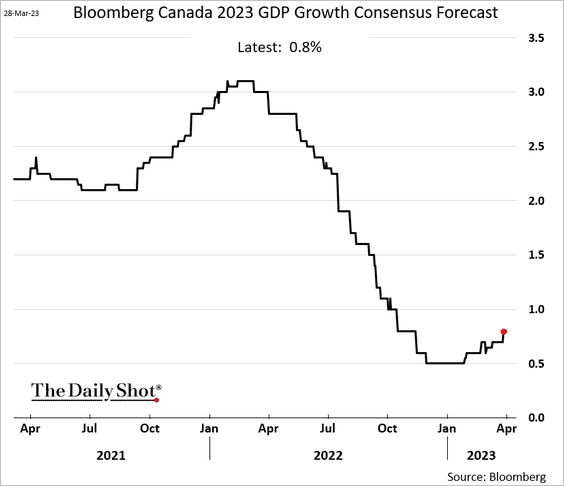
1. 2023 GDP projections have been moving higher.
2. The latest budget points to deeper deficits ahead.
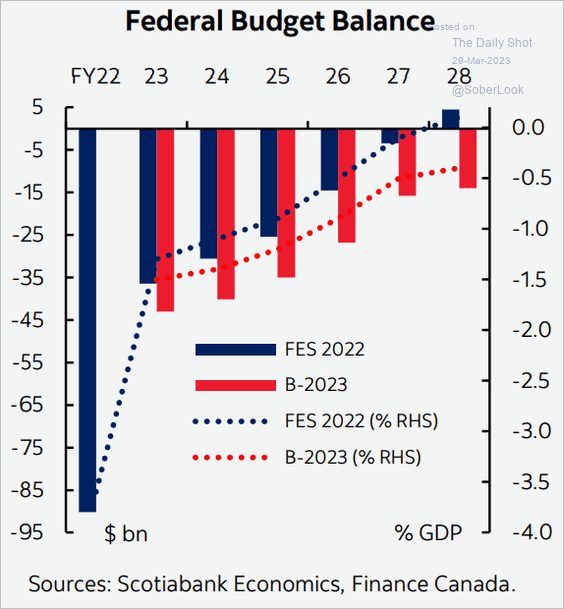 Source: Scotiabank Economics
3. The TSX Venture Composite (microcaps) closed above its 200-day moving average, both on an absolute and relative basis.
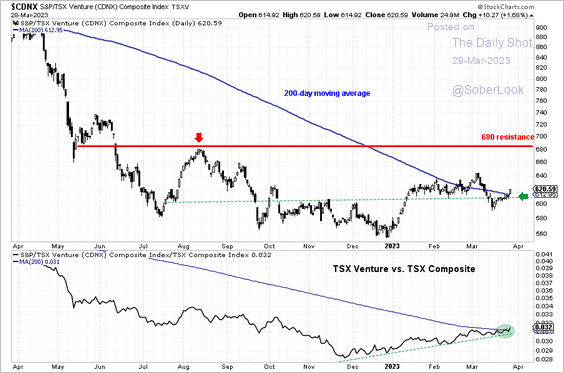 Source: Aazan Habib, Paradigm Capital
Back to Index
The Eurozone
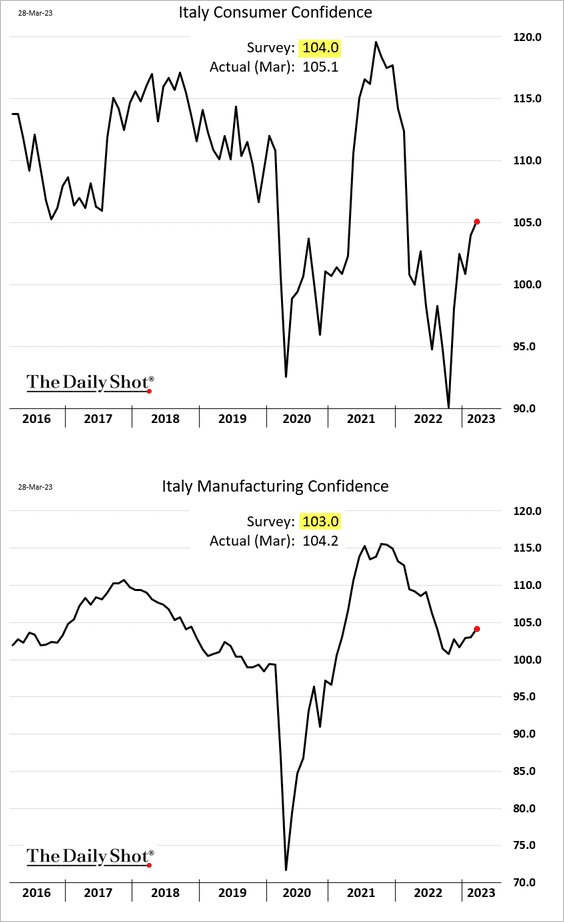
1. Italian consumer and manufacturing sentiment continues to improve, topping expectations.
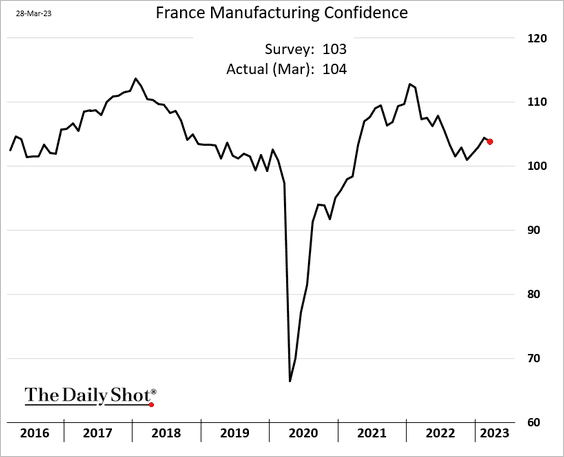
2. French manufacturing confidence edged lower this month.
3. Selling price expectations point to a rapid decline in Germany’s CPI.
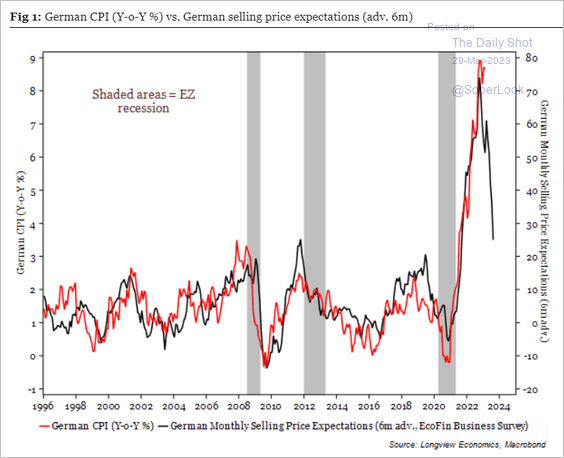 Source: Longview Economics
4. The latest PMI indicators suggest that the Eurozone will avoid a recession.
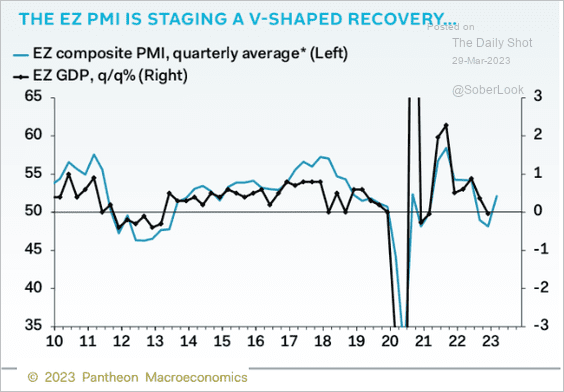 Source: Pantheon Macroeconomics
Back to Index
Japan
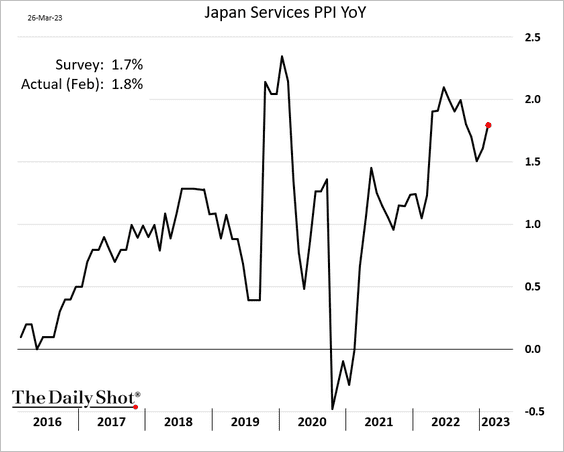
1. Last month’s services PPI topped expectations.
2. The yen has been a popular safe-haven play amid banking turmoil.
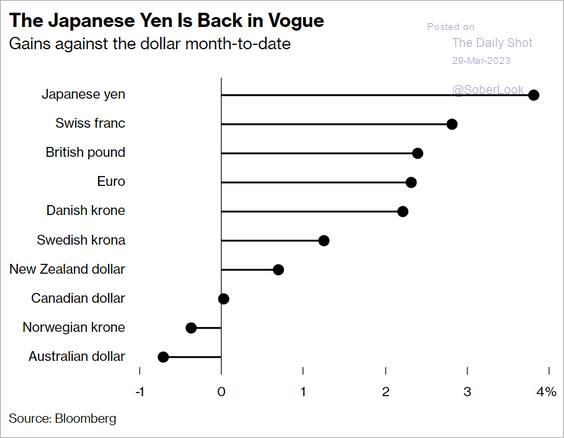 Source: @eva_szalay, @LibbyCherry98, @markets Read full article
3. Japan’s falling birth rate is becoming a pressing problem.
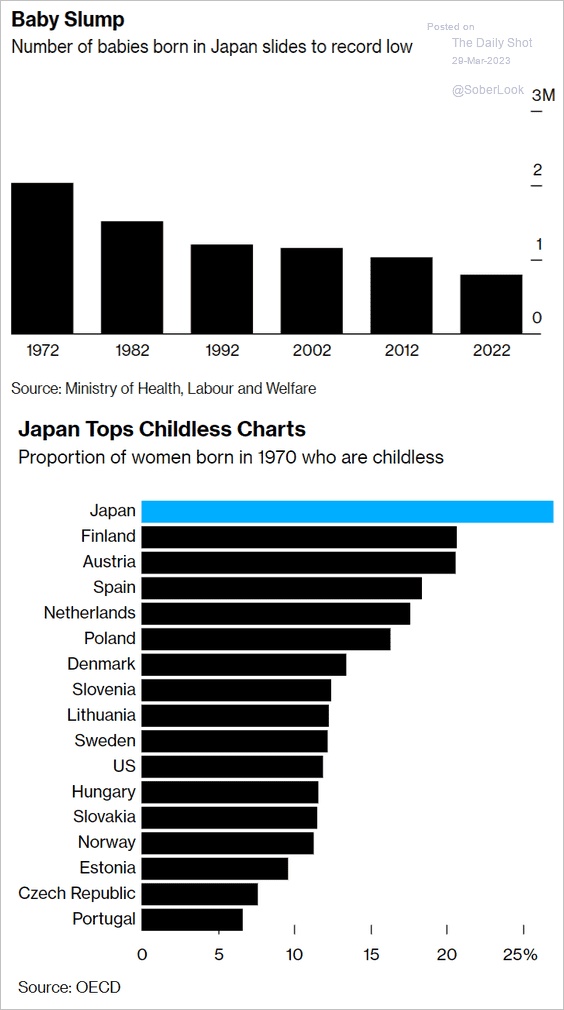 Source: @IsabelRTokyo, @MarikaKatanuma, @bpolitics Read full article
Back to Index
Asia – Pacific
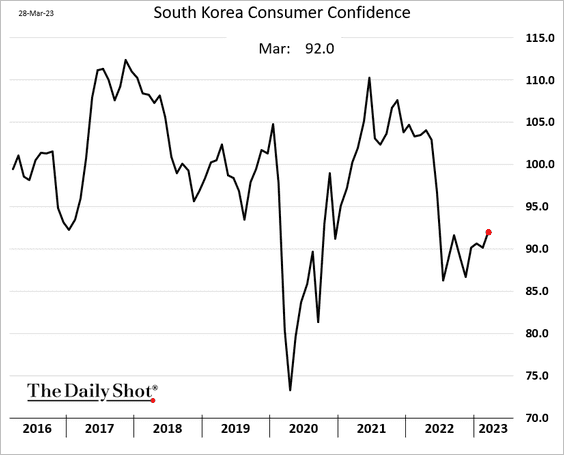
1. South Korea’s consumer confidence improved this month.
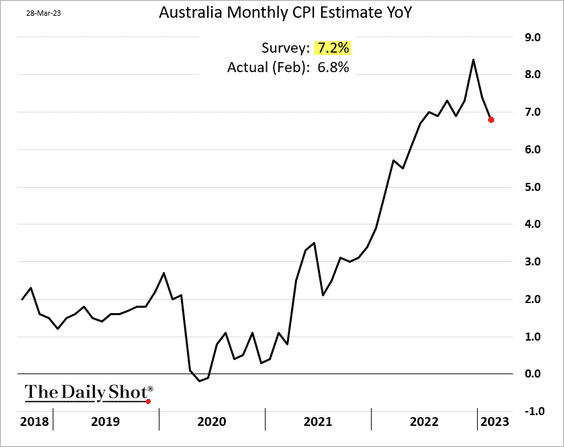
2. Australia’s monthly CPI surprised to the downside.
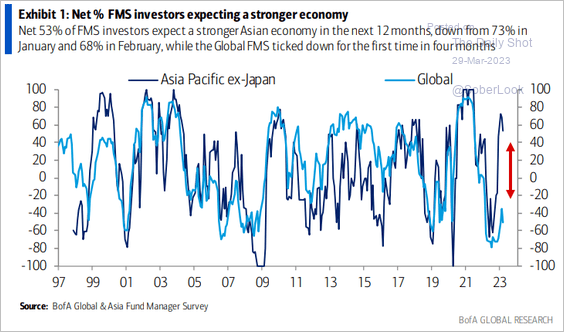
3. Most investors expect a stronger economy in the Asia-Pacific region.
 Source: BofA Global Research
Back to Index
China
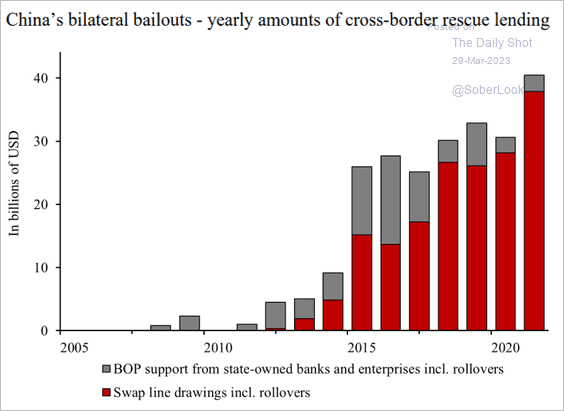
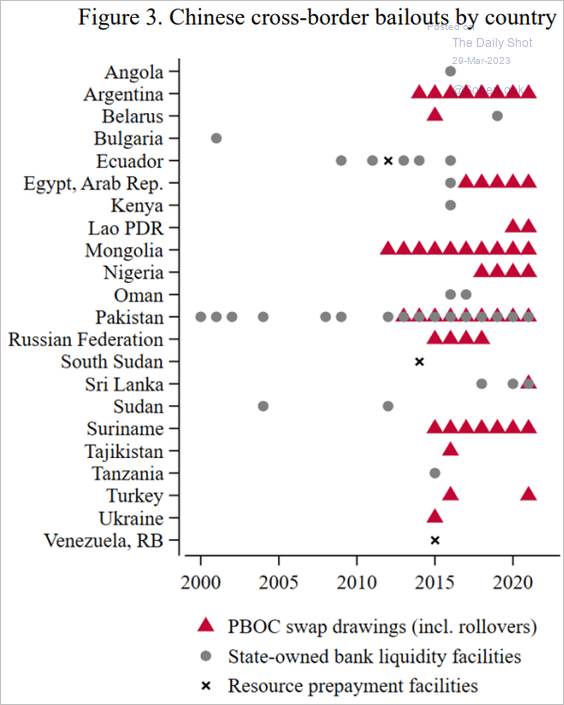
1. China has been bailing out many countries that got financing from the nation years earlier.
 Source: AIDDATA
 Source: AIDDATA
China’s loans are not cheap.
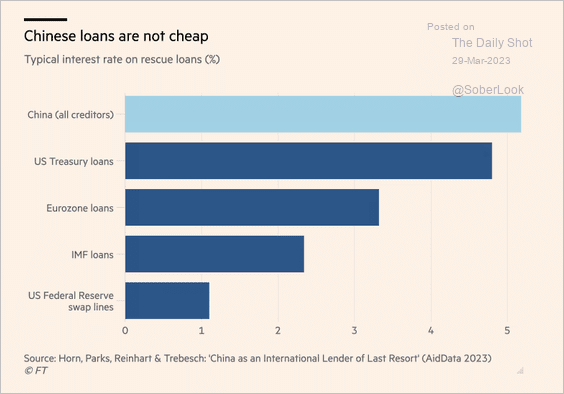 Source: @financialtimes Read full article
——————–
2. Coal imports surged in the first two months of the year.
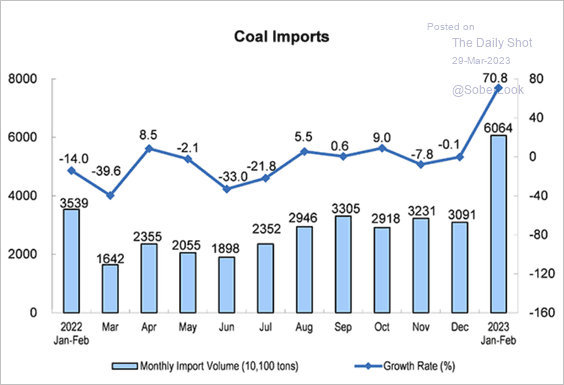 Source: National Bureau of Statistics of China
3. This chart shows US VC investment in China.
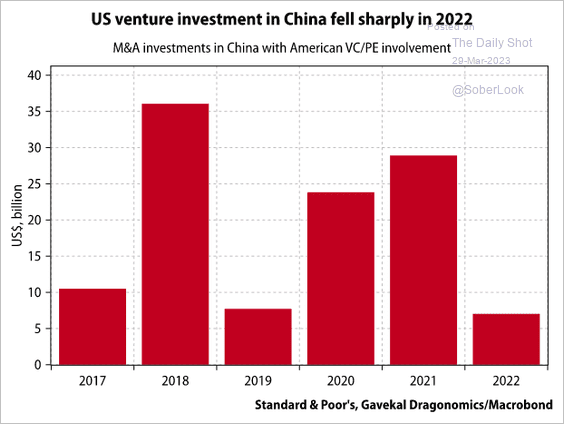 Source: Gavekal Research
Back to Index
Emerging Markets
1. India’s Adani shares remain under pressure.
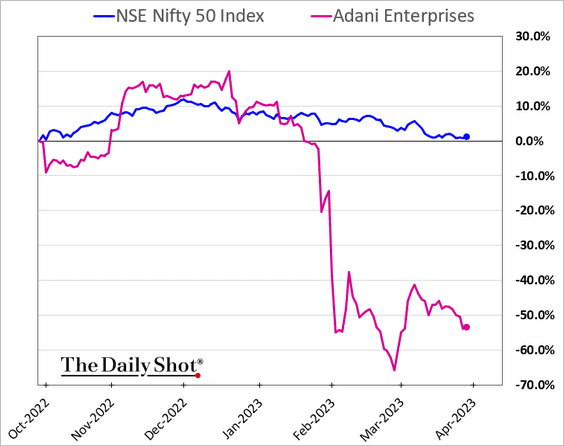
 Source: @Chiranjivi_25, @ashutoshasj, @markets Read full article
——————–
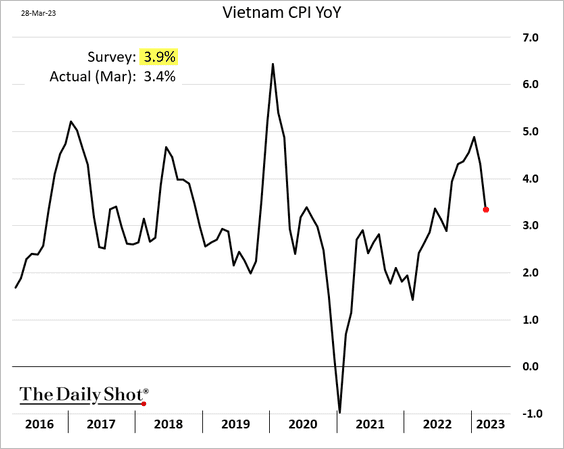
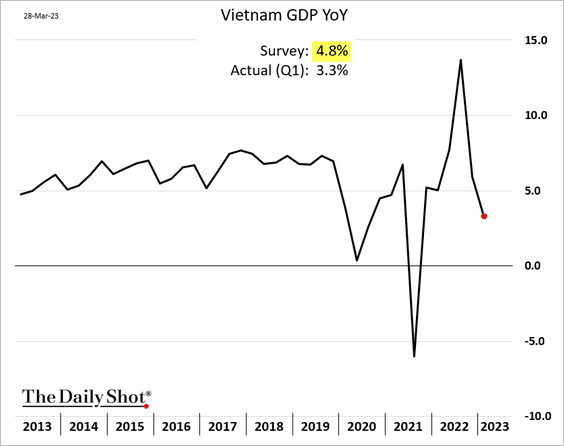
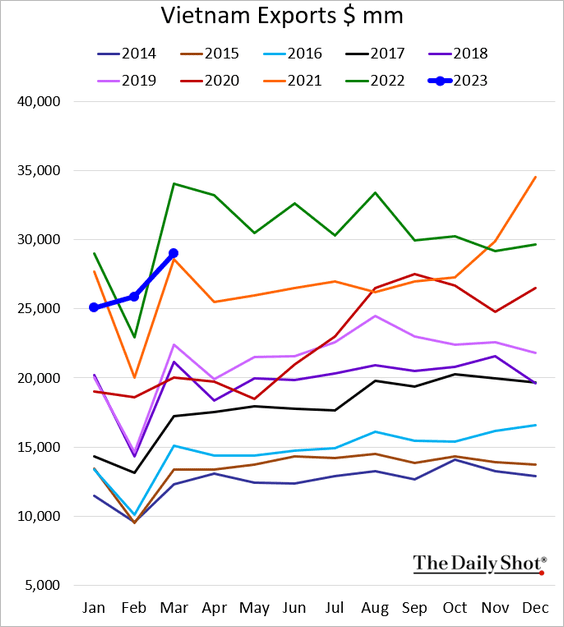
2. Next, we have some updates on Vietnam.
• CPI (below forecasts):
• GDP (also below forecasts):
• Exports (well below last year’s levels):
• The trade balance (shrinking surplus):

——————–
3. Market signals rate hikes in Turkey after the upcoming election.
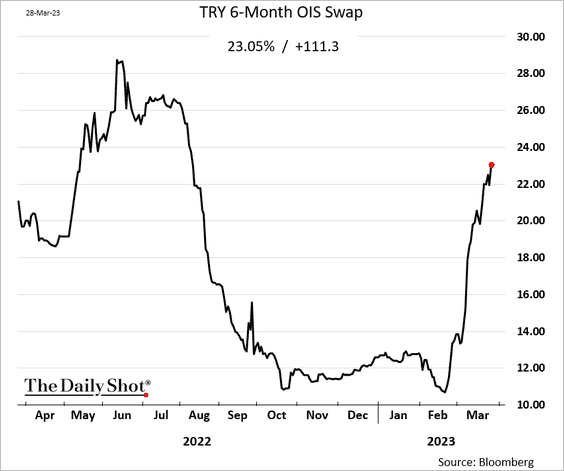 h/t @Daphniful
Back to Index
Commodities
1. Soybean futures are rebounding.
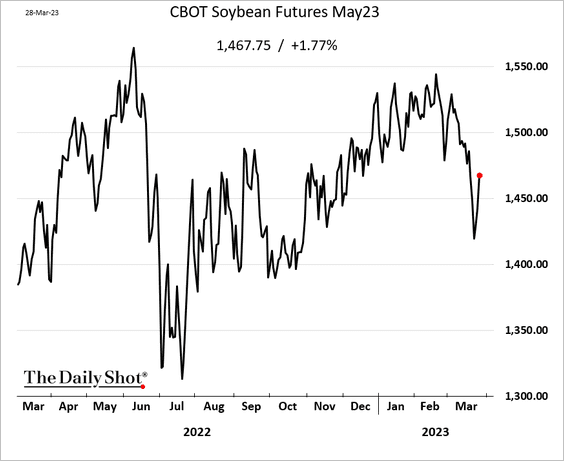
 Source: barchart.com Read full article
——————–
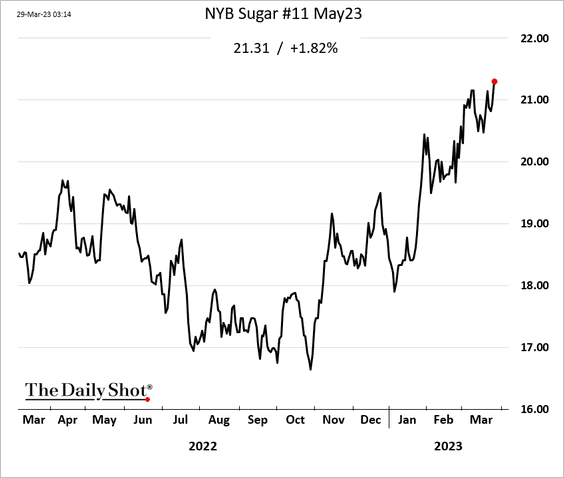
2. Sugar futures have been rallying.
3. Copper inventories are projected to shrink further this year.
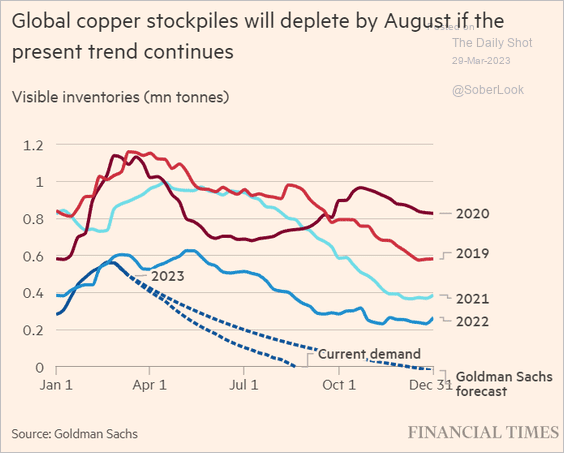 Source: @financialtimes Read full article
Back to Index
Energy
1. US natural gas futures are testing support at $2/mmbtu.
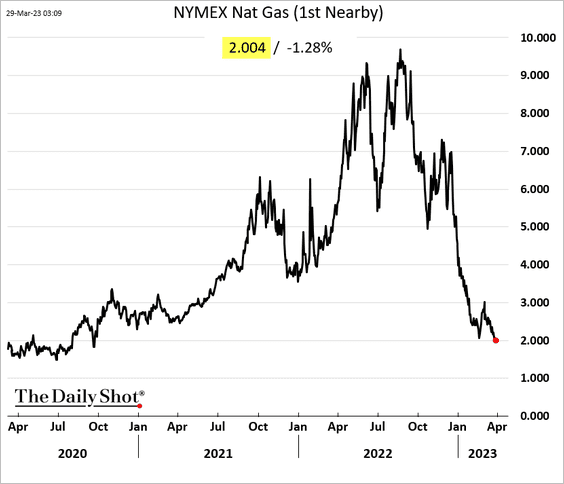
 Source: NGI Read full article
——————–
2. Russian crude oil exports surged this month.
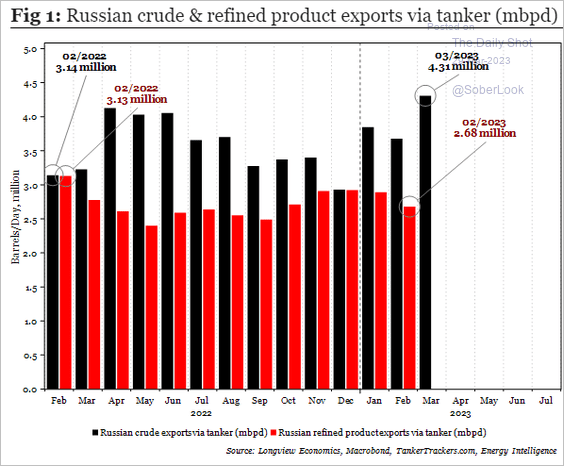 Source: Longview Economics
Will production return to pre-war levels later this year?
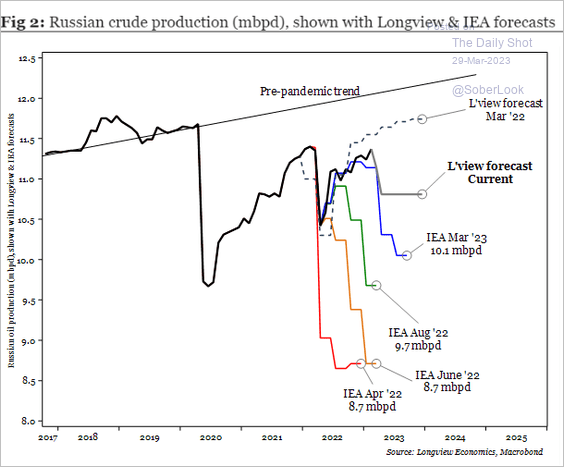 Source: Longview Economics
——————–
3. US power generation using renewables has exceeded coal.
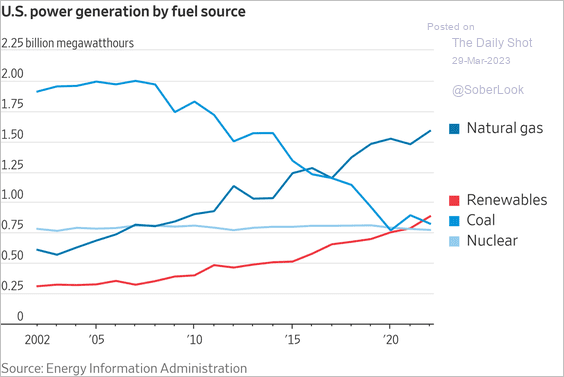 Source: @WSJ Read full article
4. This chart shows US wind capacity additions.
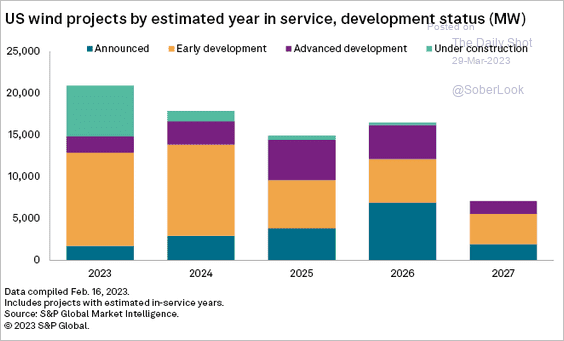 Source: S&P Global Market Intelligence
Back to Index
Equities
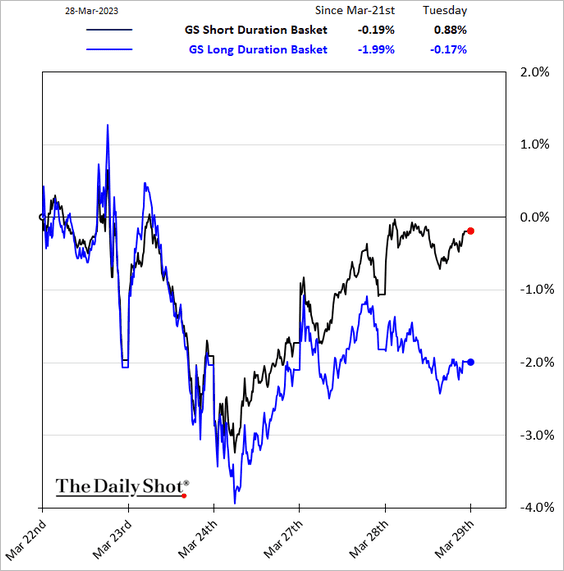
1. Long-duration stocks underperformed on Tuesday.
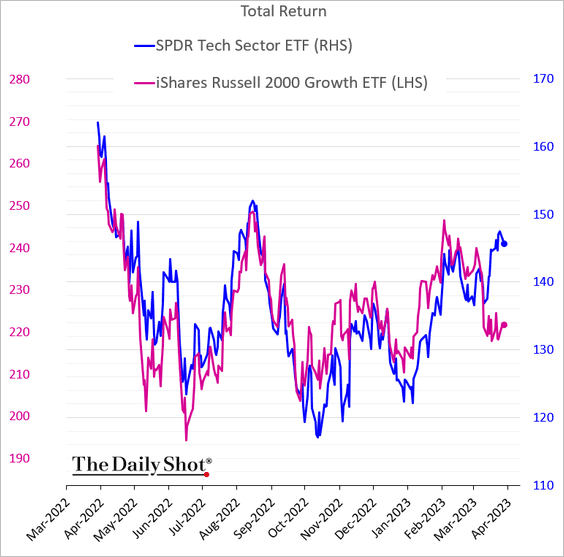
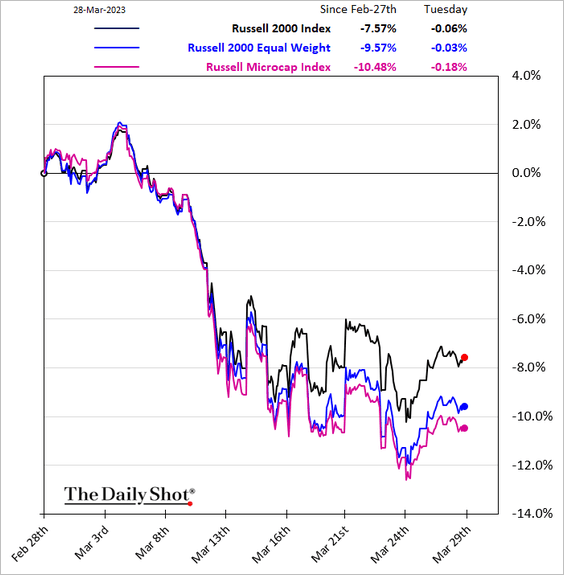
2. Here are some updates on small caps.
• Small-cap growth vs. large-cap tech:
• The smallest small caps lagging:
• Small-cap value forward PE ratio (very cheap due to small banks):
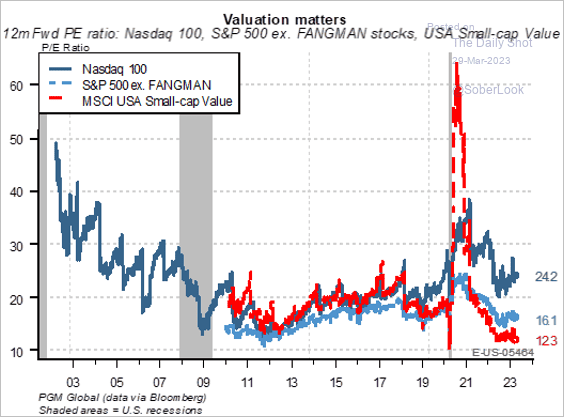 Source: PGM Global
——————–
3. S&P 500 dividend-paying stocks have outperformed non-dividend payers over the long term with less volatility.
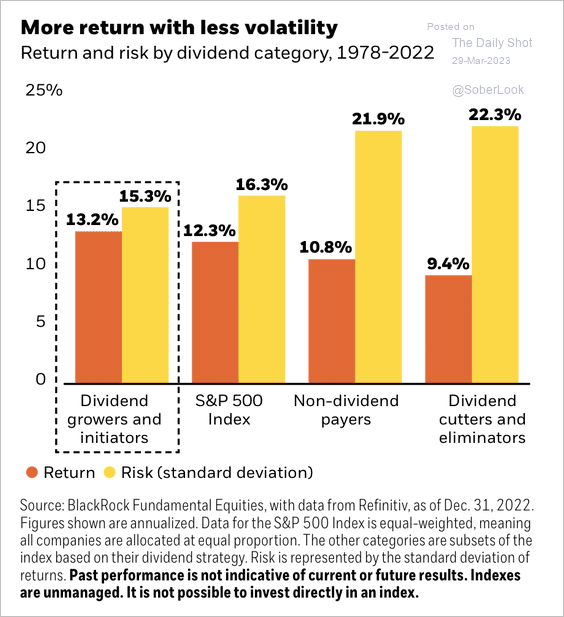 Source: BlackRock Investment Institute
4. Cyclical growth stocks have been outperforming cyclical value stocks, consistent with a disinflationary environment.
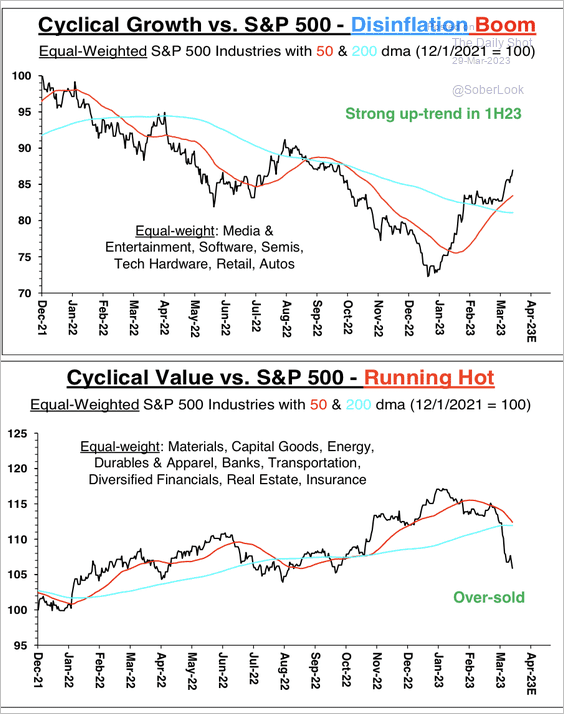 Source: Stifel
5. How does the market perform around Fed pivots?
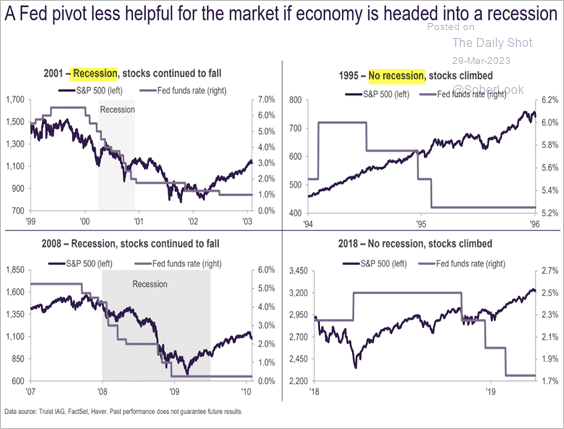 Source: Truist Advisory Services
• Quality stocks tend to outperform after the Fed hiking cycle ends. This is typical during the onset of a recession, but quality underperforms during the recovery stage.
 Source: BlackRock Investment Institute
6. After hard landings, US stocks have tended to rebound with real wages.
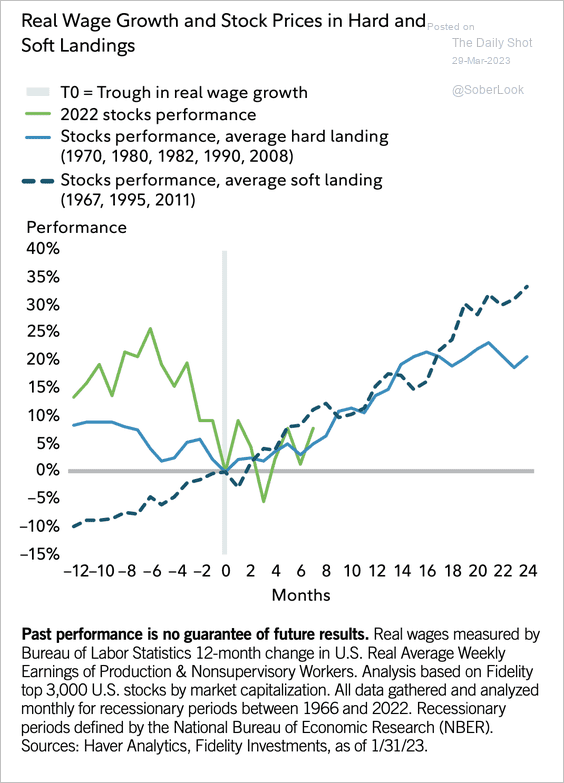 Source: Denise Chisholm, Fidelity Investments Read full article
And stocks usually have recovered well before real GDP growth.
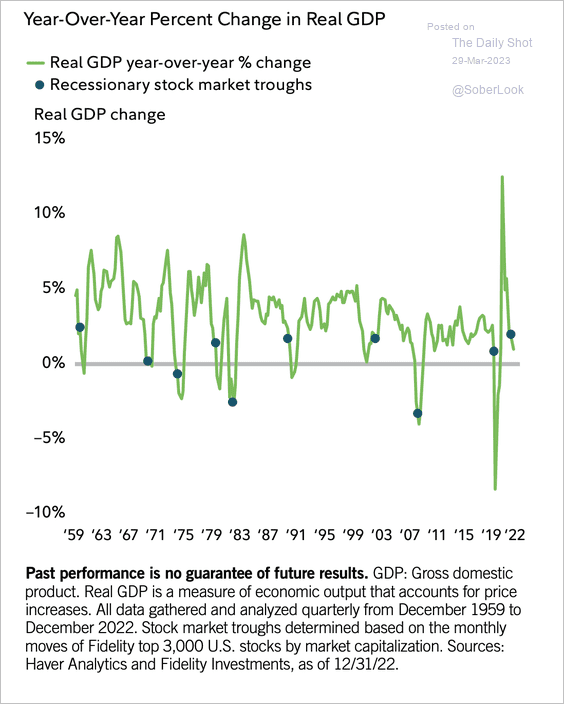 Source: Denise Chisholm, Fidelity Investments Read full article
7. This scatterplot shows cyclical vs. systemic recession-related drawdowns.
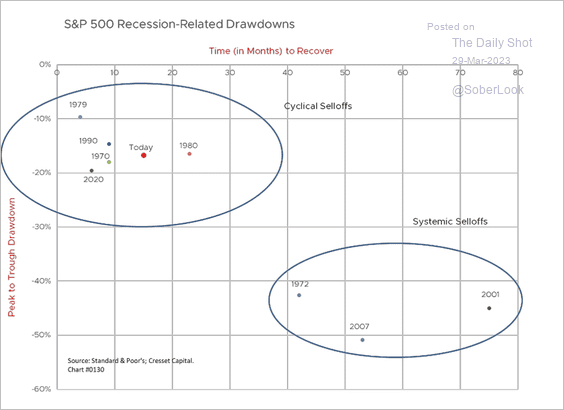 Source: Jack Ablin, Cresset Wealth Advisors
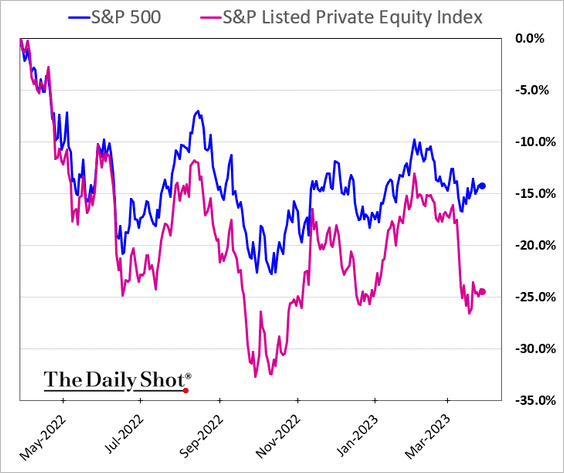
8. Listed private equity firms underperformed sharply this month.
Back to Index
Credit
1. Investors remain nervous about European banks.
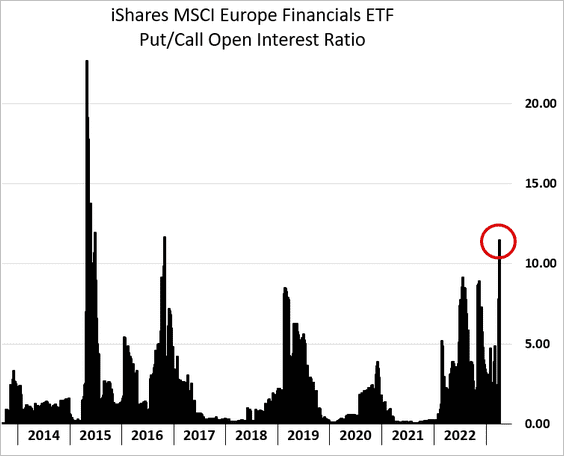 h/t @peytonforte
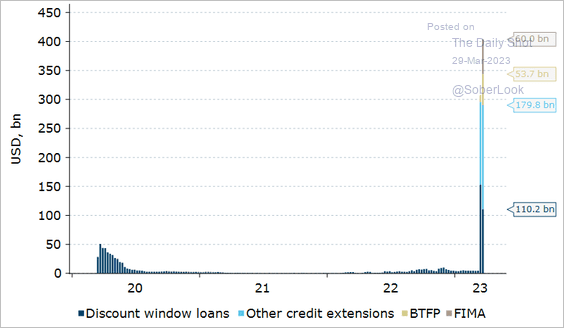
2. This chart shows the Fed’s total emergency loan measures.
ANZ Research: – There was an additional USD41.7bn borrowed out of the Bank Term Funding Program (BTFP) and USD37.0bn by the newly created FDIC banks. The Fed’s pandemic-established Foreign and International Monetary Authorities (FIMA) repurchase agreement facility was tapped for USD60bn, possibly by the Swiss National Bank. Lending out of the Fed’s discount window fell by USD42.6bn to around USD110bn. That facility is more expensive for banks than the BTFB as the securities used as collateral are valued at fair value relative to the latter which are valued at par.
 Source: @ANZ_Research
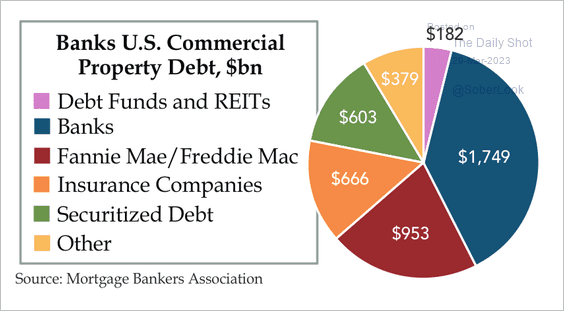
3. Banks account for a large share of commercial property debt.
 Source: Quill Intelligence
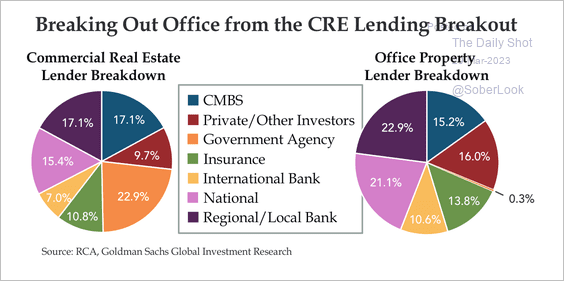
• Banks also have large exposure to the office sector.
 Source: Quill Intelligence
• The charts below show office vacancy rates as well as office space additions and absorptions.
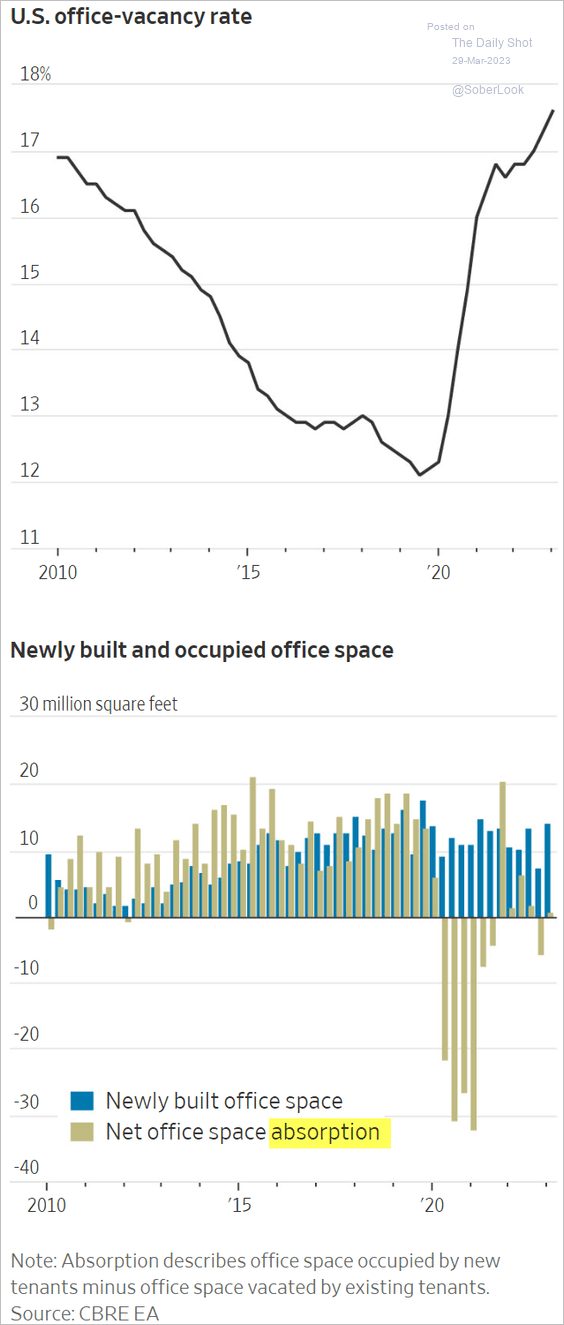 Source: @WSJ Read full article
——————–
4. It’s important to note that the US credit crunch started before the banking turmoil.
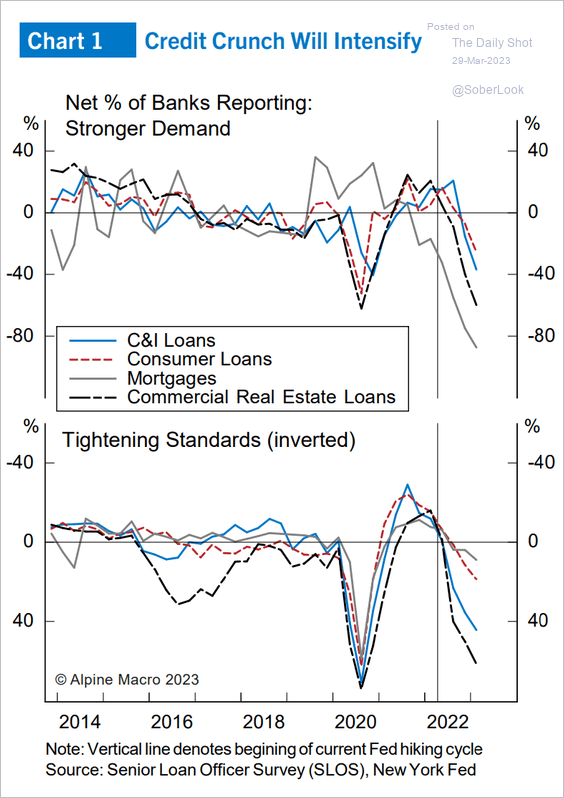 Source: Alpine Macro
Back to Index
Global Developments
1. The massive negative spread between “risky” and “safe” asset flows was caused by the banking turmoil.
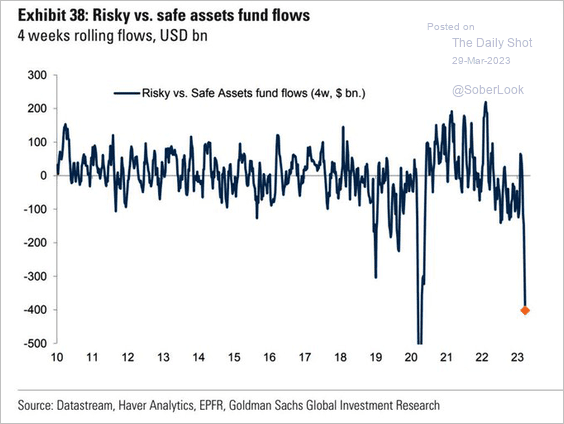 Source: Goldman Sachs; @WallStJesus
2. Risk assets are expensive, according to Oxford Economics.
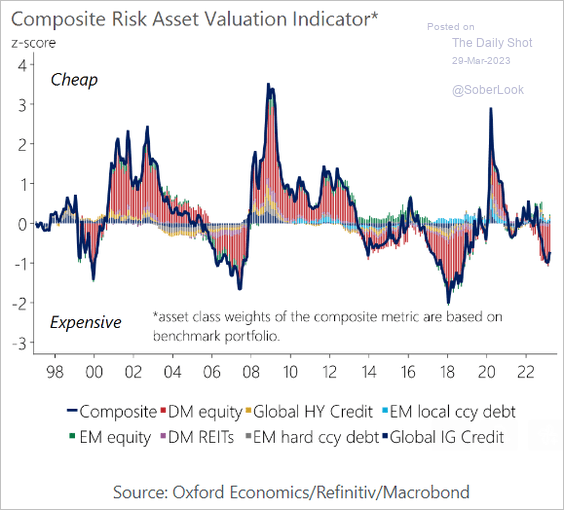 Source: Oxford Economics
3. Increasingly inverted US near-term forward spread (reflecting expectations for Fed rate cuts), has weighed on the dollar, …
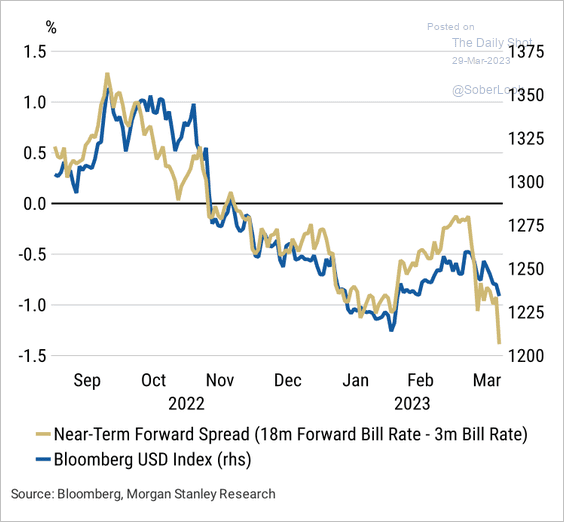 Source: Morgan Stanley Research
… especially as yield differentials move away from US’ favor.
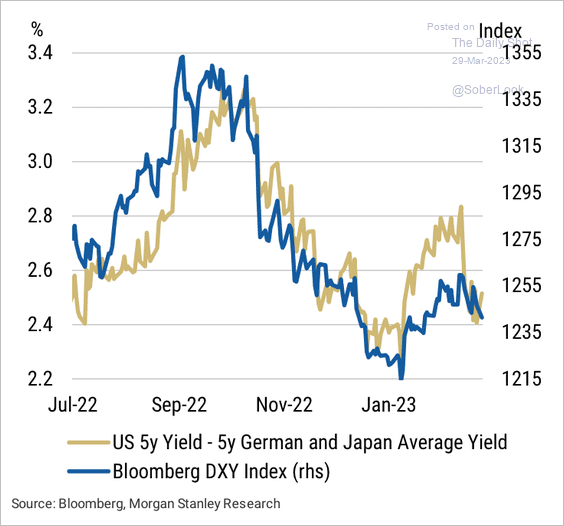 Source: Morgan Stanley Research
——————–
4. Global core inflation continues to run hot.
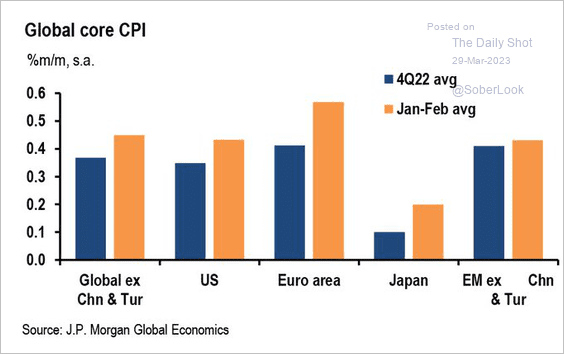 Source: JP Morgan Research; @carlquintanilla
——————–
Food for Thought
1. Grocery store customers pushing back:
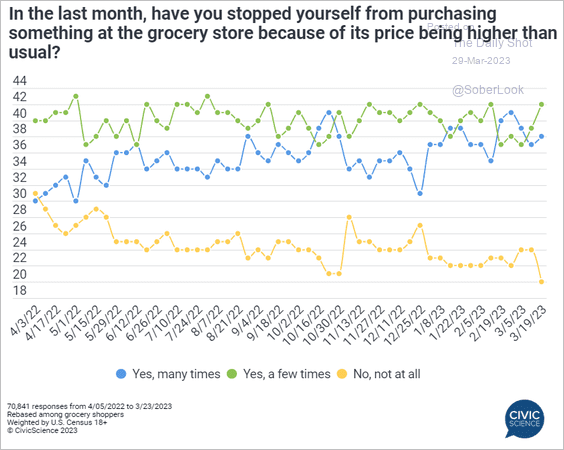 Source: @CivicScience Read full article
2. The distribution of US CPI components over time:
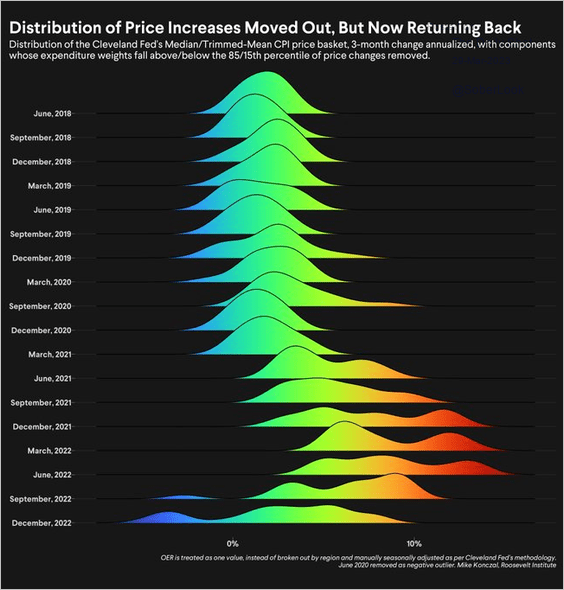 Source: @mtkonczal, @RooseveltInst, @RooseveltFwd
3. Microsoft using its cash to buy Activision Blizzard:
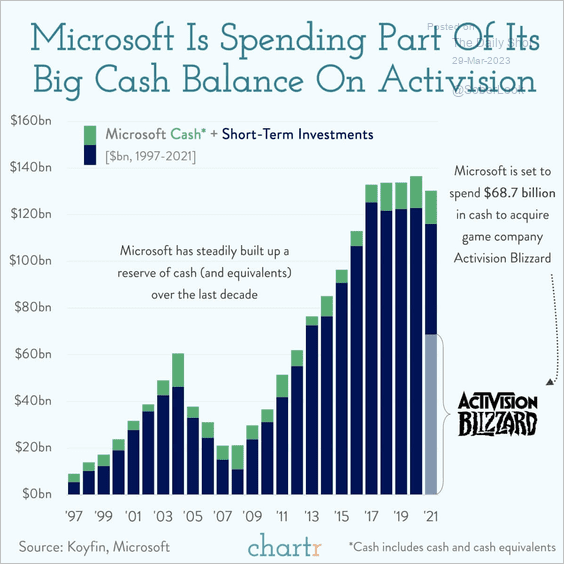 Source: @chartrdaily
4. The most fuel-efficient cars over time:
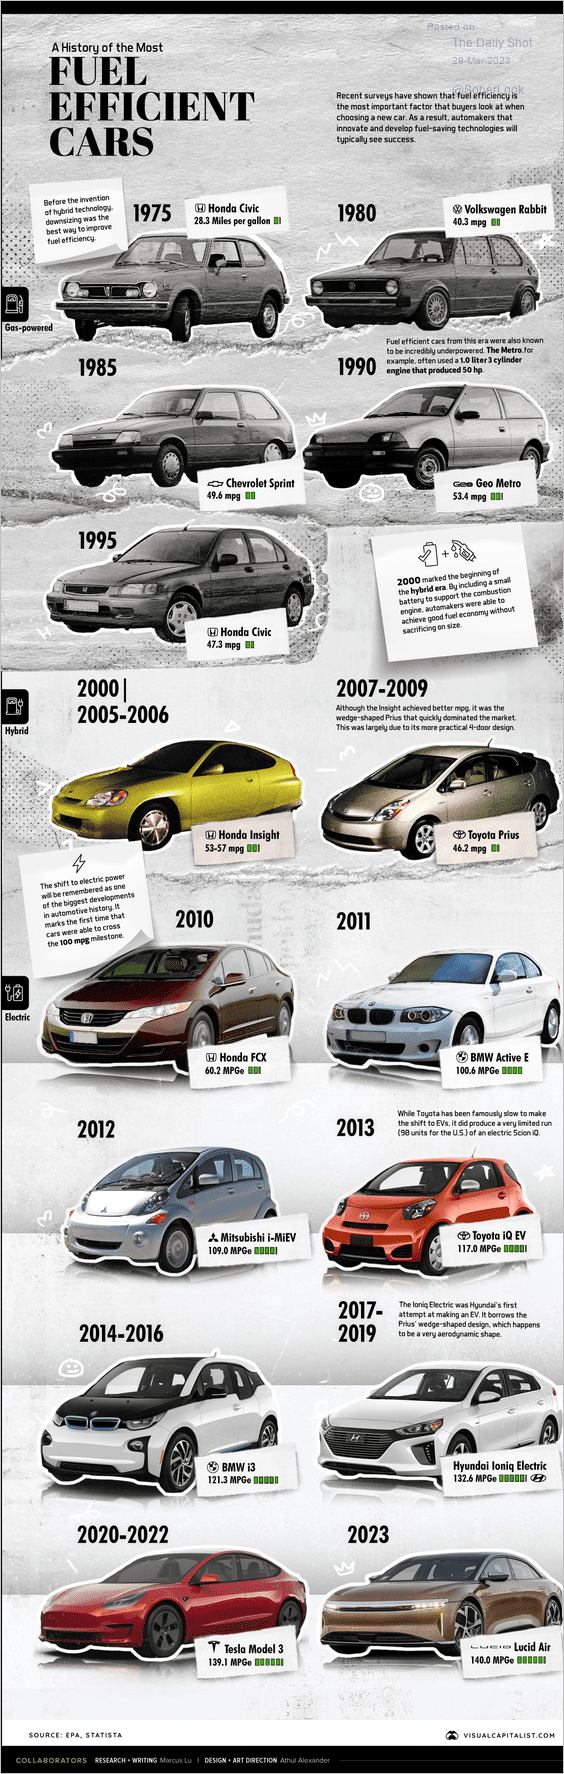 Source: Visual Capitalist Read full article
5. US wealth distribution by age:
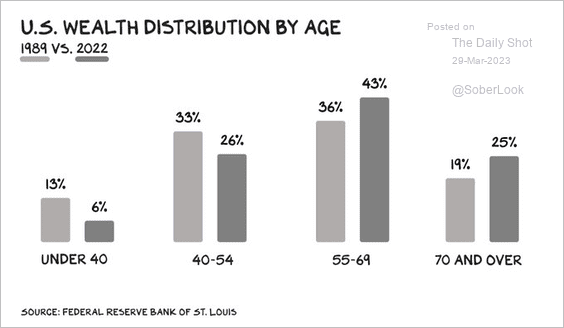 Source: @profgalloway
6. What contributed to the recent surge in US excess savings?
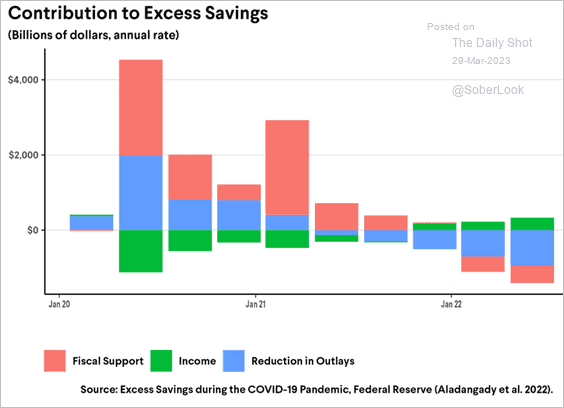 Source: THE ROOSEVELT INSTITUTE Read full article
7. China’s population pyramid:
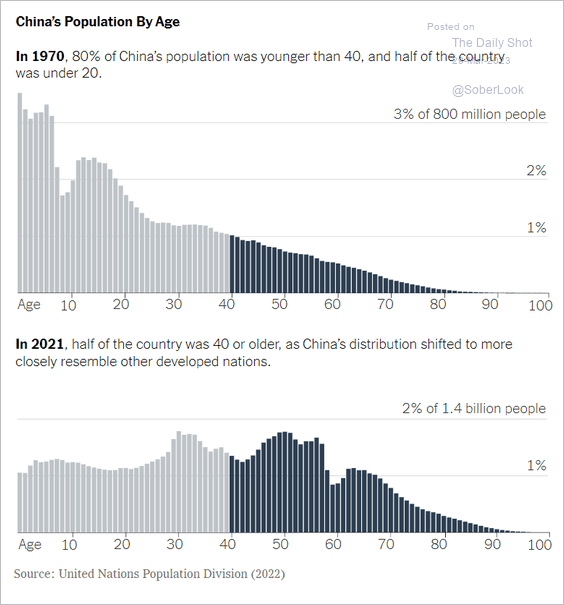 Source: The New York Times Read full article
8. Russia’s defense spending:
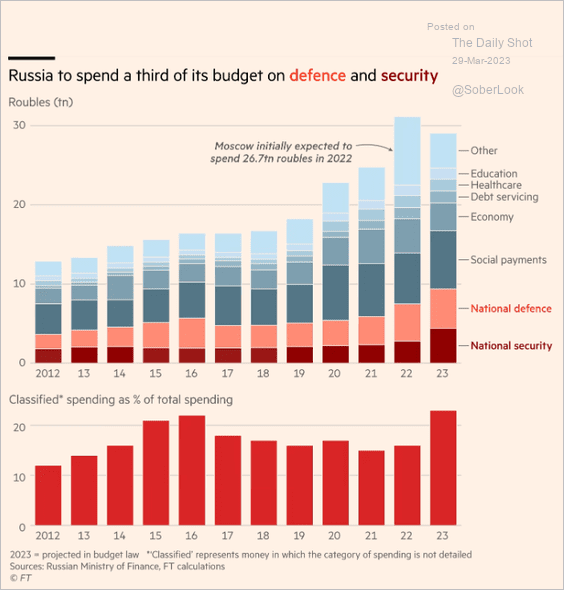 Source: @financialtimes Read full article
9. The 2024 GOP nomination probabilities in the betting markets:
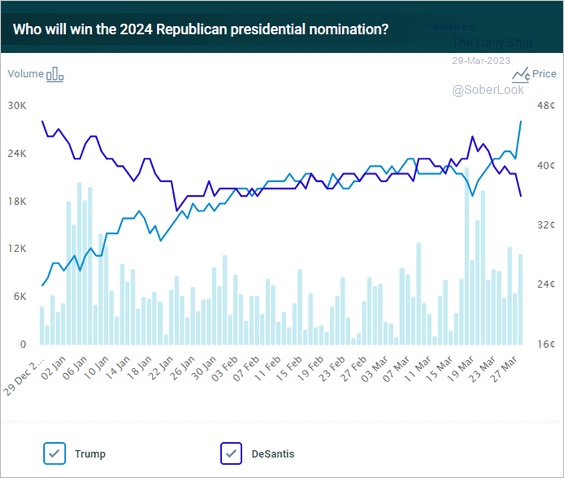 Source: @PredictIt
10. Europe’s sunniest cities:
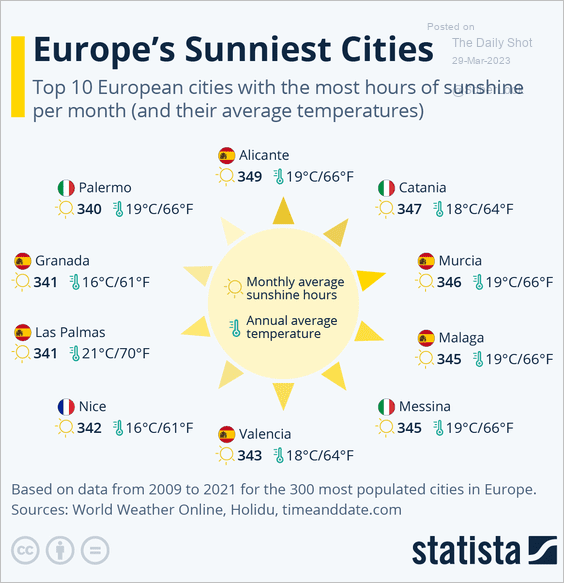 Source: Statista
——————–
Back to Index