
The Daily Shot: 04-Apr-23
• The United States
• Canada
• The United Kingdom
• Europe
• China
• Emerging Markets
• Cryptocurrency
• Commodities
• Energy
• Equities
• Credit
• Global Developments
• Food for Thought
The United States
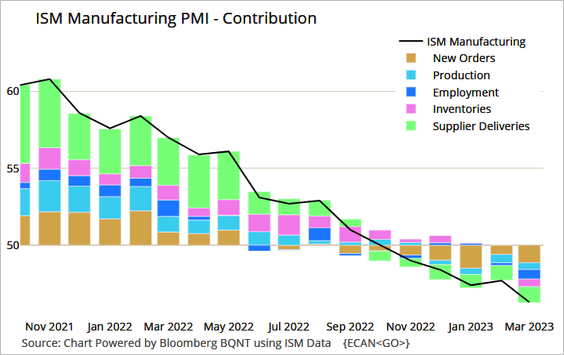
1. The ISM PMI report indicates a faster drop in US manufacturing activity in March.
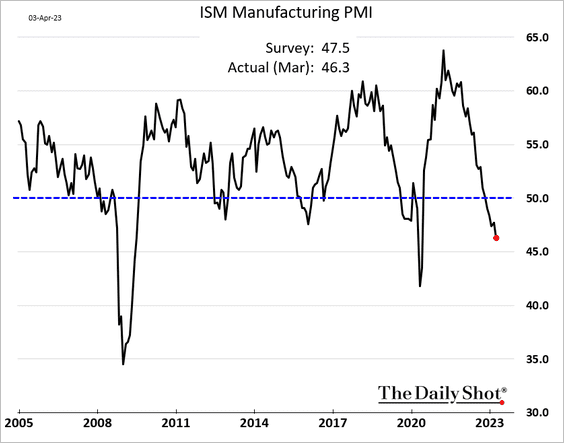
 Source: Reuters Read full article
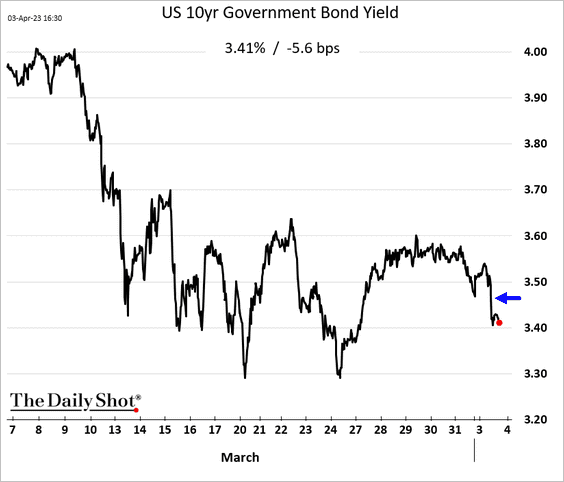
• Treasury yields declined in response.
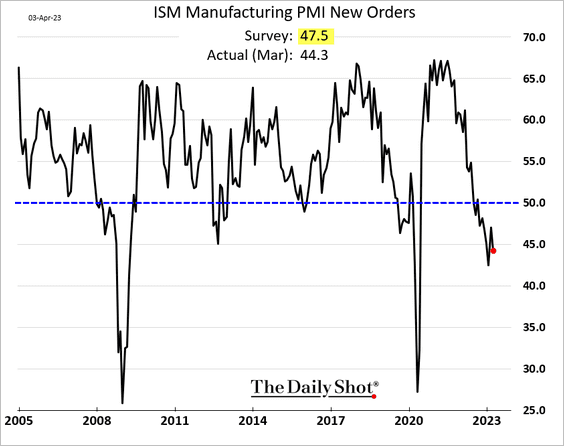
• The new orders index shows deteriorating demand.
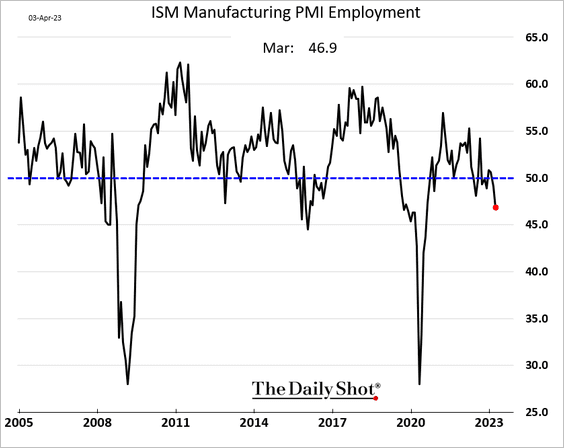
• Factories downsized their workforce.
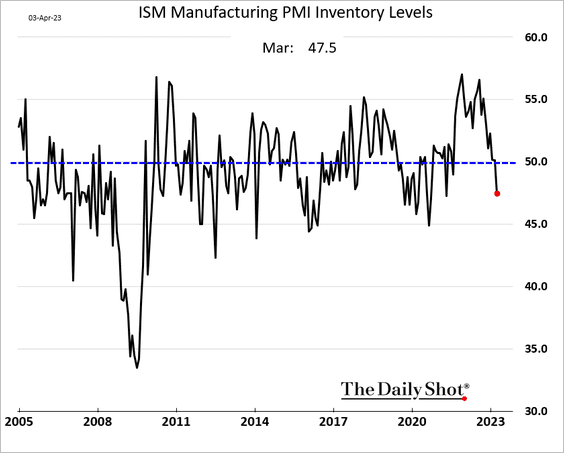
• Manufacturers are now cutting their inventories, …
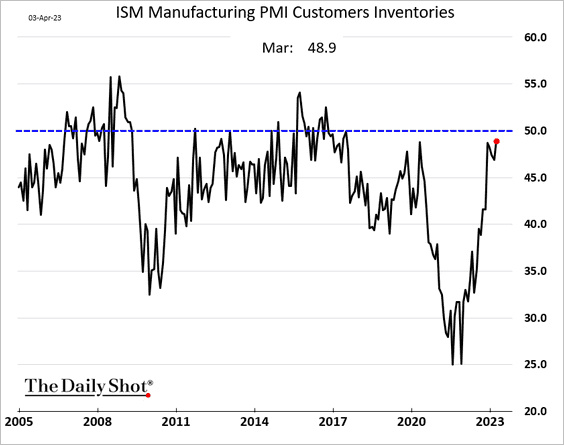
… and no longer see customers’ inventories as too tight.
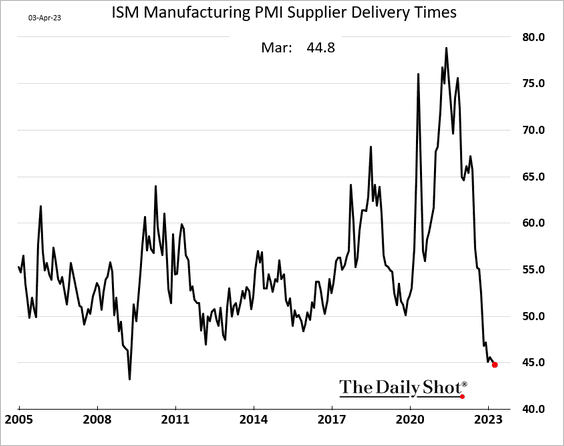
• The ISM Supplier Deliveries subindex dropped to 44.8, its lowest level since 2009, indicating that suppliers are responding rapidly to manufacturers’ needs as a result of deteriorating demand.
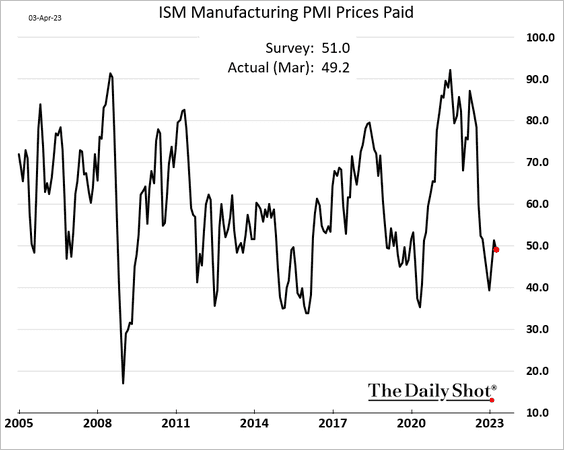
• Input prices unexpectedly declined.
• Here are the contributions to the headline ISM index.
 Source: @TheTerminal, Bloomberg Finance L.P.
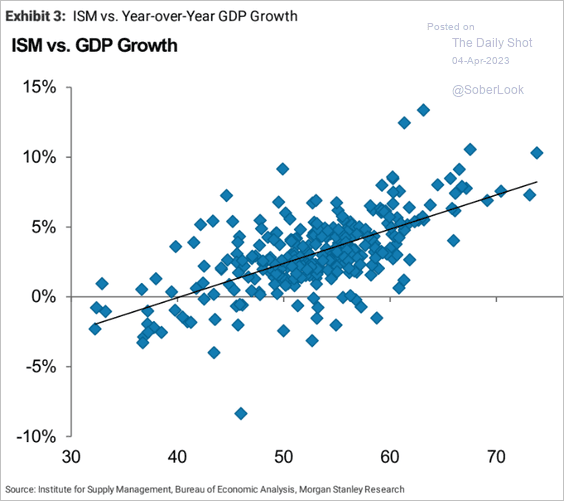
• The ISM report points to slower GDP growth.
 Source: Morgan Stanley Research
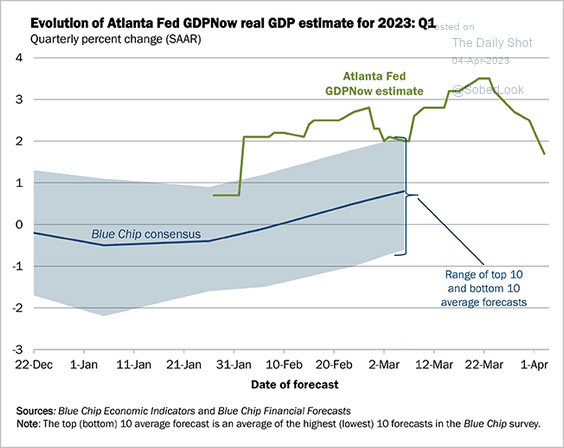
The March ISM PMI and soft consumer spending in February sent the Atlanta Fed’s GDPNow Q1 growth projection below 2%.
 Source: @AtlantaFed
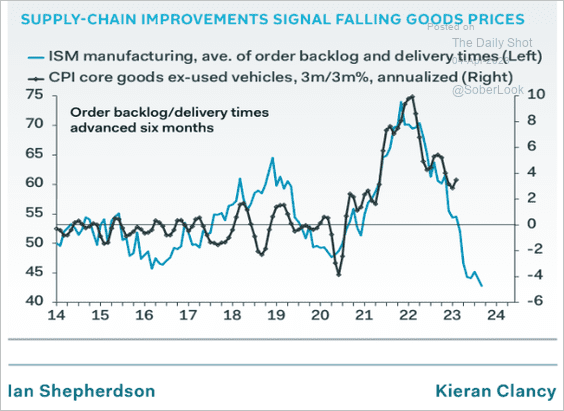
• The ISM report indicates a further moderation in core goods inflation.
 Source: Pantheon Macroeconomics
Leading indicators signal further declines ahead for the ISM PMI.
– Global central banks’ policy tightening:
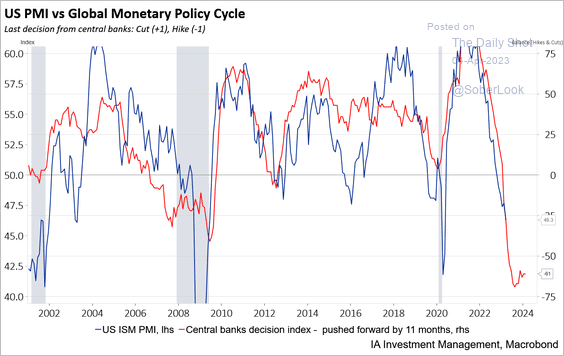 Source: Industrial Alliance Investment Management
– MarketDesk’s leading index:
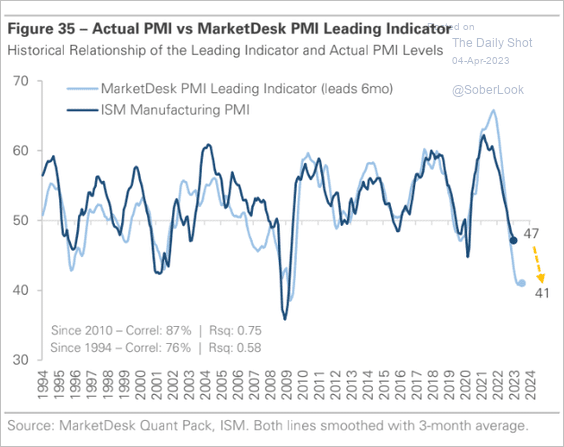 Source: MarketDesk Research
However, Morgan Stanley sees the ISM PMI bottoming.
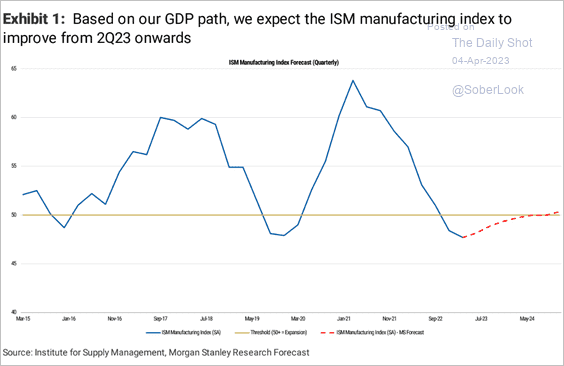 Source: Morgan Stanley Research
——————–
2. Deutsche Bank’s recession probability indicator remains elevated.
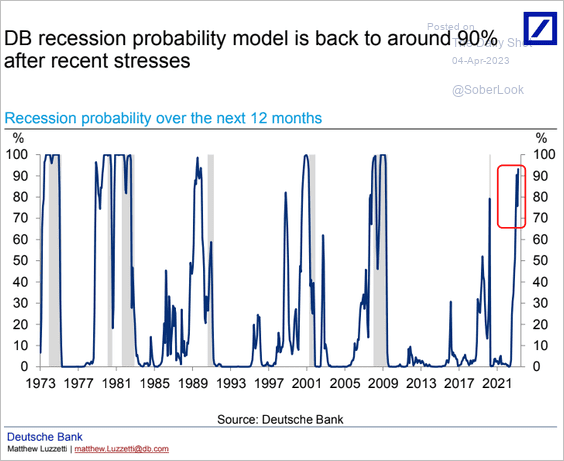 Source: Deutsche Bank Research
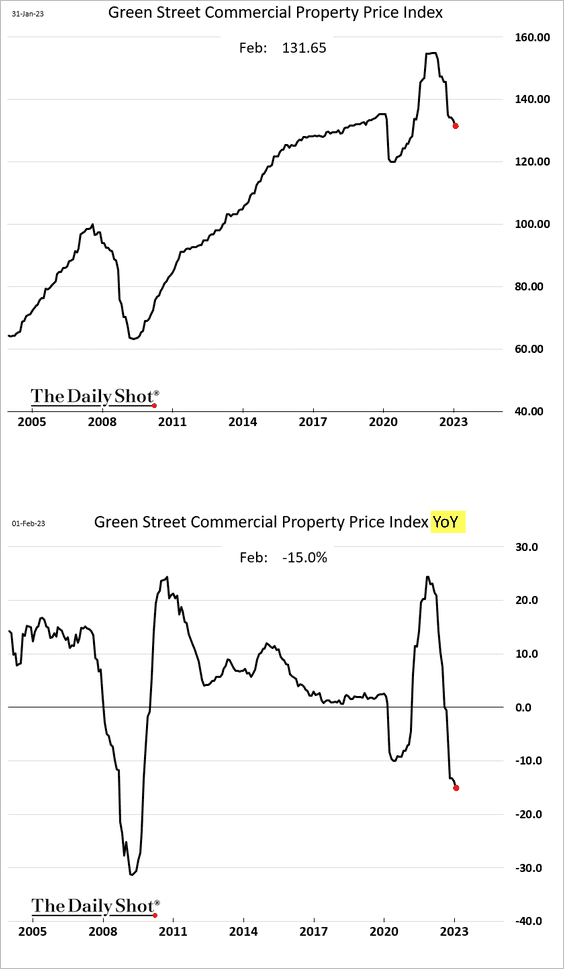
3. Commercial property prices are experiencing a sharp decline.
This chart shows available sublease office space.
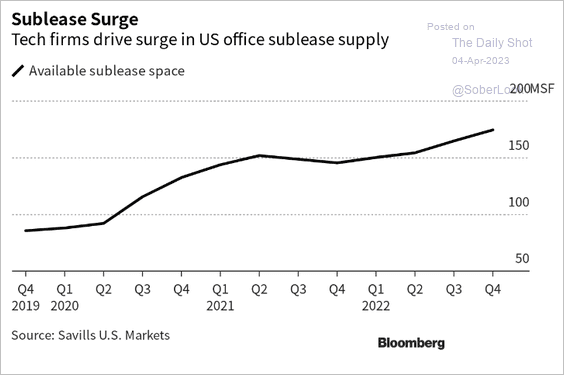 Source: Bloomberg Tax Read full article
——————–
4. Next, we have residential and non-residential private construction spending trends.
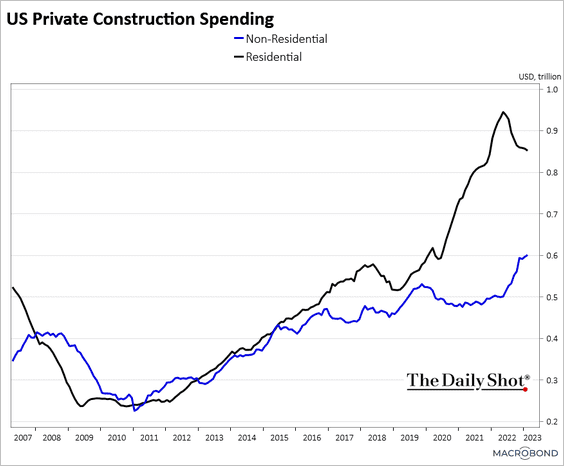 Source: Chart and data provided by Macrobond
Architecture billings continue to contract.
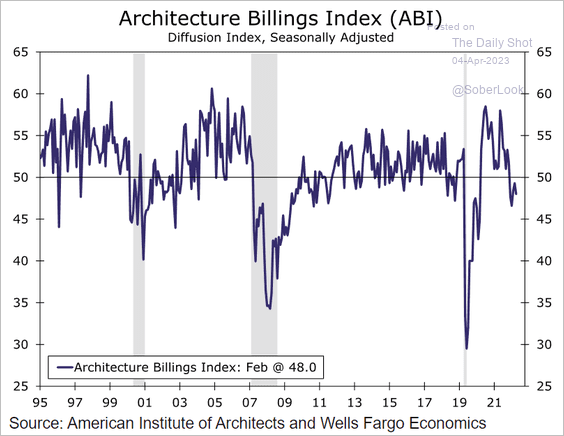 Source: Wells Fargo Securities
——————–
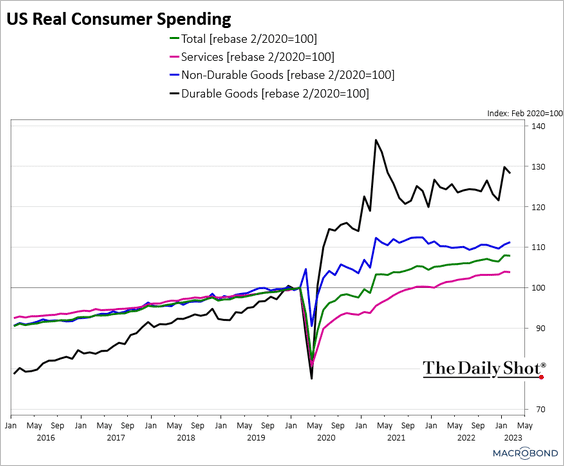
5. Finally, we have real consumer spending trends for goods and services.
 Source: Chart and data provided by Macrobond
Back to Index
Canada
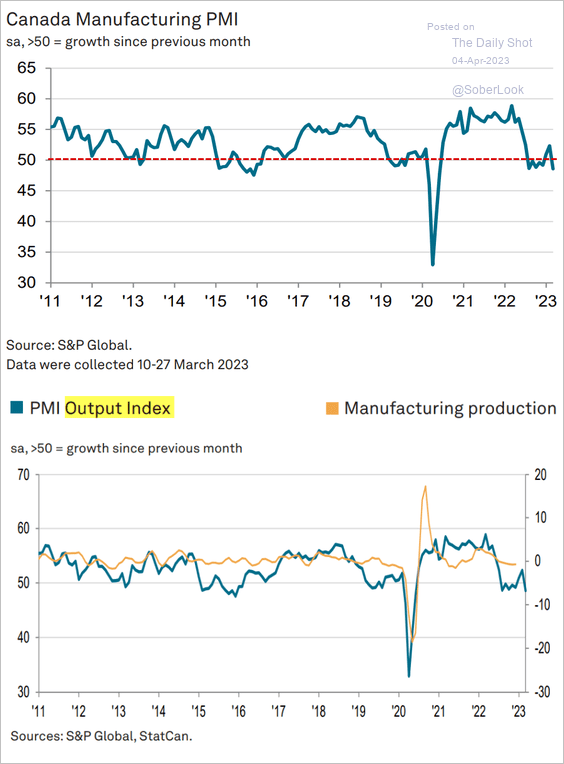
1. Factory activity is back in contraction mode.
 Source: S&P Global PMI
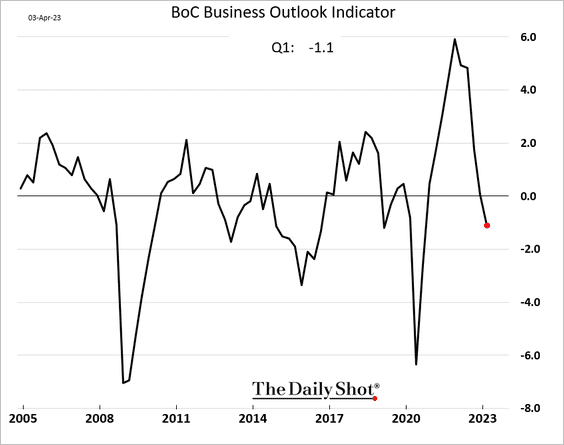
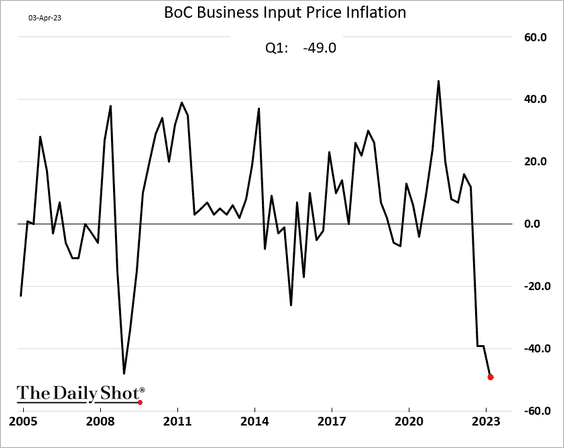
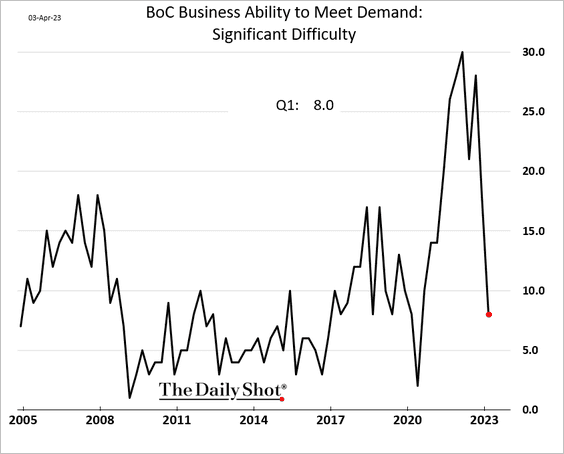
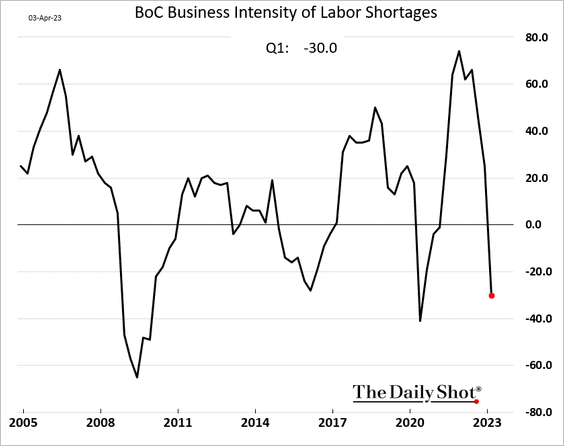
2. The BoC business survey outlook worsened last quarter.
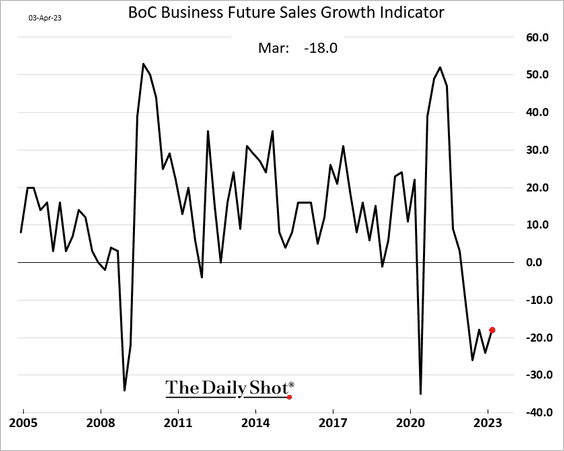
Here are some additional trends from the report.
• Future sales growth:
• Input price deflation:
• No significant difficulties meeting demand:
• The end of labor shortages:
——————–
3. Air travel is back to pre-COVID levels.
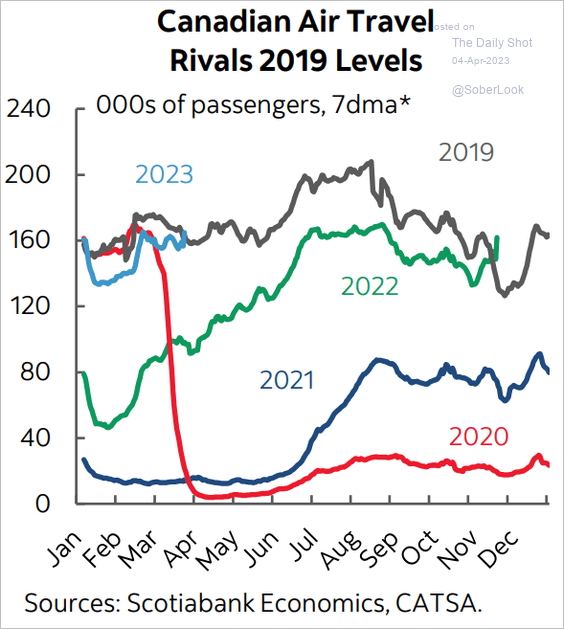 Source: Scotiabank Economics
Back to Index
The United Kingdom
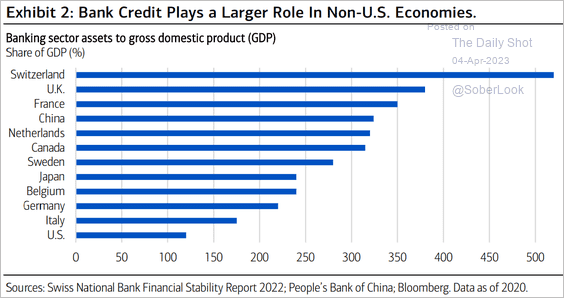
1. Among major economies besides Switzerland, UK banks have the highest total asset-to-GDP ratio.
 Source: Merrill Lynch
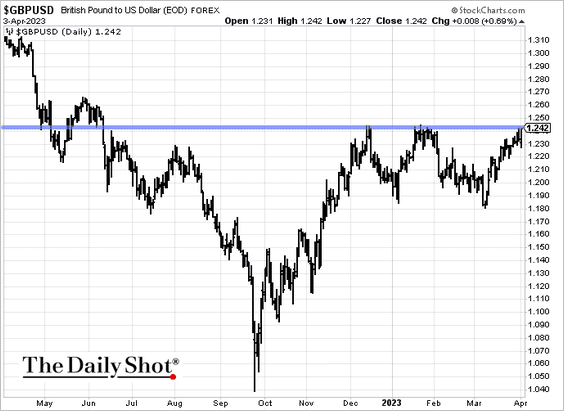
2. GBP/USD is testing resistance.
Back to Index
Europe
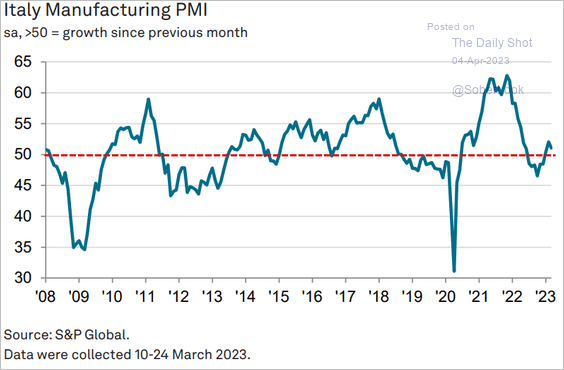
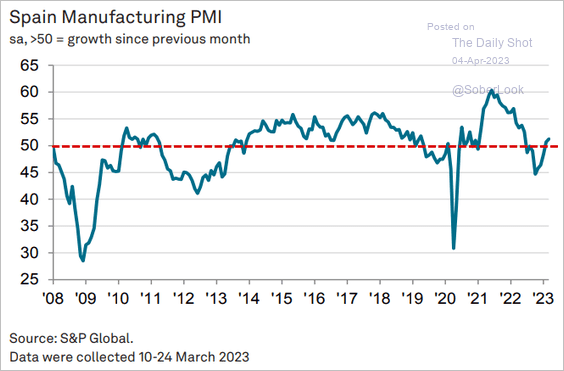
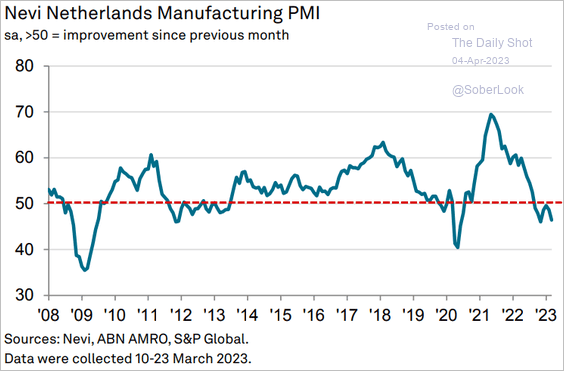
1. Here are some manufacturing PMI trends in the Eurozone.
• Italy and Spain (modest growth):
 Source: S&P Global PMI
 Source: S&P Global PMI
• The Netherlands (ongoing contraction):
 Source: S&P Global PMI
——————–
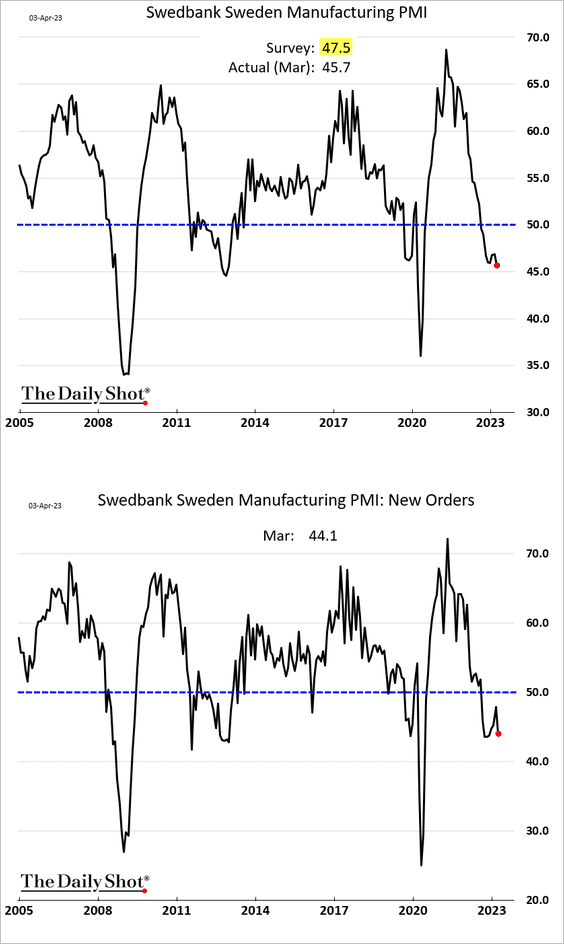
2. Sweden’s manufacturing contraction worsened last month.
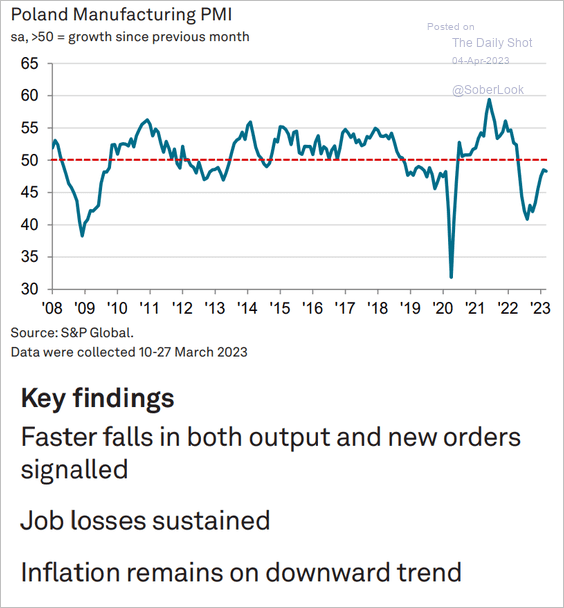
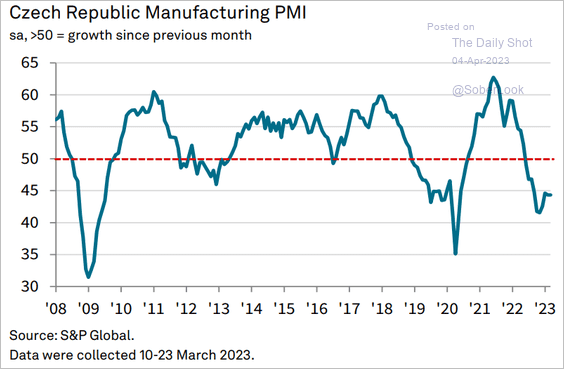
3. Central Europe’s factory PMIs are also in contraction territory.
• Poland:
 Source: S&P Global PMI
• Czech Republic
 Source: S&P Global PMI
——————–
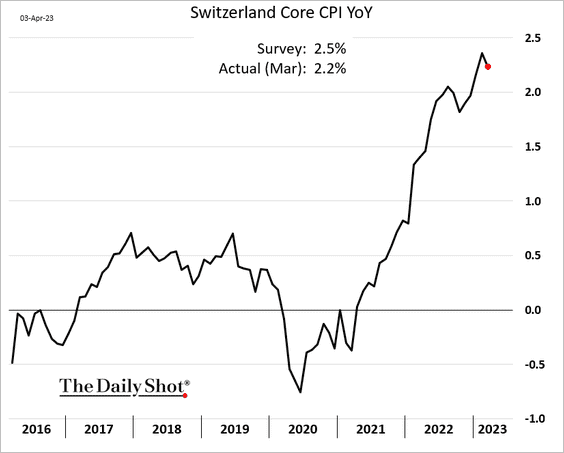
4. Is Swiss core inflation finally peaking?
Separately, Swiss sight deposits increased last month, …
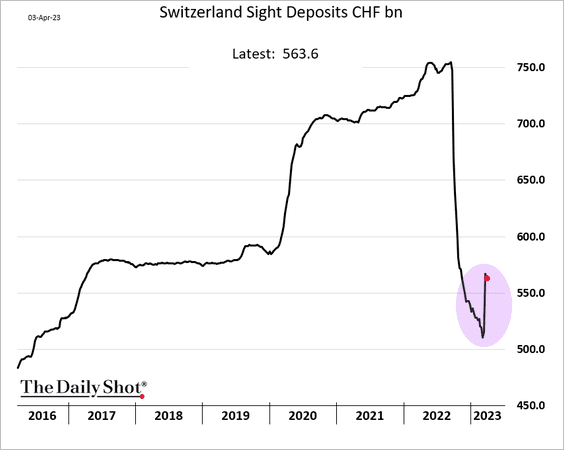
… as the authorities borrowed dollars from the Fed to deal with the UBS/CS merger.
Back to Index
China
1. Chinese onshore stocks have underperformed during previous global market downturns.
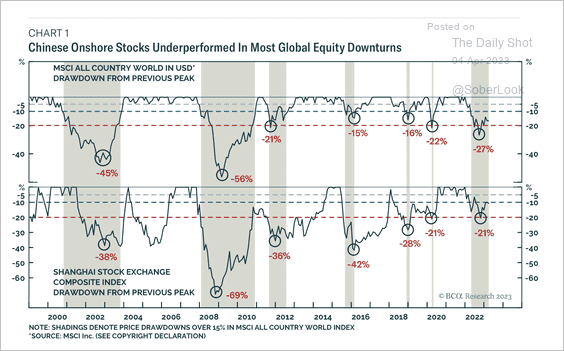 Source: BCA Research
2. Commercial and residential property sales volume snapped back in Q1.
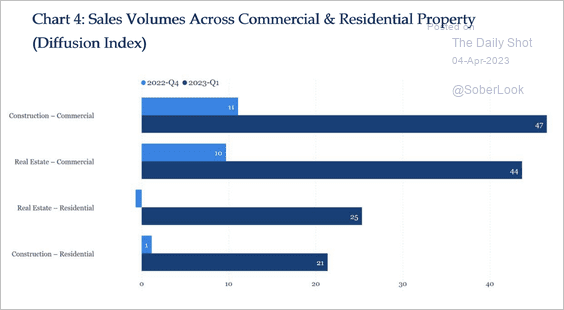 Source: China Beige Book
Back to Index
Emerging Markets
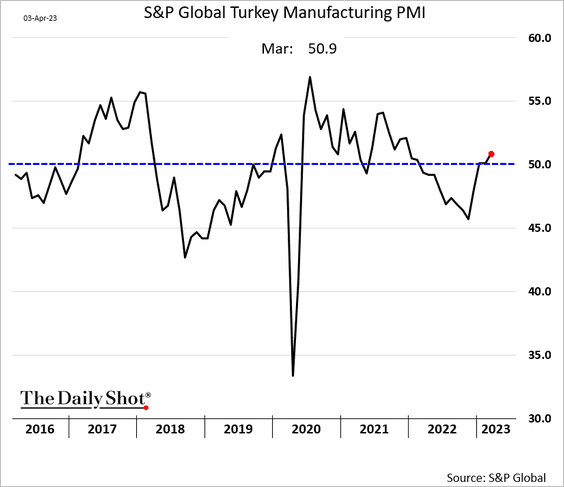
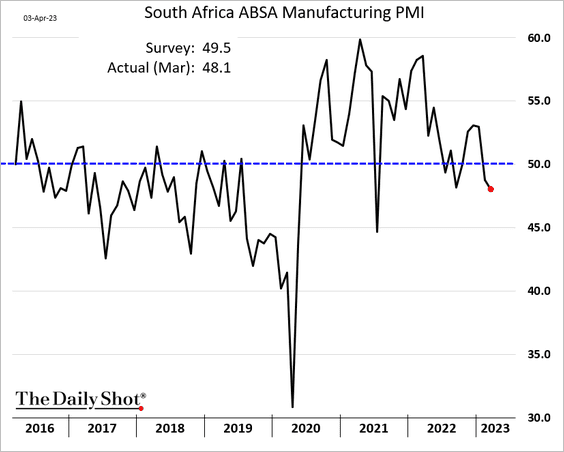
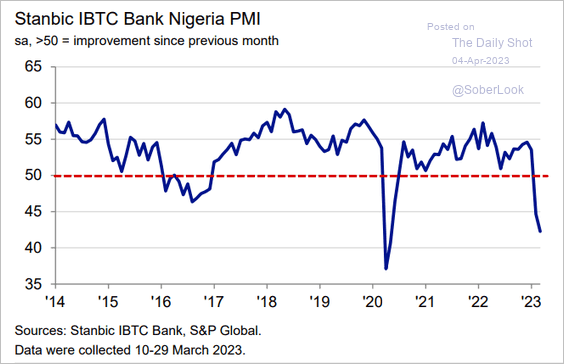
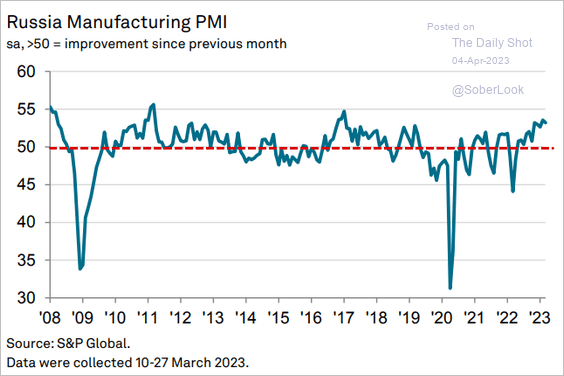
1. Let’s run through some manufacturing PMI trends.
• Brazil (still shrinking):
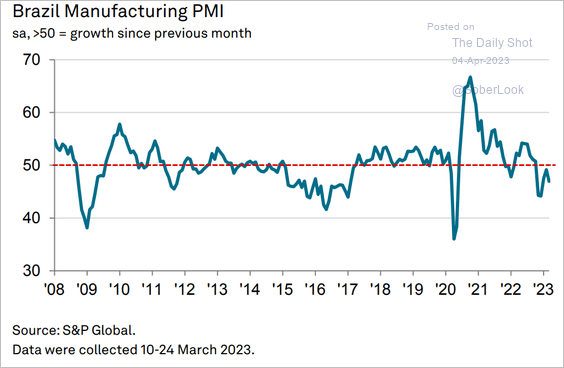 Source: S&P Global PMI
• Colombia (back in growth mode):
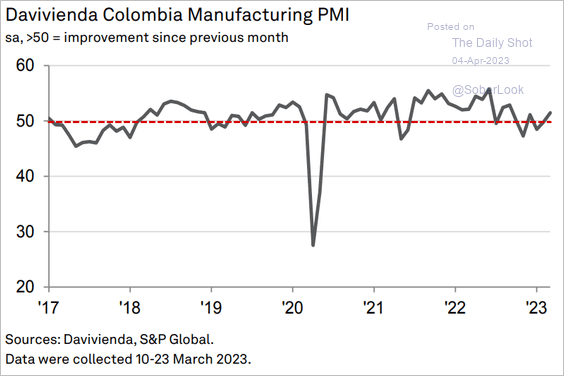 Source: S&P Global PMI
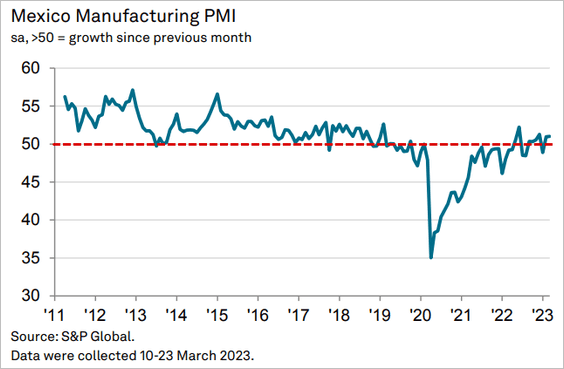
• Mexico (modest expansion):
• Turkey (growing again):
• South Africa (headwinds):
• Nigeria (awful):
 Source: S&P Global PMI
• Russia (ramped-up weapons production):
 Source: S&P Global PMI
——————–
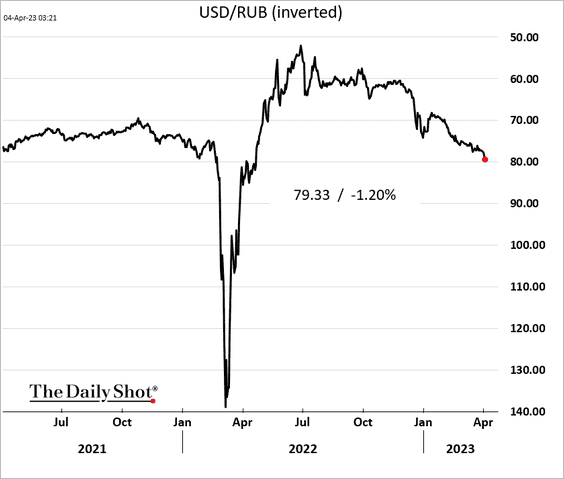
2. The ruble continues to soften.
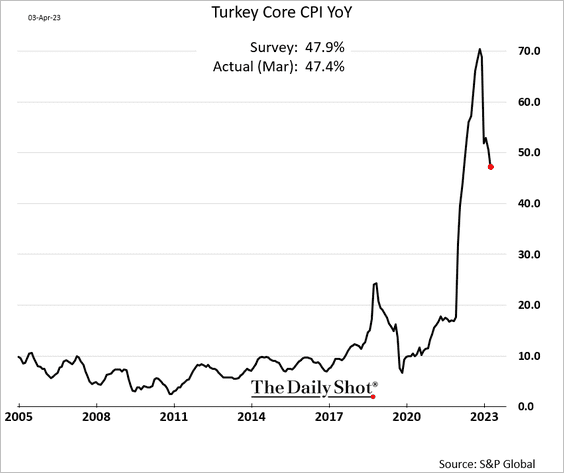
3. Turkey’s inflation has peaked.
4. Last quarter saw robust inflows into EM equity funds.
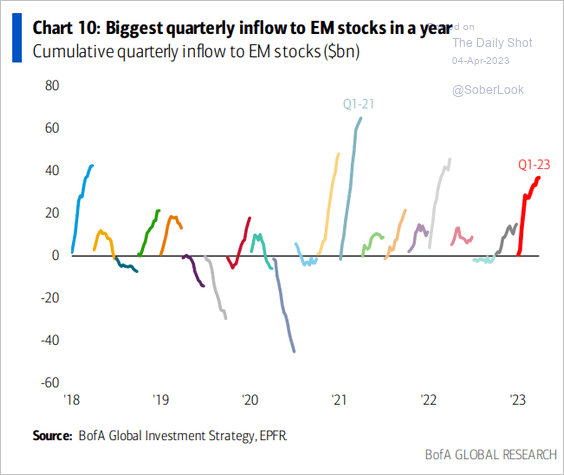 Source: BofA Global Research
Back to Index
Cryptocurrency
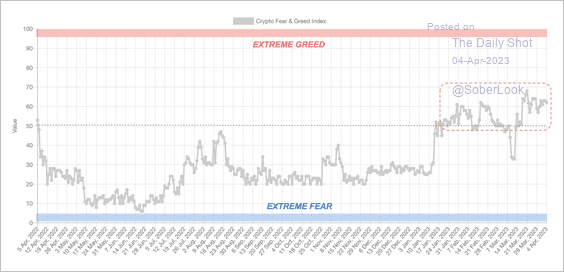
1. The Crypto Fear & Greed Index remains in “greed” territory after spending most of last year in the “fear” zone.
 Source: Alternative.me
2. Crypto investment products had minor inflows last week on low trading volume. Long-bitcoin funds accounted for most of the inflows.
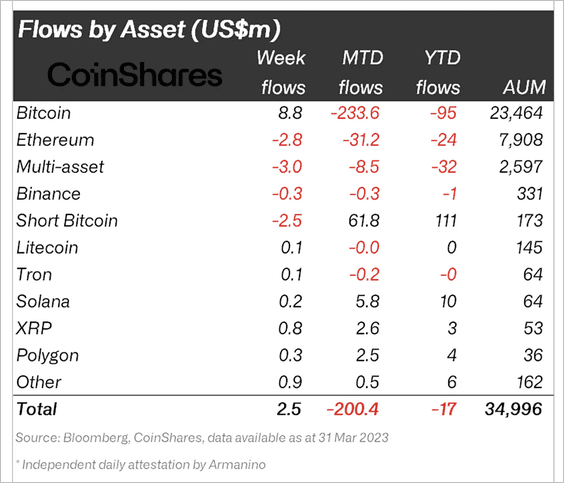 Source: CoinShares Read full article
3. Similar to BTC, ETH’s liquidity has declined since the FTX collapse.
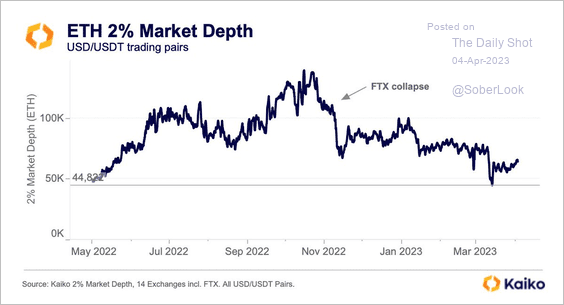 Source: @KaikoData
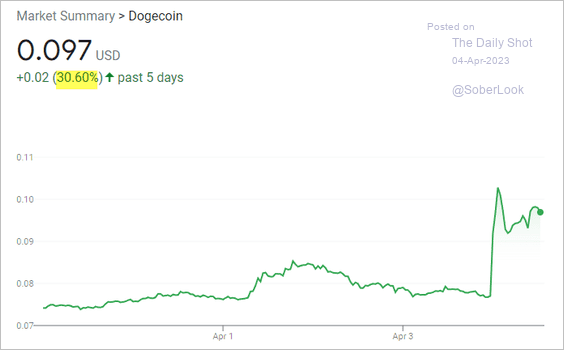
4. Dogecoin rallied after its dog logo appeared on Twitter’s main page.
 Source: CoinDesk Read full article
 Source: @elonmusk
 Source: Google
Back to Index
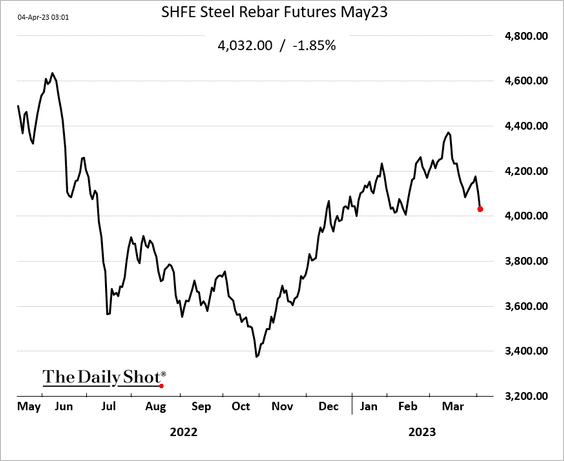
Commodities
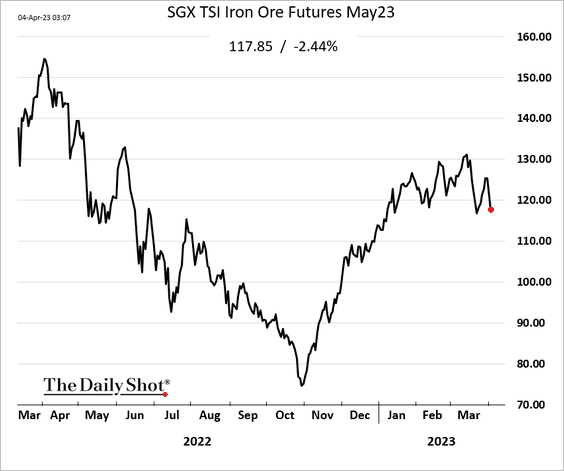
Iron ore and steel futures are rolling over.
Back to Index
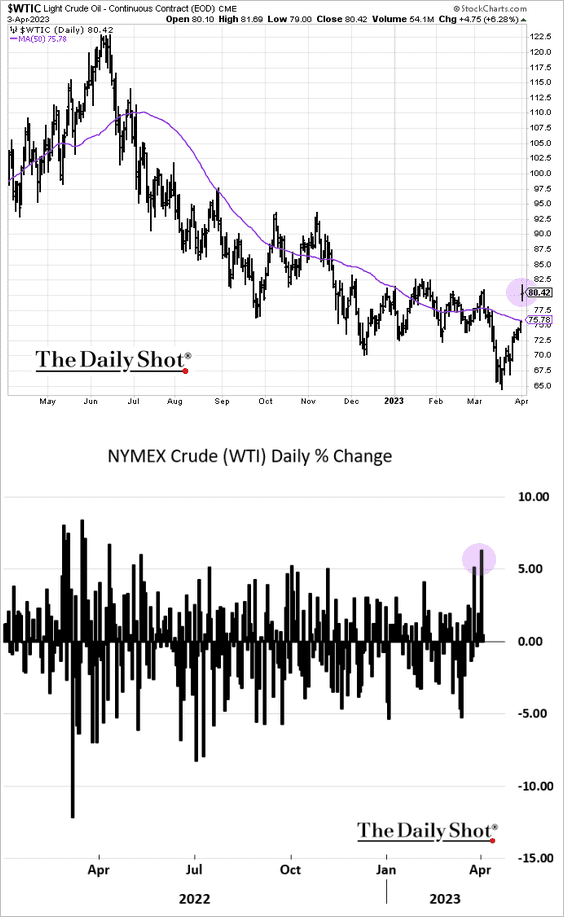
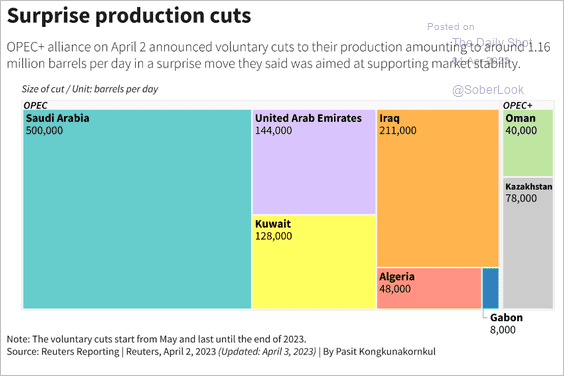
Energy
1. Crude oil rallied strongly after the OPEC news.
 Source: Reuters Read full article
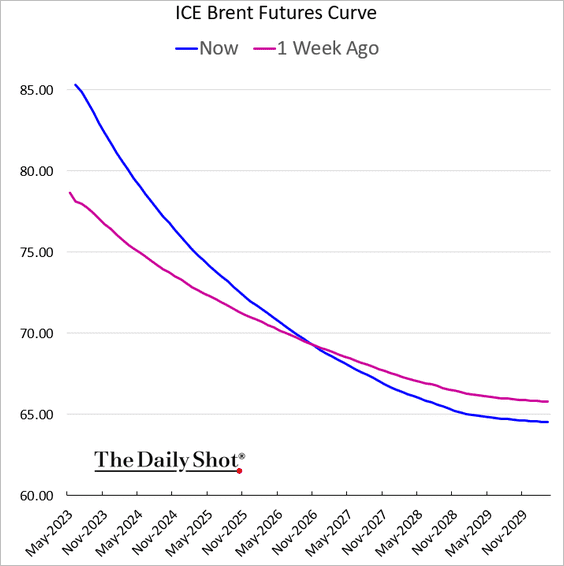
The Brent curve moved deeper into backwardation.
2. Oil market surplus will end in Q4, according to the updated forecast from Longview Economics.
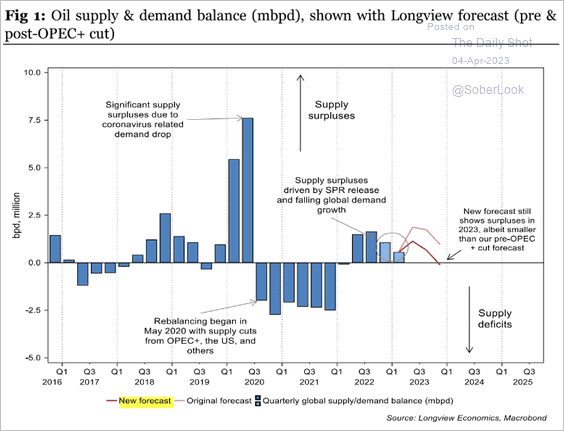 Source: Longview Economics
But the research firm still expects oil prices to decline by the end of the year.
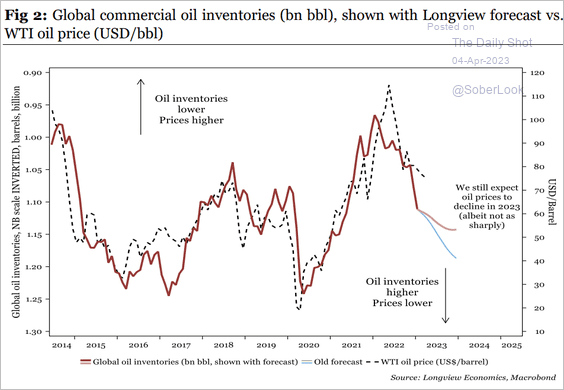 Source: Longview Economics
Back to Index
Equities
1. Let’s start with some performance data.
• The S&P 500 Q1 return attribution by member:
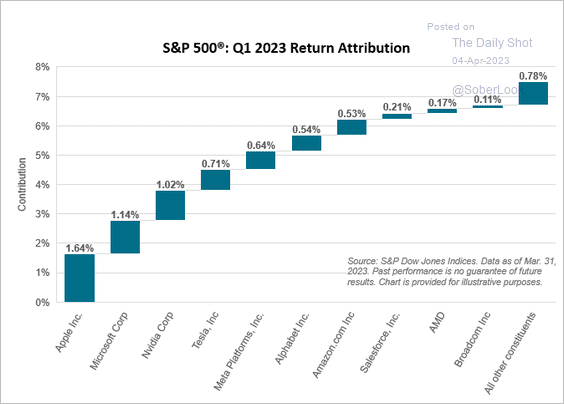 Source: S&P Dow Jones Indices
• Dividend strategies’ Q1 performance:
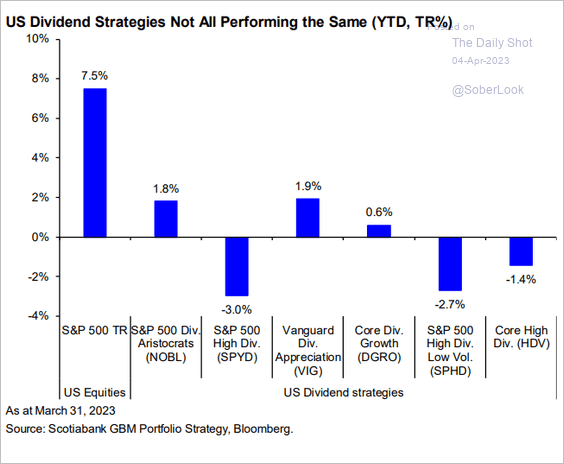 Source: Hugo Ste-Marie, Portfolio & Quantitative Strategy Global Equity Research, Scotia Capital
• Equity factor performance in March and year-to-date:
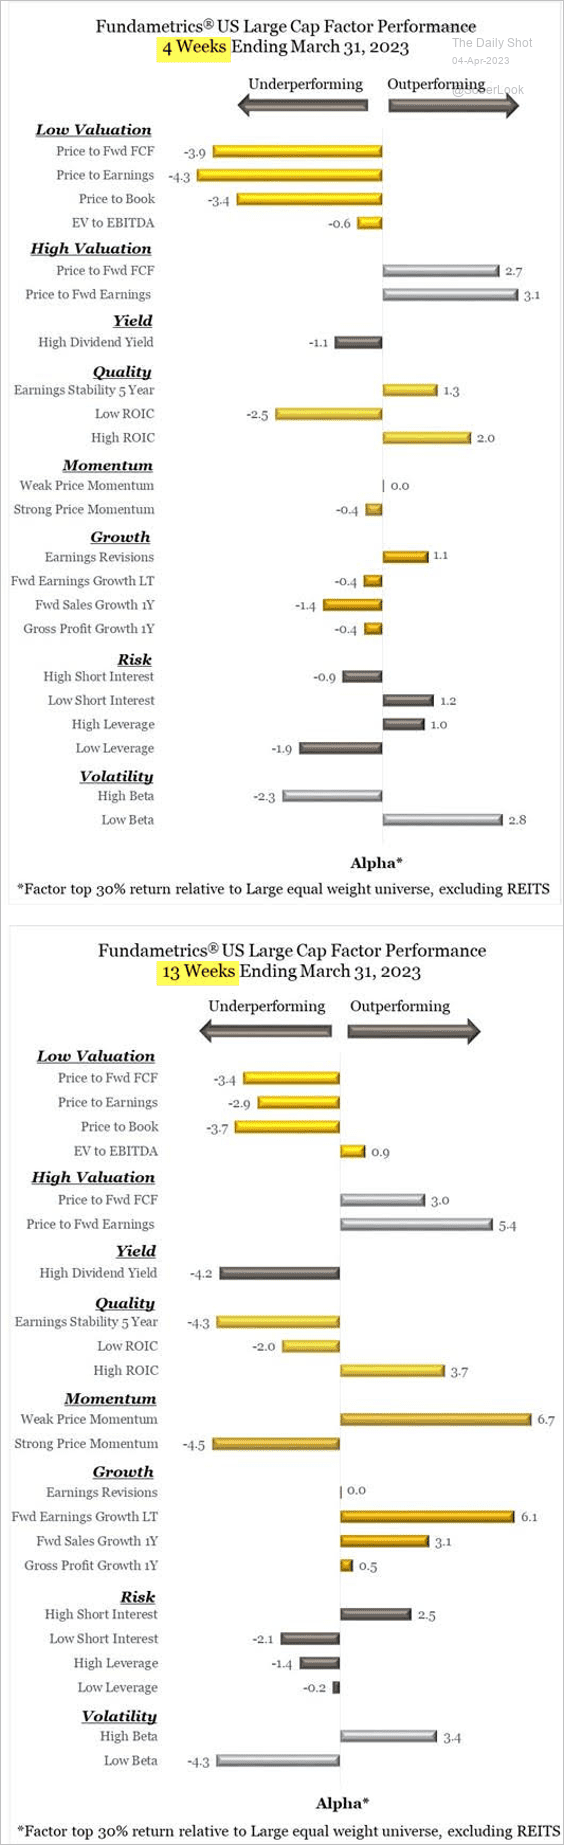 Source: CornerCap Institutional
——————–
2. Historically, the S&P 500 ended the year higher after a positive Q1.
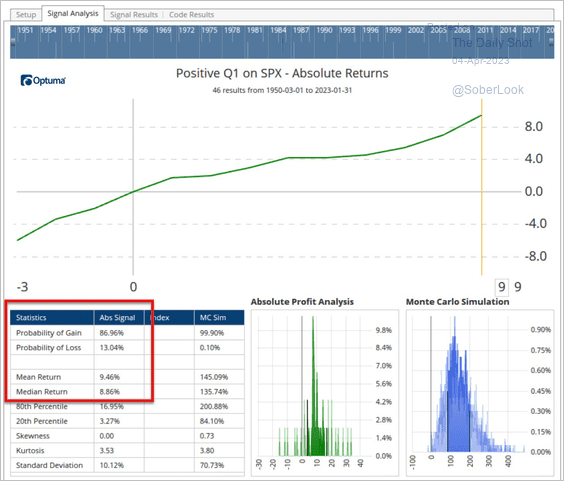 Source: @Optuma
3. How do stocks perform in different ISM Manufacturing PMI regimes?
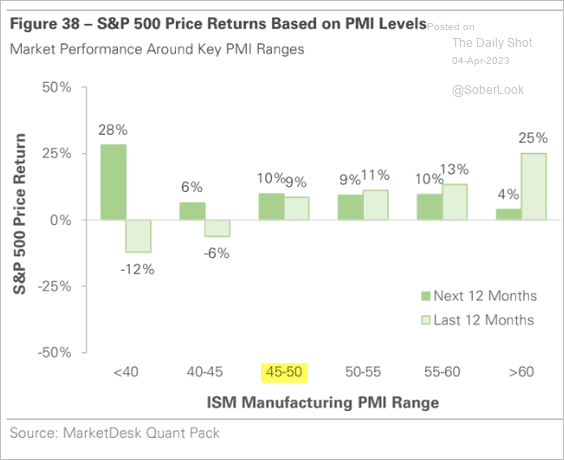 Source: MarketDesk Research
The ISM index signals further revenue weakness for growth companies.
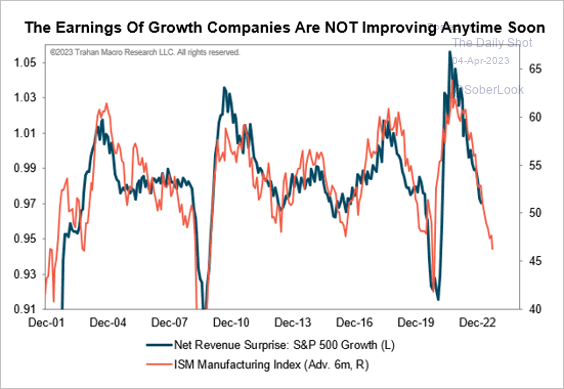 Source: @FrancoisTrahan
——————–
4. This chart shows the percentage of US stocks that are overbought (based on RSI):
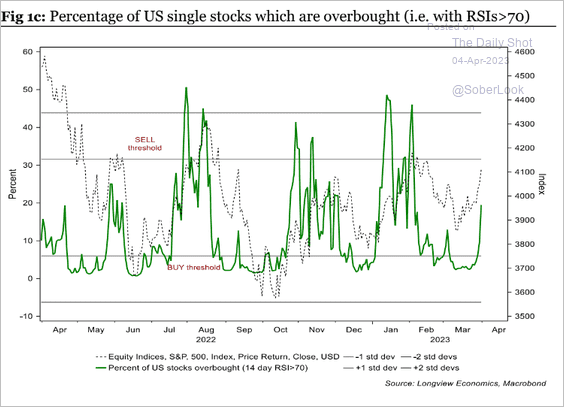 Source: Longview Economics
5. Short interest remains near multi-year lows.
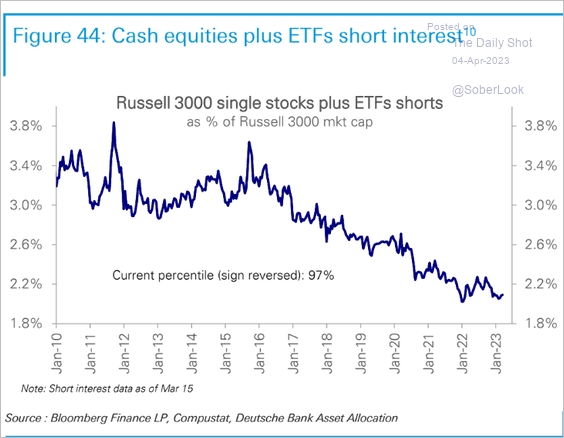 Source: Deutsche Bank Research
6. Operating margins continue to shrink.
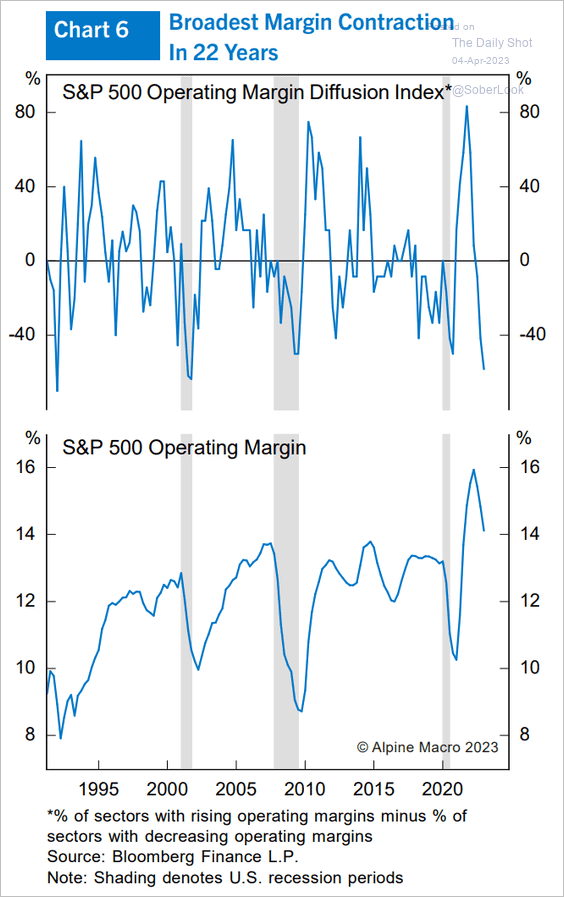 Source: Alpine Macro
7. Share buybacks could decrease further as corporate cash balances decline.
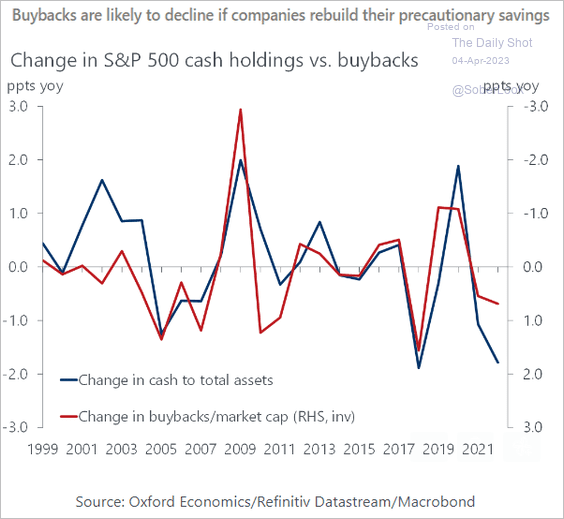 Source: Oxford Economics
8. The ARK Innovation ETF continues to follow the dot-com analog.
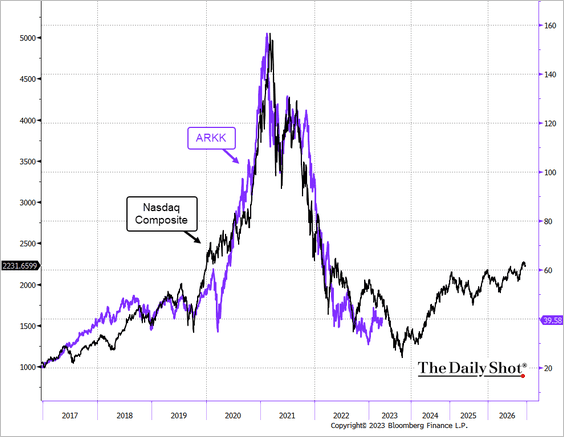 Source: @TheTerminal, Bloomberg Finance L.P.
Back to Index
Credit
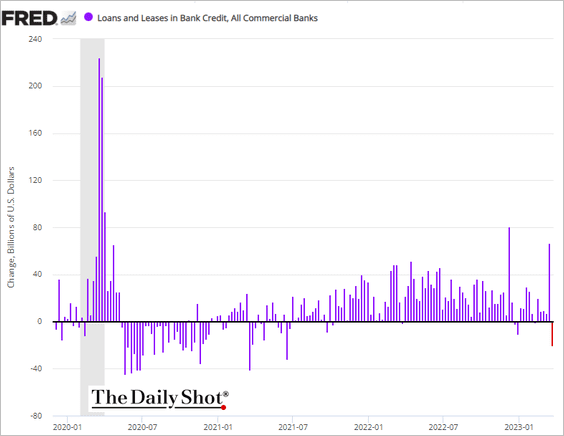
1. Loan balances at US banks declined last week as companies paid down their revolving debt.
2. Capital markets activity shows signs of life.
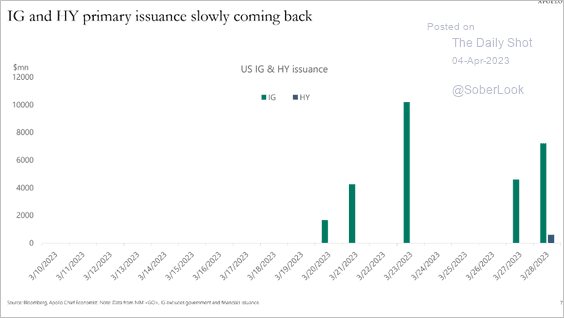 Source: Torsten Slok, Apollo
3. Credit investor positioning has been cautious.
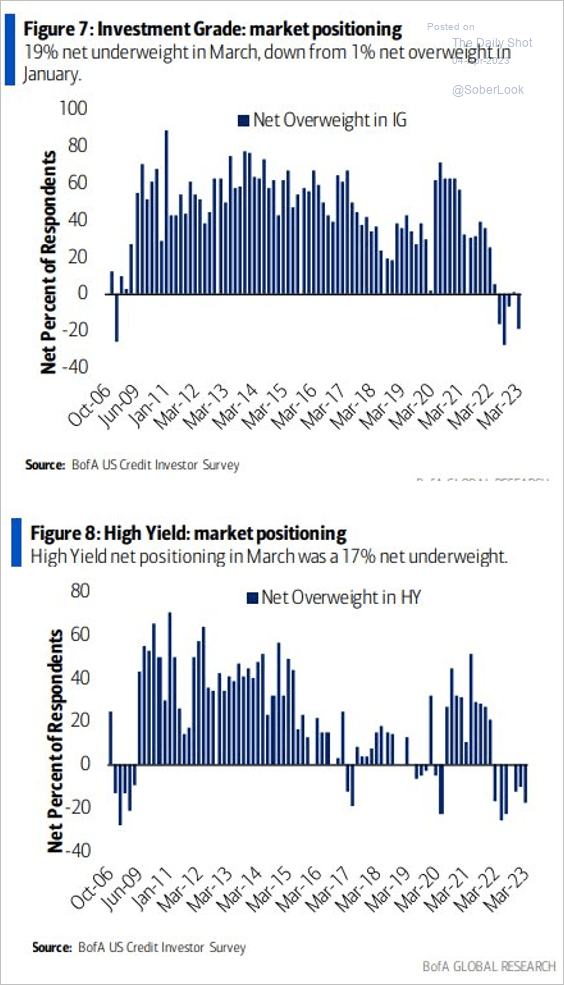 Source: BofA Global Research; @MikeZaccardi
4. This chart shows commercial real estate debt in perspective.
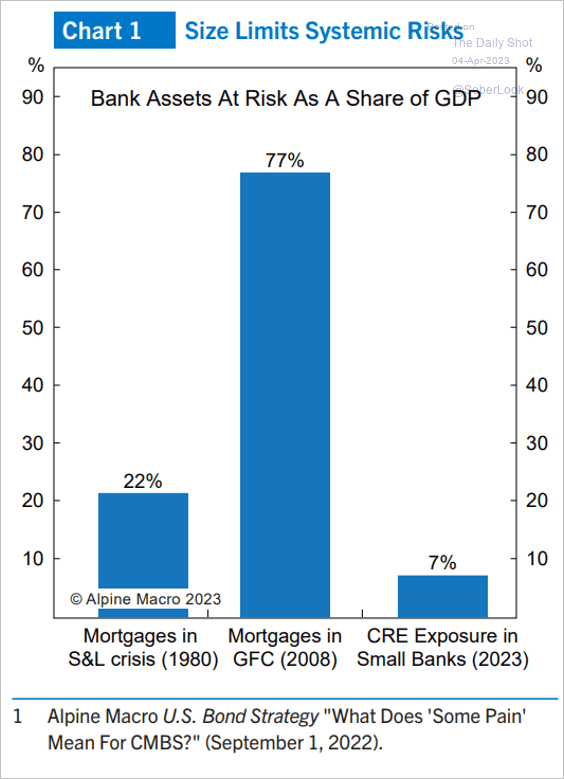 Source: Alpine Macro
5. There are a lot of highly-leveraged syndicated loans.
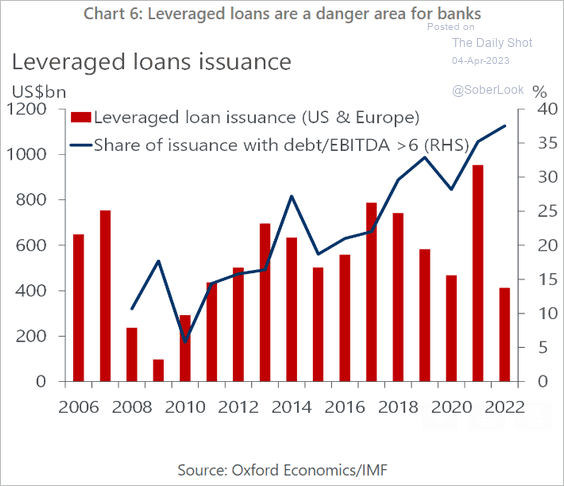 Source: Oxford Economics
Back to Index
Global Developments
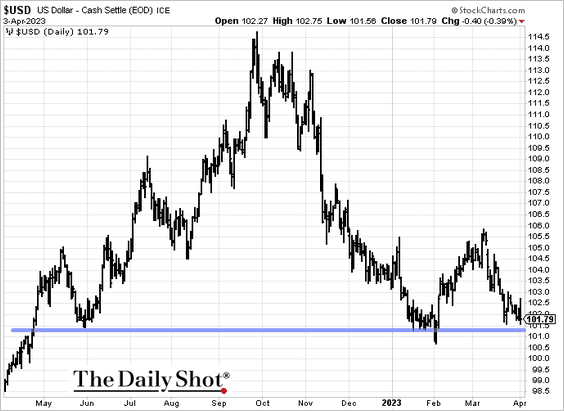
1. The US dollar index (DXY) is at support.
2. This chart shows semiconductor supply shortages and price pressures over time.
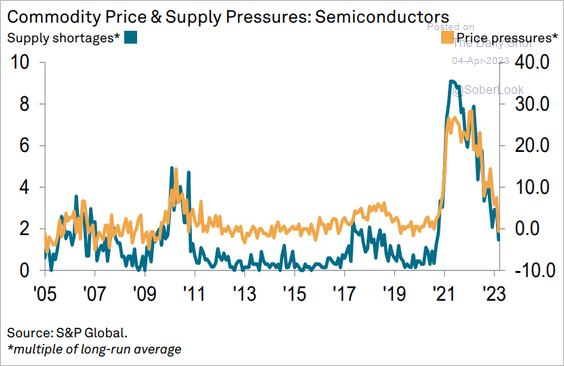 Source: S&P Global PMI
——————–
Food for Thought
1. Tax return surprises:
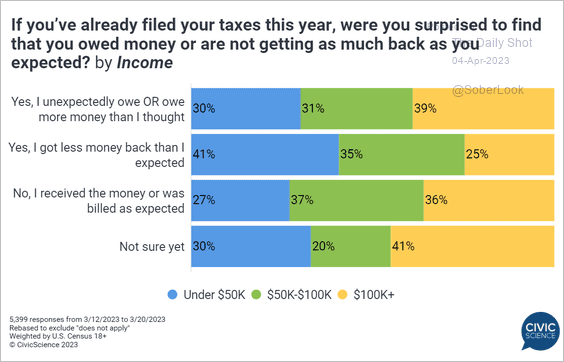 Source: @CivicScience Read full article
• Spending tax refunds:
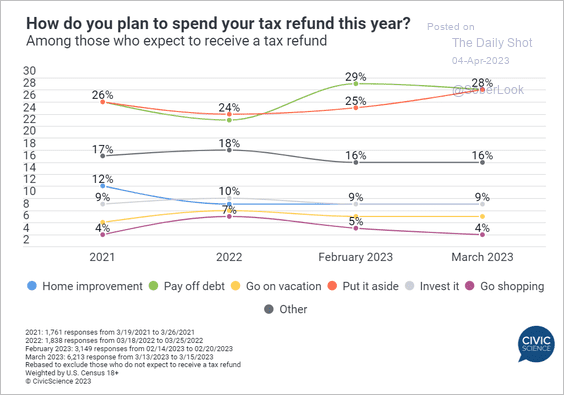 Source: @CivicScience Read full article
——————–
2. US child labor violations:
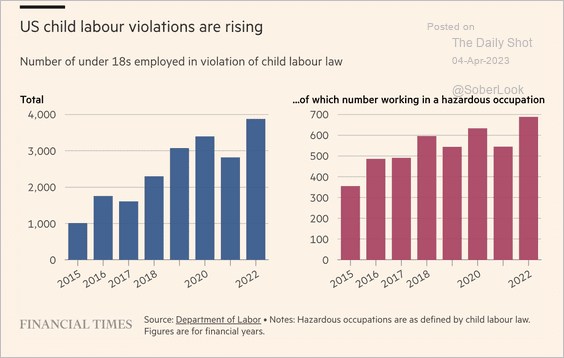 Source: @financialtimes Read full article
3. Job cuts since October:
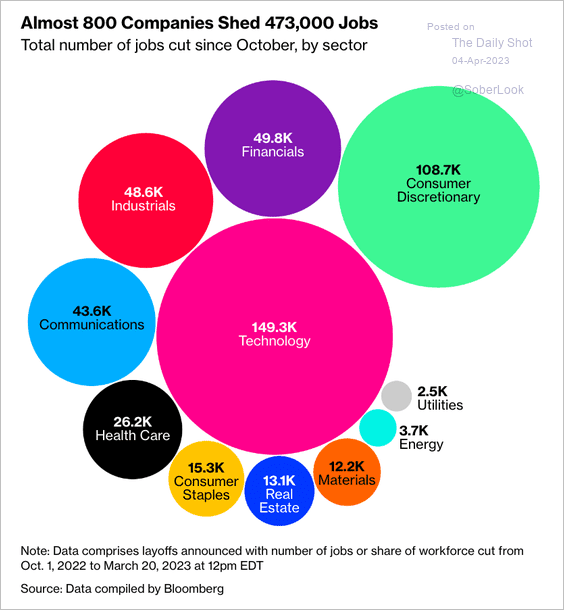 Source: @BBGVisualData Read full article
4. The NASA budget’s biggest beneficiaries:
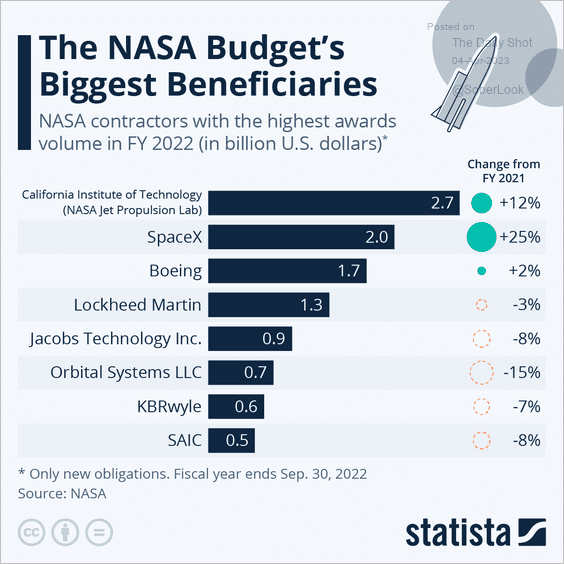 Source: Statista
5. EV share of global auto sales:
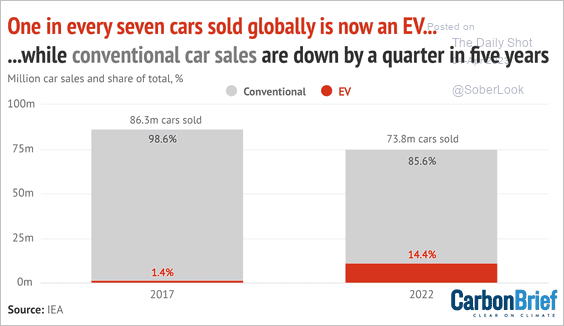 Source: @DrSimEvans, @IEA
6. US population growth:
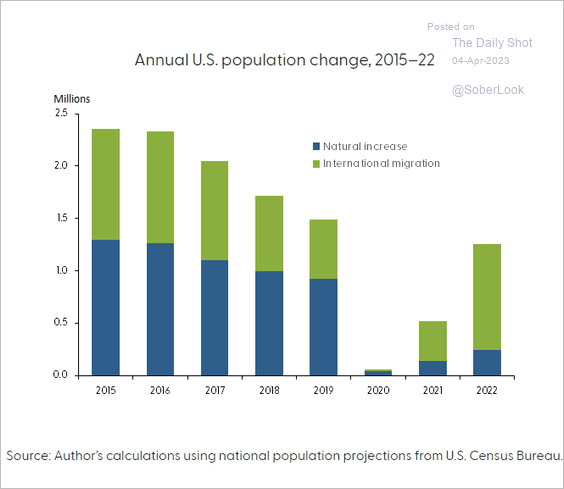 Source: @sffed Read full article
7. Waiting for your fast-food order:
 Source: @CivicScience Read full article
——————–
Back to Index