
The Daily Shot: 10-Apr-23
• The United States
• The United Kingdom
• Europe
• Emerging Markets
• Commodities
• Energy
• Equities
• Credit
• Global Developments
• Food for Thought
The United States
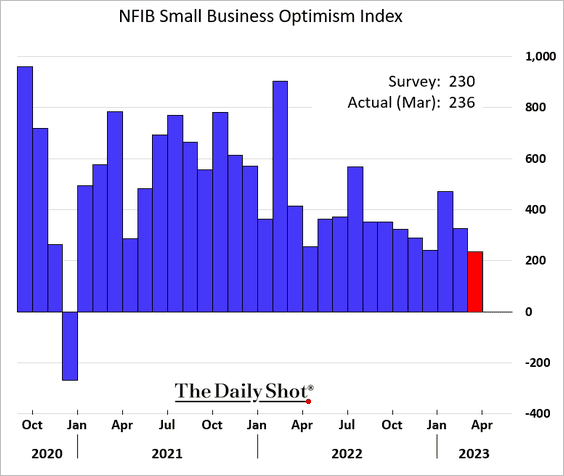
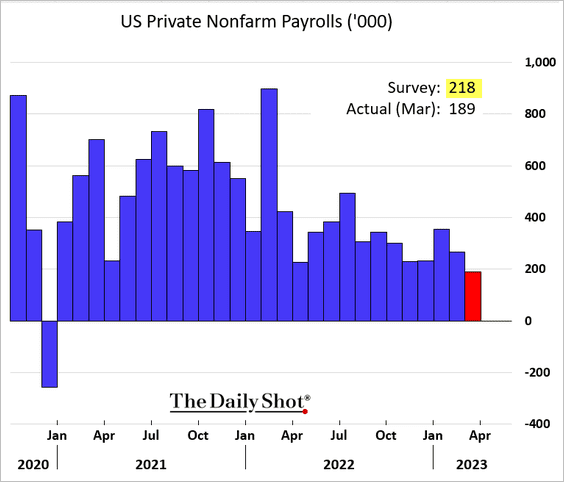
1. The jobs report showed some cooling last month, but the labor market remains resilient for now.
• Private employment gains were below expectations.
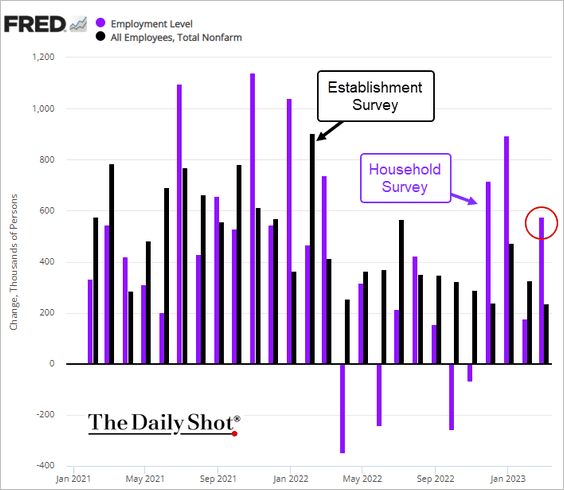
• Job gains based on the Household Survey outpaced the headline measure.
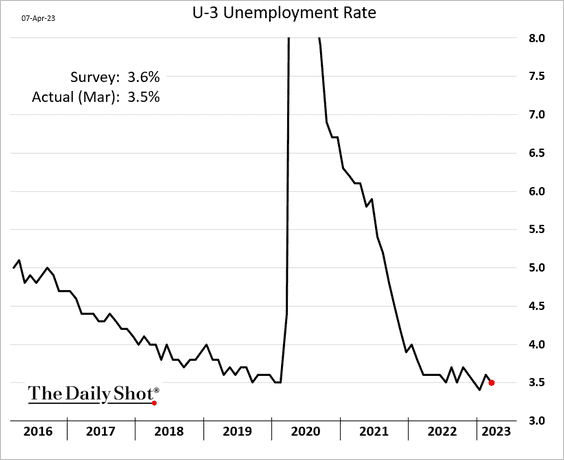
• The unemployment rate is back at 3.5%, suggesting that the labor market remains tight.
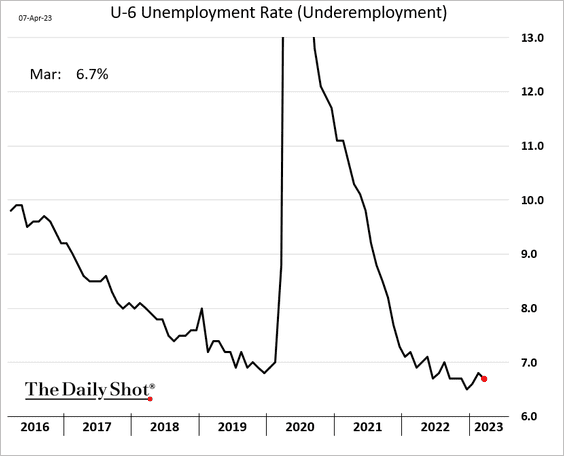
Underemployment declined as well.
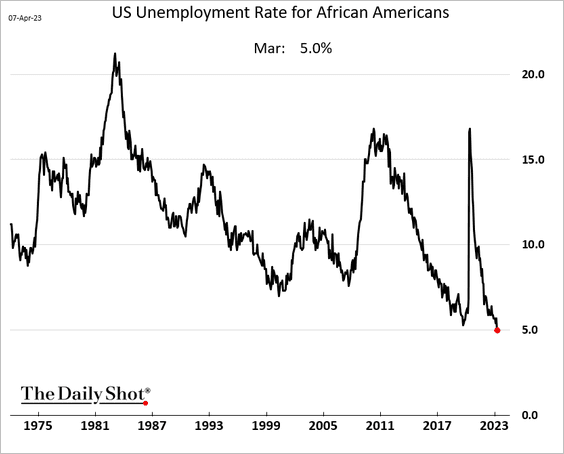
Unemployment among African Americans hit a record low.
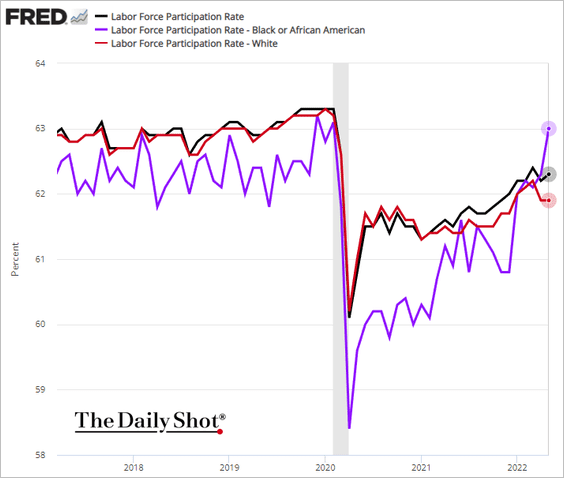
• Labor force participation continues to rebound …
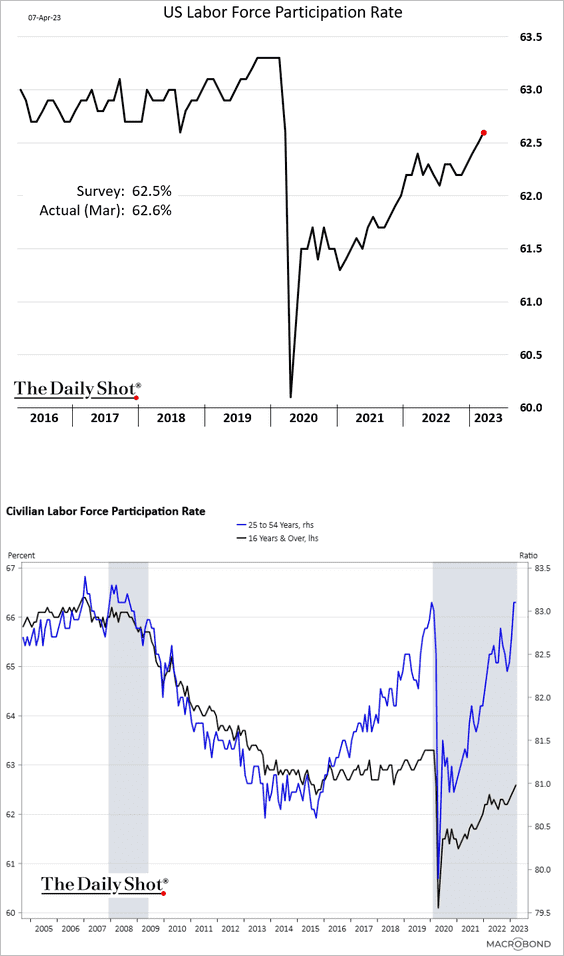
… and is now in line with the demographic trend.
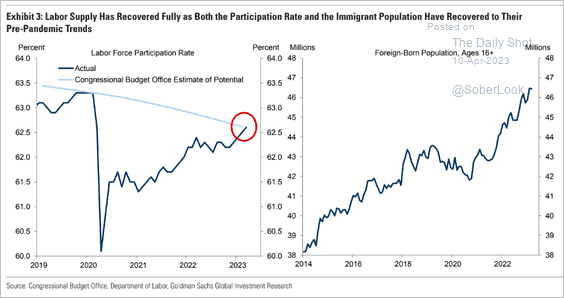 Source: Goldman Sachs
– Labor force participation among African Americans is back at pre-COVID levels.
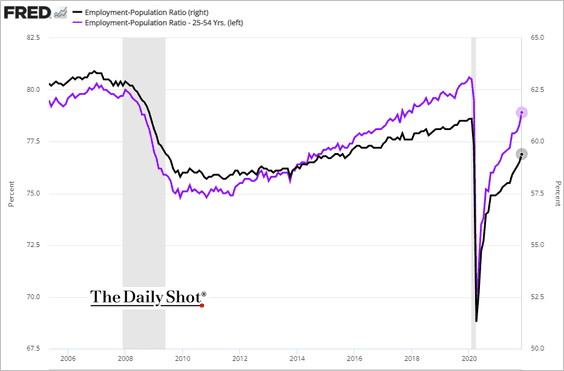
– Here is the employment-to-population ratio (total and prime-age).
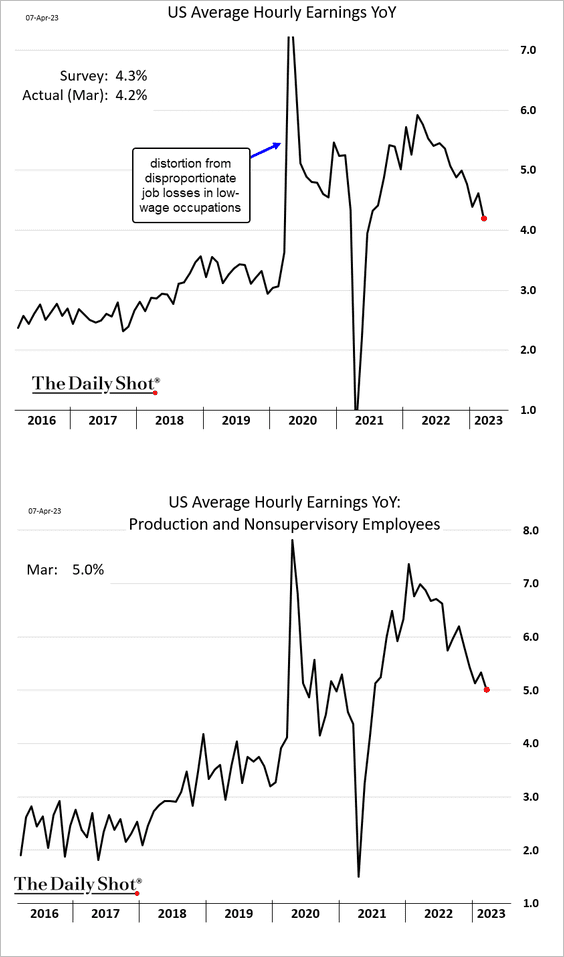
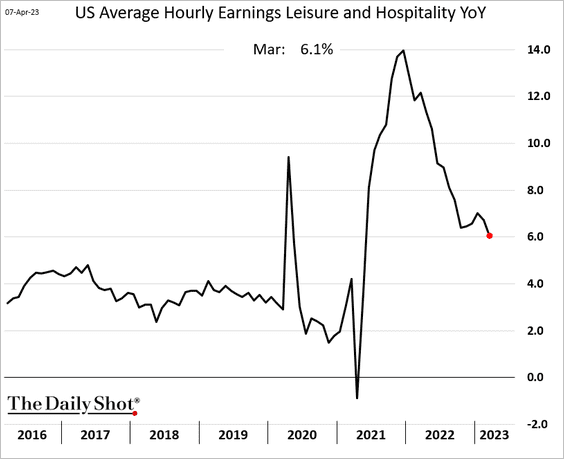
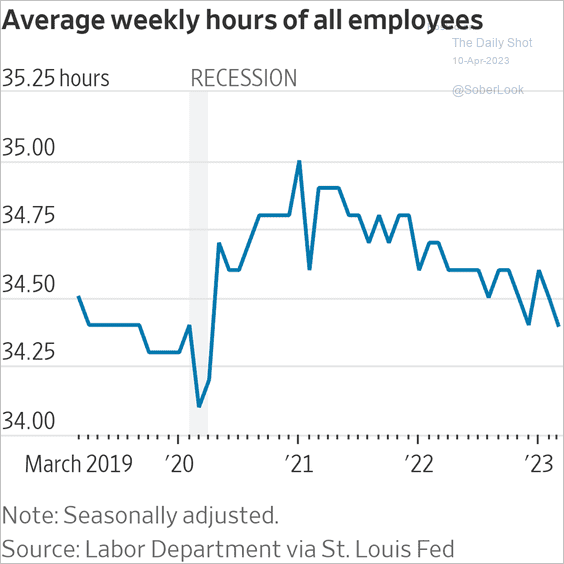
• Wage growth continues to moderate.
• Weekly hours declined.
 Source: @WSJ Read full article
We will have more on the jobs report later this week.
——————–
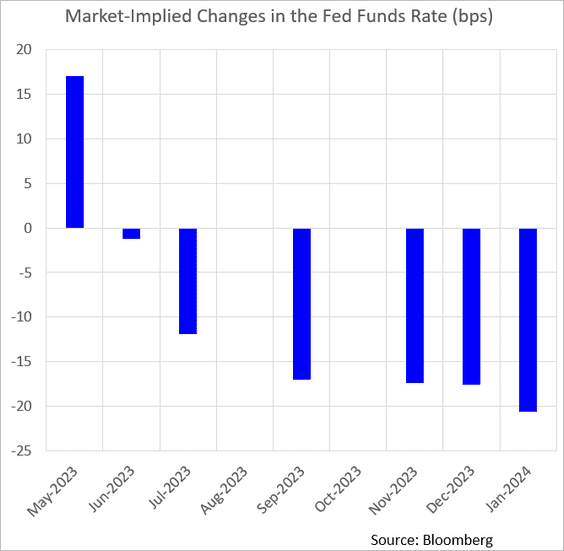
2. Treasury yields jumped in response to the employment report, …
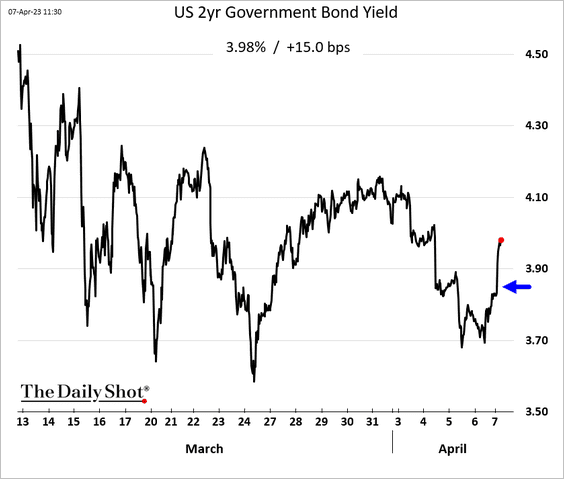
… with the market pricing in a (roughly) 70% chance of another Fed rate hike in May.
——————–
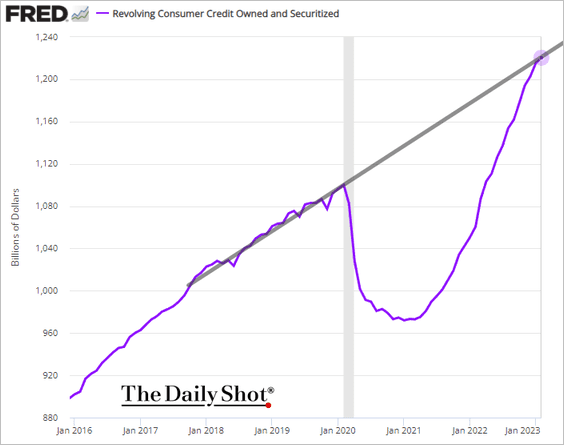
3. Consumer credit growth was softer than expected in February.
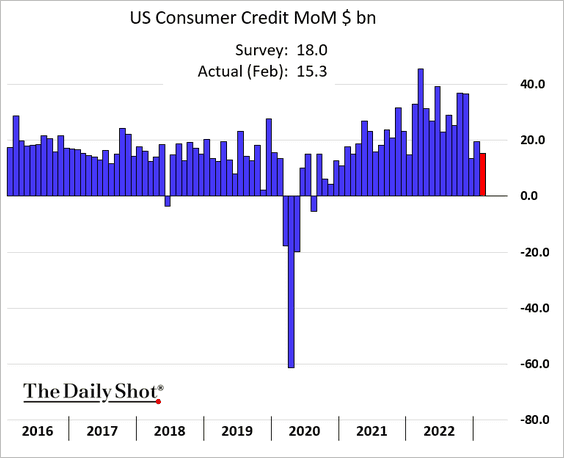
• Credit card debt is now in line with the pre-COVID trend.
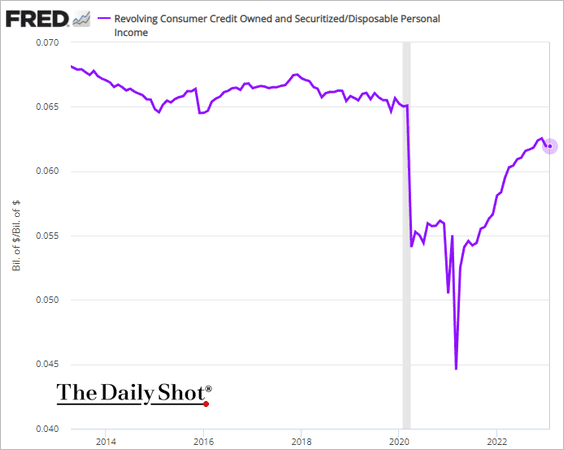
• This chart shows credit card debt as a share of disposable personal income.
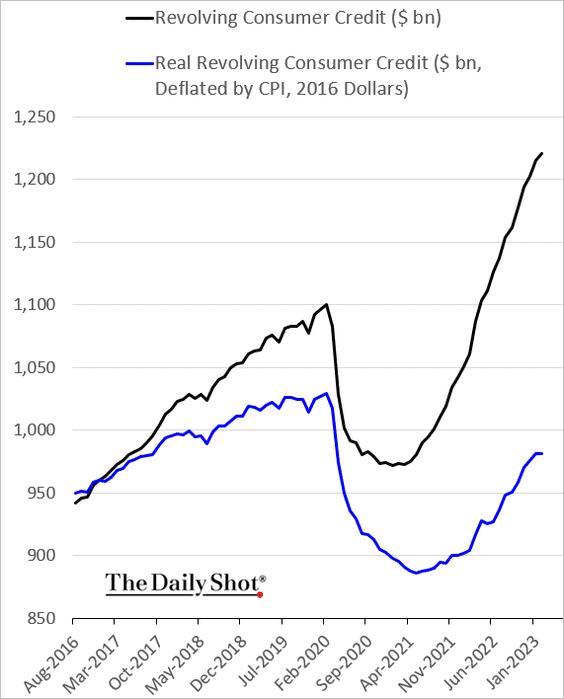
• Real credit card debt was flat in February.
——————–
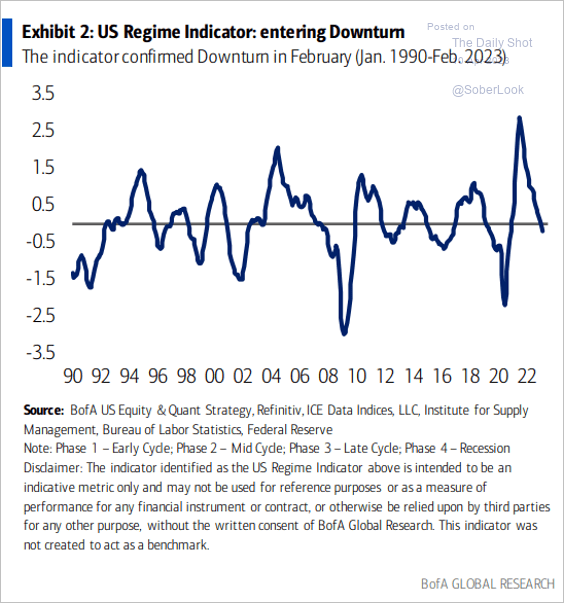
4. BofA’s Regime Indicator suggests that the economy has entered a downturn.
 Source: BofA Global Research
5. US money market funds’ balances are not elevated relative to equity and bond market values.
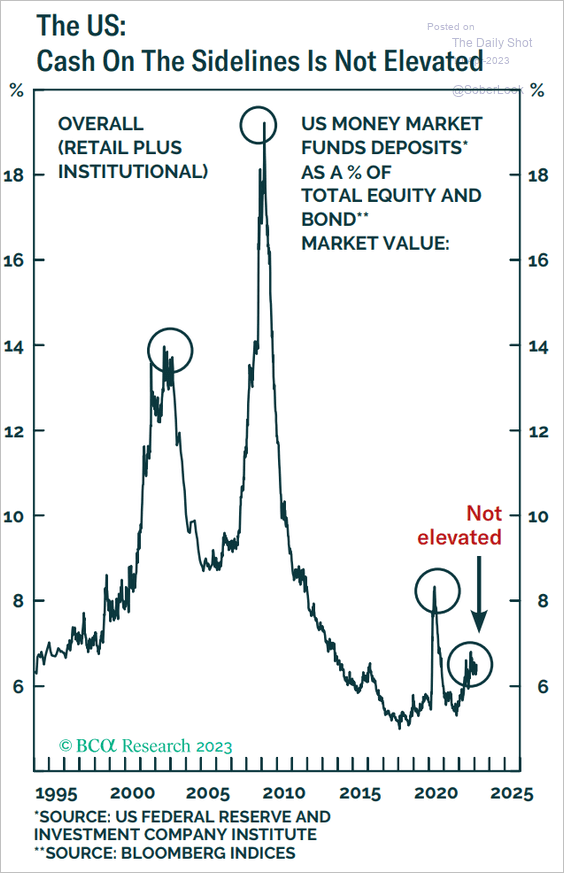 Source: BCA Research
Back to Index
The United Kingdom
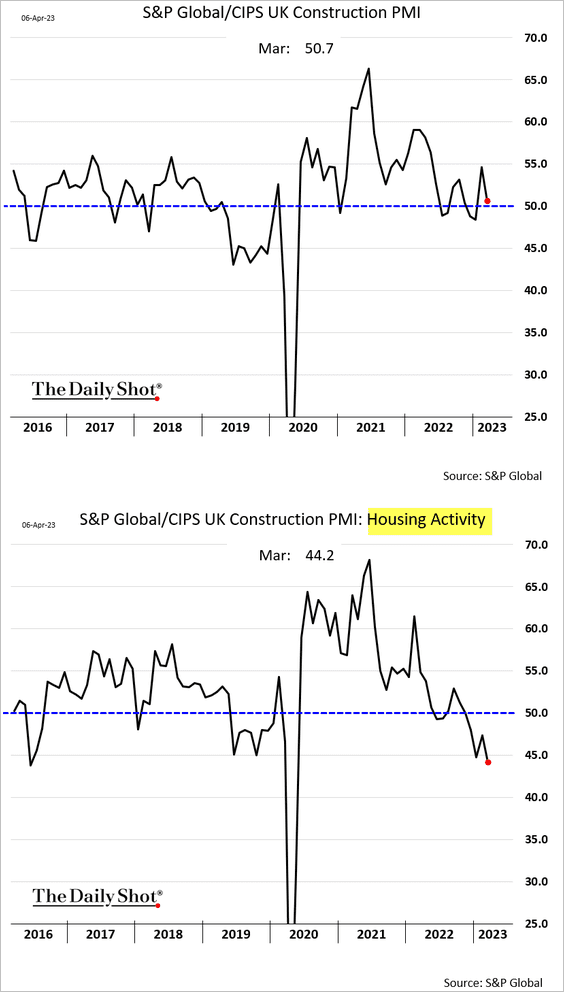
1. The overall construction activity held in growth mode last month. However, housing-related construction is crashing.
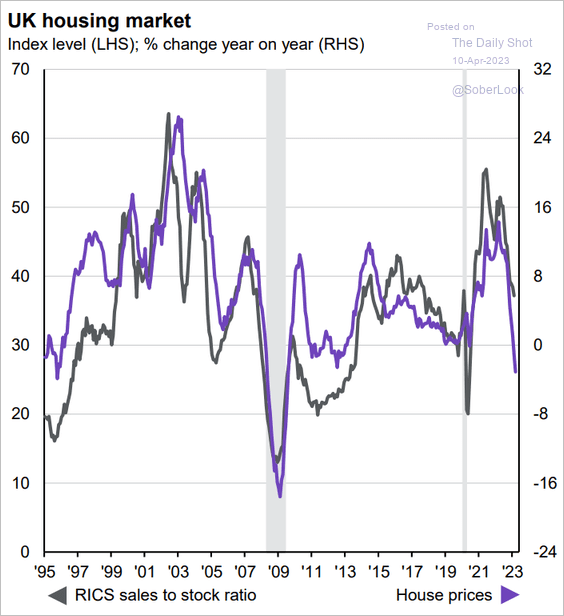
2. Home prices are now probably in negative territory on a year-over-year basis.
 Source: J.P. Morgan Asset Management
Back to Index
Europe
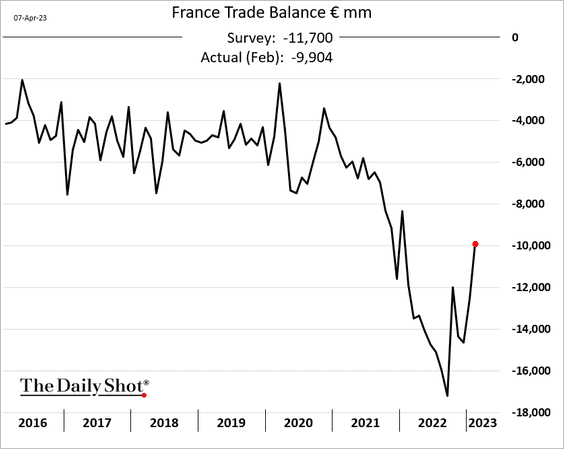
1. French trade deficit has been narrowing rapidly as energy costs ease.
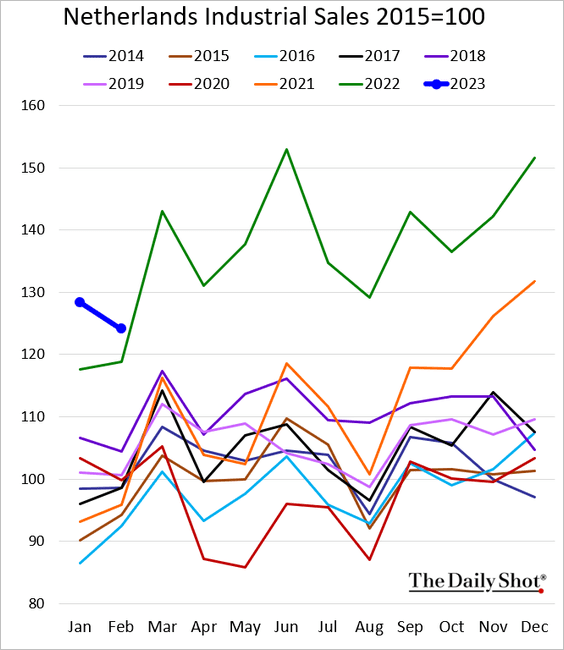
2. Dutch industrial sales declined in February but remain at multi-year highs for this time of the year.
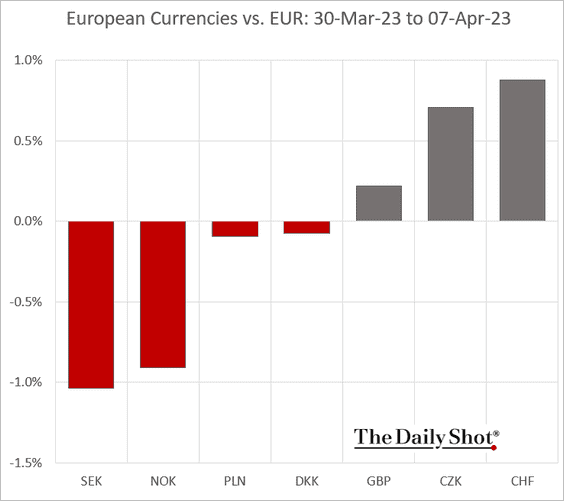
3. This chart shows how European currencies performed against the euro last week.
4. Finally, we have some data on natural gas usage. It’s an impressive achievement.
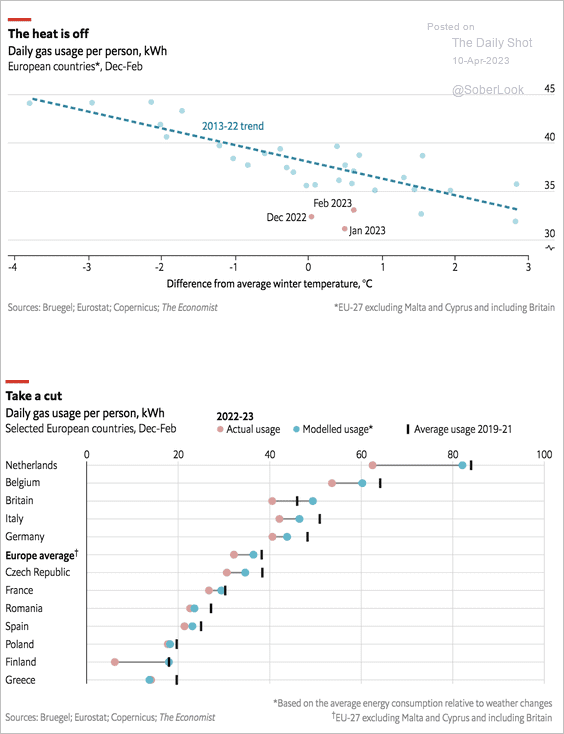 Source: The Economist Read full article
Back to Index
Emerging Markets
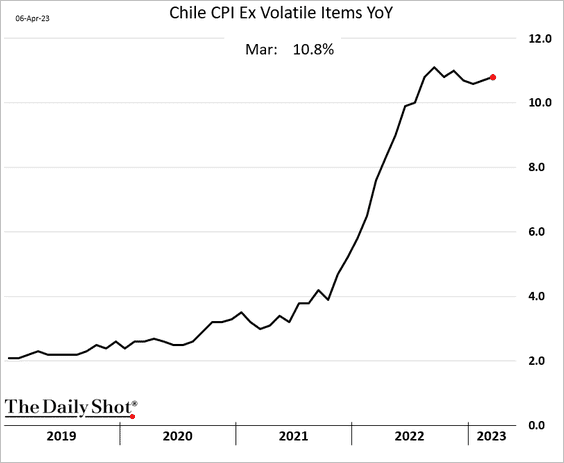
1. Chile’s inflation is moderating, …
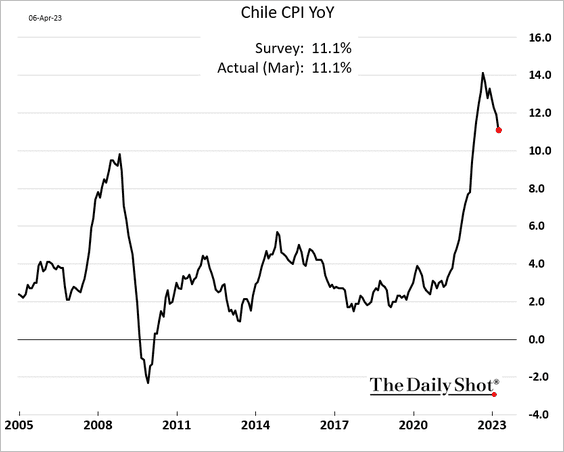
… but the core CPI remains elevated.
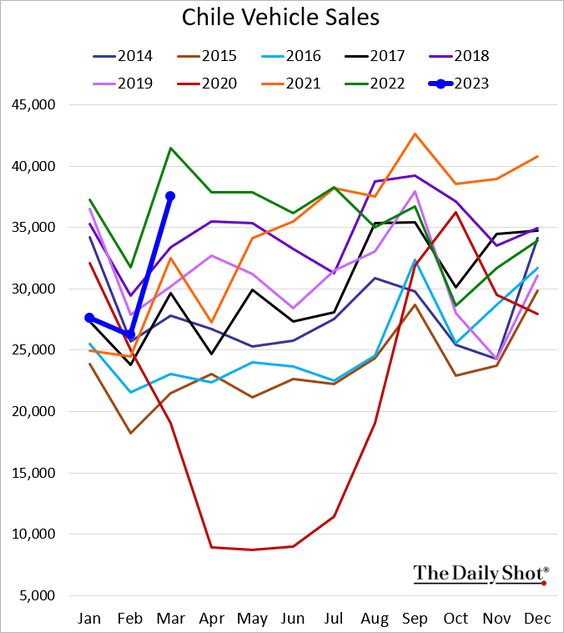
• Vehicle sales are rebounding.
——————–
2. Real rates in LatAm remain elevated.
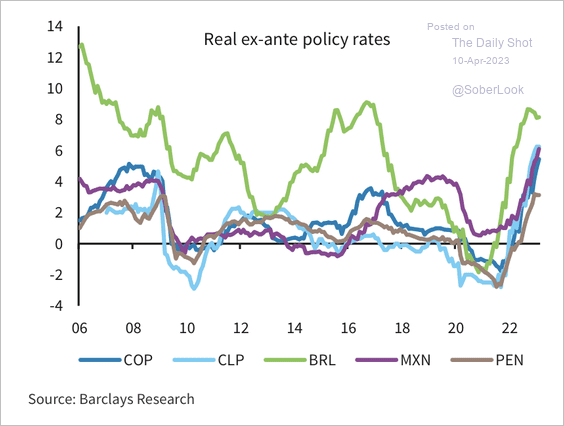 Source: Barclays Research
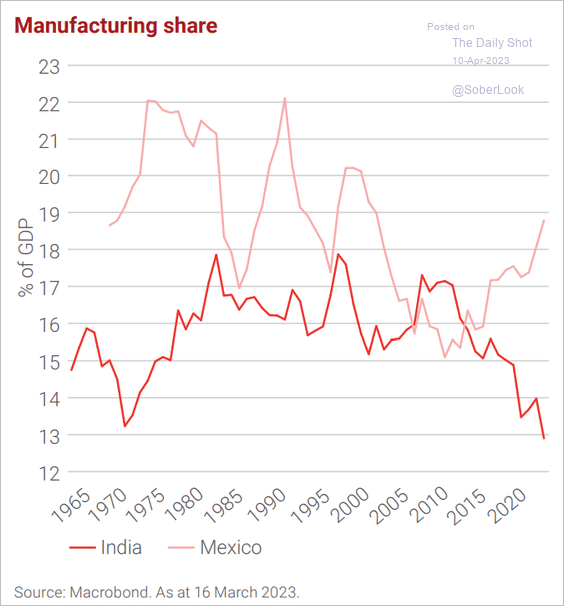
3. This chart shows India’s and Mexico’s manufacturing share over time.
 Source: LGIM
4. Pakistan’s international bonds remain under pressure amid uncertainties around IMF funding and political instability.
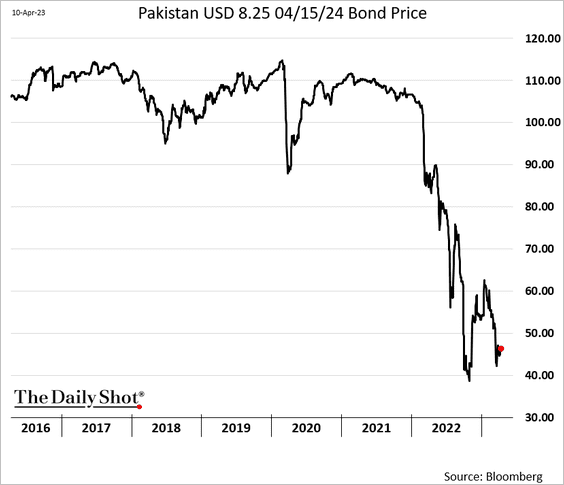
 Source: Reuters Read full article
——————–
5. EM carry trades are popular once more as the Fed nears a pause.
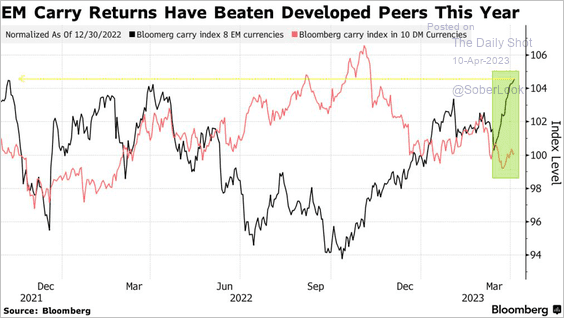 Source: @ByMattBurgess, @markets Read full article
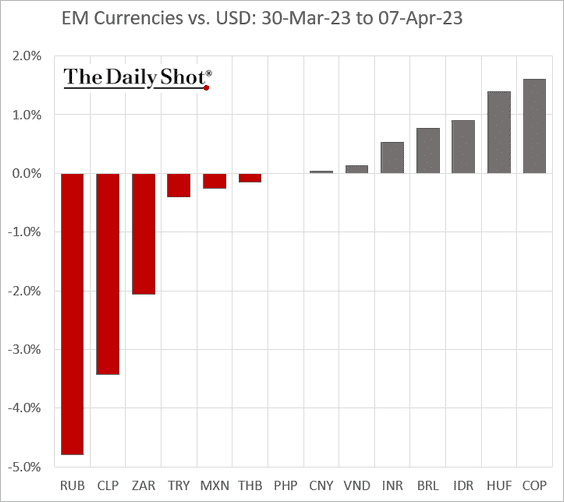
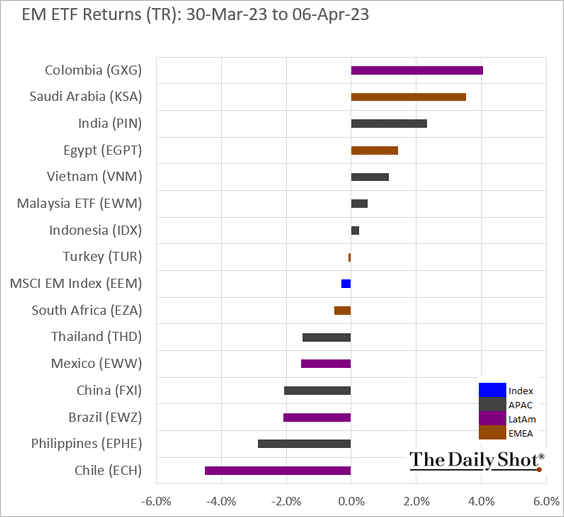
6. Next, we have some performance data from last week.
• Currencies:
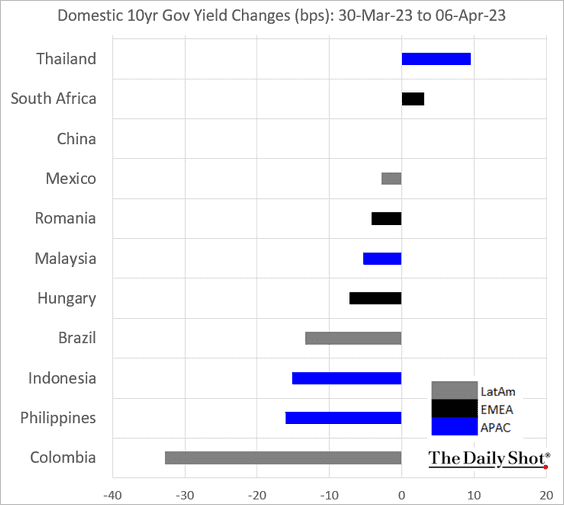
• Bond yields:
• Equity ETFs:
Back to Index
Commodities
1. Food prices remain elevated, while energy prices have eased.
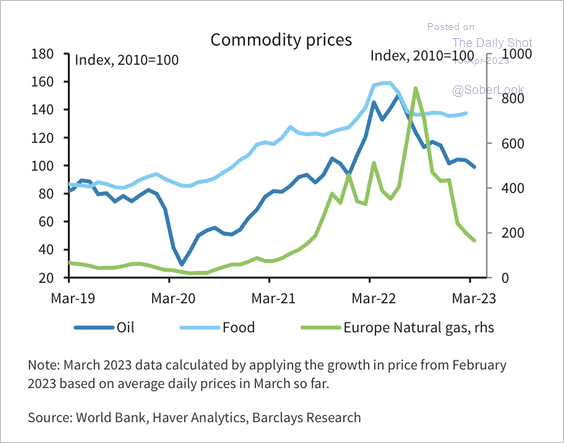 Source: Barclays Research
2. Memory chip prices continue to fall.
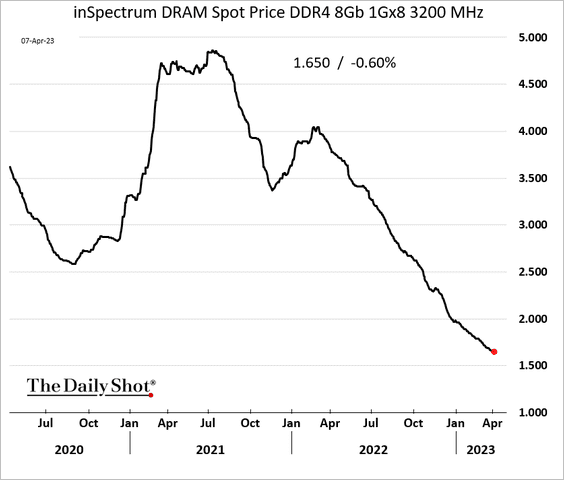
Samsung is cutting memory chip production as profits shrink.
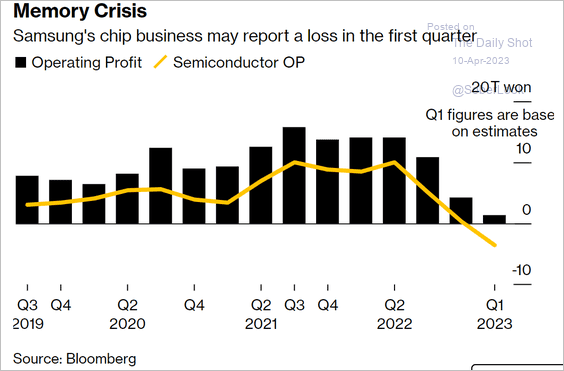 Source: @soheefication, @YKreports, @technology Read full article
——————–
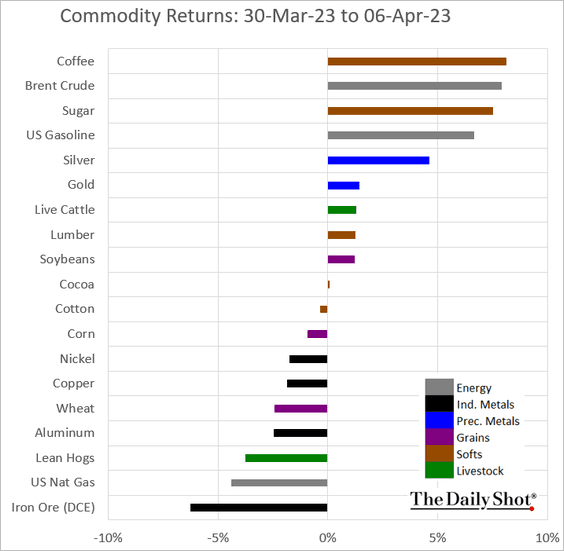
3. Here is last week’s performance across key commodity markets.
Back to Index
Energy
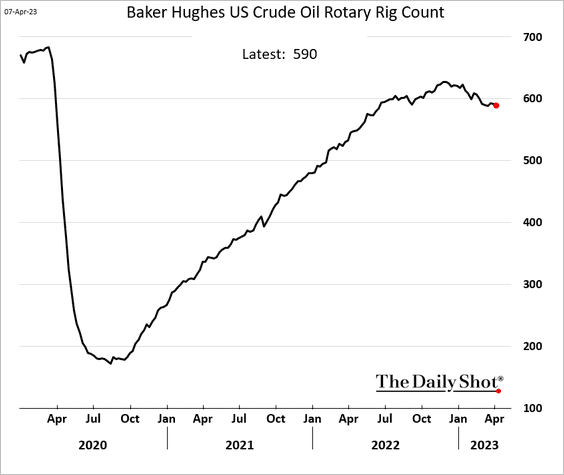
1. Growth in US oil rigs has stalled.
2. European natural gas inventories remain elevated.
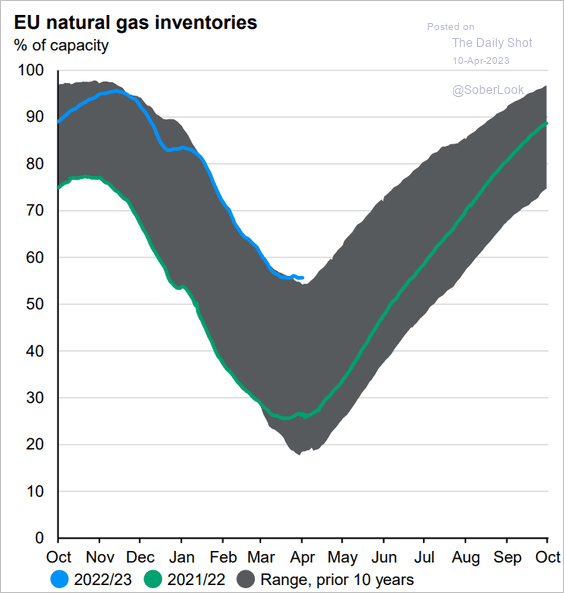 Source: J.P. Morgan Asset Management
Back to Index
Equities
1. Cyclical stocks’ relative performance has diverged from the ISM PMI (not pricing in the downturn).
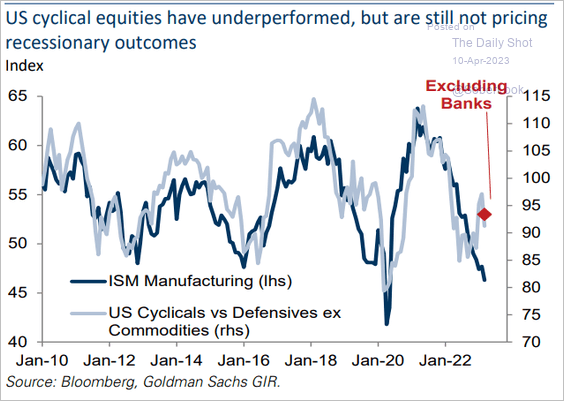 Source: Goldman Sachs
2. The S&P 500 experienced a strong breadth thrust (a sudden shift from declining stocks to advancing stocks) to start the year, which typically precedes further upside momentum
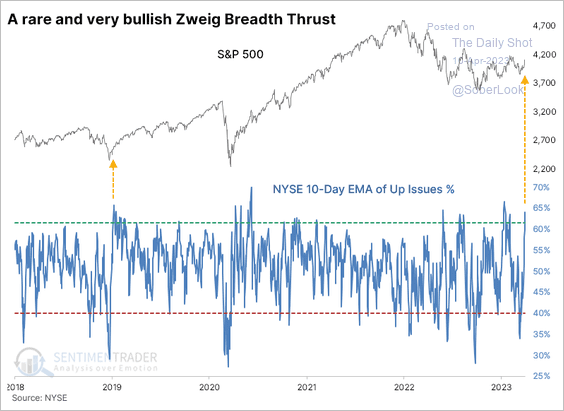 Source: SentimenTrader
SentimenTrader’s market indicator triggered a risk-on signal for stocks.
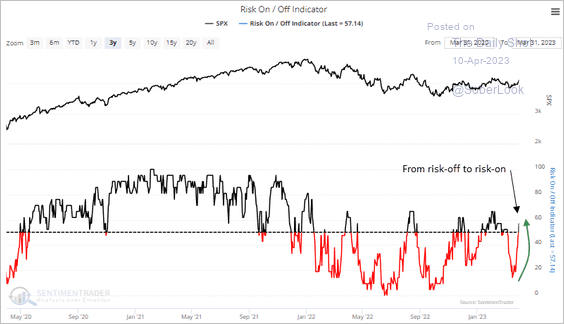 Source: SentimenTrader
——————–
3. US equity valuations continue to surpass both international peers and long-term averages.
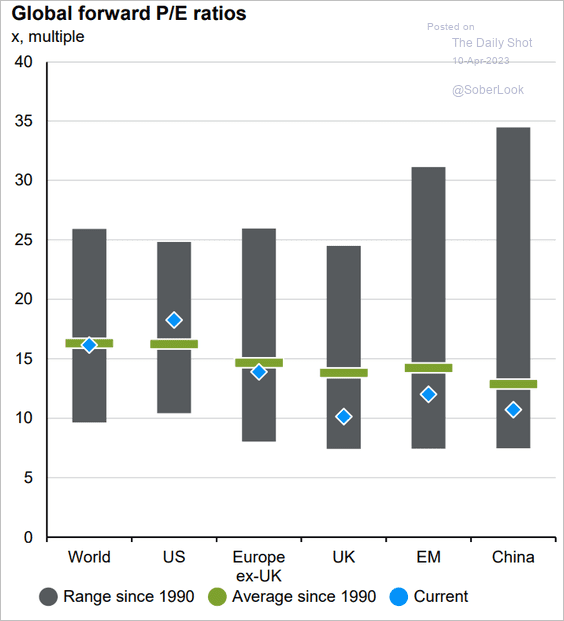 Source: J.P. Morgan Asset Management
Consequently, the outlook for longer-term returns appears lackluster.
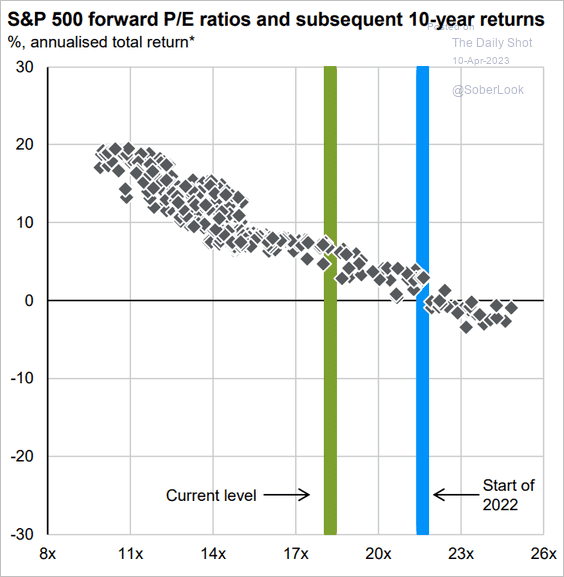 Source: J.P. Morgan Asset Management
——————–
4. Shorting bank shares has been lucrative, but has it become a crowded trade?
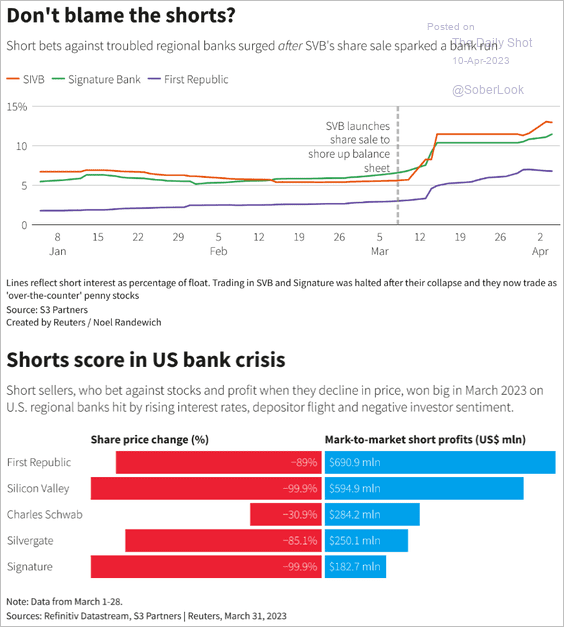 Source: Reuters Read full article
5. The strong outperformance in tech stocks looks extended.
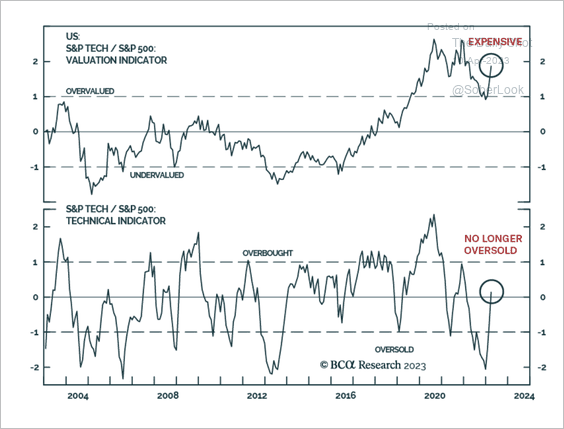 Source: BCA Research
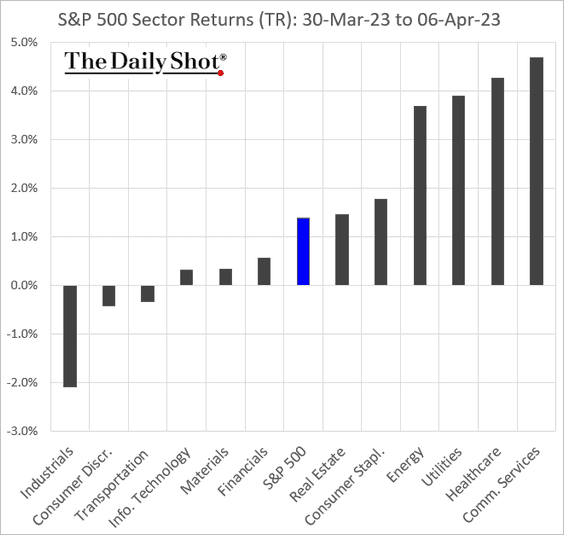
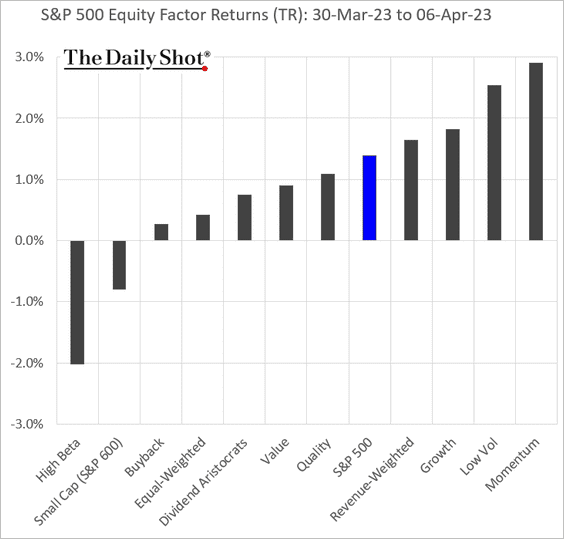
6. Next, we have some performance data from last week.
• Sectors:
• Equity factors:
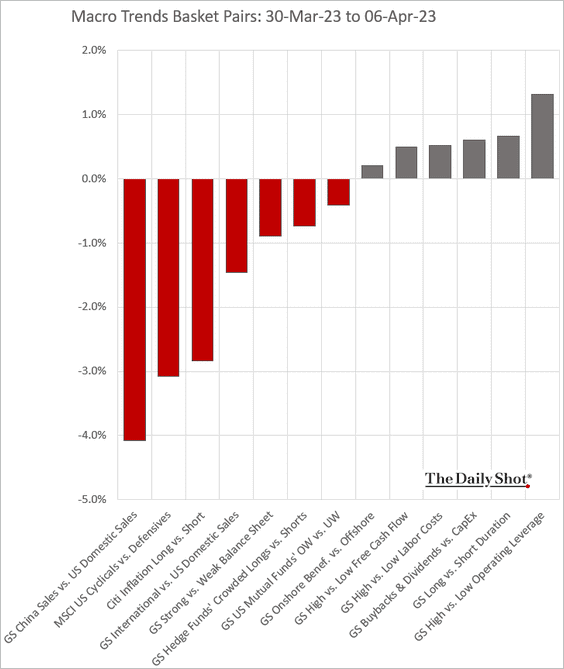
• Macro basket pairs’ relative performance:
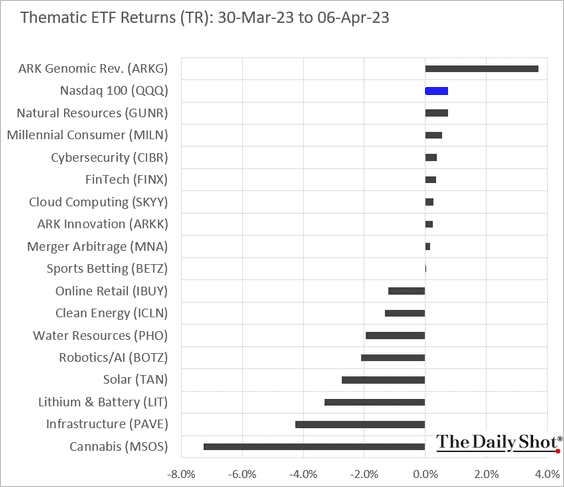
• Thematic ETFs:
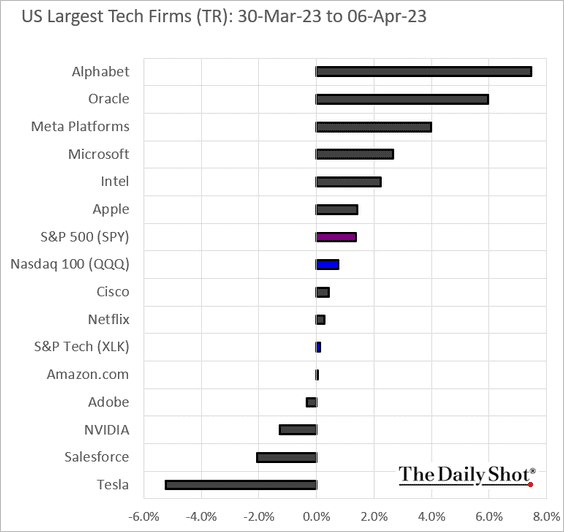
• Largest tech firms:
Back to Index
Credit
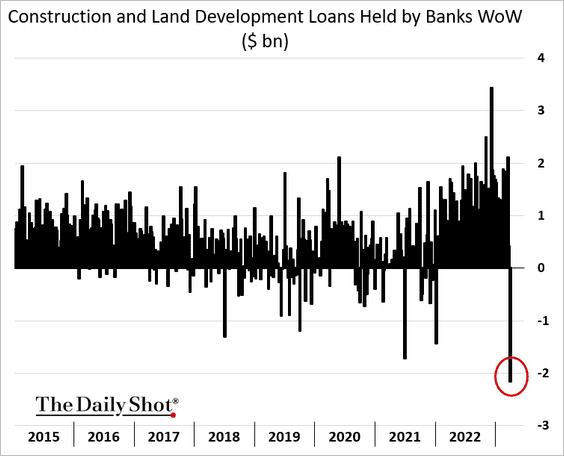
1. US bank loan balances declined again at the end of last month.
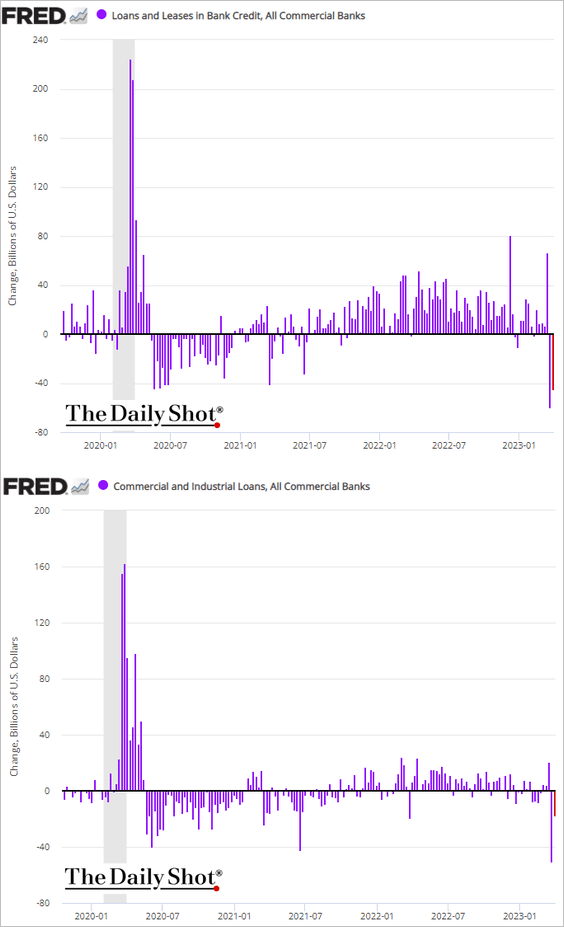
Construction loans were down sharply.
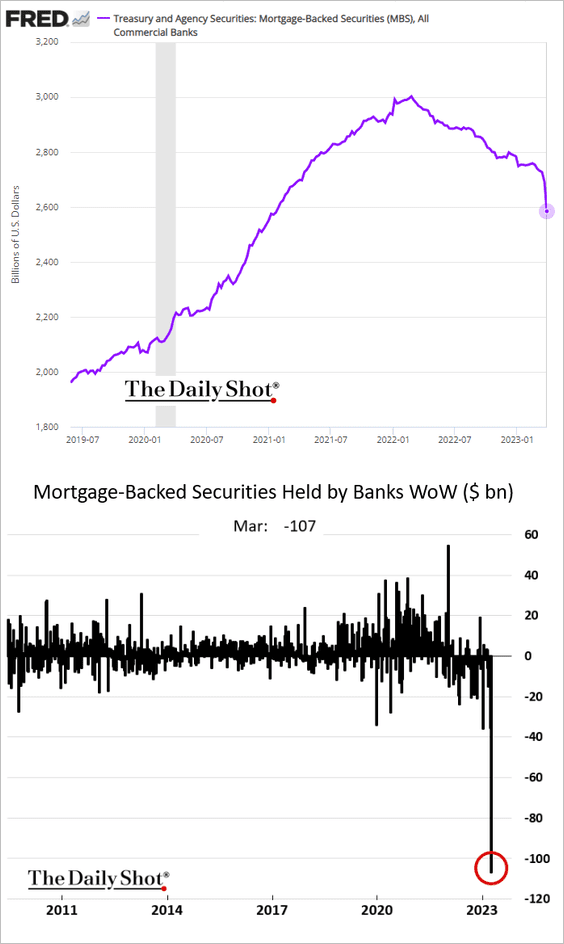
• MBS balances plummeted.
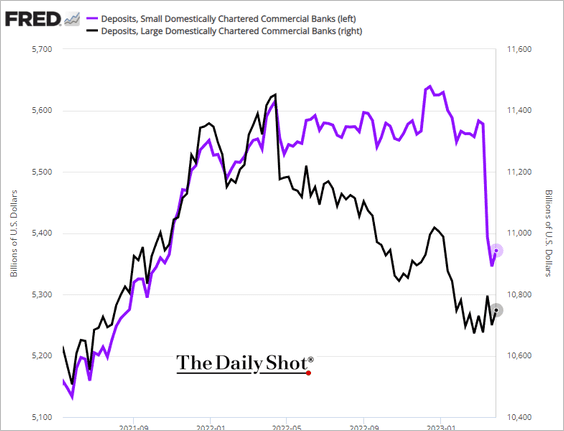
• Domestic banks’ deposits increased, …
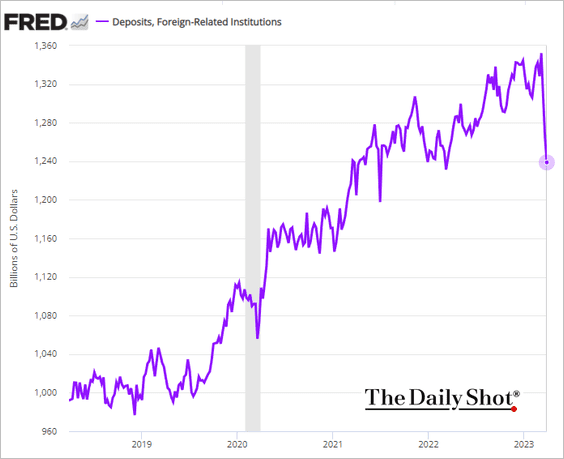
… but foreign banks lost over $110 bn in USD deposits since the start of the banking turmoil (through the end of March).
——————–
2. FHLB bond Issuance surged last month, with proceeds used to provide financing to smaller banks (in addition to the Fed’s discount window and the new emergency facility).
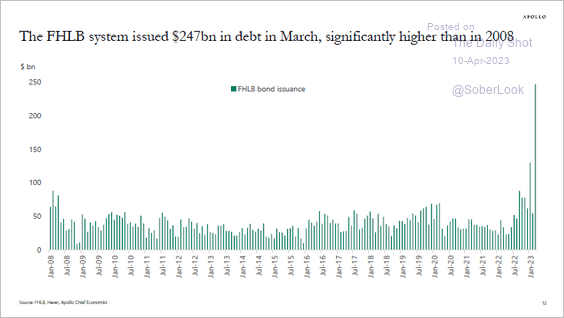 Source: Torsten Slok, Apollo
3. A sharp contraction in business lending looms.
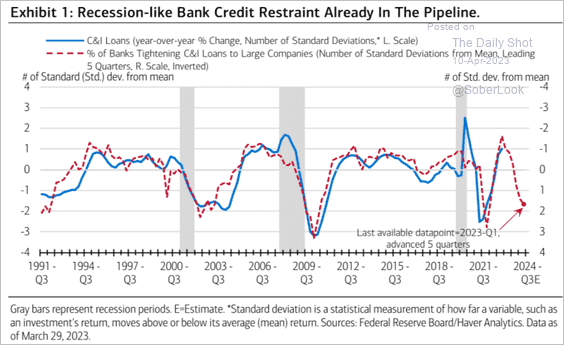 Source: Merrill Lynch
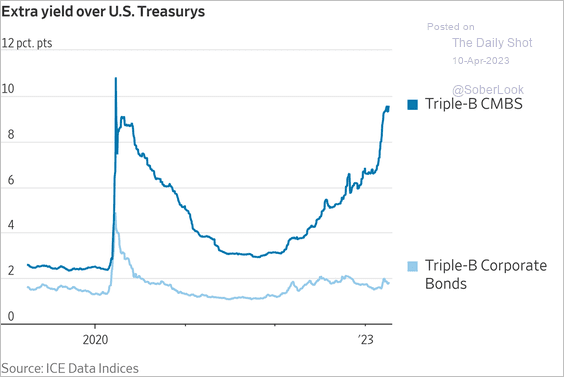
4. CMBS spreads remain elevated, …
 Source: @WSJ Read full article
… amid concerns around office properties.
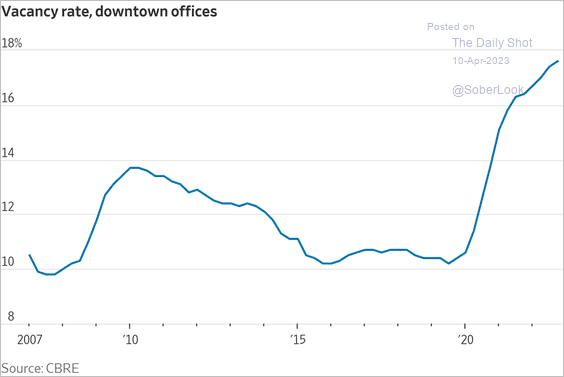 Source: @WSJ Read full article
——————–
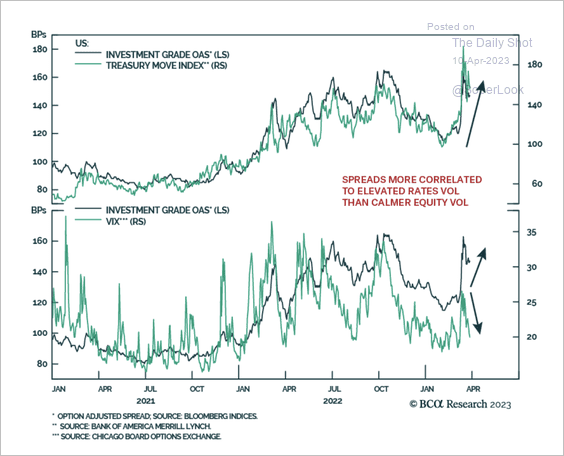
5. Corporate credit spreads are more correlated with Treasury volatility than equity volatility.
 Source: BCA Research
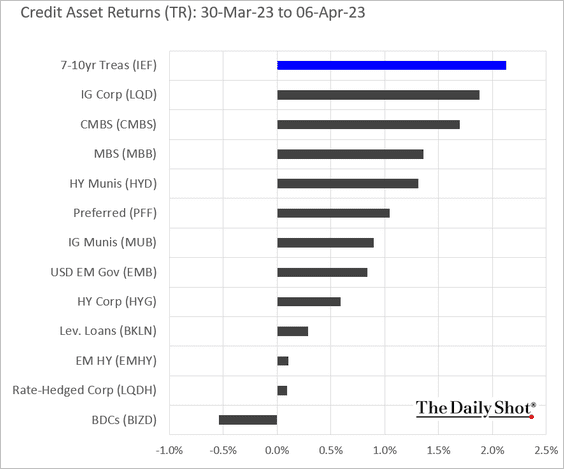
6. Finally, we have some performance data from last week.
Back to Index
Global Developments
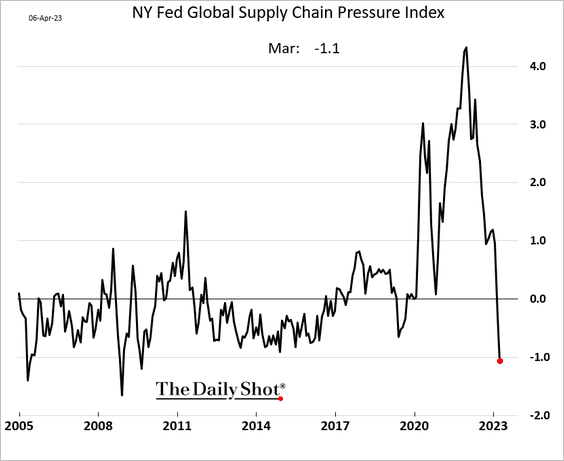
1. Supply chain pressures continue to ease.
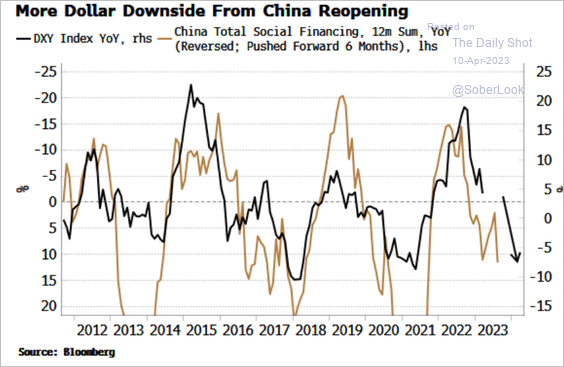
2. China’s credit expansion tends to be a headwind for the US dollar.
 Source: Simon White, Bloomberg Markets Live Blog
3. This chart shows financial stability indices for G10 currencies. Economies to the far right have a higher sensitivity to their own rate hike cycle because of the maturity structure of household loans and high leverage, according to Barclays.
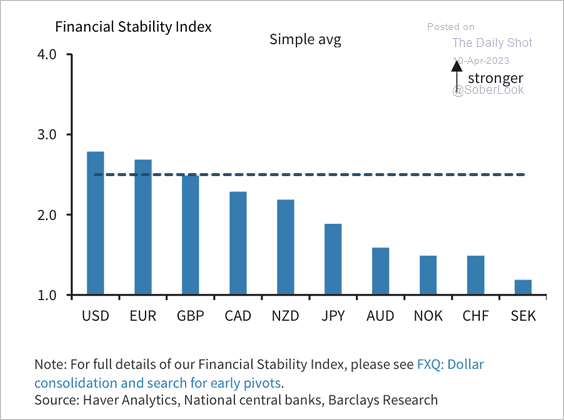 Source: Barclays Research
4. Next, we have the commercial property loan share in select economies.
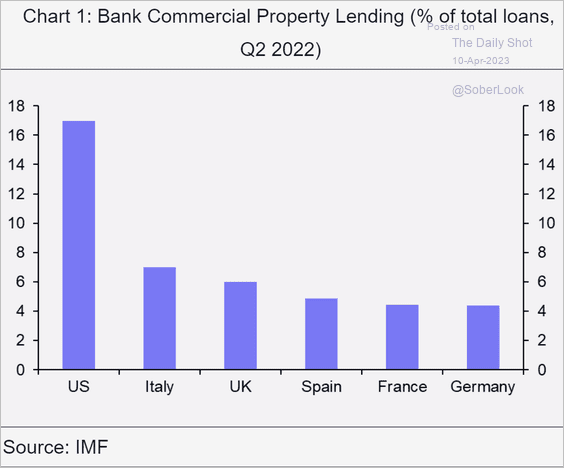 Source: Capital Economics
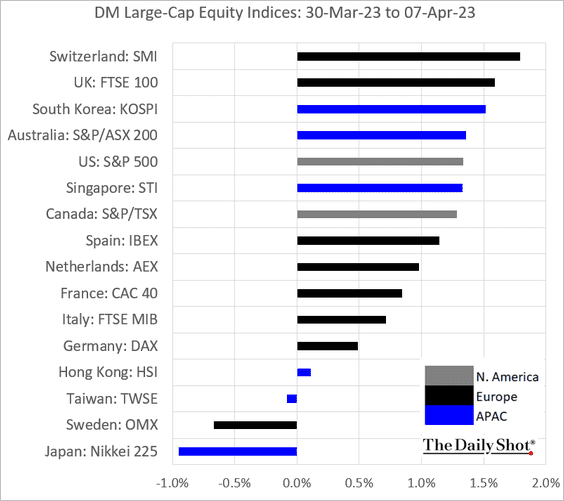
5. Finally, here is a look at last week’s performance.
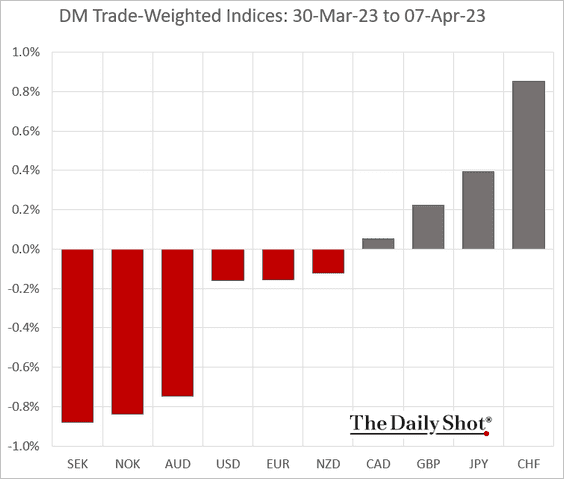
• Currency indices:
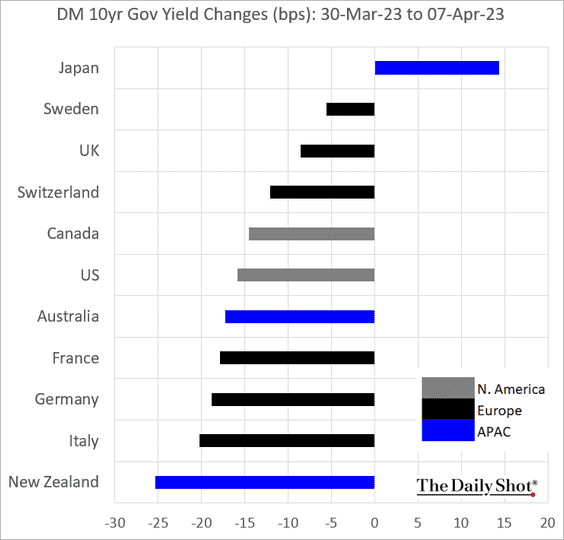
• Bond yields:
• Large-cap equity indices:
——————–
Food for Thought
1. Work flexibility in financial services:
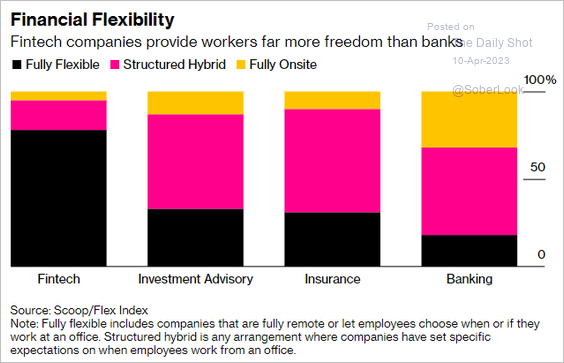 Source: @bizboyle, @thefuture Read full article
2. Job postings on Indeed in select sectors
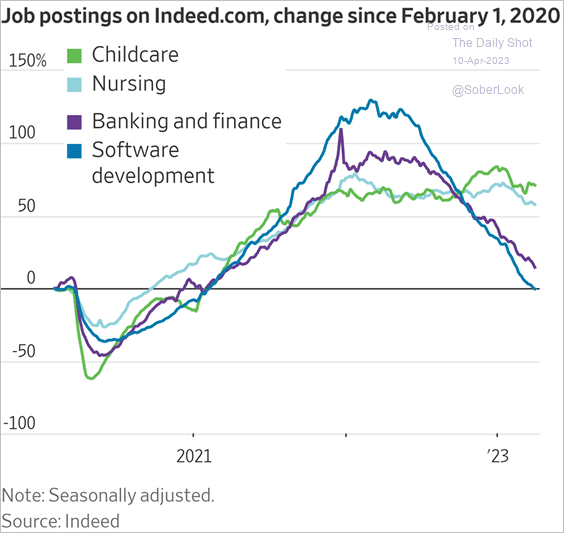 Source: @WSJ Read full article
3. Price trends for monkeys in laboratory research:
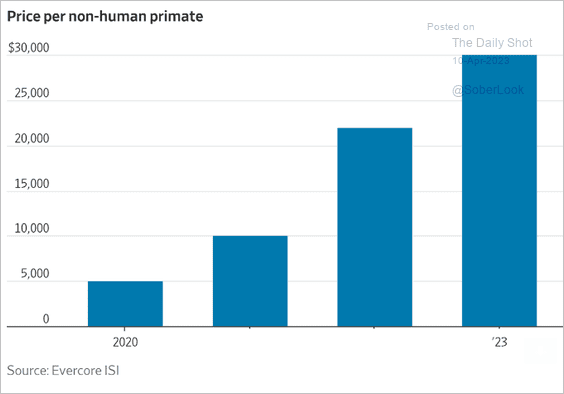 Source: @WSJ Read full article
4. Concerns about gun violence:
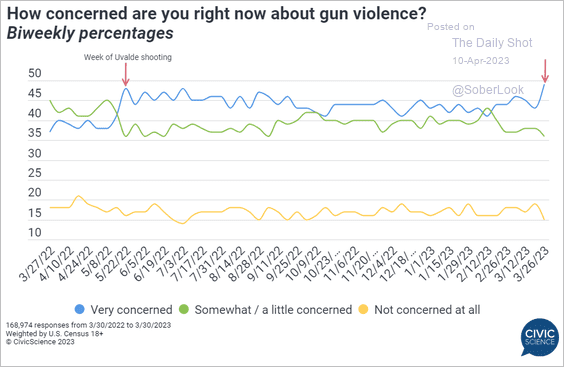 Source: @CivicScience Read full article
5. US immigration courts’ pending cases:
 Source: @chartrdaily
6. Greek shipping oligarchs helping Putin build his shadow fleet (by selling him their ships):
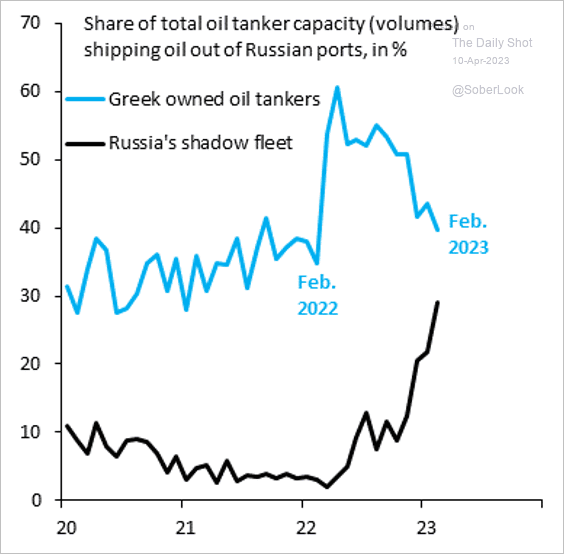 Source: @RobinBrooksIIF, @JonathanPingle
7. Top-selling Easter candies:
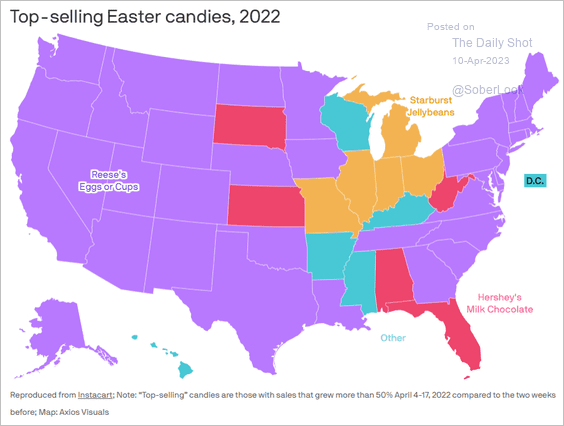 Source: @axios Read full article
——————–
Back to Index