The Daily Shot: 14-Apr-23
• The United States
• The United Kingdom
• The Eurozone
• Asia-Pacific
• Emerging Markets
• Commodities
• Energy
• Equities
• Credit
• Rates:
• Global Developments
• Food for Thought
The United States
1. Let’s begin with some updates on inflation.
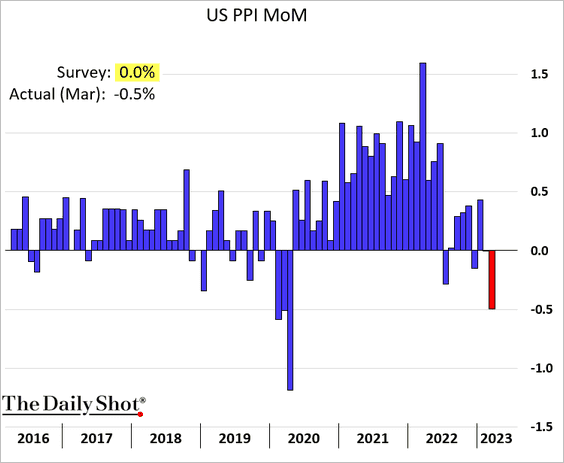
• The PPI unexpectedly declined last month.
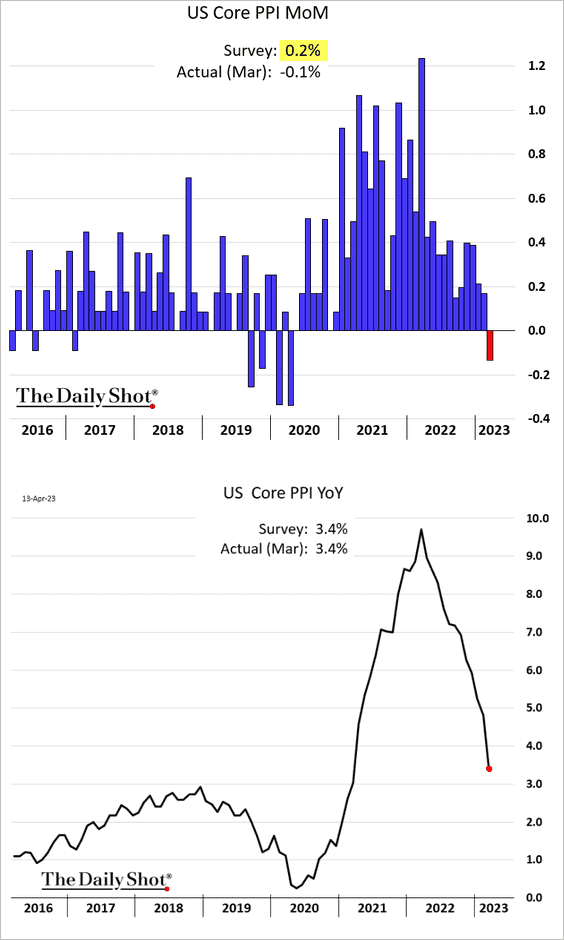
And so did the core PPI.
 Source: @readep, @economics Read full article
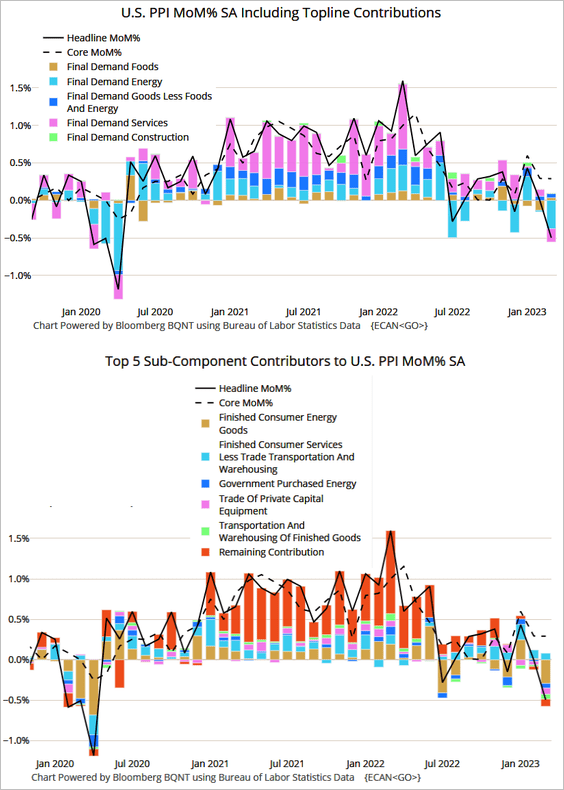
– Here are the contributions.
 Source: @TheTerminal, Bloomberg Finance L.P.
– Excluding the trade services component (business markups), the core PPI increase was the lowest since the initial COVID shock.
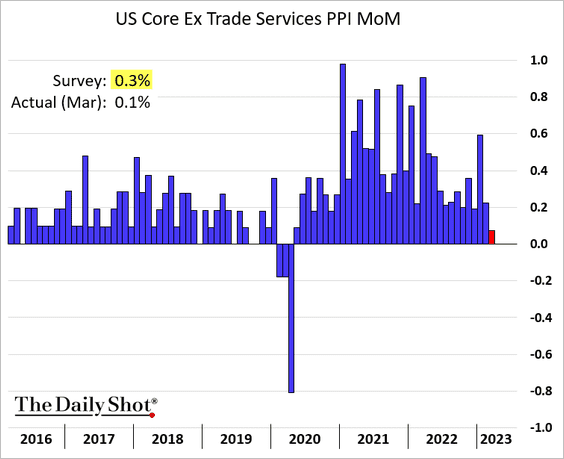
– The trade services PPI saw another sharp decline, pointing to weaker profit margins.
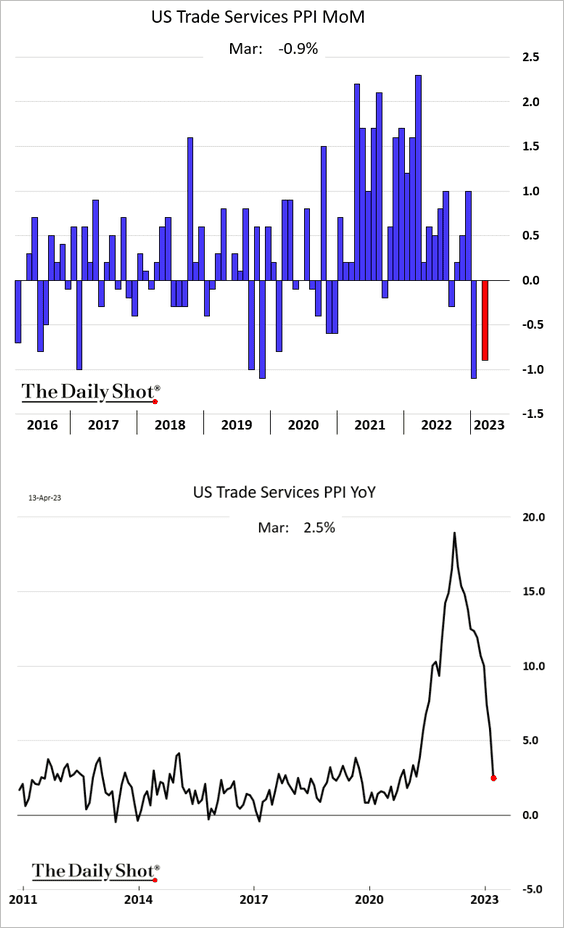
And there is more to go.
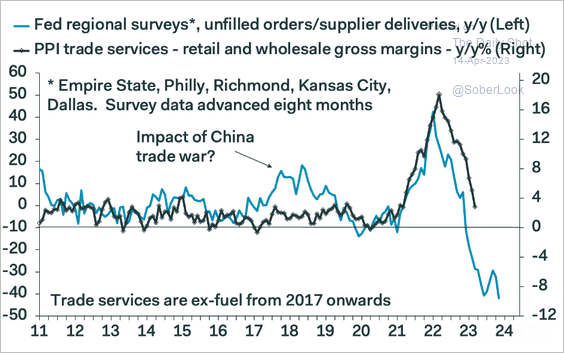 Source: Pantheon Macroeconomics
But the CPI-PPI spread is elevated (for now), which tends to be positive for corporate margins.

– Softening core PPI signals further declines in consumer inflation ahead.
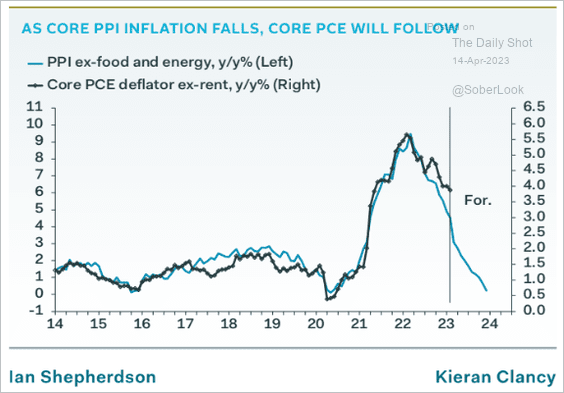 Source: Pantheon Macroeconomics
However, Nomura sees an increase in the supercore PCE inflation for March.
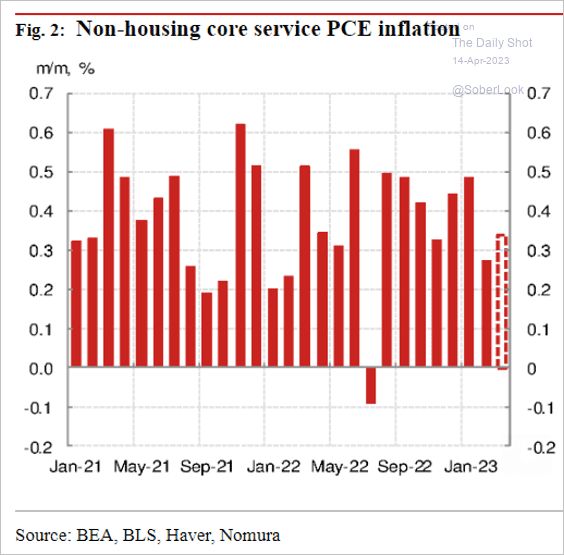 Source: Nomura Securities
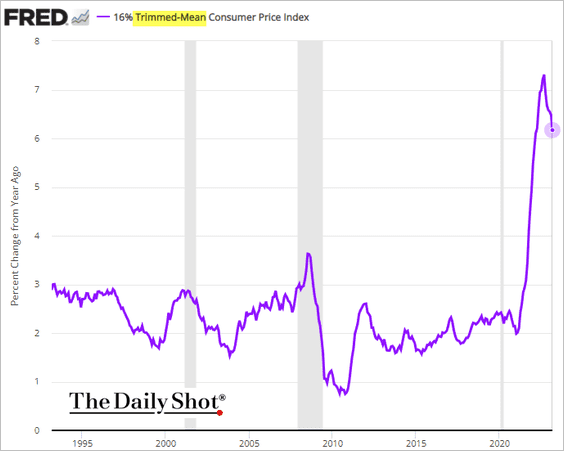
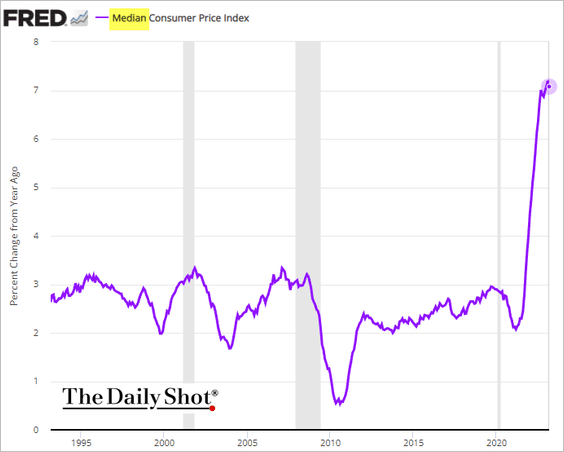
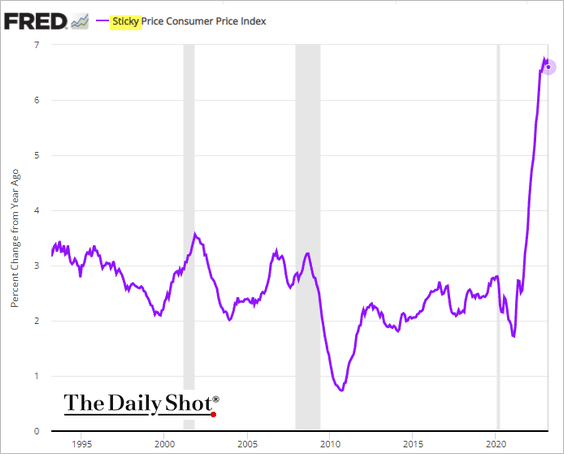
• Alternative measures of core CPI have peaked but are still running hot.
– Trimmed-mean CPI (year-over-year):
– Median CPI:
– Sticky CPI:
——————–
2. The Atlanta Fed’s wage growth tracker jumped in March, suggesting that wage growth remains elevated.
![]()
This chart shows wage growth for high- and low-skill workers.
![]() Source: @TheTerminal, Bloomberg Finance L.P.
Source: @TheTerminal, Bloomberg Finance L.P.
——————–
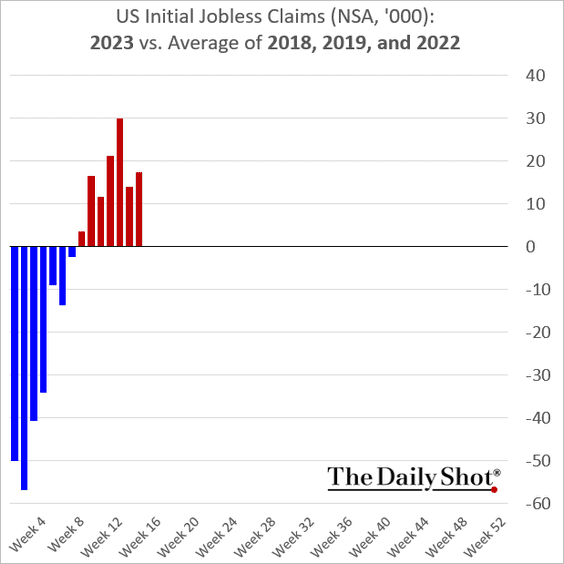
3. Initial jobless claims continue to run well above the average of 2018, 2019, and 2022.
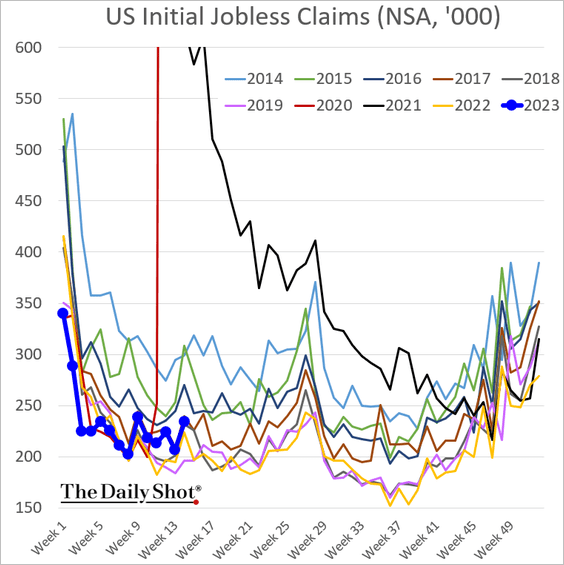
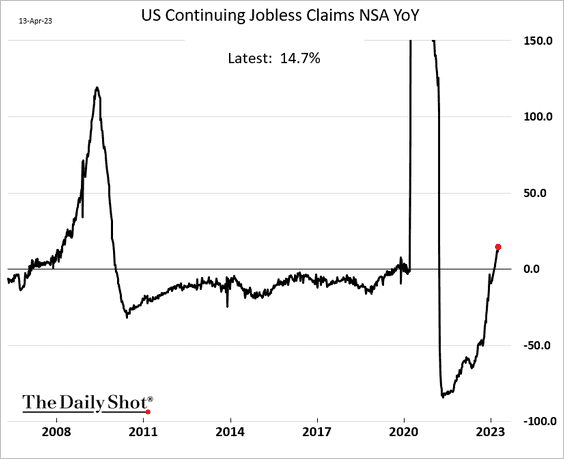
• Continuing claims are up almost 15% relative to last year.

• The number of states with continuing claims rising by over 30% keeps increasing.
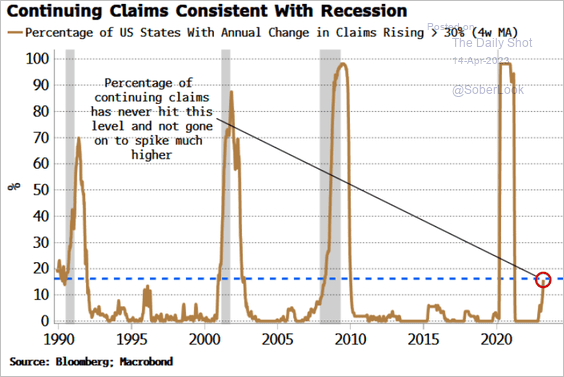 Source: Simon White, Bloomberg Markets Live Blog
——————–
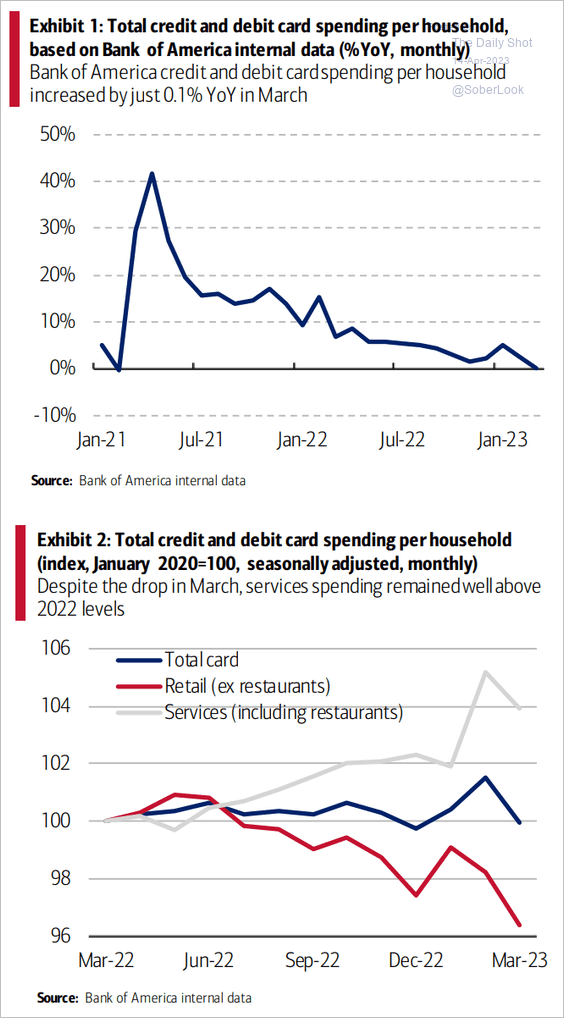
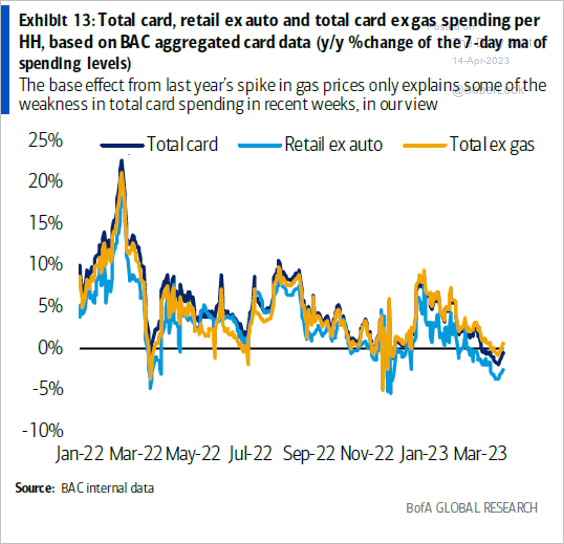
4. Credit/debit card spending was nearly flat relative to 2022 in March.
 Source: BofA Global Research
But card spending ticked up at the end of the month.
 Source: BofA Global Research
——————–
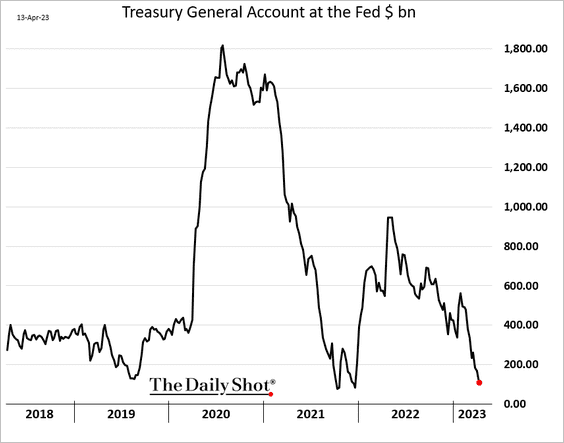
5. The US Treasury’s cash balances continue to sink.
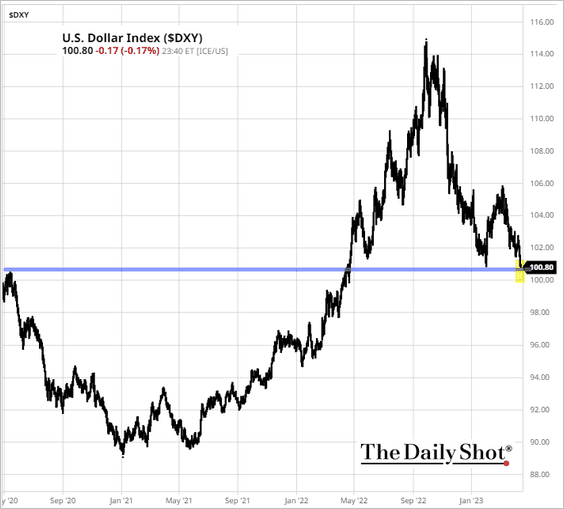
6. The US dollar index (DXY) is testing support.
 Source: barchart.com
Back to Index
The United Kingdom
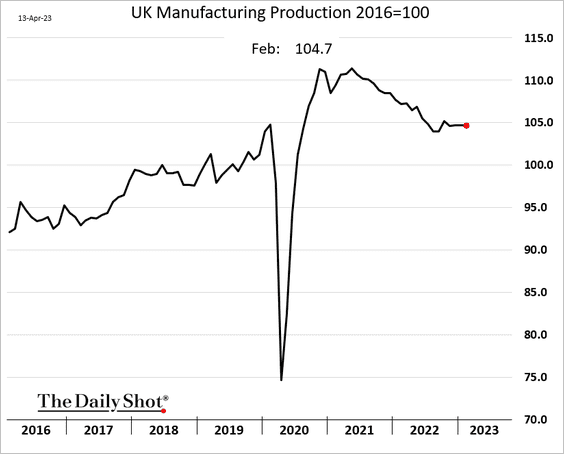
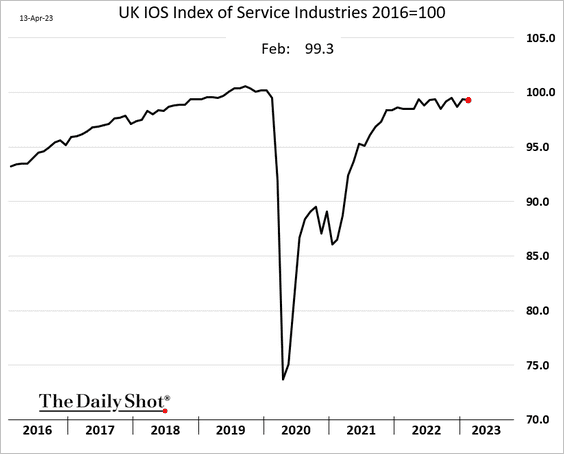
1. The monthly GDP estimate was flat in February (and has been roughly flat for some time).
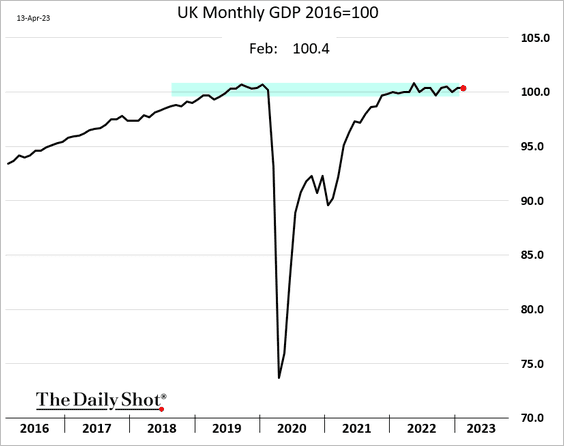
• Both manufacturing and services output hasn’t budged much in recent months.
Construction output hit a record high.

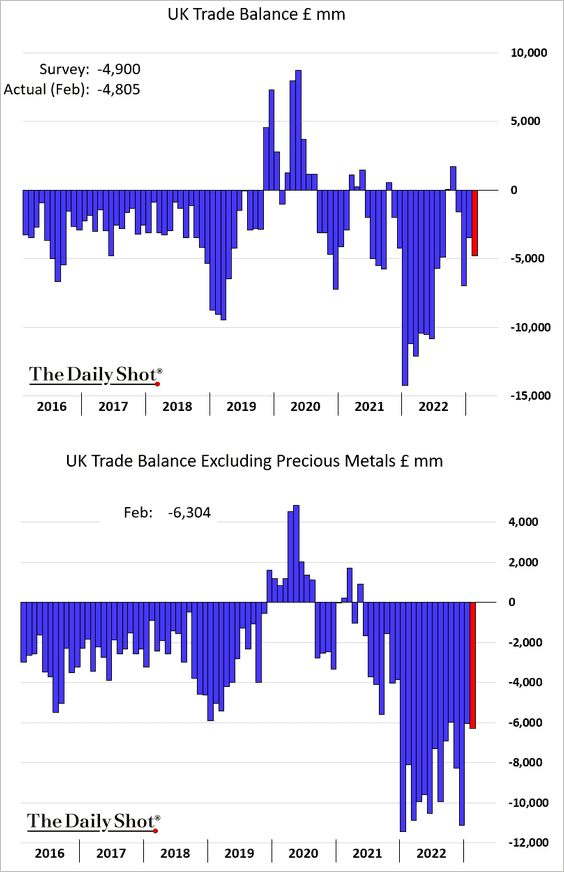
2. The trade deficit widened.
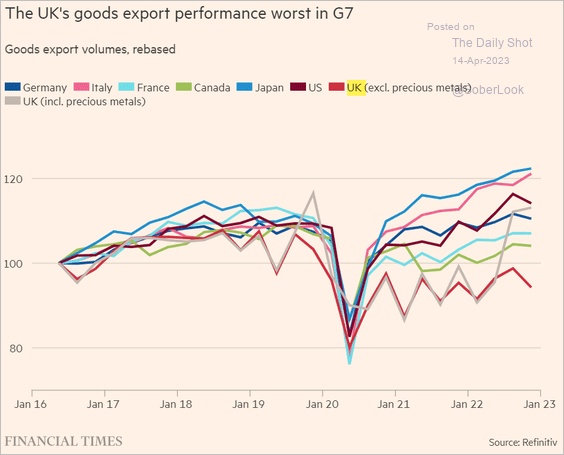
UK exports have been underperforming other advanced economies.
 Source: @financialtimes Read full article
Back to Index
The Eurozone
1. Italy’s industrial production has been slowing.

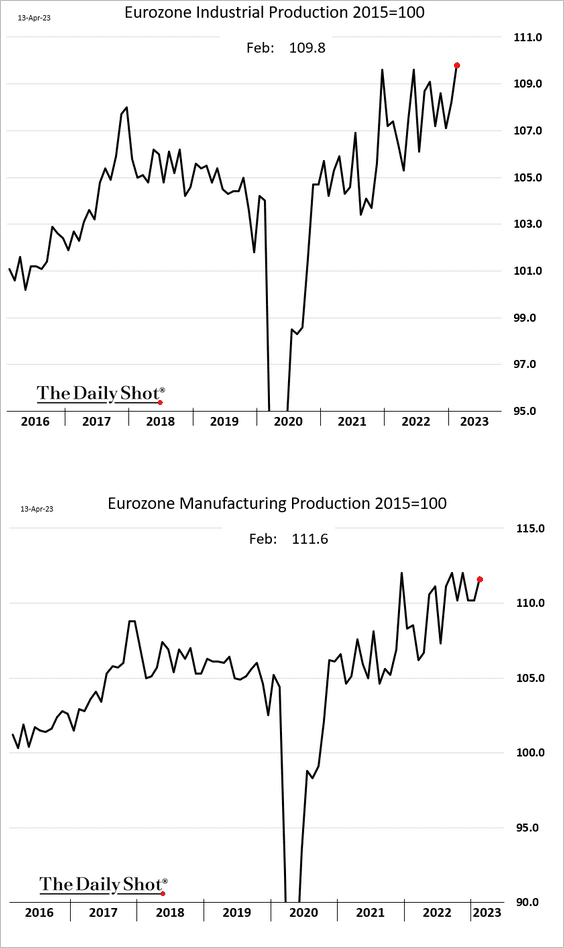
But the overall euro-area industrial output surprised to the upside in February.
 Source: Reuters Read full article
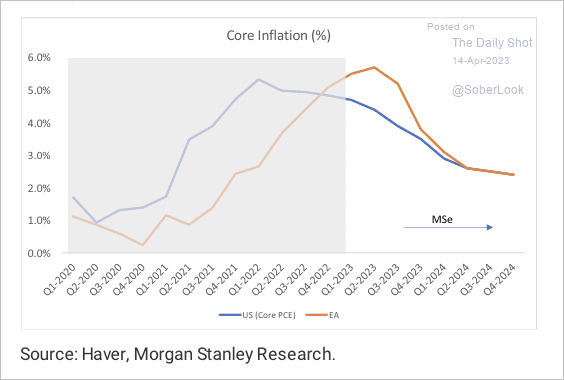
2. Morgan Stanley does not see peak inflation in the euro area just yet.
 Source: Morgan Stanley Research
——————–
Asia-Pacific
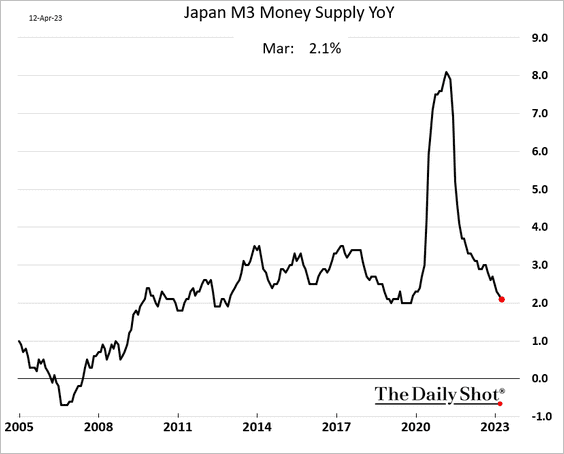
1. Japan’s broad money supply growth continues to slow.
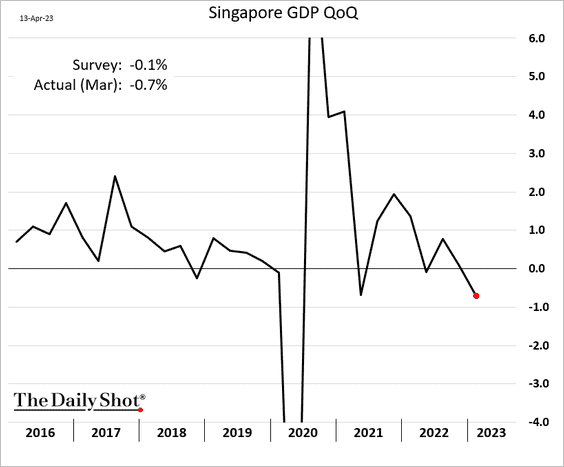
2. Singapore’s GDP contracted more than expected in Q1.
 Source: @mljamrisko, @markets Read full article
——————–
3. New Zealand’s immigration has rebounded.

Back to Index
Emerging Markets
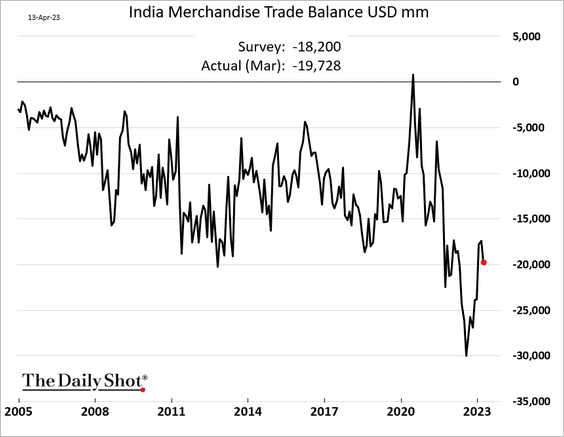
1. India’s trade deficit widened last month.
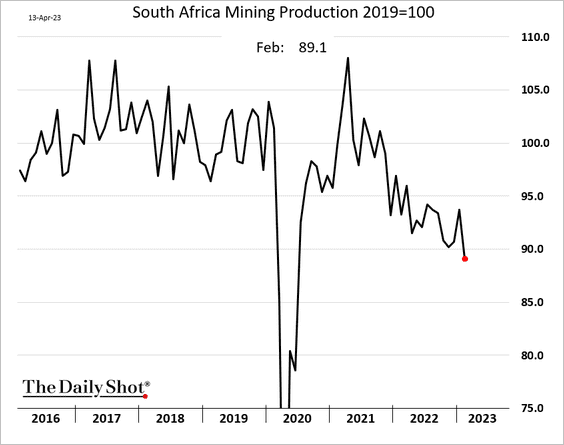
2. South Africa’s mining output continues to deteriorate.
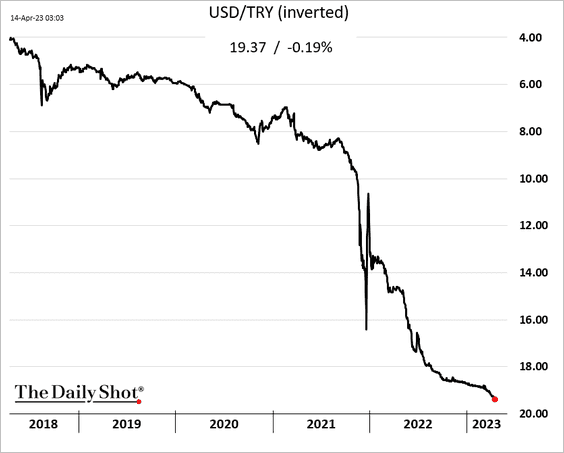
3. The Turkish lira keeps drifting lower.
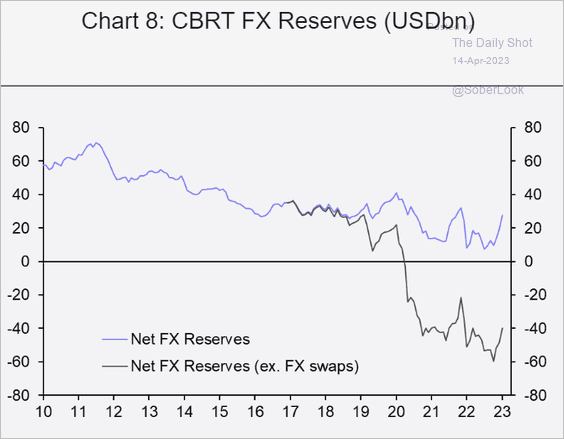
Turkey’s FX reserves remain an issue.
 Source: Capital Economics
——————–
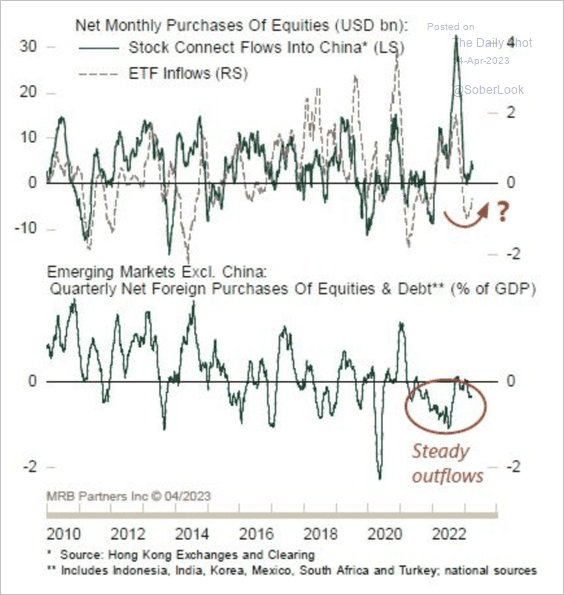
4. Foreign investors are still skeptical about EM equities.
 Source: MRB Partners
But a weaker US dollar tends to coincide with EM stocks outperforming DM.
 Source: BofA Global Research
——————–
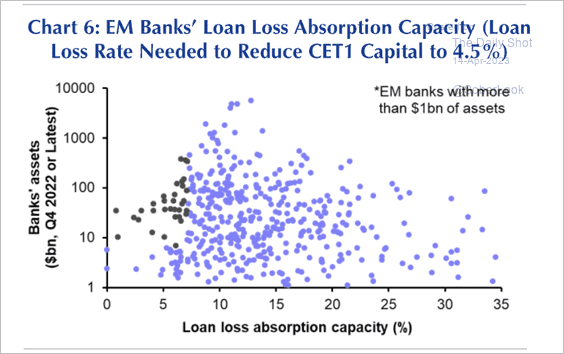
5. EM banks are relatively well-capitalized, and can potentially weather rising bad loans.
 Source: Capital Economics
Back to Index
Commodities
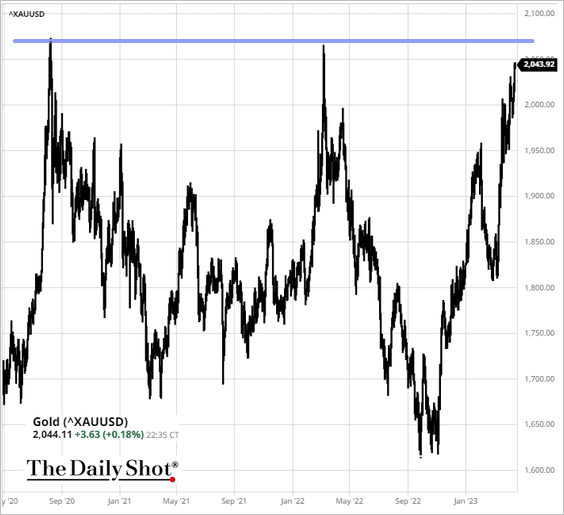
1. The US dollar weakness is sending gold toward record highs.
 Source: barchart.com
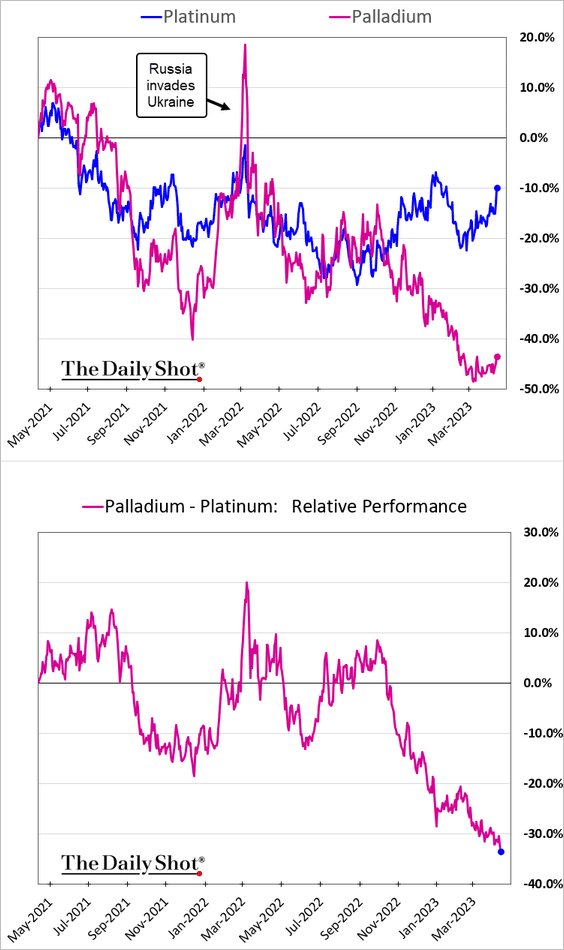
2. The gap between platinum and palladium continues to widen.
Back to Index
Energy
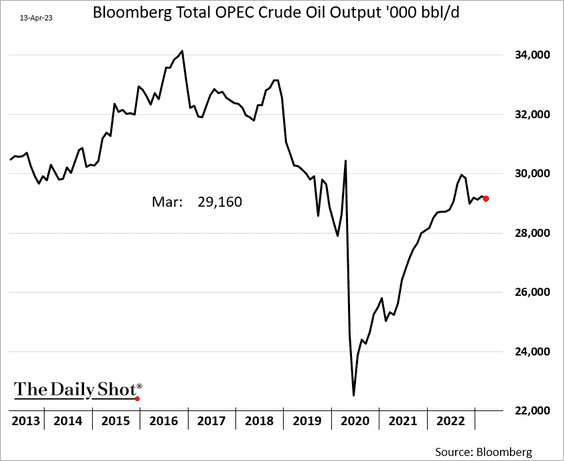
1. OPEC’s oil output edged lower in March.
Here is each country’s production relative to quota.
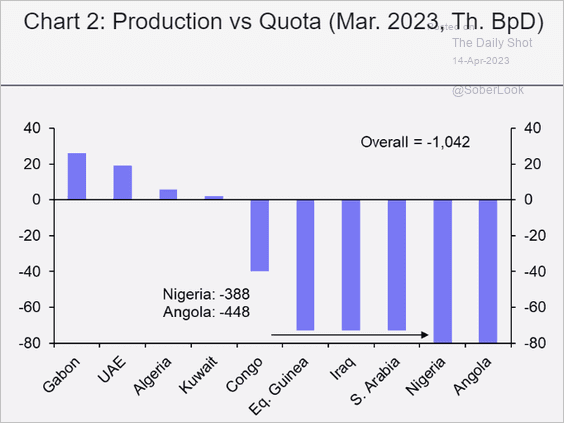 Source: Capital Economics
——————–
2. Downside momentum in natural gas has weakened over the past month, which could signal a price bounce.
 Source: Aazan Habib, Paradigm Capital
3. This chart shows new oil & gas projects by country.
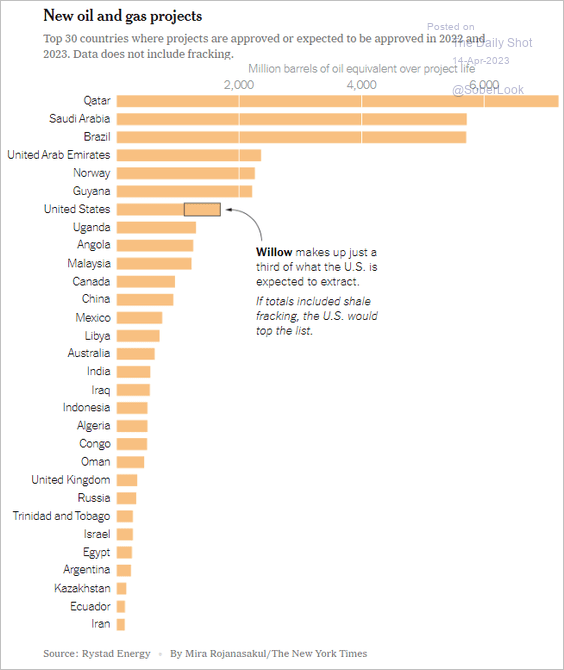 Source: The New York Times, @maxbearak Read full article
Back to Index
Equities
1. According to the S&P Global Investment Manager Index, institutional investors are risk-averse and very negative on US stocks.
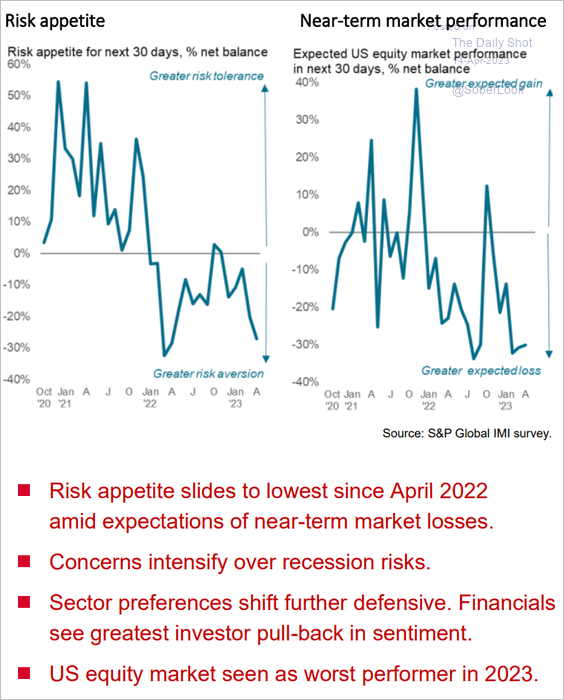 Source: S&P Global PMI
2. This chart shows corporate guidance announcement trends in select sectors.
 Source: S&P Global Market Intelligence
3. Tech funds saw substantial outflows.
 Source: BofA Global Research
But healthcare and telecom funds are getting fresh capital.
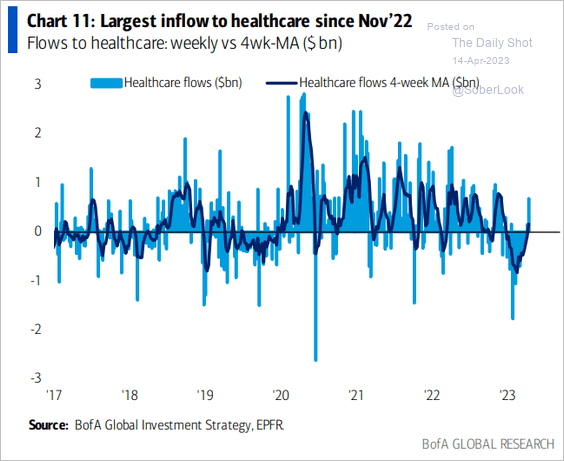 Source: BofA Global Research
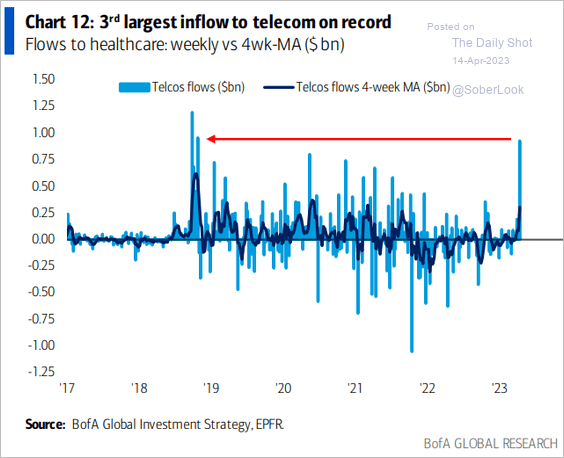 Source: BofA Global Research
——————–
4. Share buyback activity has ramped up.
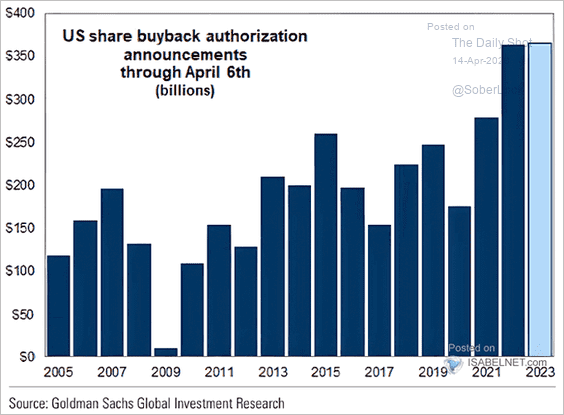 Source: @ISABELNET_SA, @GoldmanSachs
5. Retail portfolios are still deeply underwater.
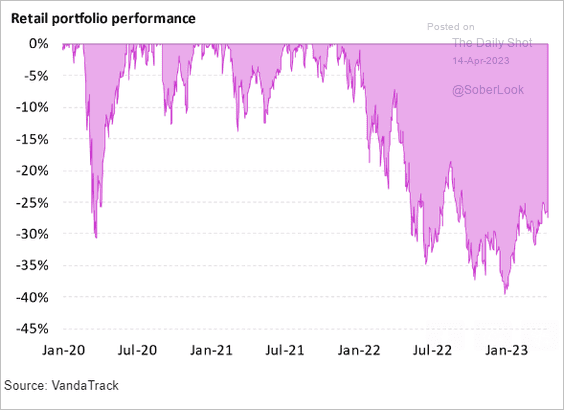 Source: Vanda Research
6. How do stocks perform in different unemployment regimes?
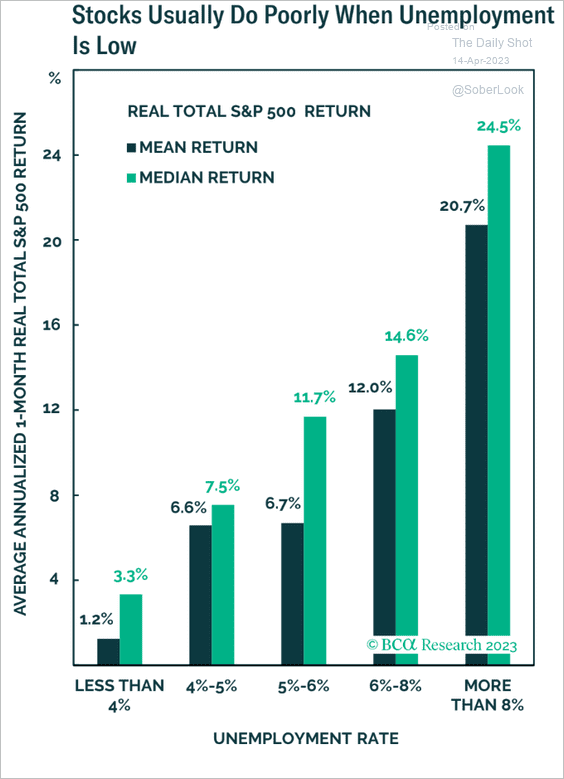 Source: BCA Research
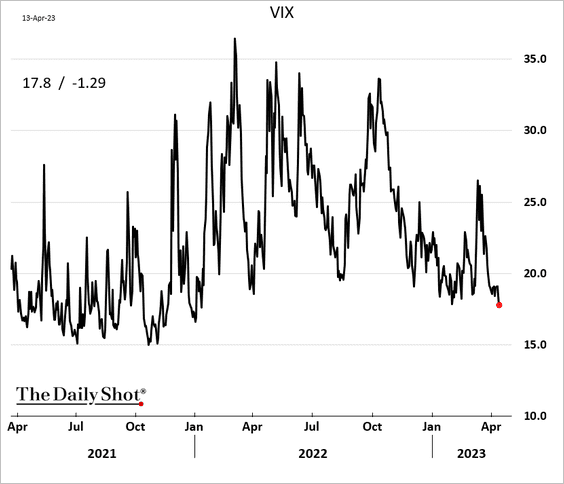
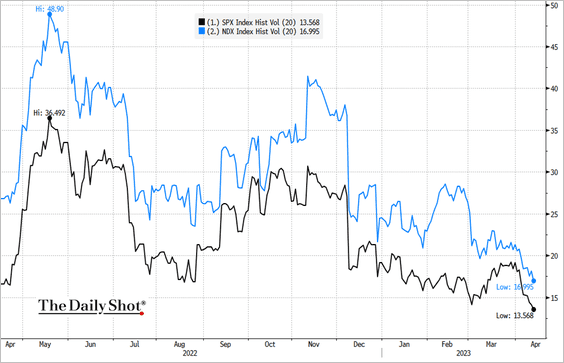
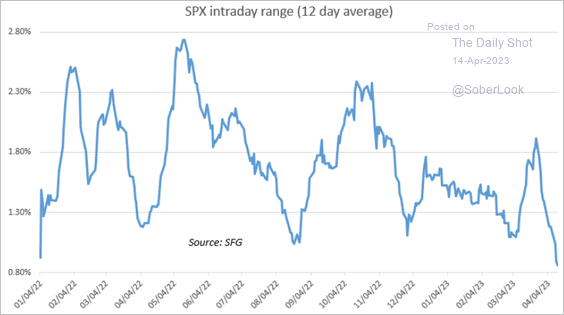
7. Equity market volatility continues to trend lower.
• VIX:
• Realized volatility (20 days):
 Source: @TheTerminal, Bloomberg Finance L.P.
• S&P 500 intraday range:
 Source: Chris Murphy, Susquehanna International Group
Back to Index
Credit
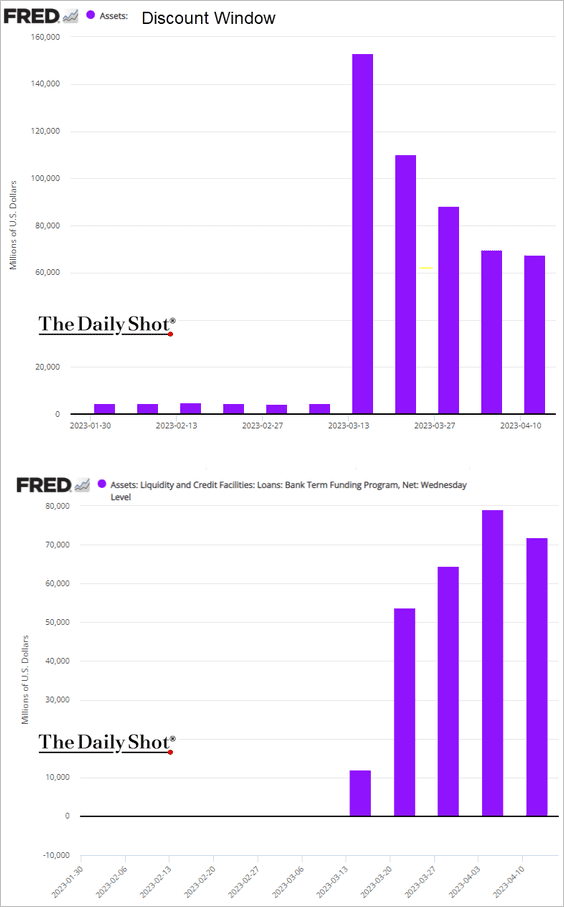
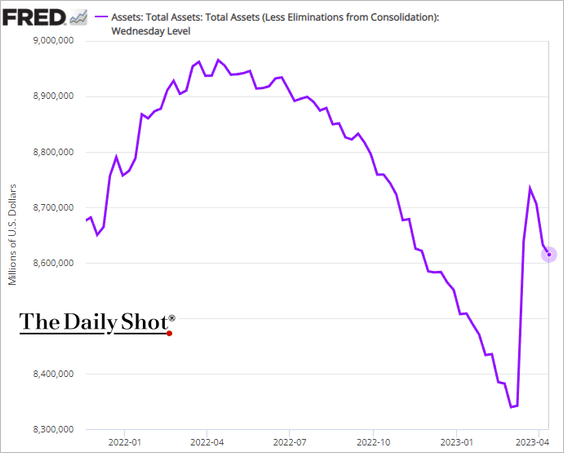
1. The Fed’s emergency financing for banks declined again in recent days, …
… resulting in a drop in the central bank’s balance sheet.
——————–
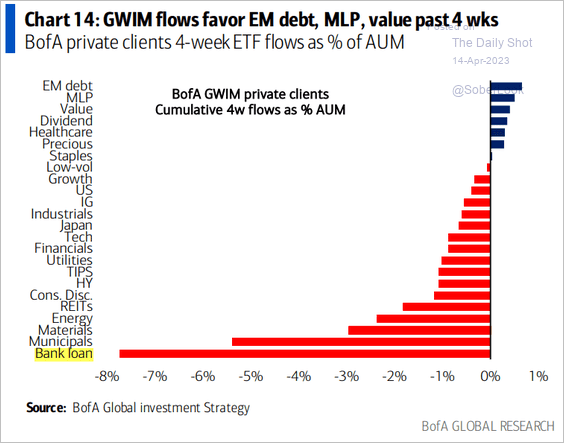
2. BofA private clients have been getting out of leveraged loans.
 Source: BofA Global Research
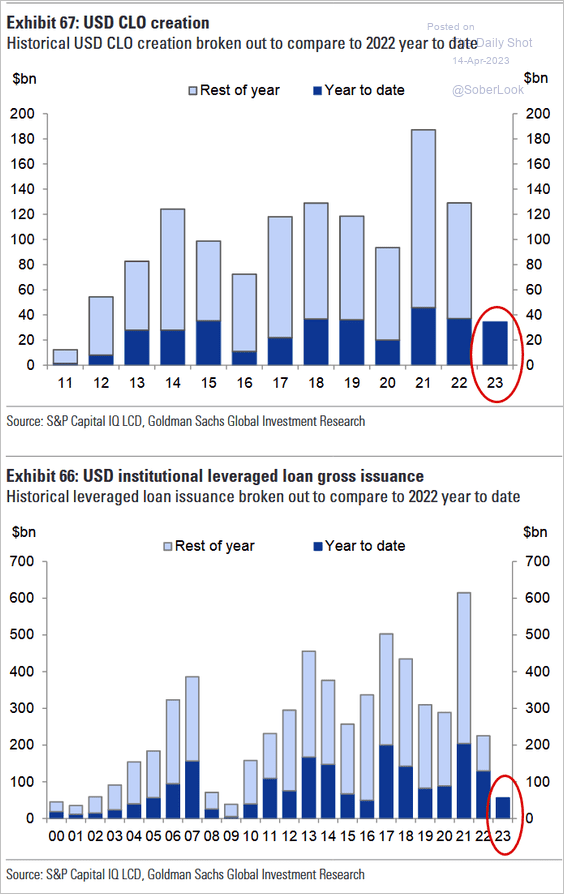
But leveraged loans are likely to see price gains ahead, as demand outstrips supply. CLO creation is near last year’s levels, while loan issuance hasn’t been this low since 2016.
 Source: Goldman Sachs
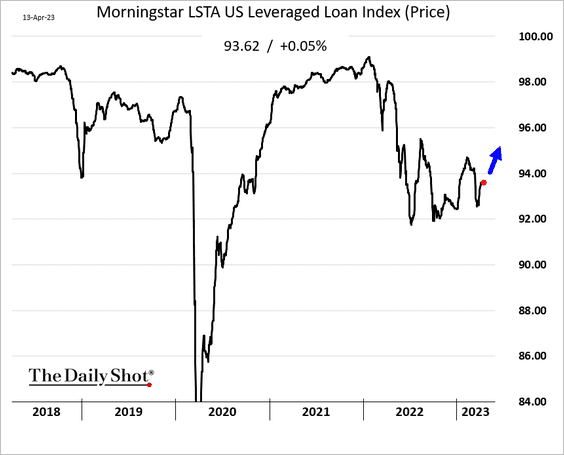
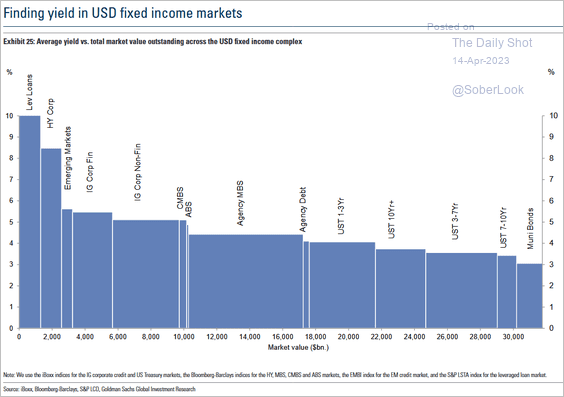
Leveraged loan yields are high relative to the rest of the fixed-income universe.
 Source: Goldman Sachs
——————–
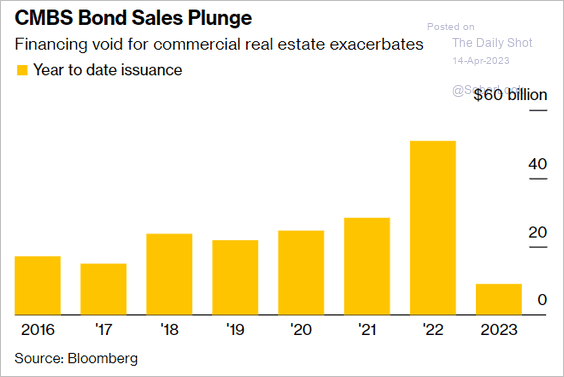
3. CMBS issuance has slowed sharply.
 Source: @ArroyoNieto, @markets Read full article
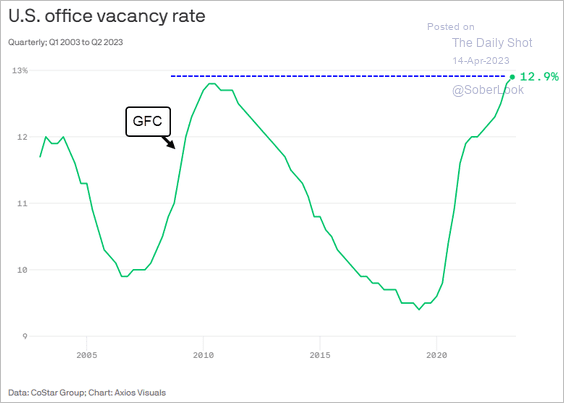
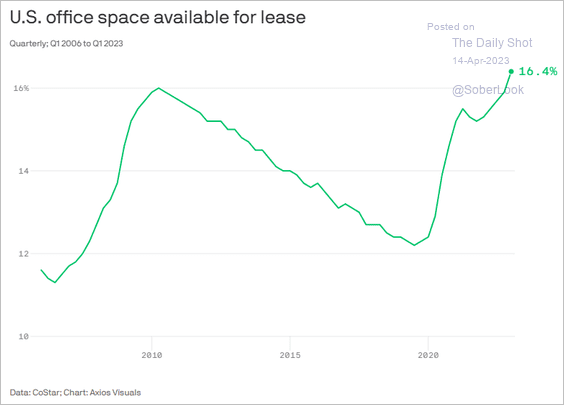
5. Office properties remain a concern.
• Office vacancy rate:
 Source: @axios Read full article
• Office space available for lease:
 Source: @axios Read full article
Back to Index
Rates:
1. Here is a look at 2-year Treasury yield performance after a trough in the 10s/2s curve.
 Source: Deutsche Bank Research
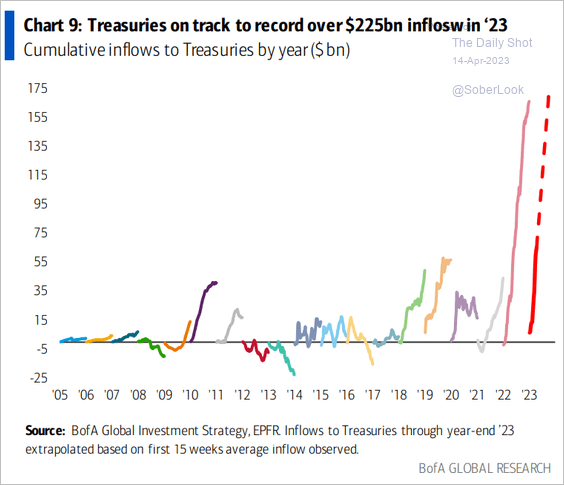
2. Treasury funds are seeing impressive inflows.
 Source: BofA Global Research
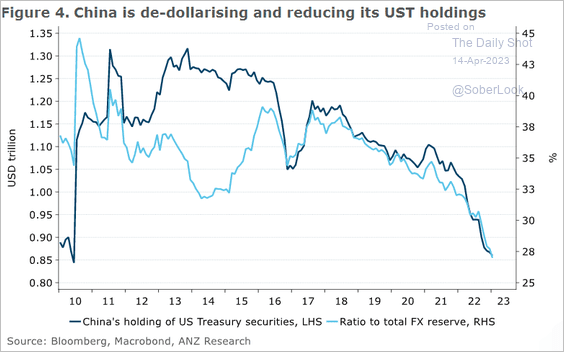
3. This chart shows China’s Treasury holdings.
 Source: @ANZ_Research
Back to Index
Global Developments
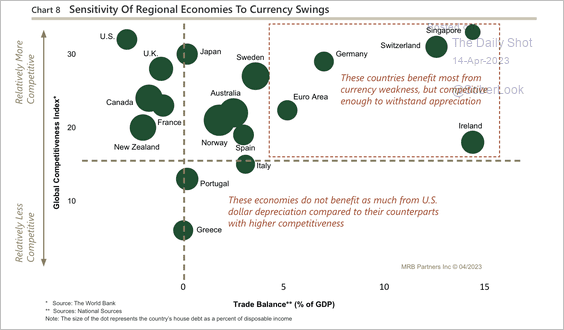
1. Which countries benefit the most from currency weakness?
 Source: MRB Partners
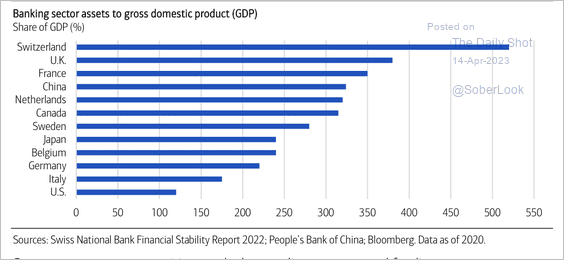
2. Bank credit plays a larger role in non-U.S. economies.
 Source: Merrill Lynch
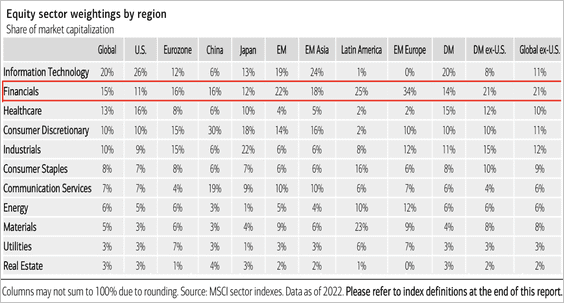
3. This table shows sector exposures by major regions. Non-Asian EMs and LatAm have greater exposure to financials and other cyclicals.
 Source: Merrill Lynch
——————–
Food for Thought
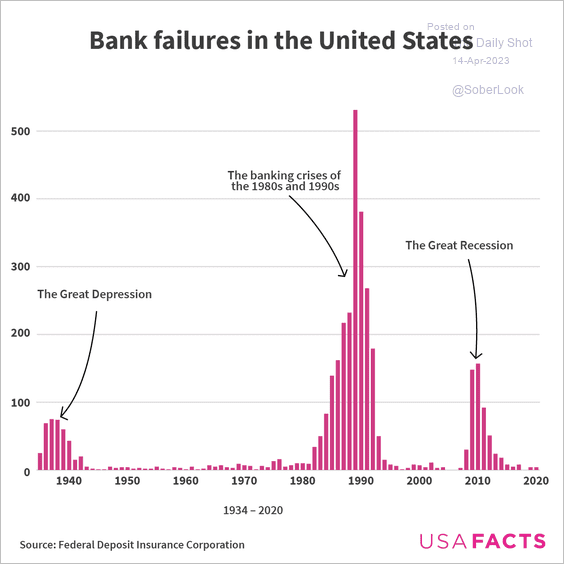
1. Bank failures in the US:
 Source: USAFacts
2. 7-Eleven stores:
 Source: @chartrdaily
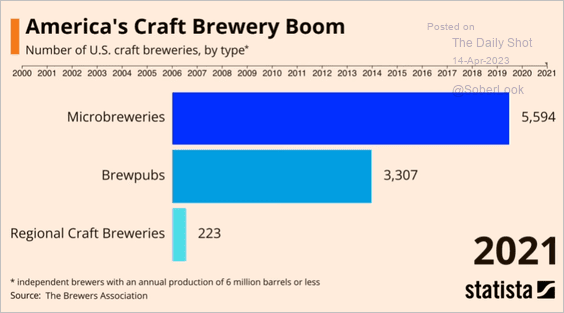
3. Craft breweries:
 Source: See Video Read full article
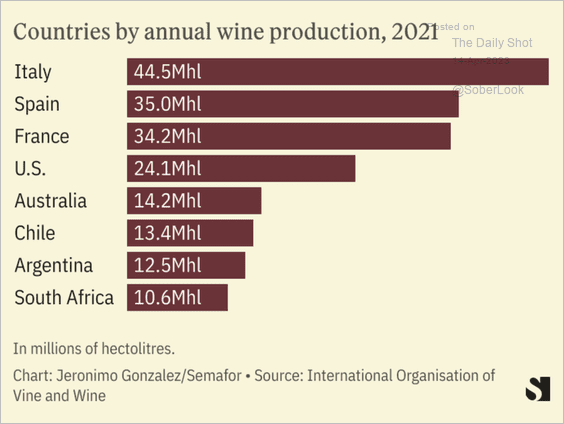
4. Wine production:
 Source: Semafor
5. Change in the number of college degrees awarded between 2011 and 2021:
 Source: The Economist Read full article
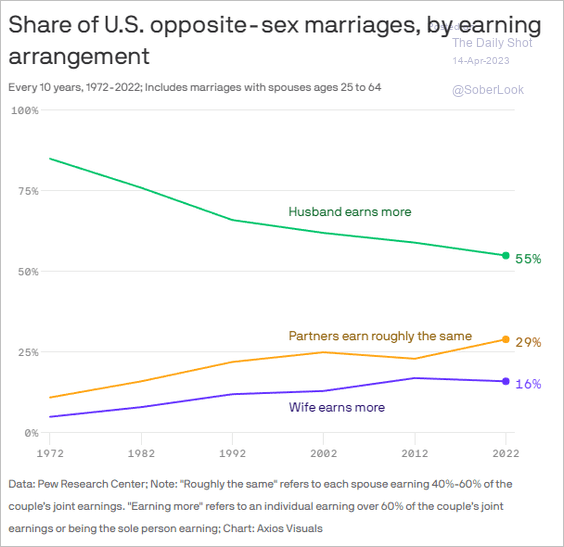
6. Changing trends in earning arrangements of US marriages:
 Source: @axios Read full article
7. Major hail events:
 Source: CoreLogic
——————–
Have a great weekend!
Back to Index
