
The Daily Shot: 17-Apr-23
• The United States
• The United Kingdom
• The Eurozone
• Europe
• Asia – Pacific
• China
• Emerging Markets
• Commodities
• Energy
• Equities
• Credit
• Rates
• Global Developments
• Food for Thought
The United States
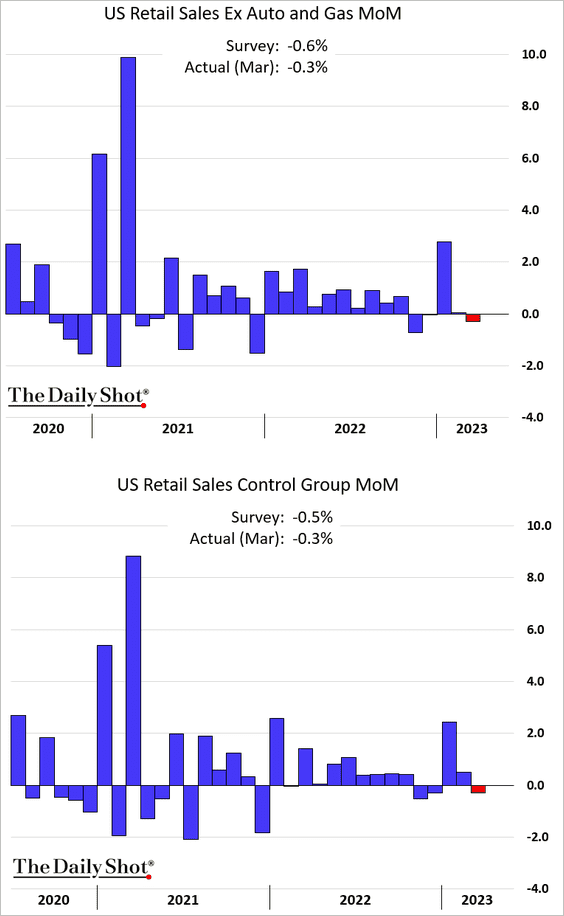
1. Retail sales declined last month, but the drop was less severe than expected (boosted by online sales).
• Here are the March changes by sector.
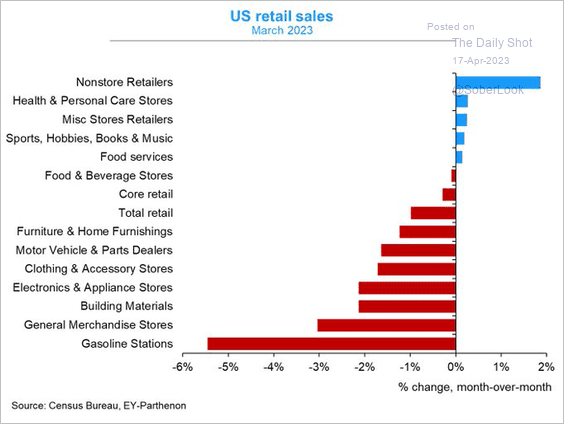 Source: @GregDaco
• Housing-related sales are down on a year-over-year basis …
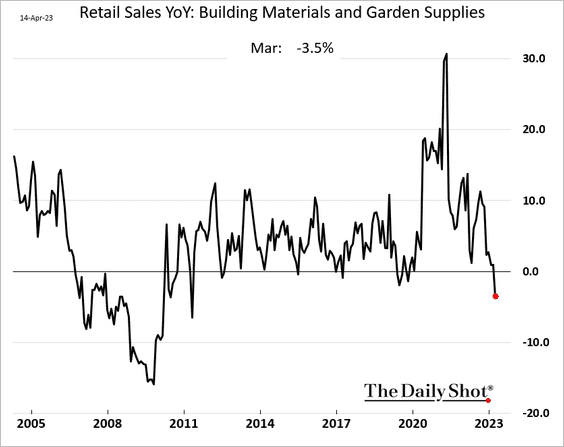
… and there is more pain ahead for the sector.
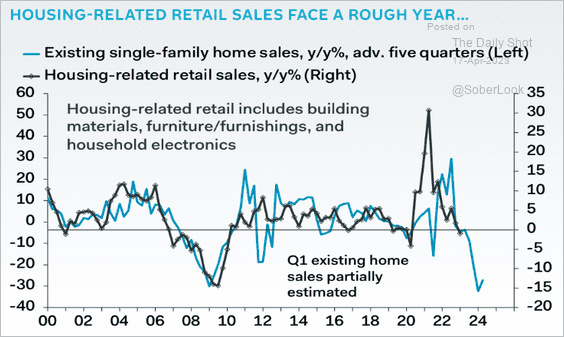 Source: Pantheon Macroeconomics
• Spending at restaurants and bars has been outpacing grocery purchases.
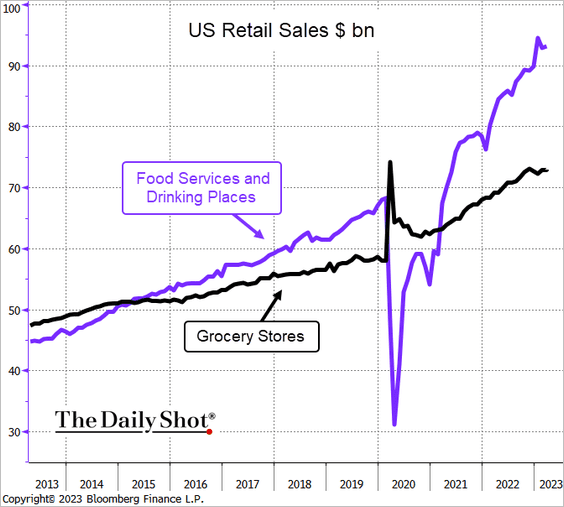 Source: @TheTerminal, Bloomberg Finance L.P. Further reading
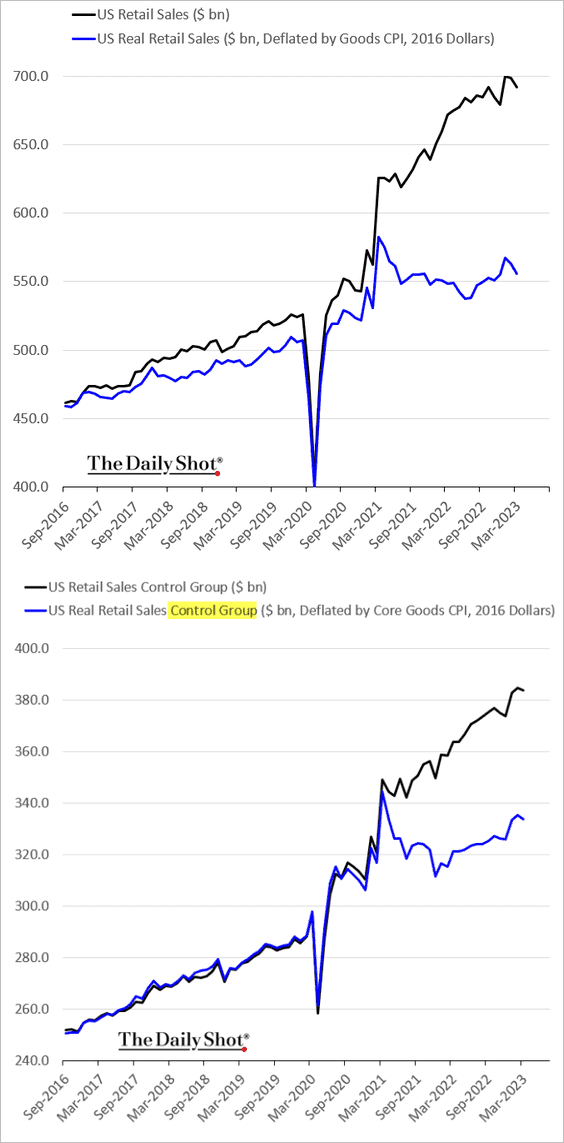
• This chart shows inflation-adjusted retail sales.
——————–
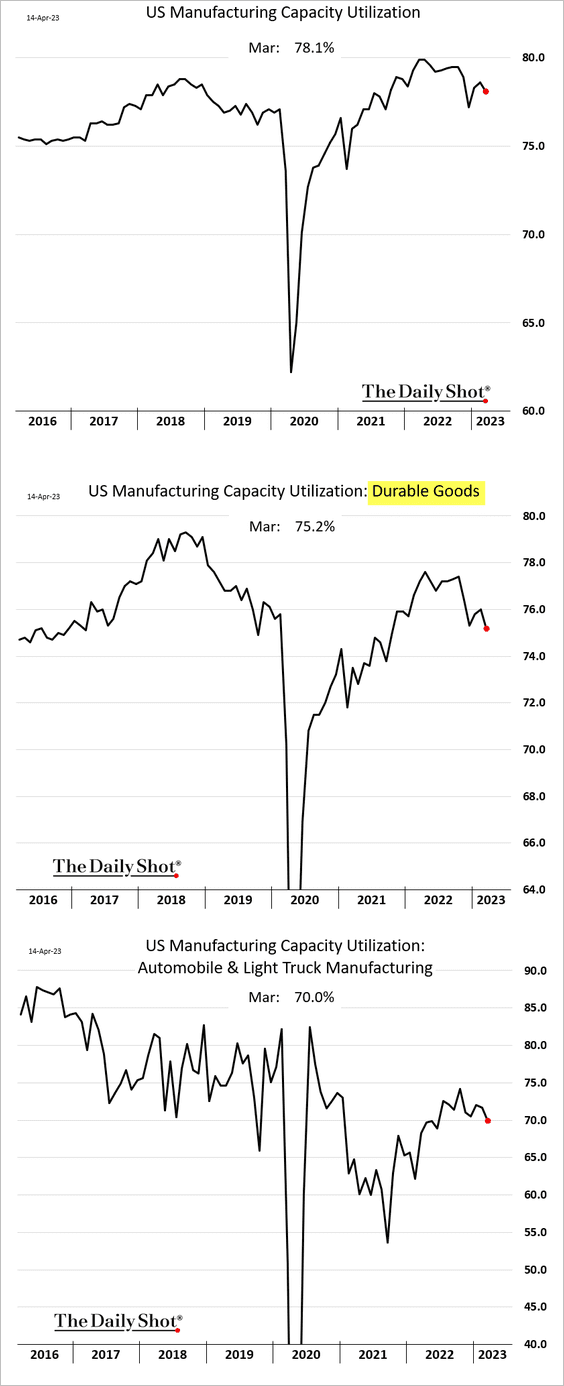
2. Manufacturing output declined more than expected.
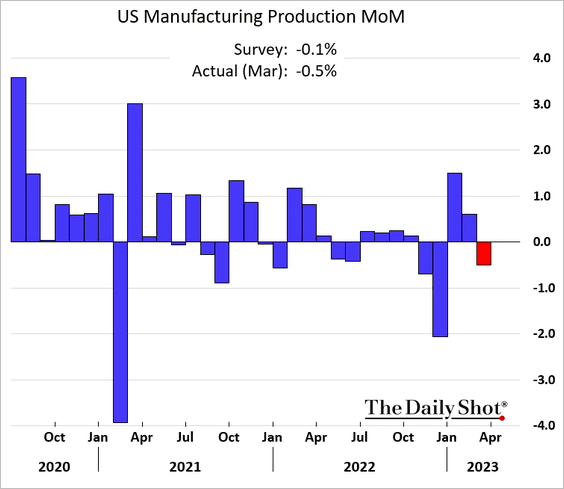
Below are some trends in factory capacity utilization.
——————–
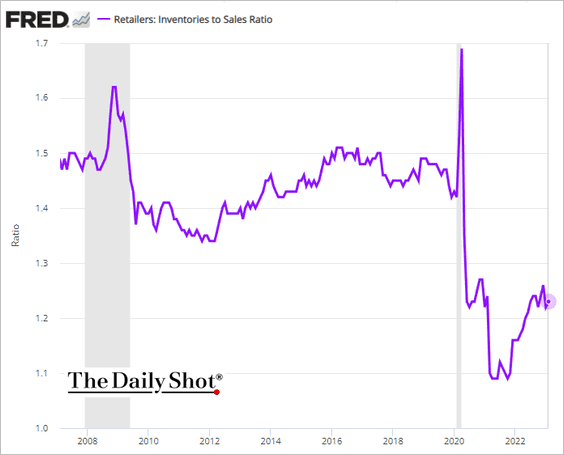
3. Retailers’ inventory-to-sales ratio remains well below pre-COVID levels.
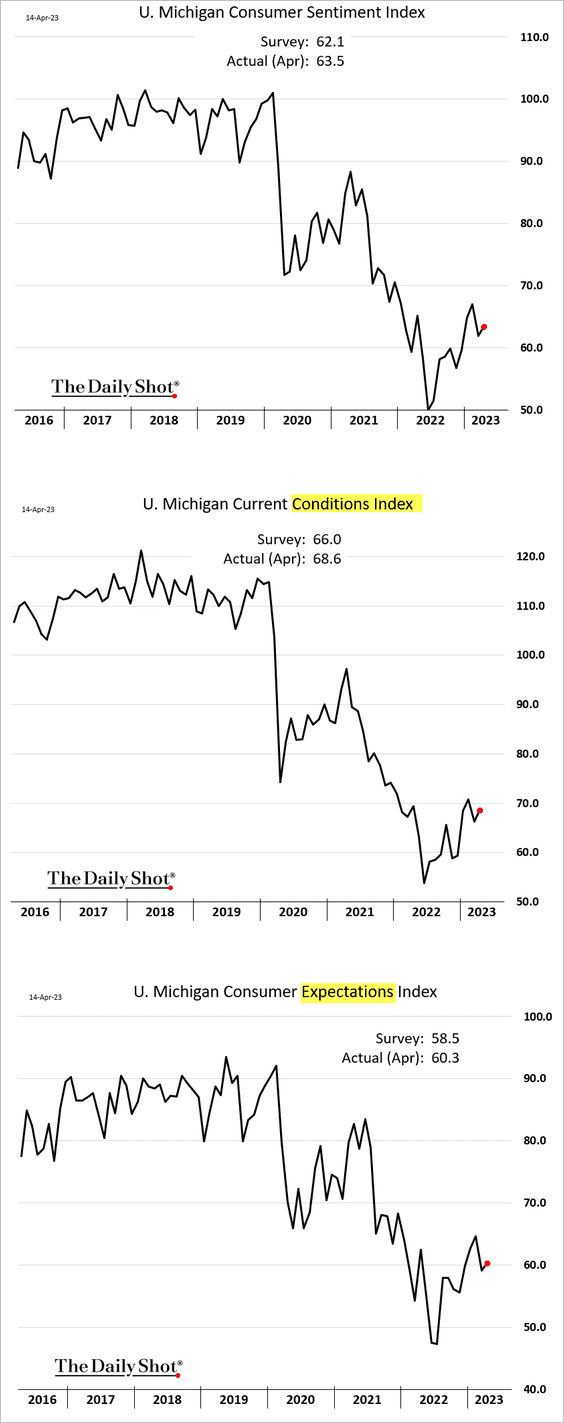
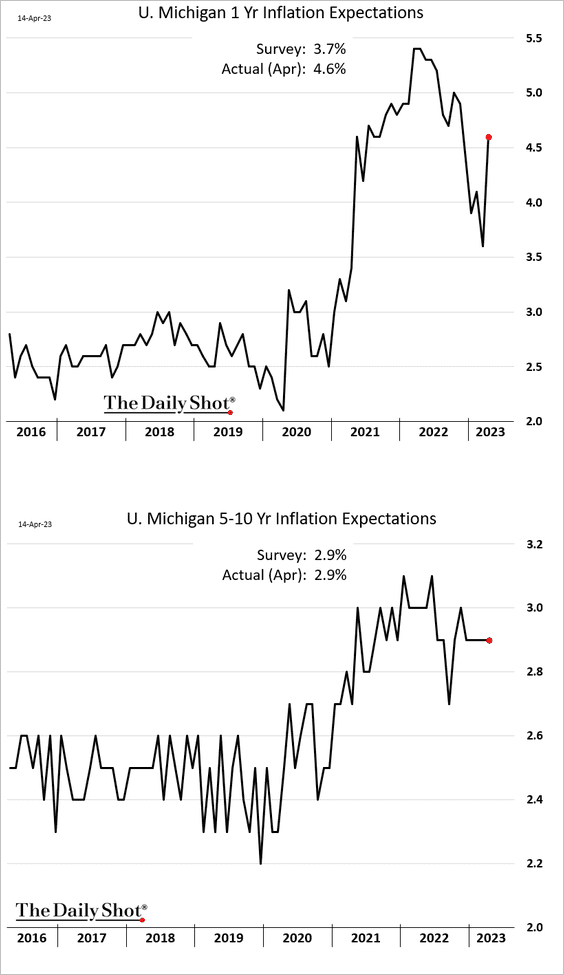
4. The U. Michigan consumer sentiment index edged higher this month.
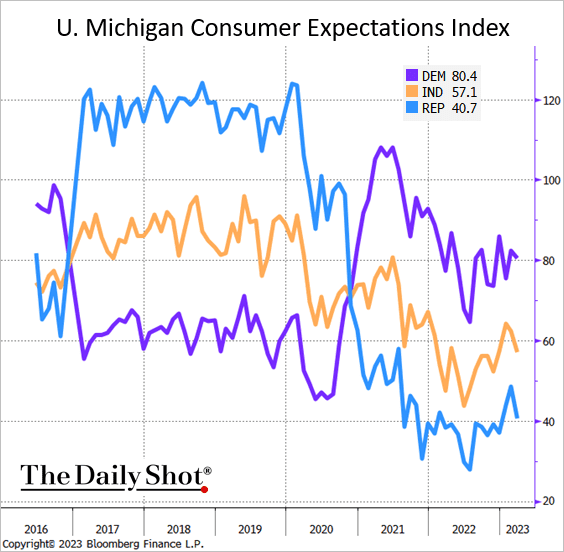
• This chart shows consumer expectations by political party affiliation.
 Source: @TheTerminal, Bloomberg Finance L.P.
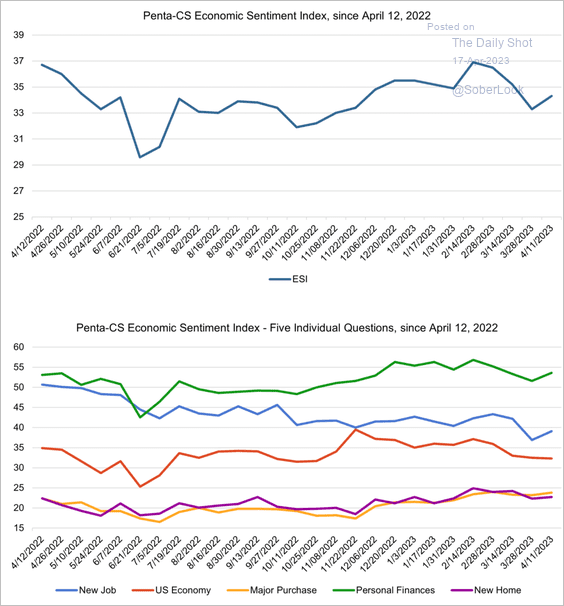
• The Penta-CivicScience Economic Sentiment Index also showed an improvement.
 Source: @PentaGRP, @CivicScience
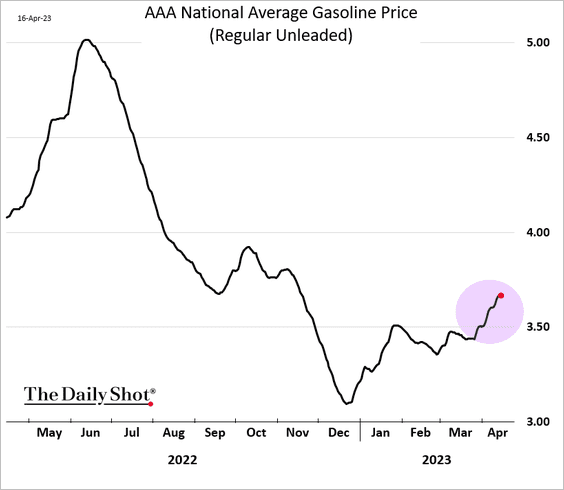
• Short-term inflation expectations surged amid higher gasoline prices. Longer-term inflation expectations held steady.
——————–
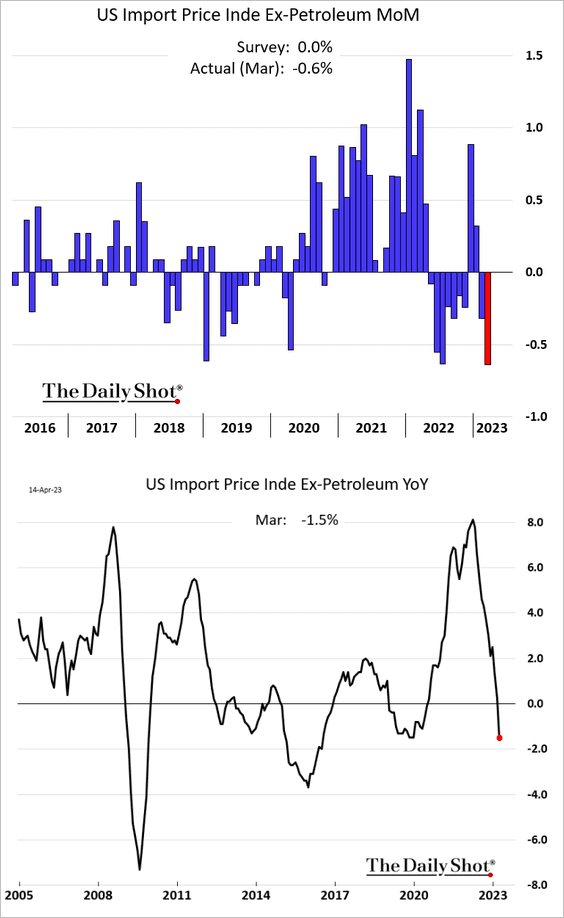
5. The import price index declined sharply in March, which should ease goods inflation.
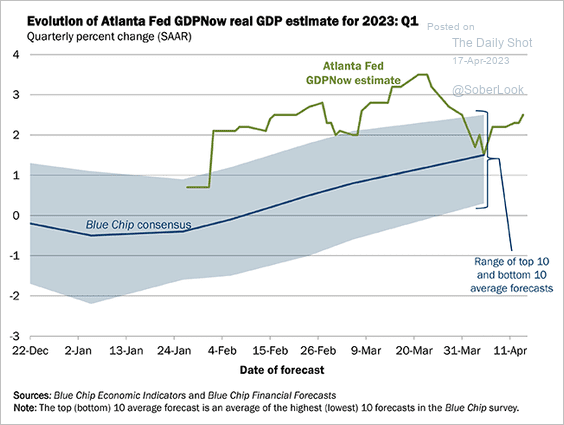
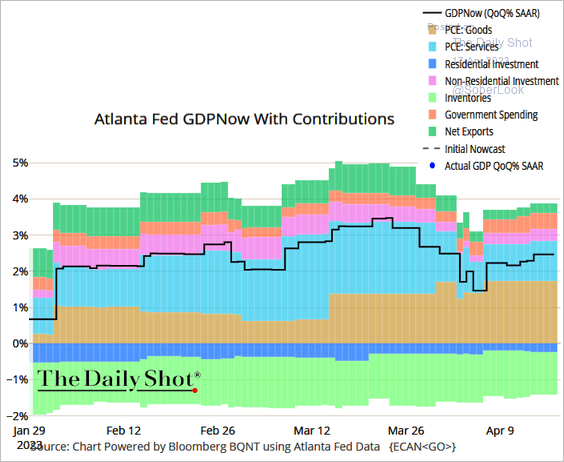
6. The GDPNow Q1 growth estimate from the Atlanta Fed is back above 2%.
 Source: Federal Reserve Bank of Atlanta
Here are the contributions (supported by robust consumer spending on goods).
 Source: Federal Reserve Bank of Atlanta
——————–
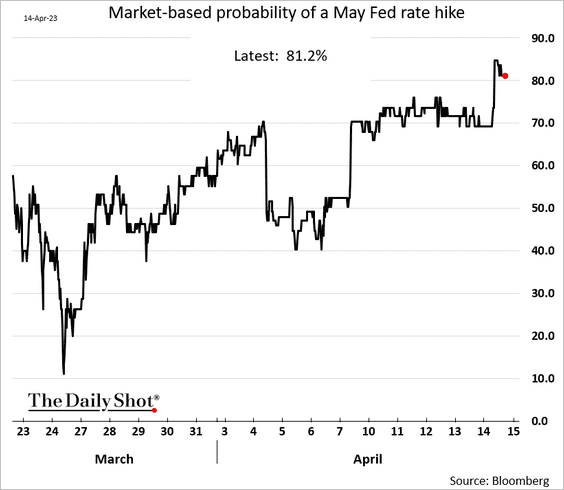
7. Fed officials are preparing the market for another rate hike next month.
 Source: Reuters Read full article
The probability of a rate hike in May is now above 80%.
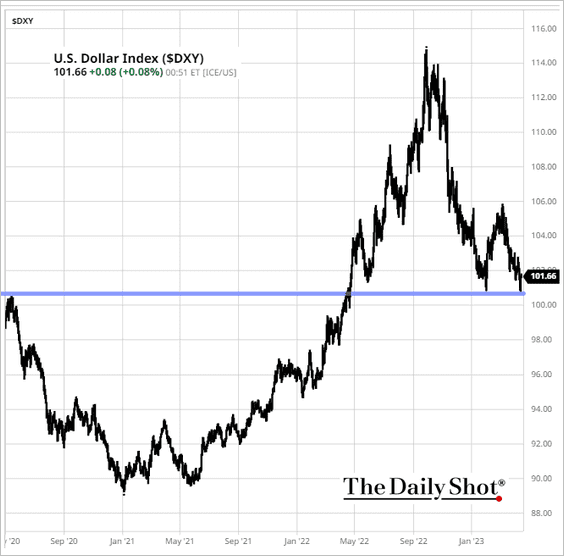
The US dollar index (DXY) held support amid tough talk from the Fed.
 Source: barchart.com
Back to Index
The United Kingdom
1. Traders have covered their bets against the British pound, …
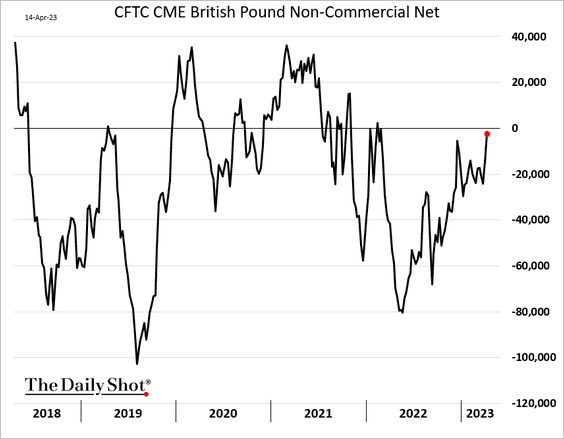
… as analysts call for more gains for the UK currency. Here is a forecast from Pantheon Macroeconomics.
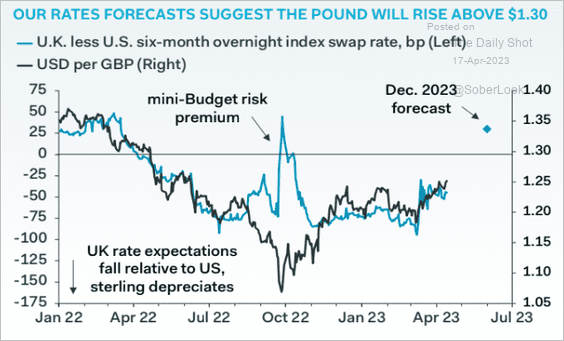 Source: Pantheon Macroeconomics
——————–
2. What percentage of the population lives in poor-quality housing?
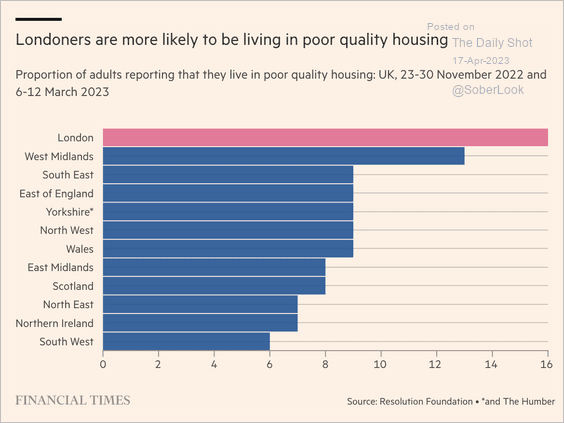 Source: @financialtimes Read full article
Back to Index
The Eurozone
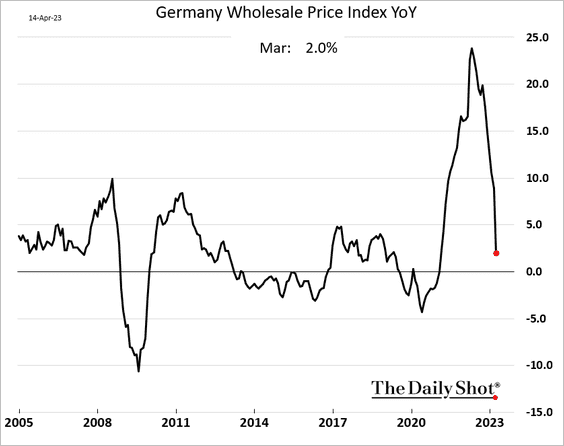
1. Germany’s wholesale price inflation is crashing.
2. French stocks got a boost from China’s resurging demand for luxury goods.
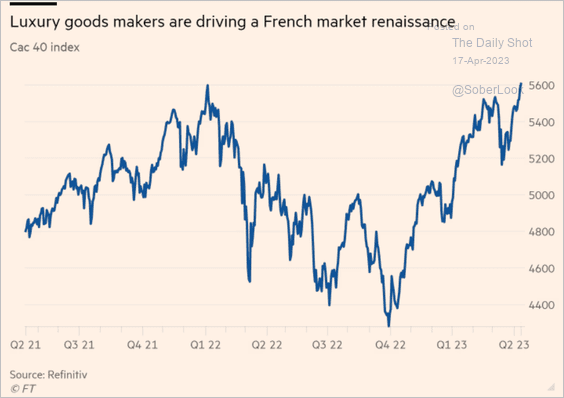 Source: @financialtimes; h/t Walter Read full article
3. Current levels of realized volatility should be equivalent to a EUR/USD range of around 10% (1.05-1.17).
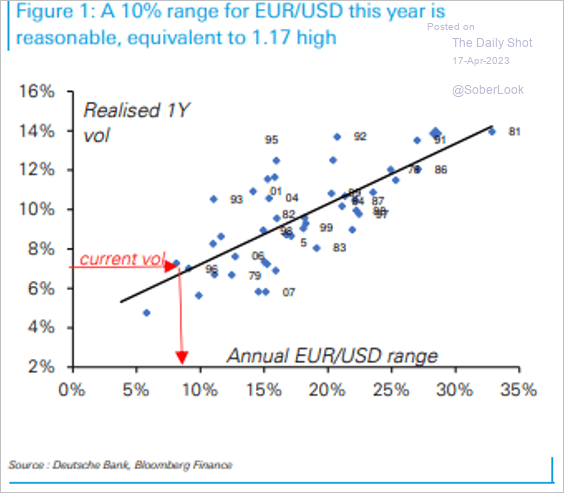 Source: Deutsche Bank Research
Back to Index
Europe
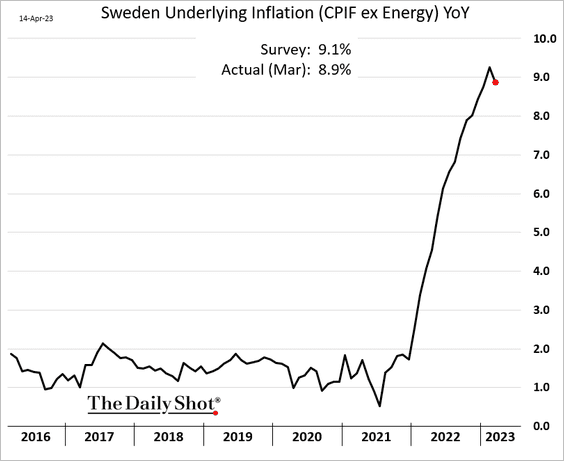
1. Sweden’s core inflation has finally peaked.
But price gains remain well above Riksbank’s forecast.
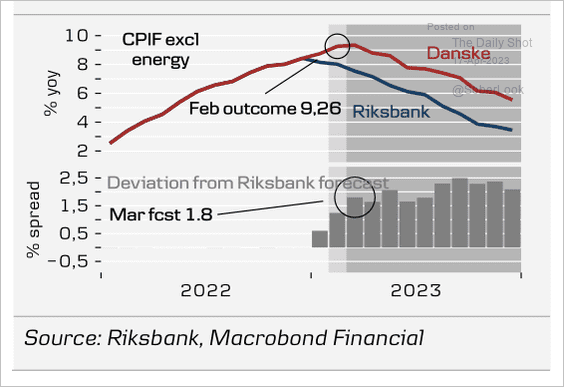 Source: Danske Bank
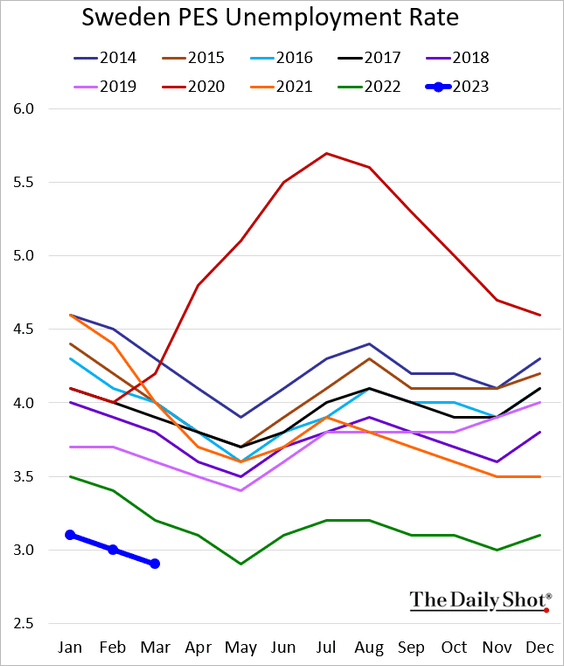
Sweden’s unemployment rate is still very low.
——————–
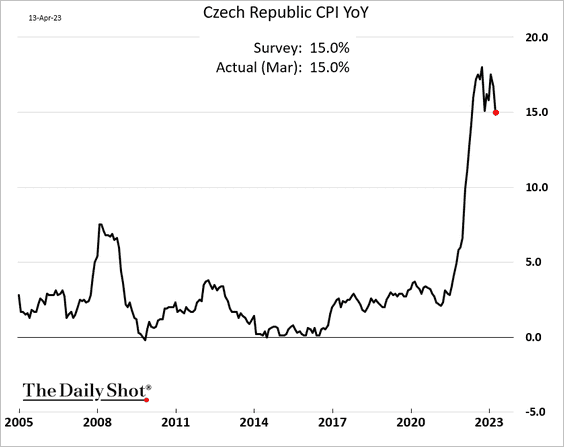
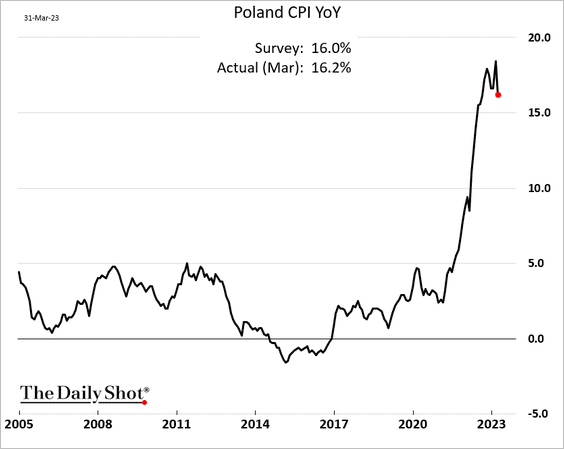
2. Inflation has also peaked in Central Europe.
• Czech Republic:
• Poland:
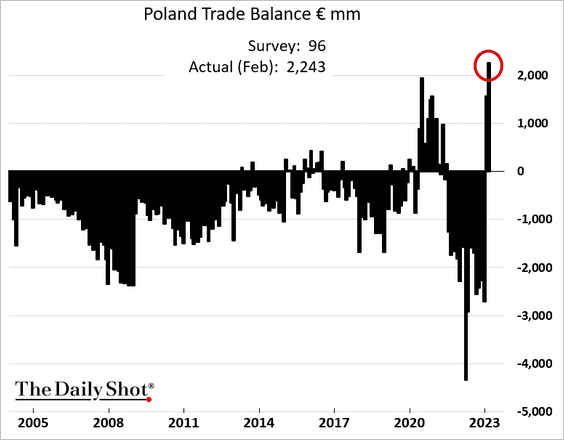
3. Poland’s trade surplus surged in February.
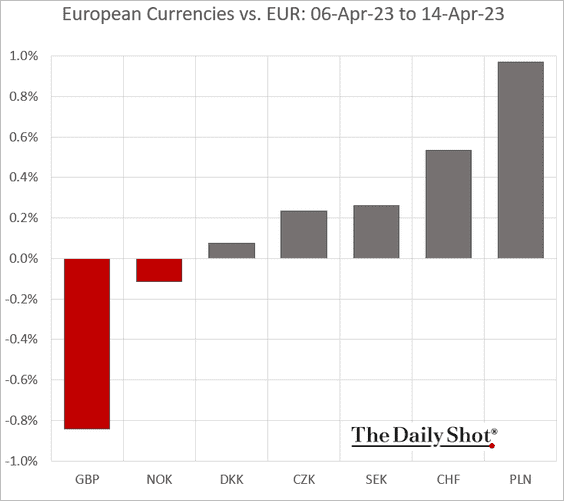
• The Polish zloty outperformed last week.
——————–
4. According to Eurostat, “In 2022 the average hourly labor cost was €30.5 in the EU, ranging from €8.2 in Bulgaria to €50.7 in Luxembourg.”
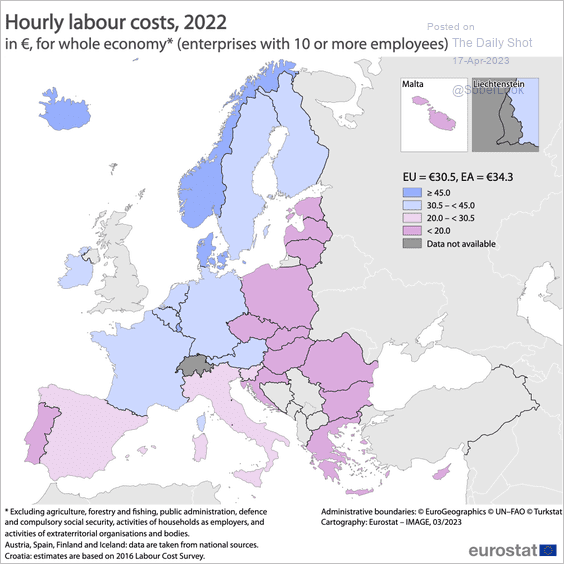 Source: Eurostat Read full article
Back to Index
Asia – Pacific
1. Key measures from the latest Tankan survey show weakness in Japan’s manufacturing sector.
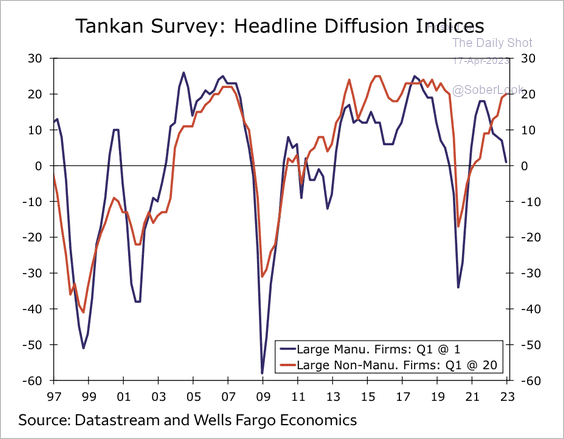 Source: Wells Fargo Securities
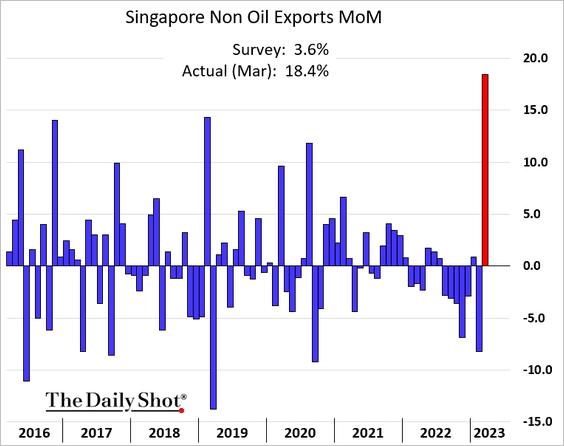
2. Singapore’s exports surged in March.
Back to Index
China
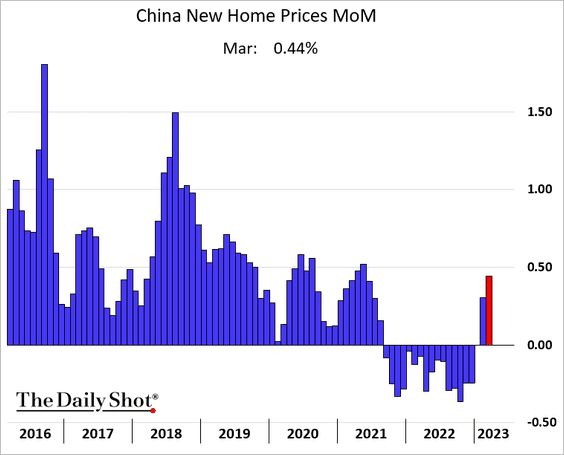
1. Home prices increased again last month.
2. Despite housing weakness, the recovery in equities is intact, supported by improving earnings momentum.
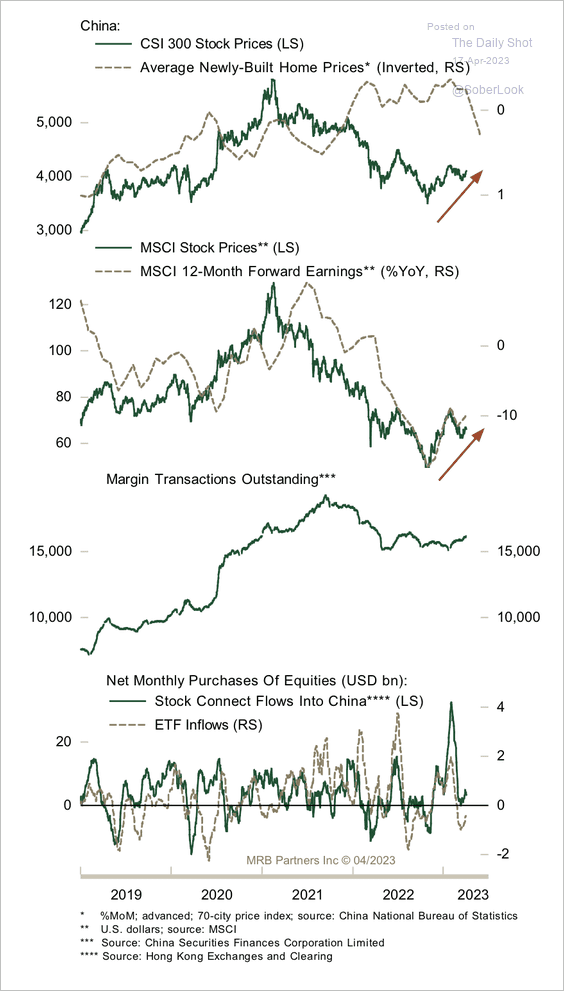 Source: MRB Partners
3. Variant Perception’s recession probability collapsed toward zero.
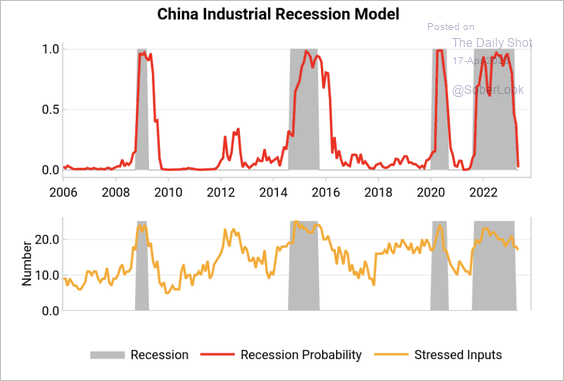 Source: Variant Perception
However, leading indicators remain negative, confirming the intensity of global liquidity and trade headwinds.
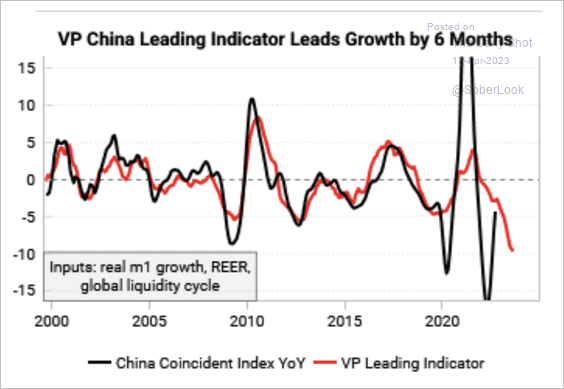 Source: Variant Perception
Back to Index
Emerging Markets
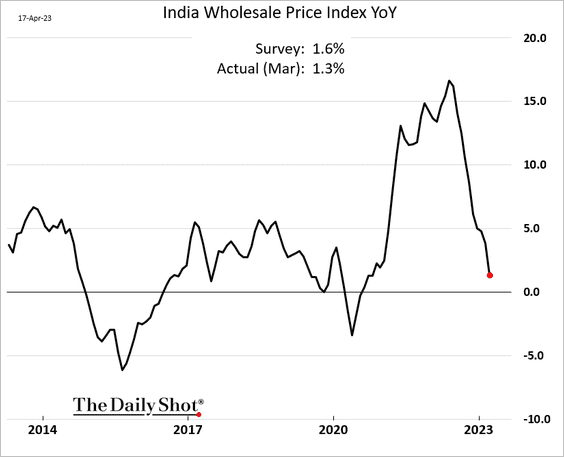
1. India’s wholesale price inflation is tumbling.
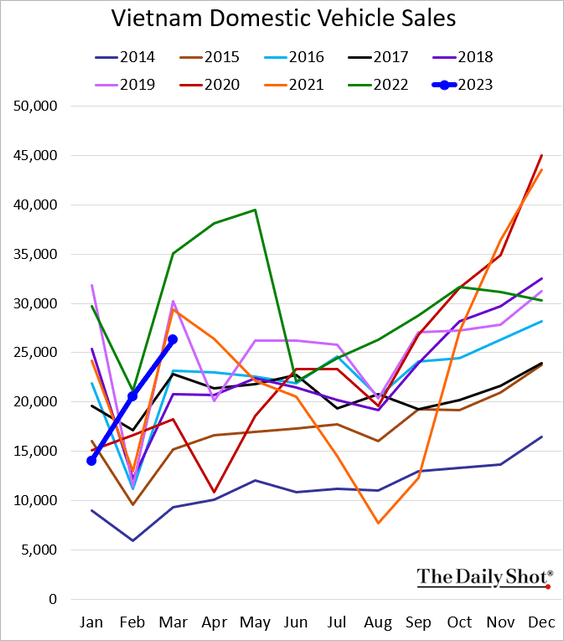
2. Vietnam’s vehicle sales were back below last year’s levels in March.
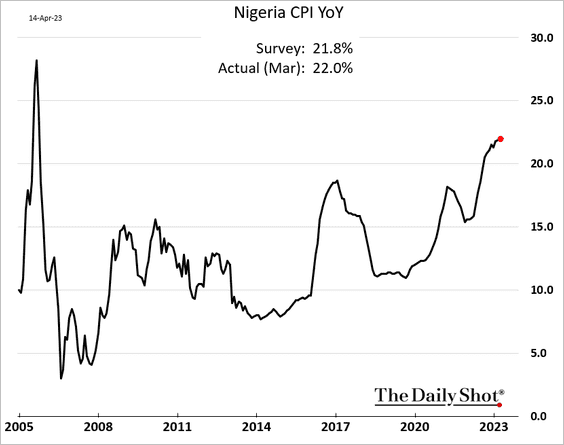
3. Nigeria’s inflation remains above 20%.
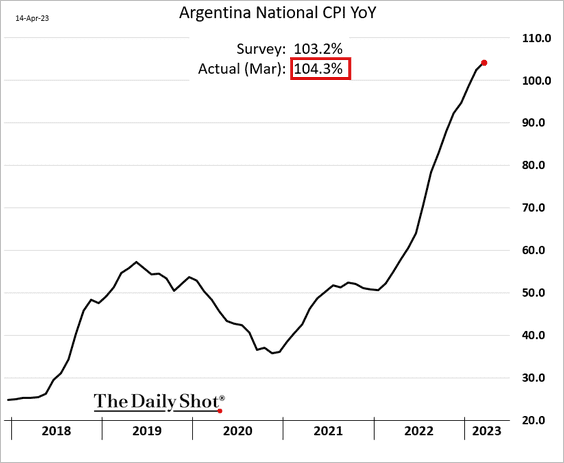
4. Argentia’s CPI exceeded 104% in March.
 Source: Reuters Read full article
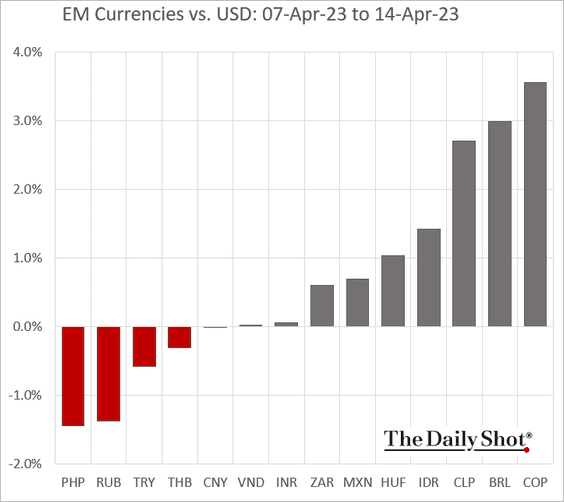
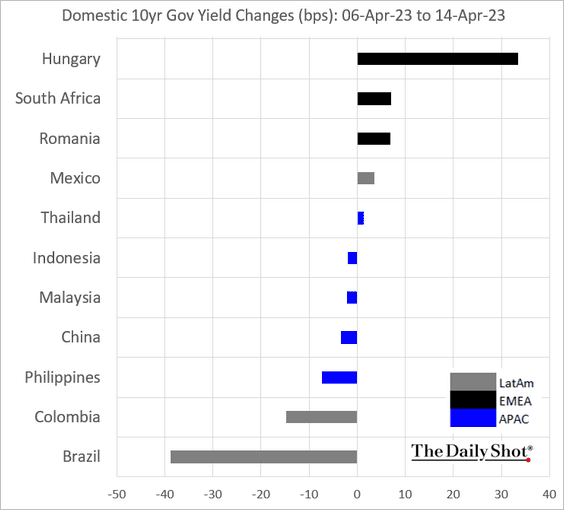
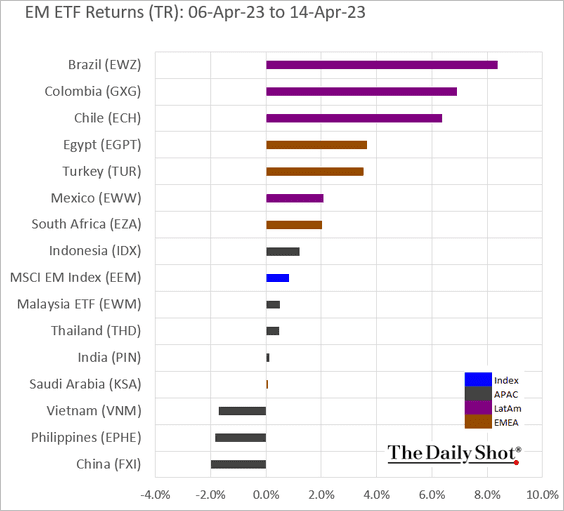
5. Next, we have last week’s performance data.
• Currencies:
• Bond yields:
• Equity ETFs:
Back to Index
Commodities
1. CTAs are very bullish on copper.
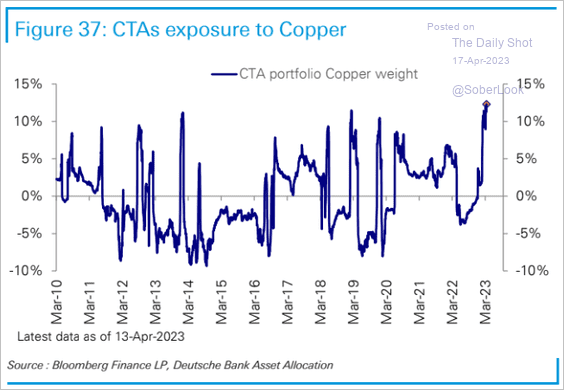 Source: Deutsche Bank Research
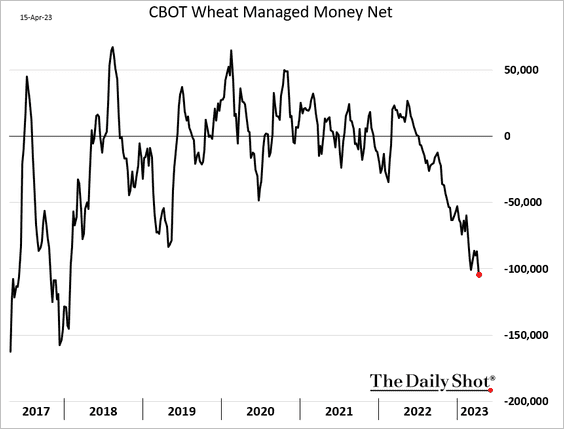
2. Funds have been boosting their bets against US wheat futures amid ample global supplies.
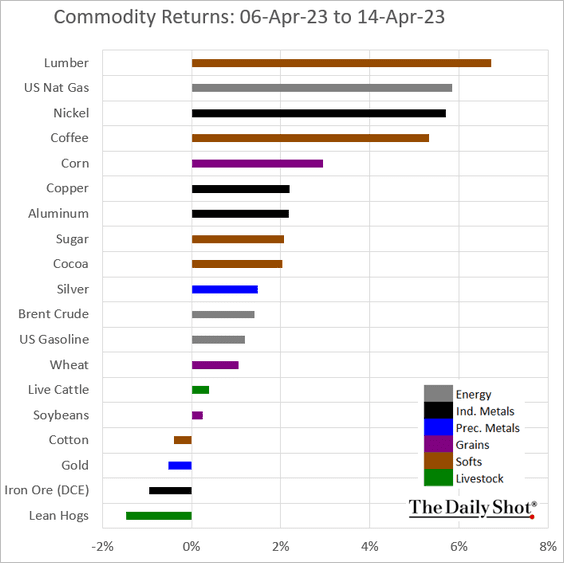
3. Here is last week’s performance across key commodity markets.
Back to Index
Energy
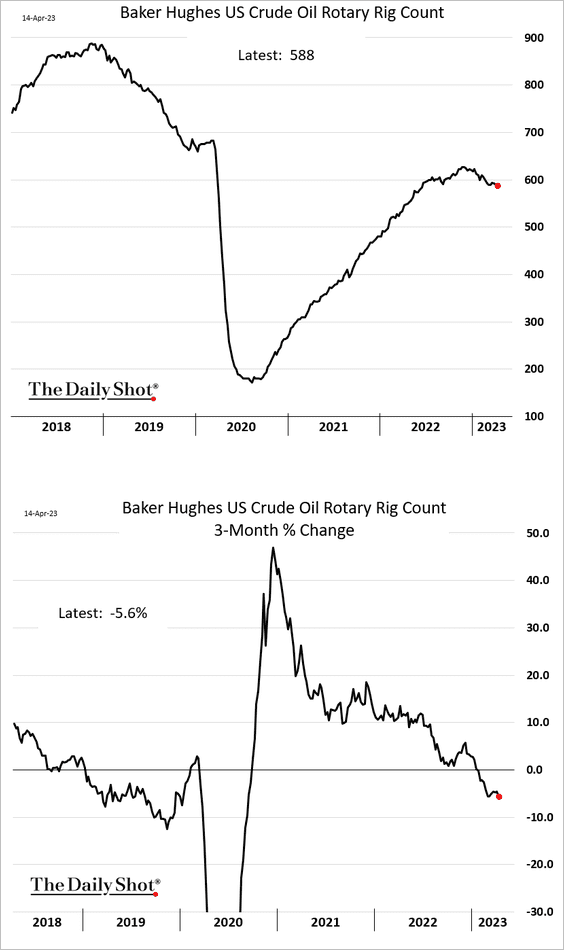
1. The US oil rig count continues to drift lower.
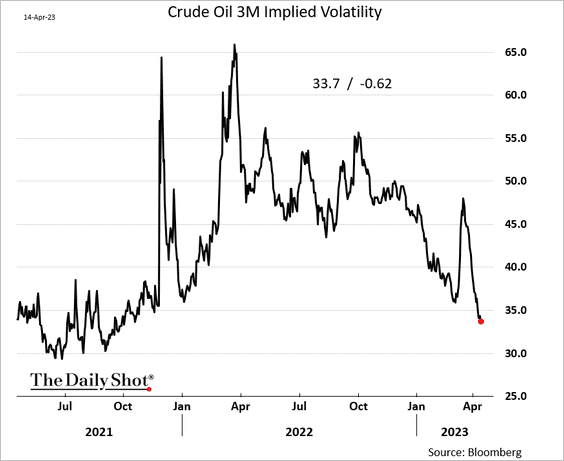
2. Crude oil implied vol keeps falling.
3. US oil companies’ cash returned to shareholders far exceeds capital expenditures.
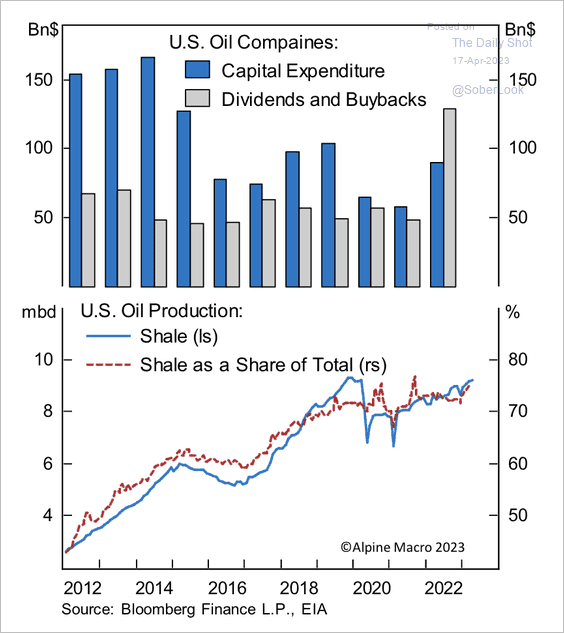 Source: Alpine Macro
Back to Index
Equities
1. Traders jumped into shares of large banks on Friday while dumping regional/small banks.
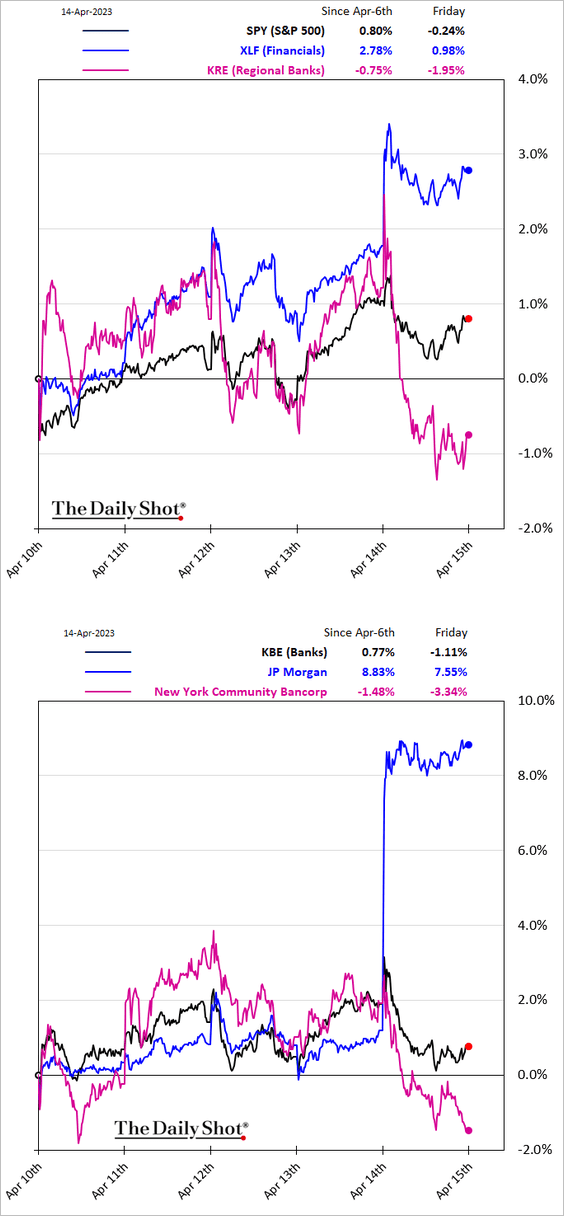
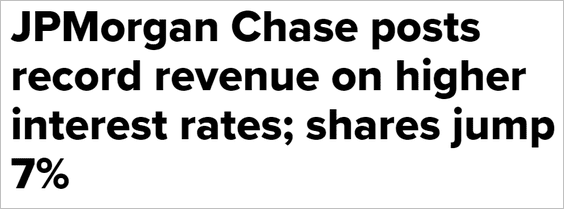 Source: CNBC Read full article
——————–
2. There has been a rise in buying pressure during the last hour of trading this year.
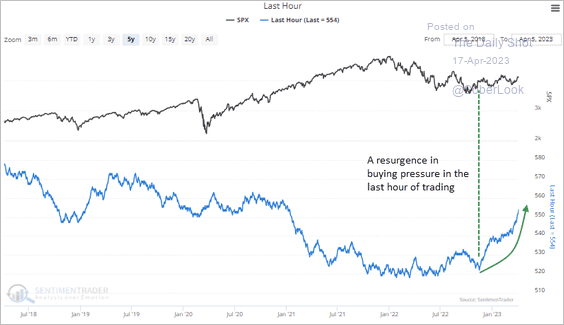 Source: SentimenTrader
3. Deutsche Bank’s consolidated positioning index has been moving up.
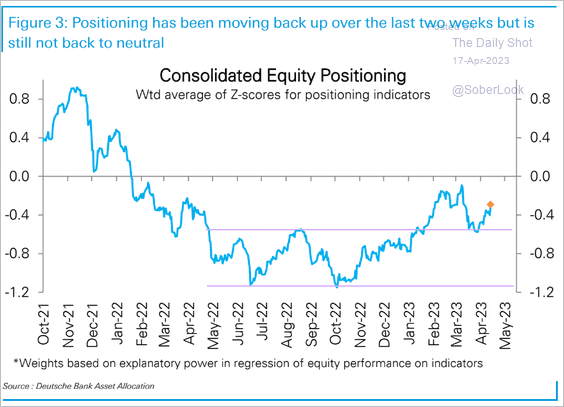 Source: Deutsche Bank Research
4. BofA private clients’ cash allocations are elevated.
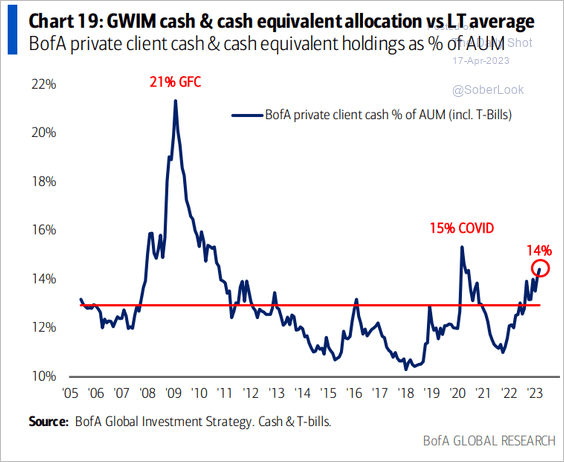 Source: BofA Global Research
5. Are the S&P 500 Q2 and Q3 earnings estimates too optimistic?
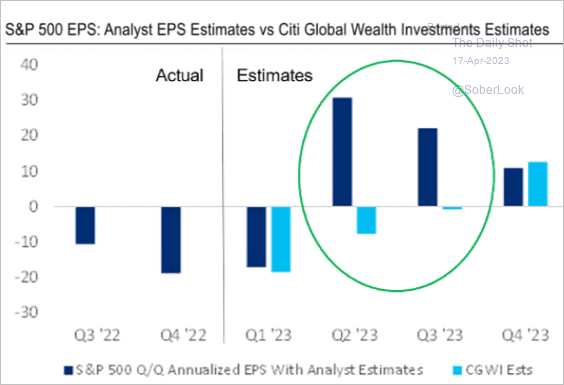 Source: Citi Private Bank
The 2023 consensus earnings per share continue to fall.
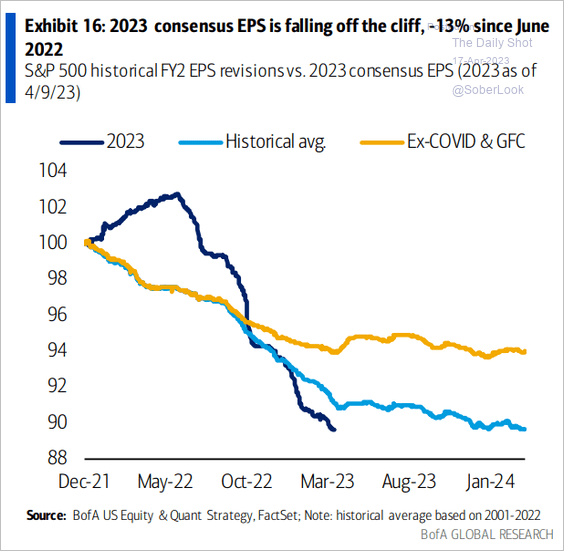 Source: BofA Global Research
——————–
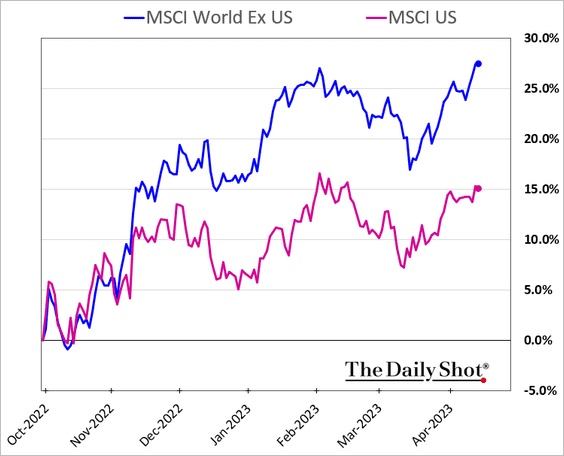
6. US stocks have been lagging behind international peers.
7. Volatility measures continue to sink.
• Realized vol (20-day):
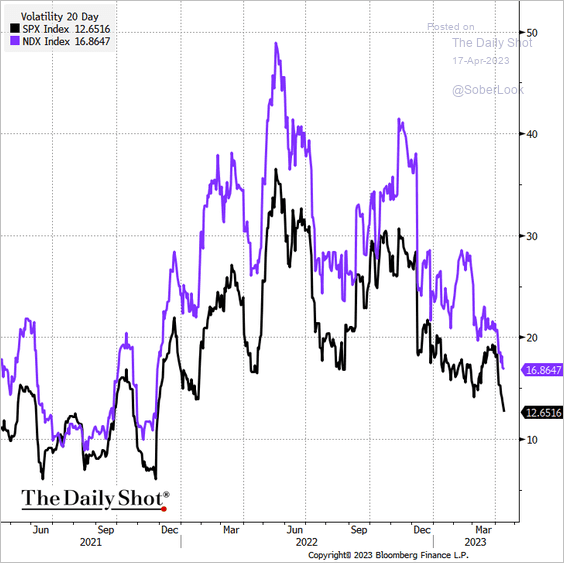 Source: @TheTerminal, Bloomberg Finance L.P.
• Implied vol:
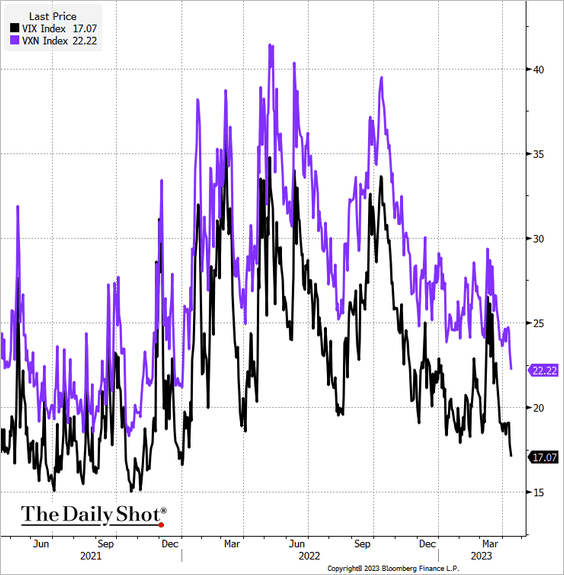 Source: @TheTerminal, Bloomberg Finance L.P.
——————–
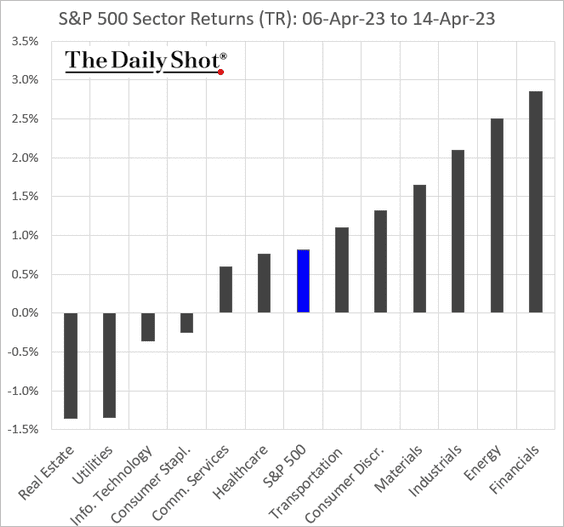
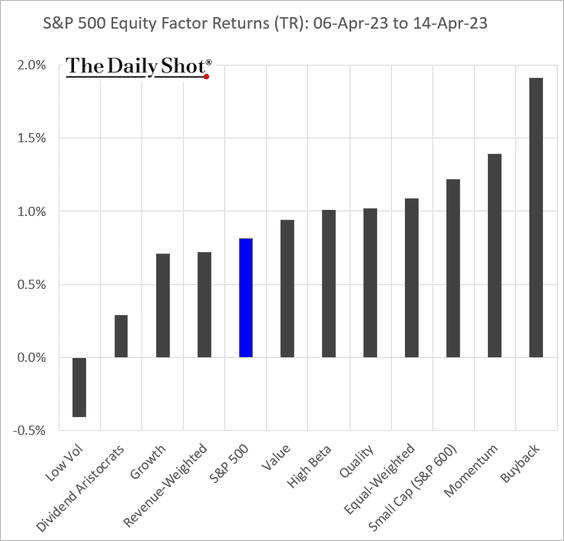
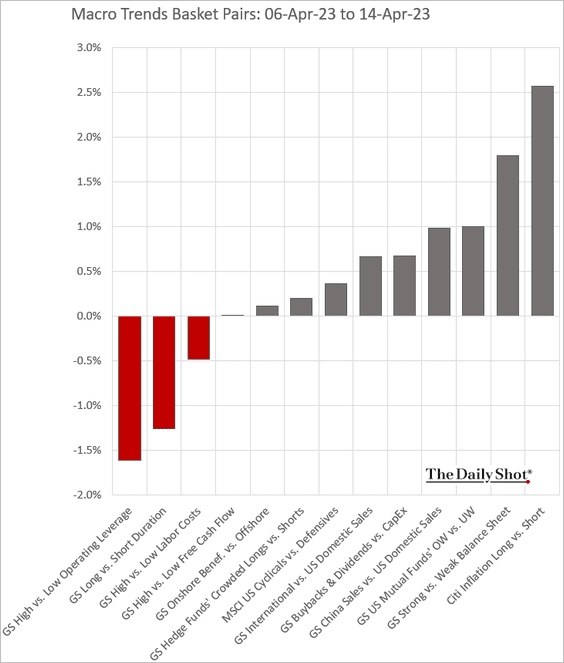
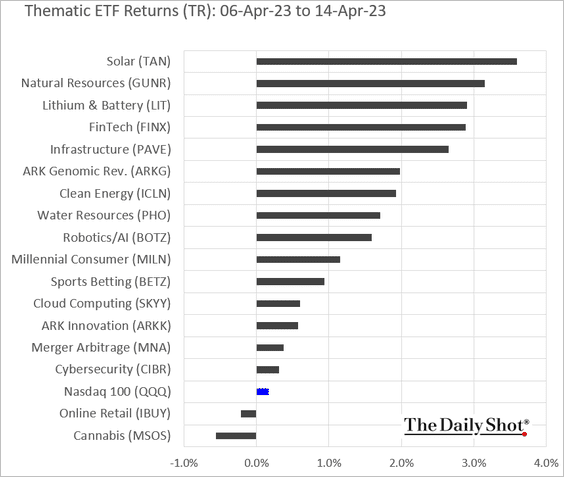
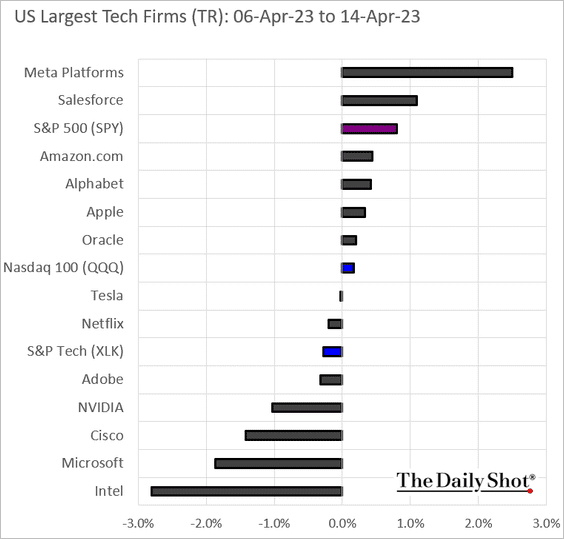
8. Finally, we have some performance data from last week.
• Sectors:
• Equity factors:
• Macro basket pairs’ relative performance:
• Thematic ETFs:
• Largest US tech firms:
Back to Index
Credit
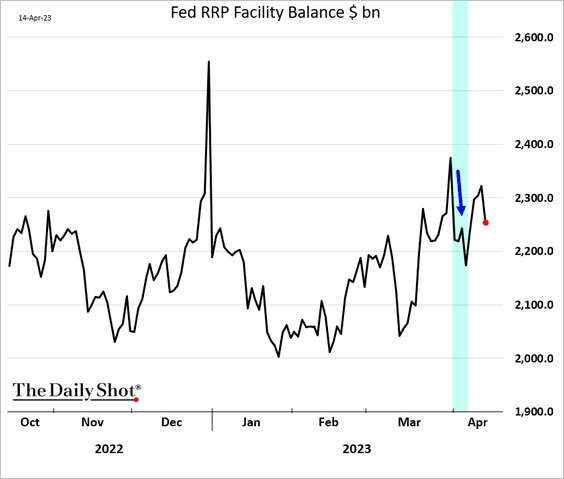
1. Bank deposits increased in the first week of April, …
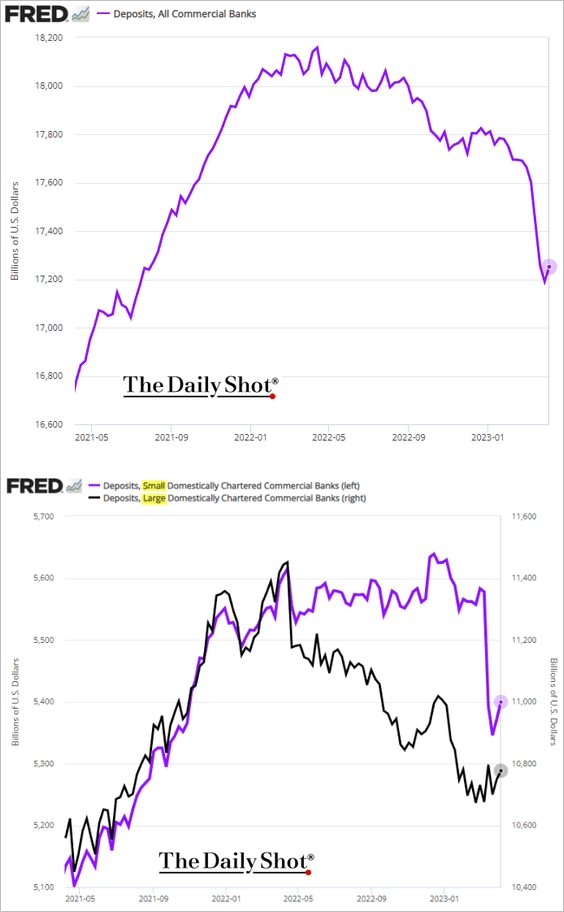
… as the Fed’s RRP facility balance declined (after quarter-end).
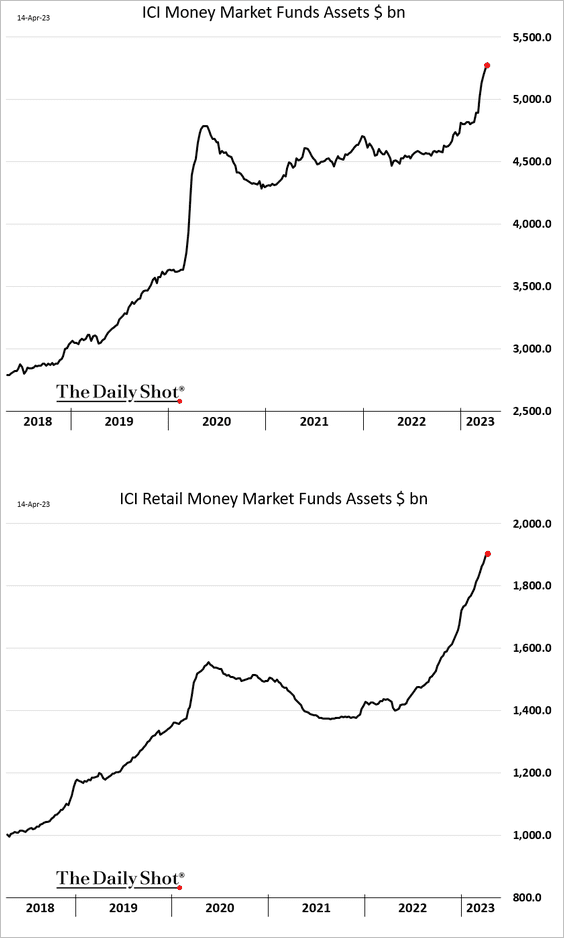
Money market fund balances continue to climb.
——————–
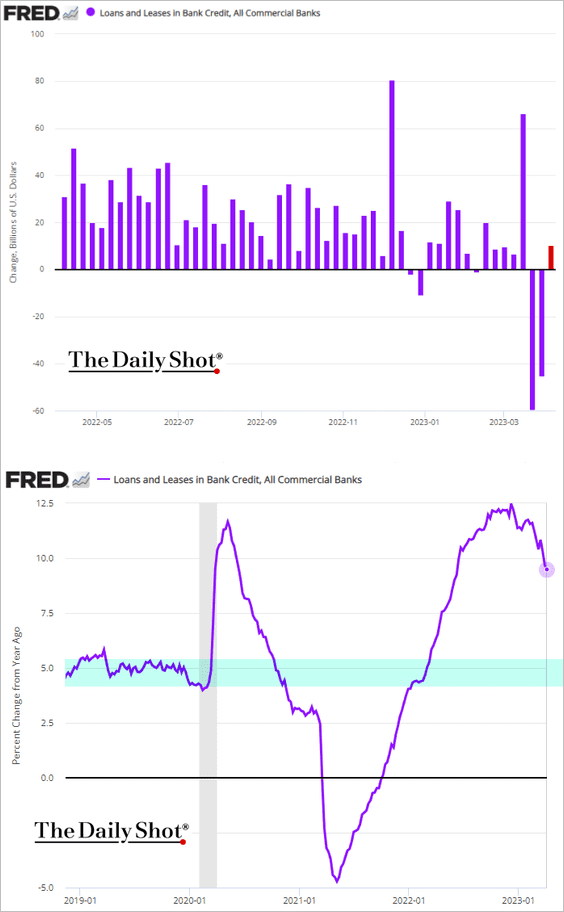
2. US loan growth has been slowing but is still well above pre-COVID levels on a year-over-year basis.
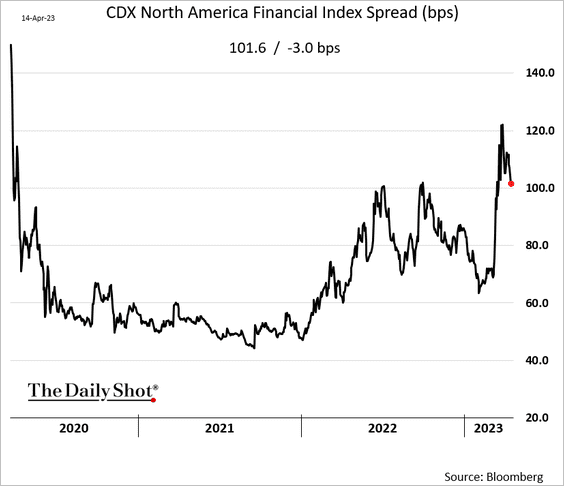
3. Financials’ CDS spreads remain elevated.
4. Leveraged loan flows are about to turn positive.
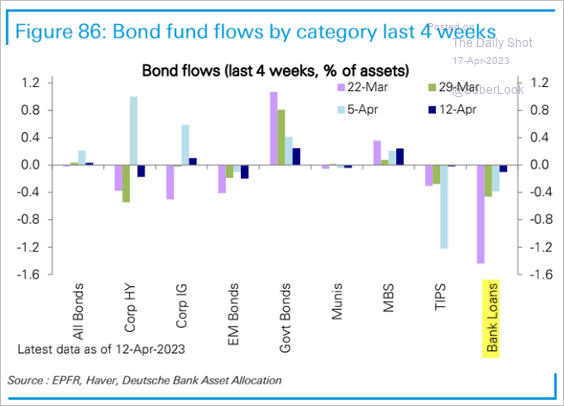 Source: Deutsche Bank Research
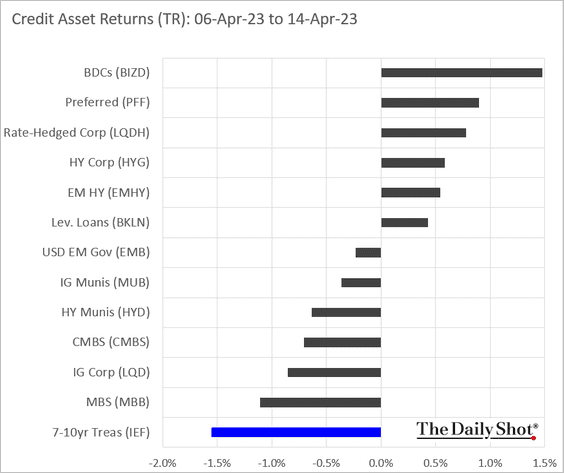
5. Next we have some performance data from last week.
Back to Index
Rates
The 2-year Treasury realized vol hit the highest level since 2009 in recent months.
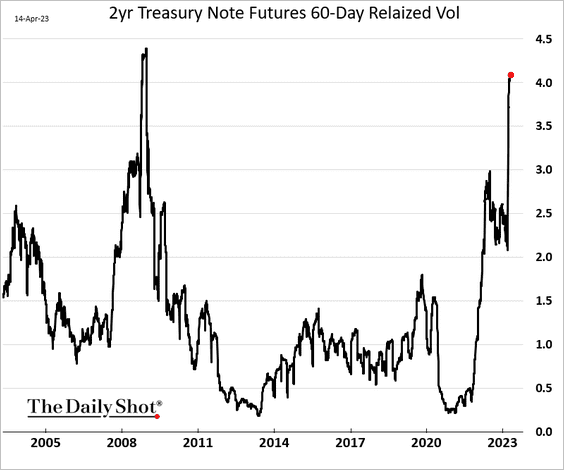
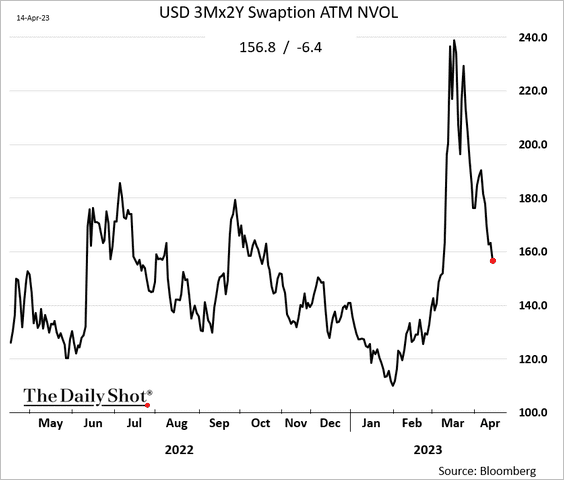
But the 2-year rate implied volatility (based on swaptions) has been coming down quickly.
Rates market implied vol has closed most of the gap with equities.
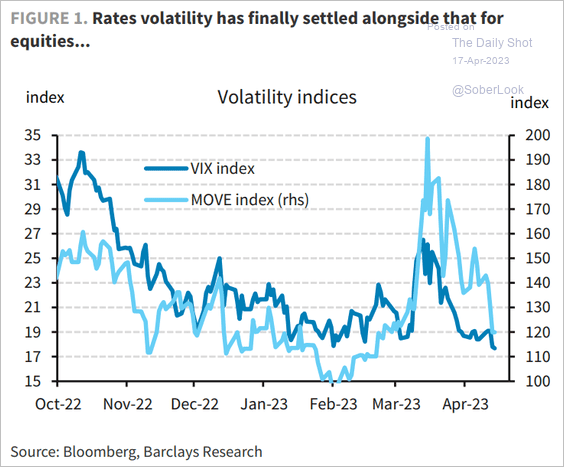 Source: Barclays Research
Back to Index
Global Developments
1. Global cyclicals and companies with more sales outside of the U.S. have outperformed since the dollar peaked in September 2022.
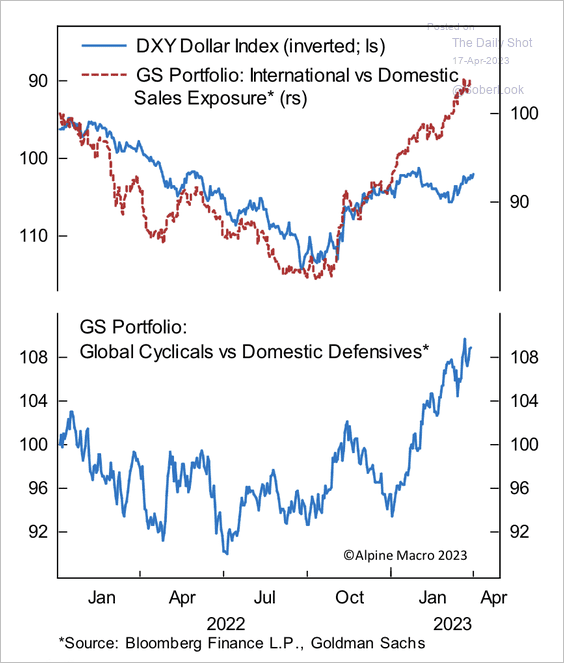 Source: Alpine Macro
2. Here is the difference between policy rates and inflation in selected economies.
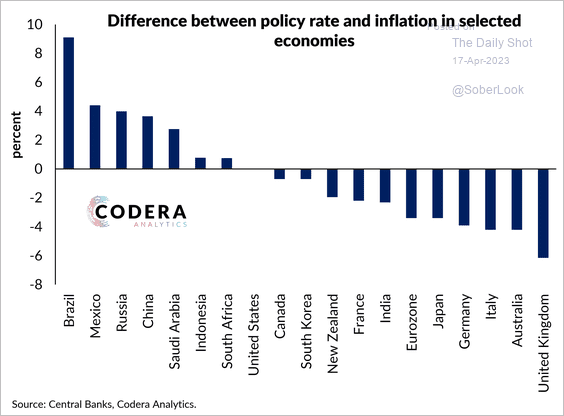 Source: Codera Analytics
3. This chart shows the contributions to growth in vehicle sales with a forecast from Scotiabank Economics.
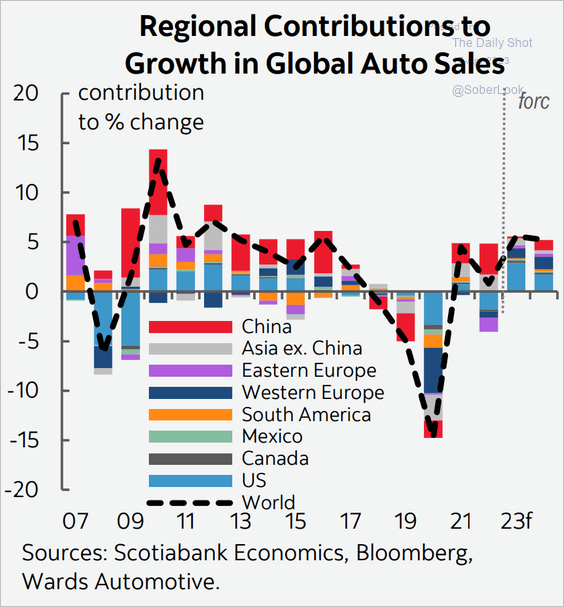 Source: Scotiabank Economics
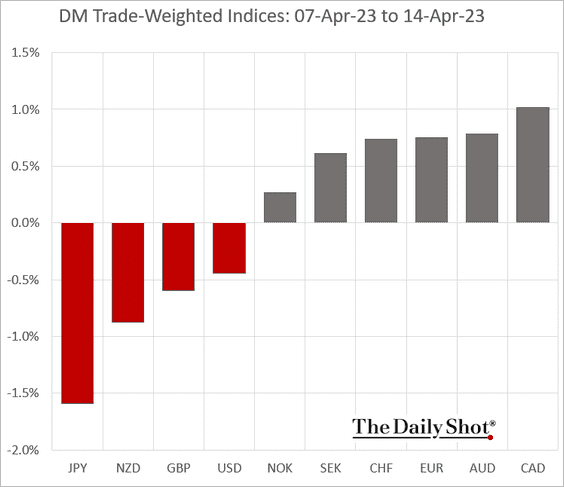
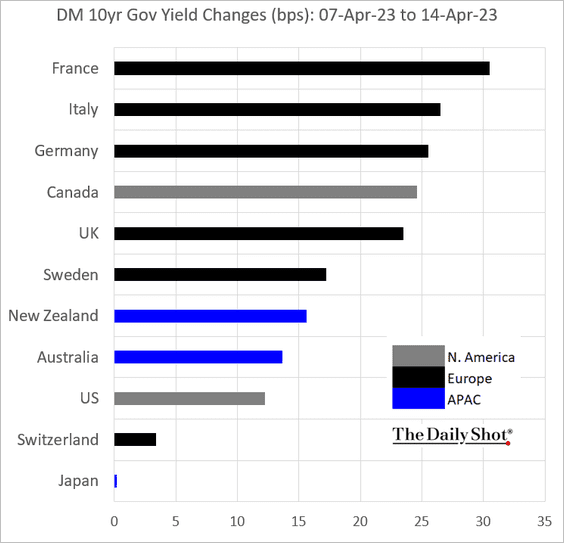
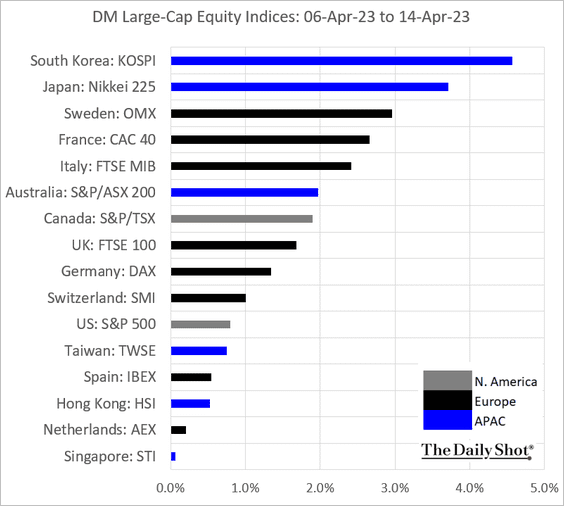
4. Finally, we have some DM performance data from last week.
• Trade-weighted currency indices:
• Bond yields:
• Large-cap equity indices:
——————–
Food for Thought
1. Actual vs. preferred work arrangements:
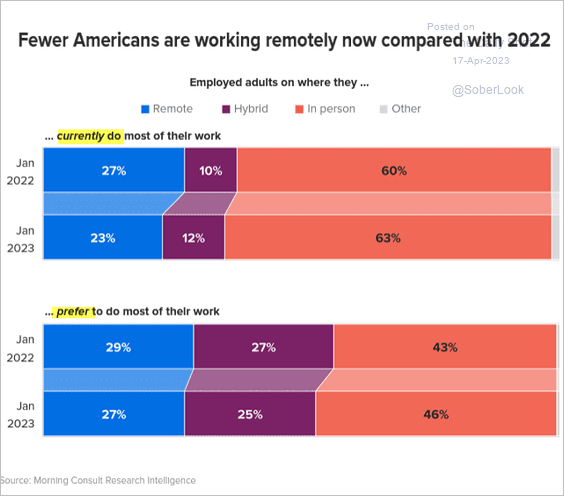 Source: Morning Consult Read full article
2. Getting paid or loving your job?
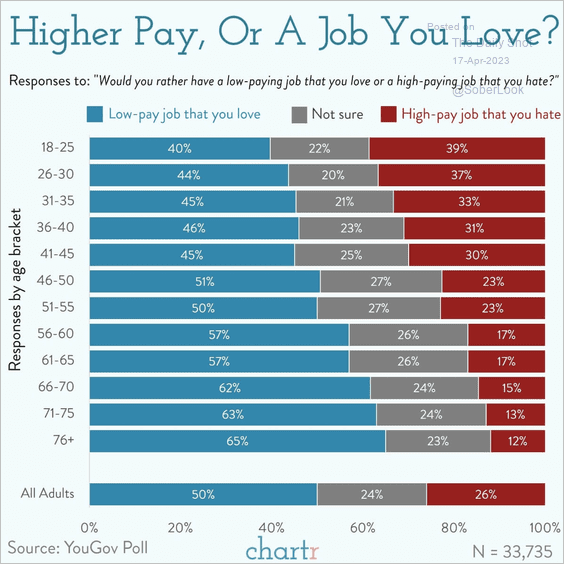 Source: @chartrdaily
3. Hottest job markets:
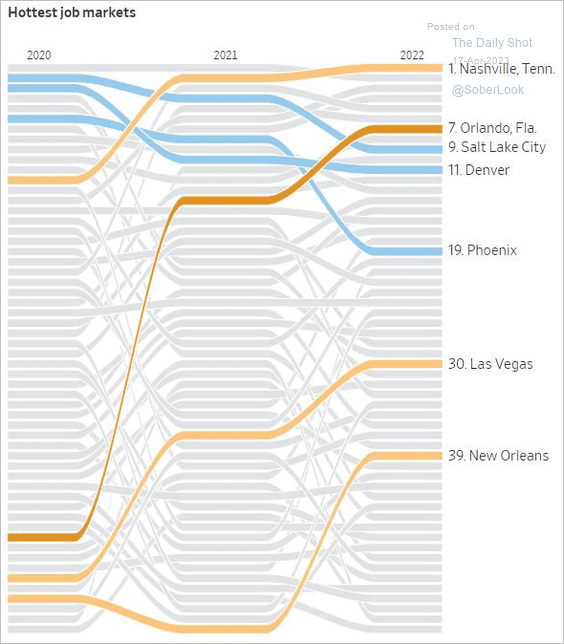 Source: @WSJ Read full article
4. Homeless rates across the US:
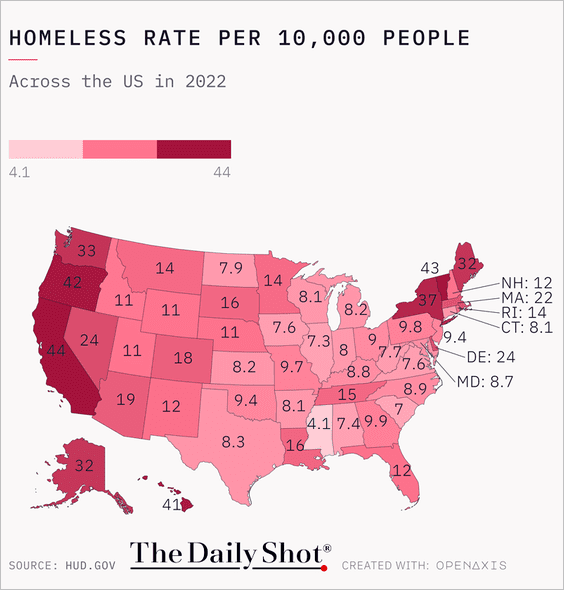 Source: @TheDailyShot
5. Ideology scores:
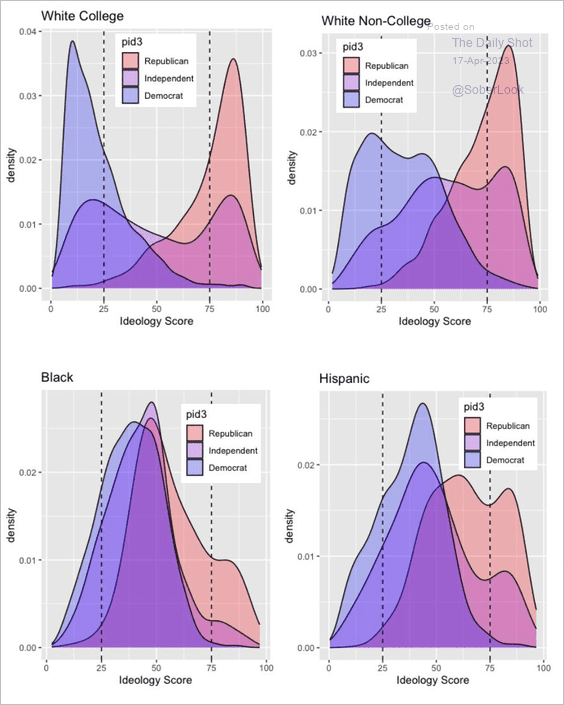 Source: The Intersection Read full article
6. Rice consumption:
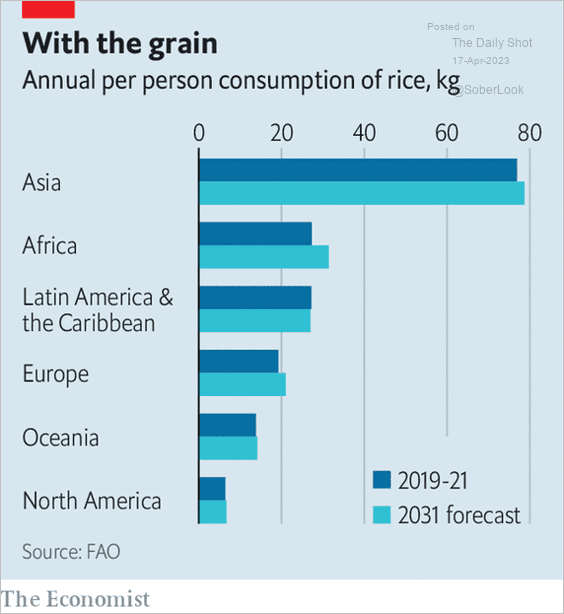 Source: The Economist Read full article
7. Global carbon emissions:
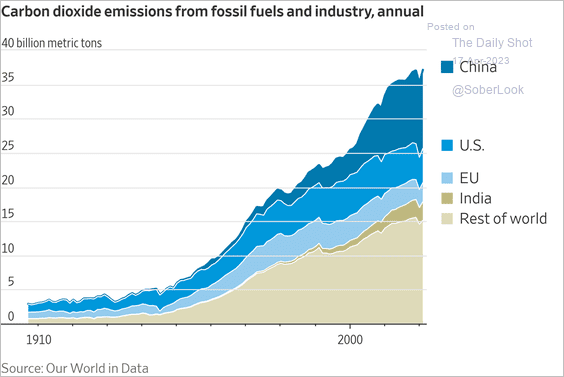 Source: @WSJ Read full article
8. The use of kitchen appliances:
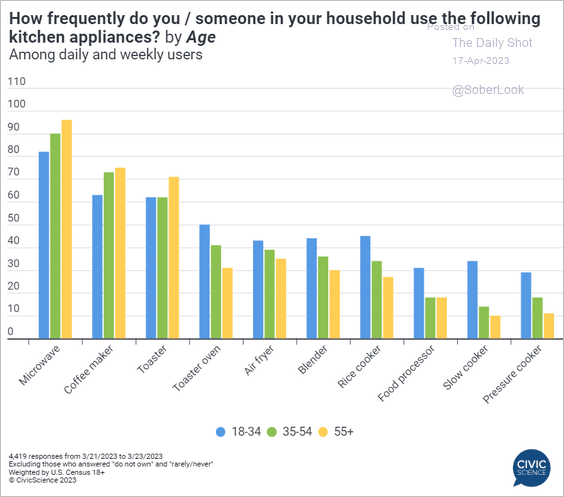 Source: @CivicScience Read full article
——————–
Back to Index