
The Daily Shot: 19-Apr-23
• The United States
• Canada
• The United Kingdom
• The Eurozone
• Europe
• Asia – Pacific
• China
• Commodities
• Energy
• Equities
• Alternatives
• Credit
• Global Developments
• Food for Thought
The United States
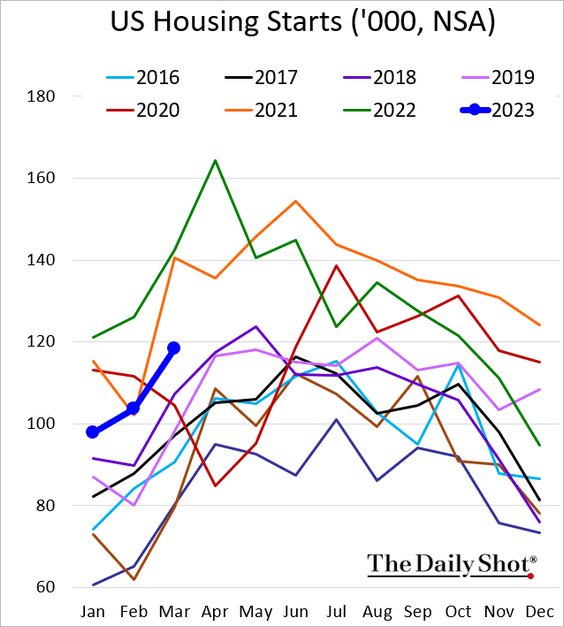
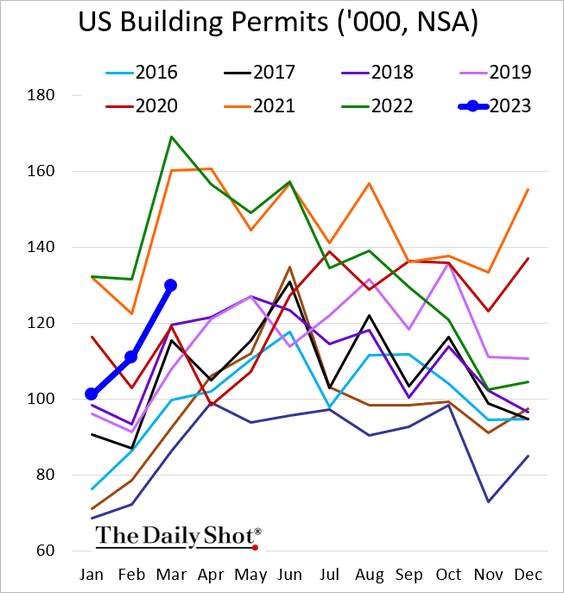
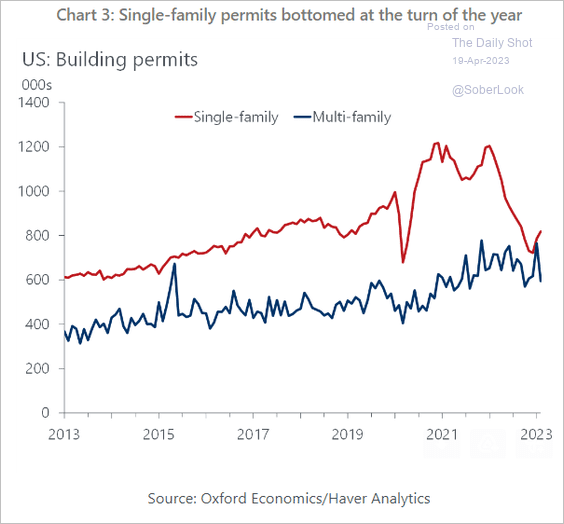
1. US residential construction shows signs of resilience, with housing starts and building permits holding up well in March.
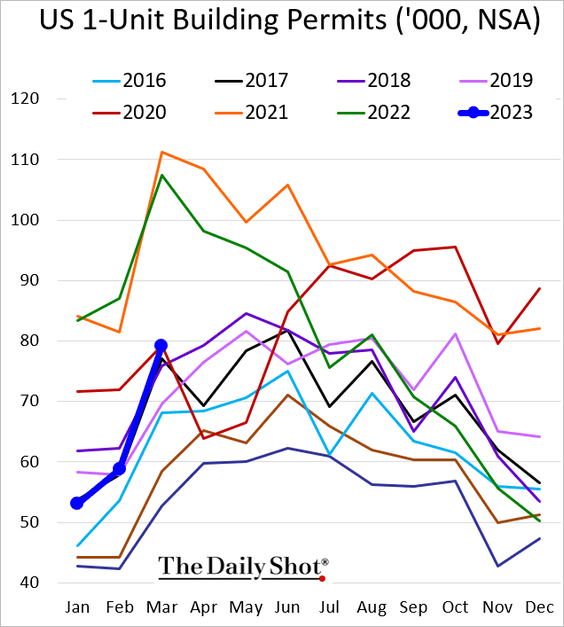
• Single-family permits jumped in last month.
 Source: Reuters Read full article
But mortgage applications point to downside risks.
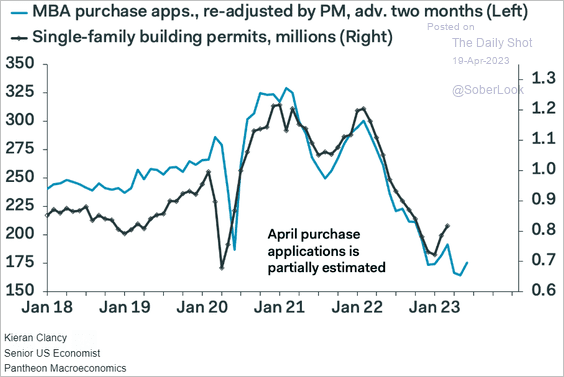 Source: Pantheon Macroeconomics
Multi-family housing permits declined.
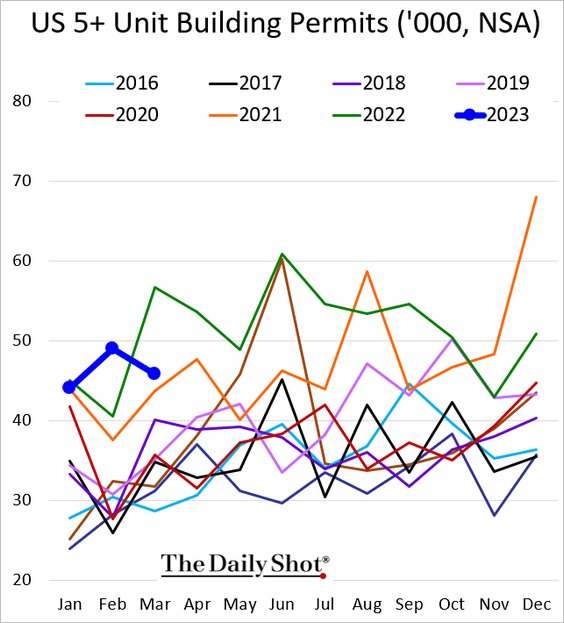
Here are the seasonally-adjusted trends.
 Source: Oxford Economics
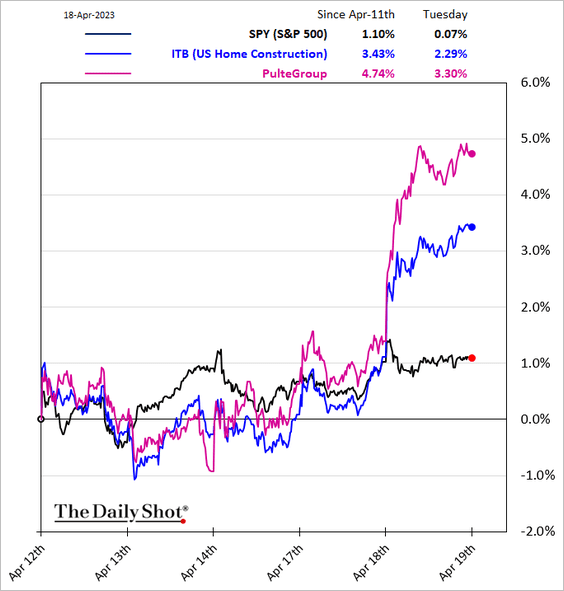
• Shares of homebuilders rallied.
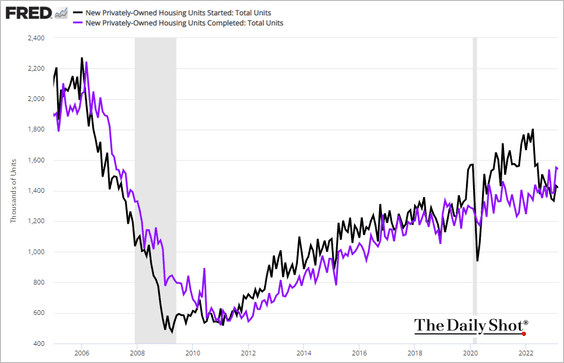
• Housing completions now outpace starts.
• Multifamily units under construction are at the highest level in decades.
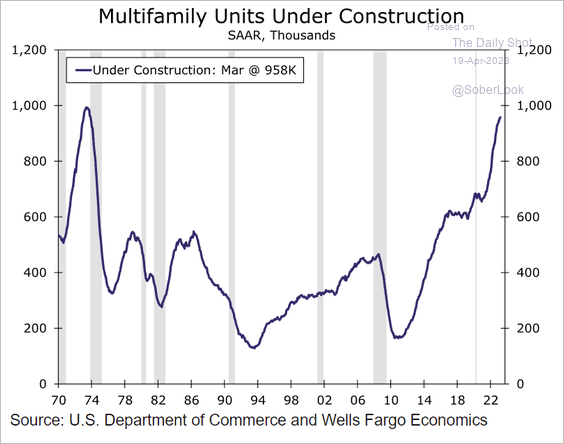 Source: Wells Fargo Securities
• This chart shows housing starts by region.
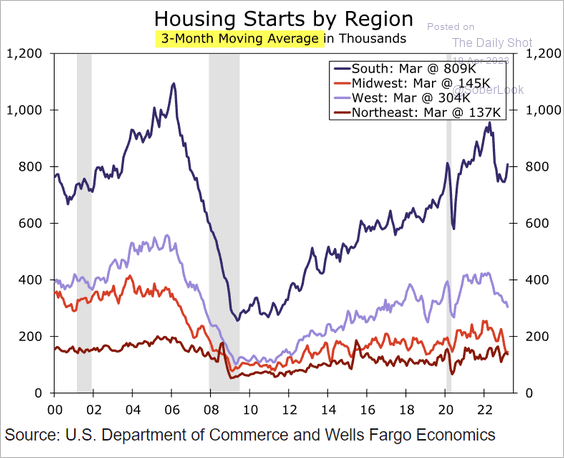 Source: Wells Fargo Securities
——————–
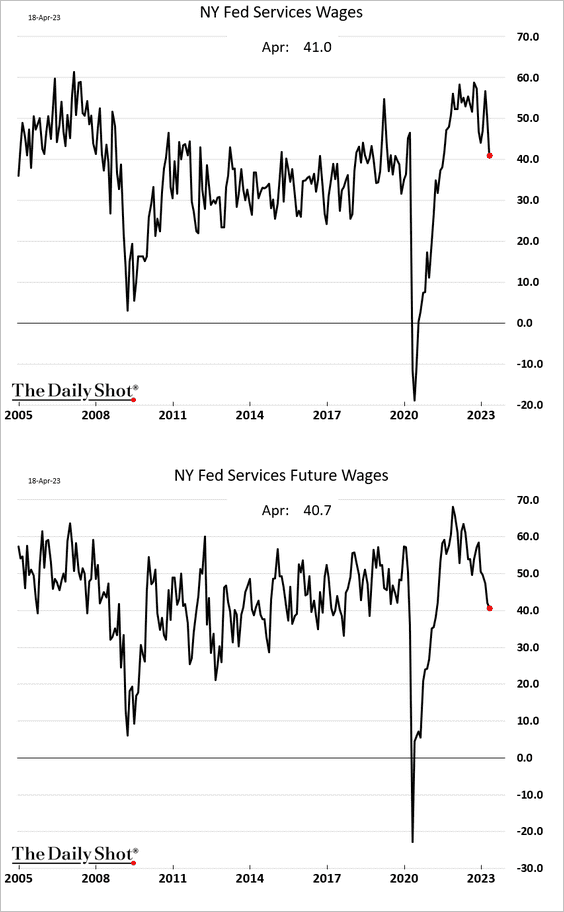
2. According to the NY Fed’s services index, the region’s firms are currently struggling, with hiring stalled.
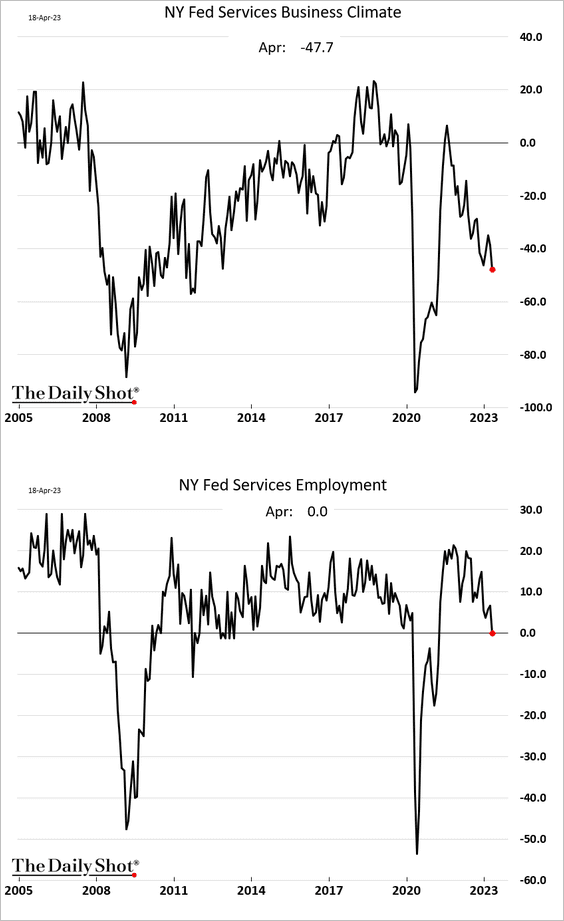
Price pressures continue to ease.
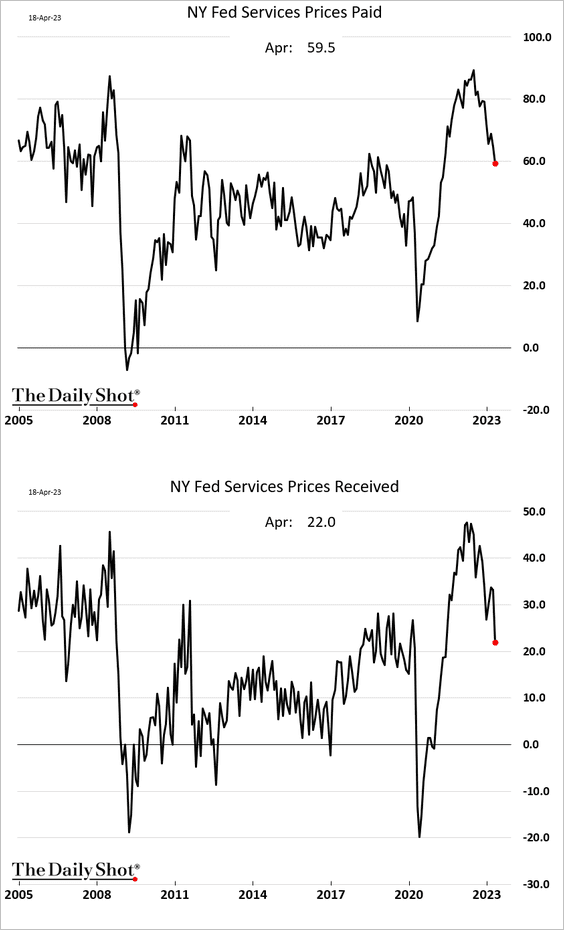
And fewer companies are boosting wages.
——————–
3. So far, leading indicators and manufacturing data signal recession, while consumption and labor remain resilient.
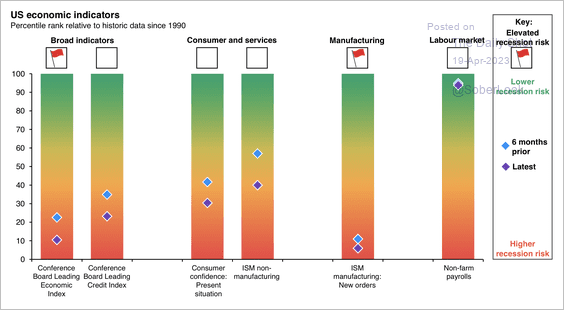 Source: J.P. Morgan Asset Management
But there are enough red flags to suggest that a recession is likely in the months ahead.
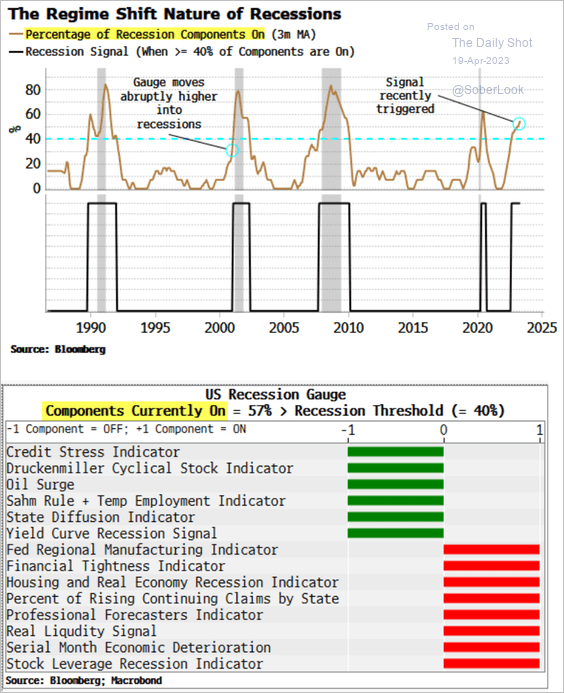 Source: Simon White, Bloomberg Markets Live Blog
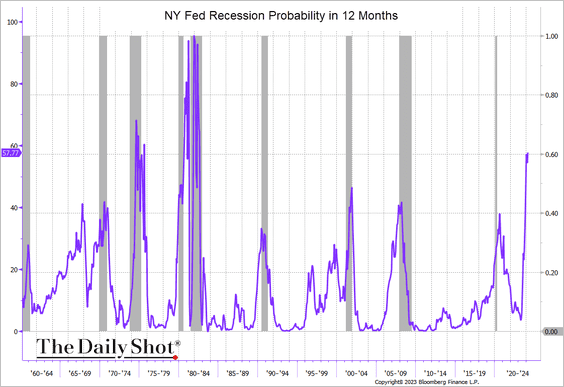
Here is the NY Fed’s curve-based recession probability.
Additional tightening in bank lending standards could weigh on economic growth and reduce capital expenditures.
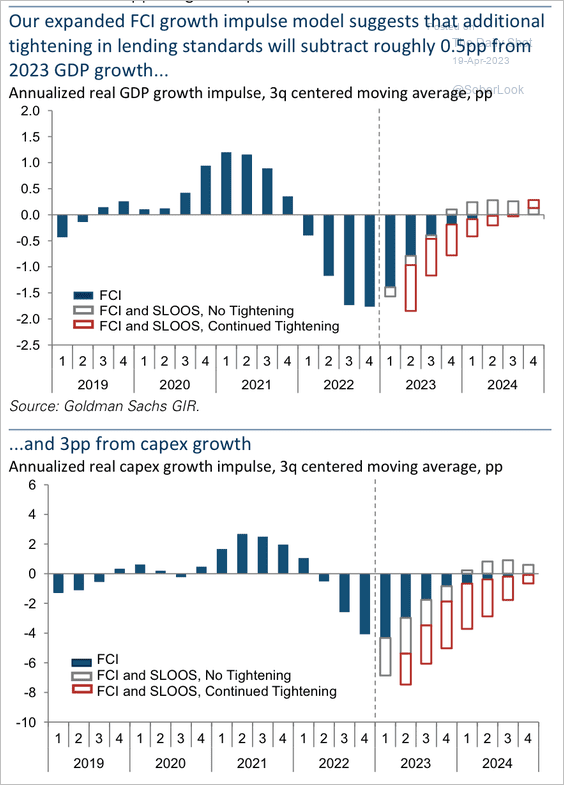 Source: Goldman Sachs
——————–
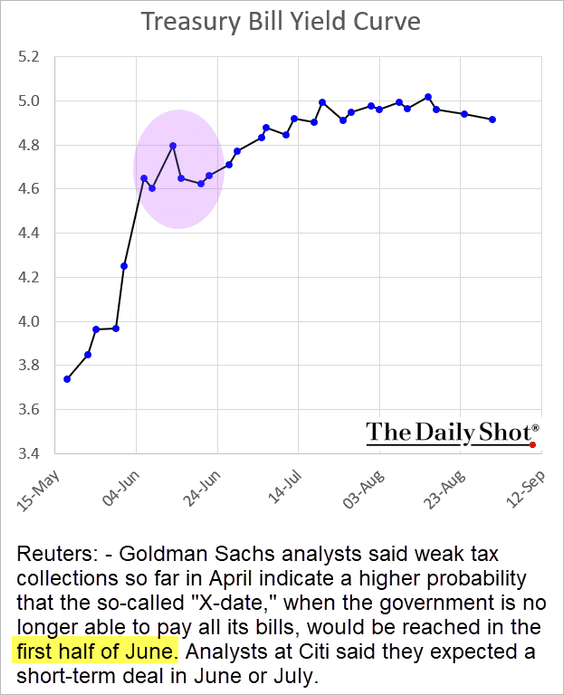
4. Most investors still expect the debt ceiling impasse to get resolved at the last minute as it has been in the past. But given the political situation, this time could be different. Moreover, with tax receipts running below previous years’ levels, the X-date could arrive sooner than expected.
 Source: Reuters Read full article
The Treasury bill curve is now signaling June.
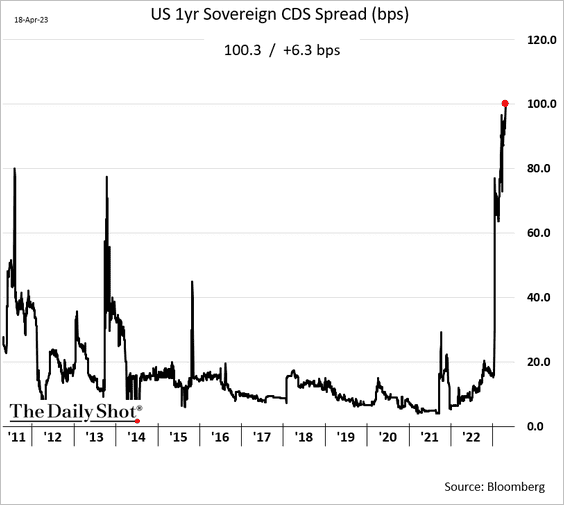
And the sovereign credit default swap spread is hitting new highs as demand for hedges against a US default climbs.
Default due to the debt ceiling impasse could have a devastating impact on the domestic and global economy, with long-lasting consequences that could persist for decades.
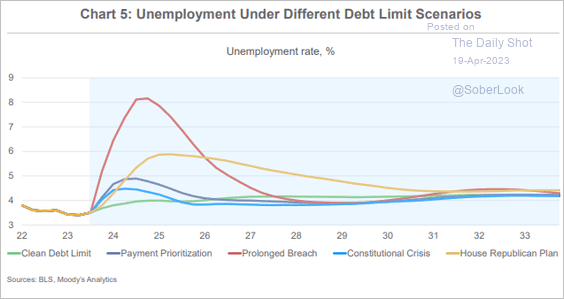 Source: Moody’s Analytics
Back to Index
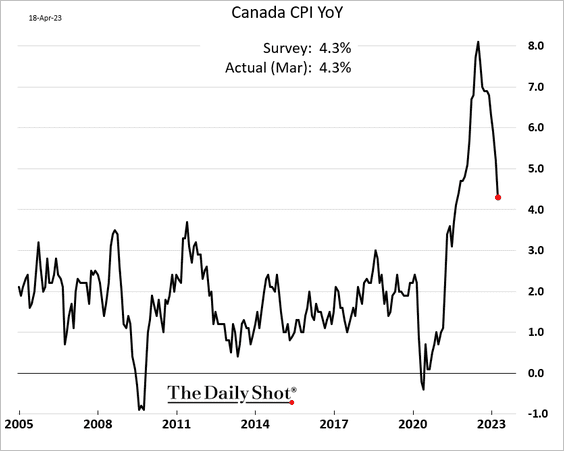
Canada
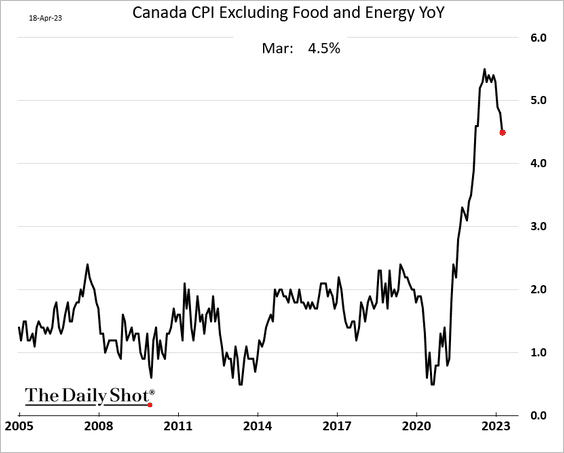
Inflation continues to ease.
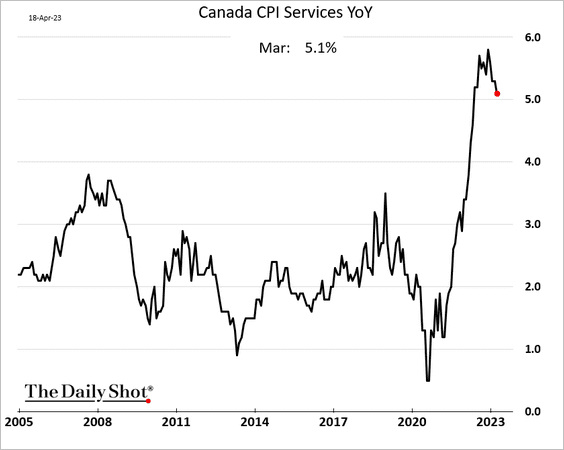
• But services CPI remains elevated.
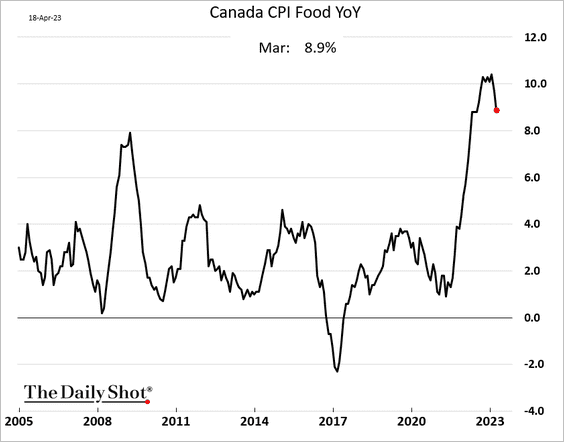
• Food inflation is also very high.
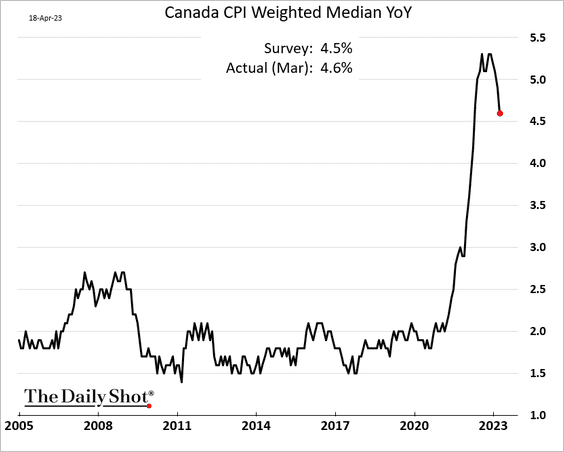
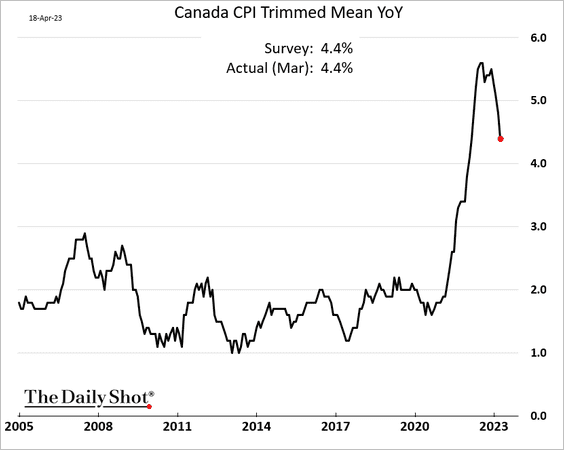
• Below are the measures of core inflation.
– CPI excluding food and energy:
– Median CPI:
– Trimmed-mean CPI:
– The above three indicators on a month-over-month basis:
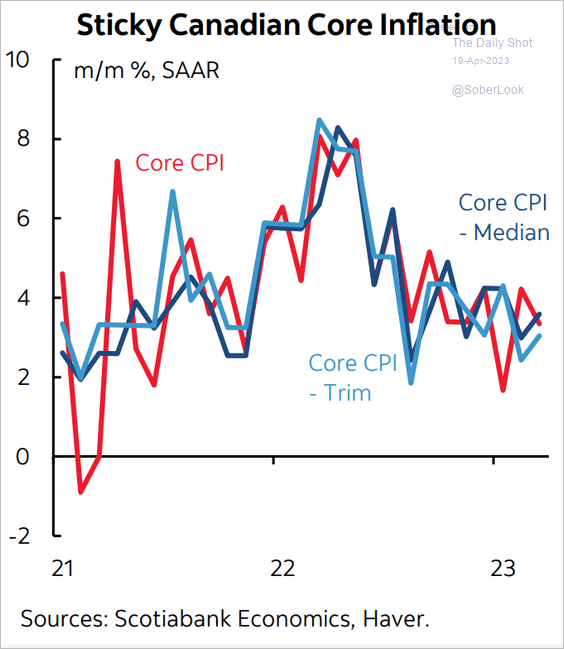 Source: Scotiabank Economics
Back to Index
The United Kingdom
1. Let’s begin with the labor market.
• Wage growth surprised to the upside, which will put pressure on the BoE.
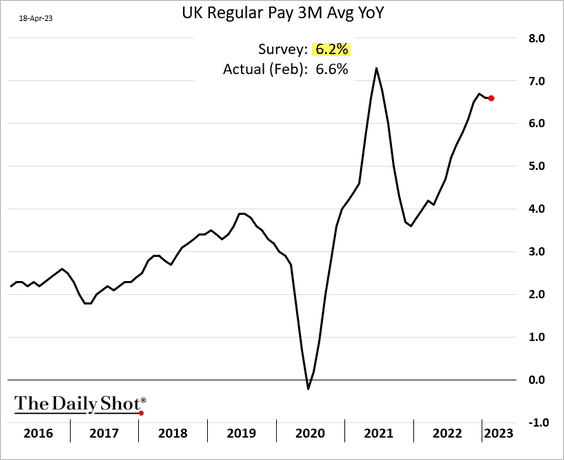
 Source: @LucyGJWhite, @PhilAldrick, @economics Read full article
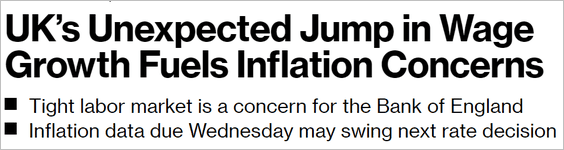
• Growth in UK payrolls has been slowing.
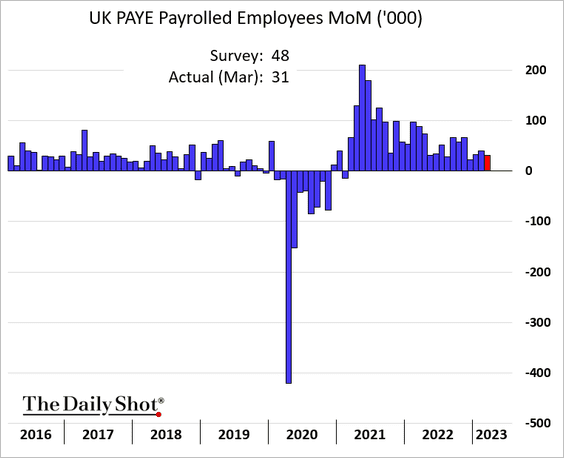
• The unemployment rate ticked higher in the three months ending in February.
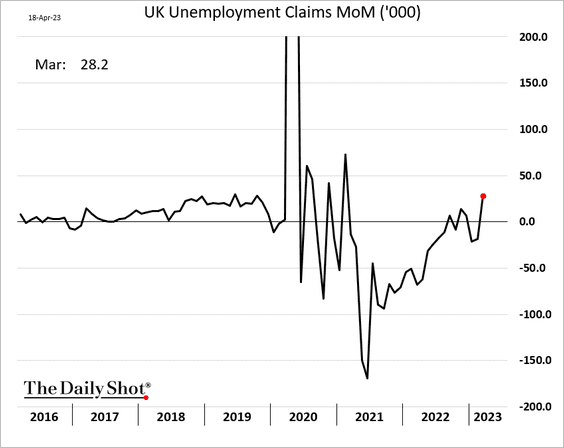
• Net claims are in positive territory.
• Self-employment jobs have pricked up.
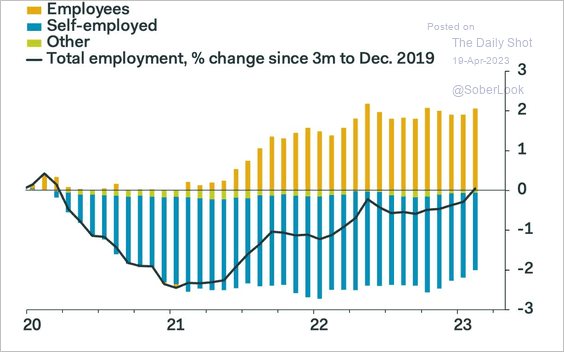 Source: Pantheon Macroeconomics
• This chart shows the drivers of labor market inactivity.
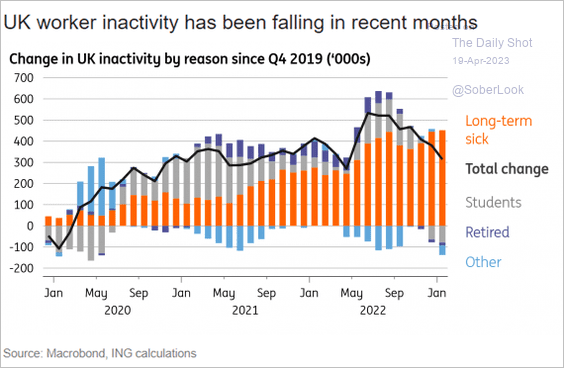 Source: ING
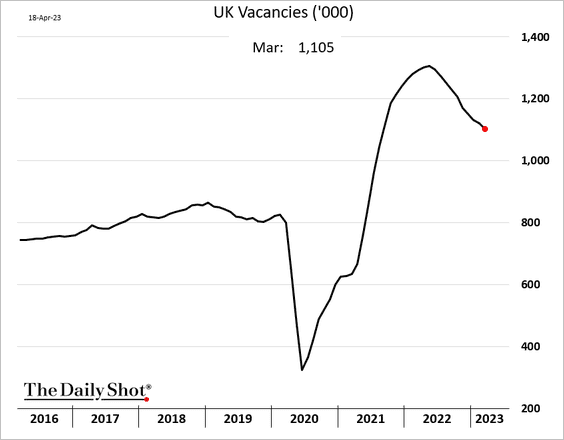
• Job vacancies remain well above pre-COVID levels.
——————–
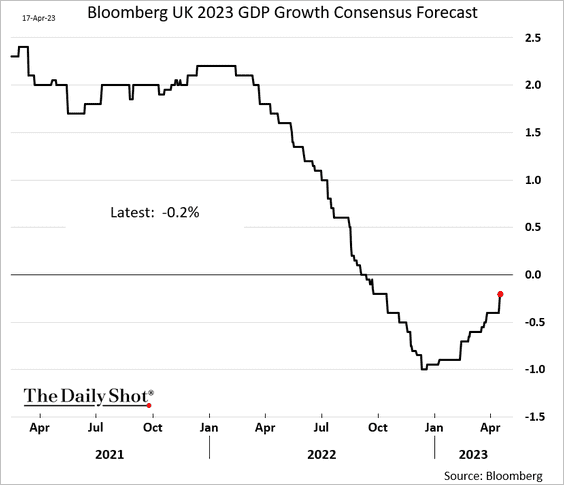
2. Economists have been upgrading their economic growth projections for 2023.
• The GDP trajectory has been widening its divergence from the pre-COVID trend.
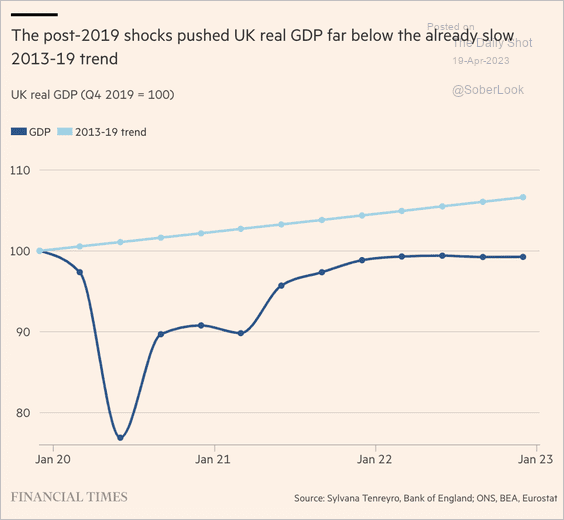 Source: @financialtimes Read full article
Back to Index
The Eurozone
1. Germany’s ZEW index of growth expectations surprised to the downside.

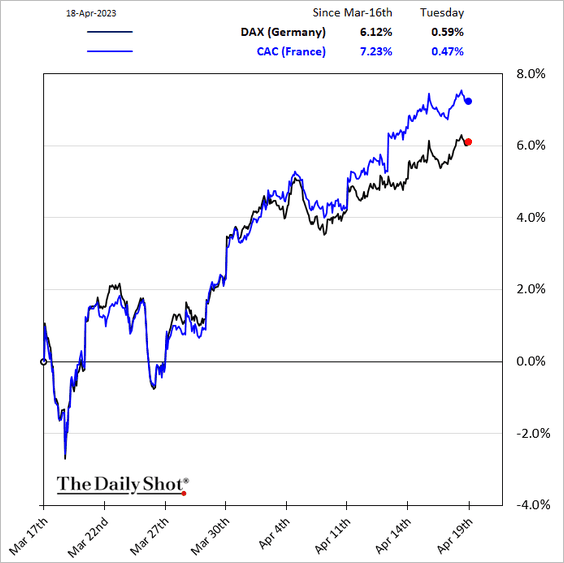
2. European stock indices have been surging, with French stocks outperforming (driven by luxury product demand from China).
3. Real wage growth has been running below that of the US.
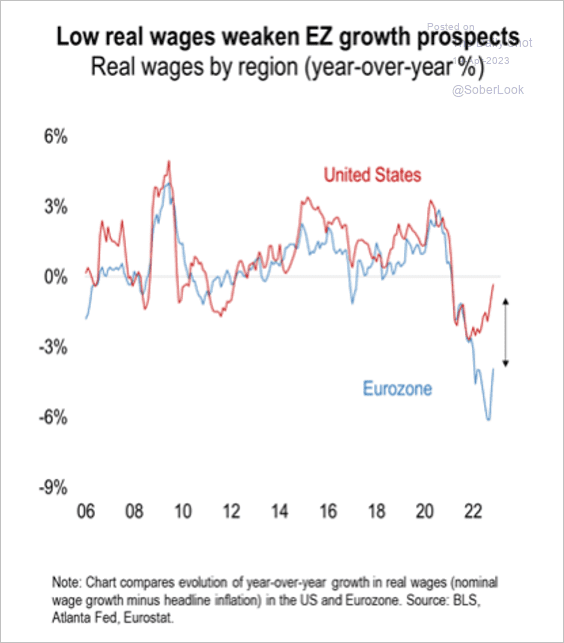 Source: Numera Analytics (@NumeraAnalytics)
4. Budget deficits above 3% have become more entrenched.
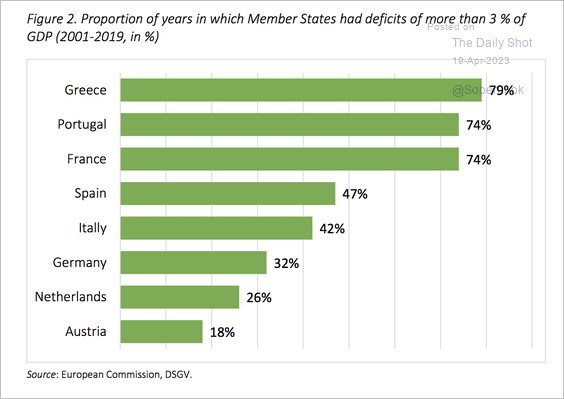 Source: CEPS Read full article
5. This chart shows President Macron’s approval ratings.
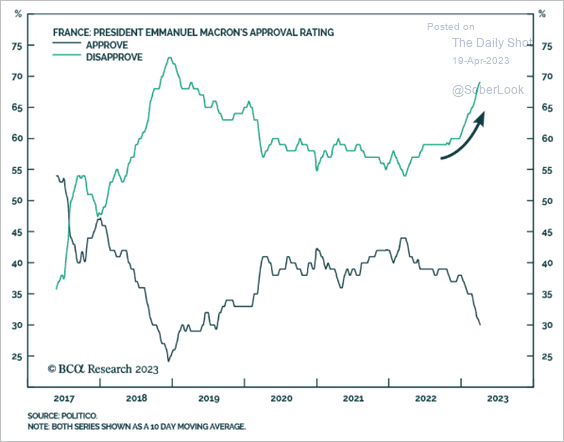 Source: BCA Research
Back to Index
Europe
1. Europe still exports LNG from Russia.
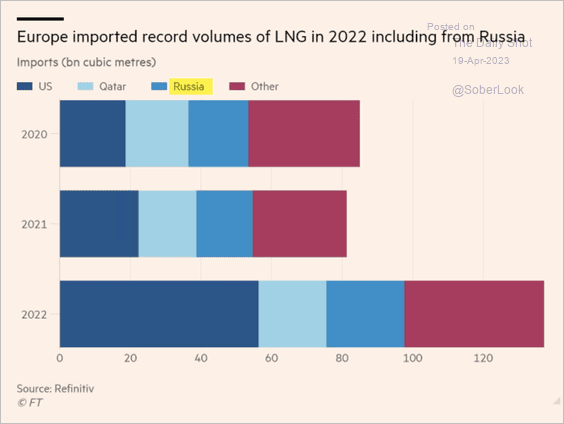 Source: @financialtimes Read full article
2. Which countries rely most on tourism?
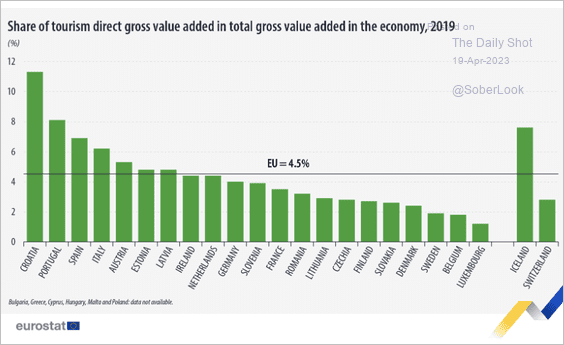 Source: Eurostat Read full article
3. This scatterplot shows European investors’ views on sector valuations versus their positioning.
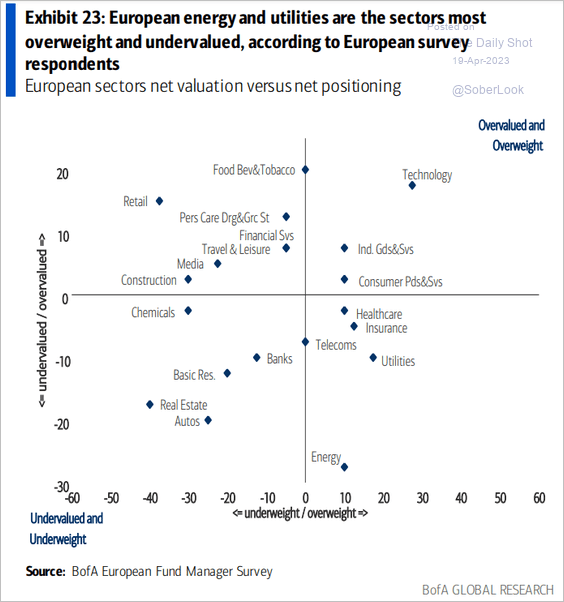 Source: BofA Global Research
4. Europe is increasingly running a surplus in agricultural trade.
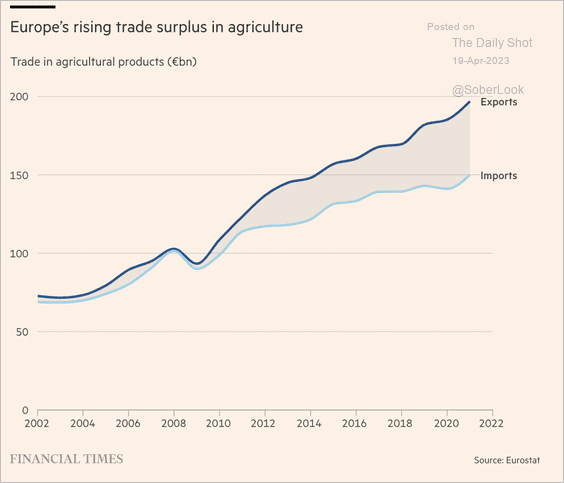 Source: @financialtimes Read full article
5. Finally, we have the EU population pyramid in 2022 and 2100.
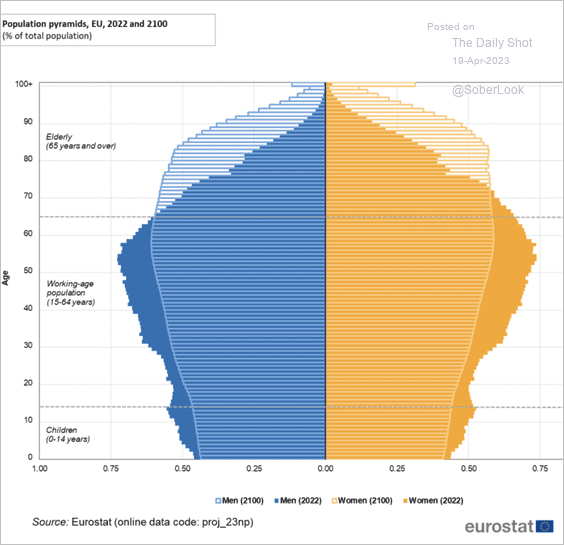 Source: Eurostat Read full article
Back to Index
Asia – Pacific
1. Japan’s median CPI is at record levels.
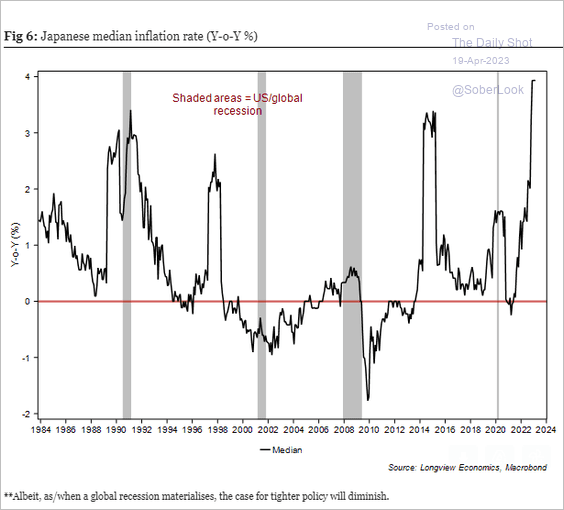 Source: Longview Economics
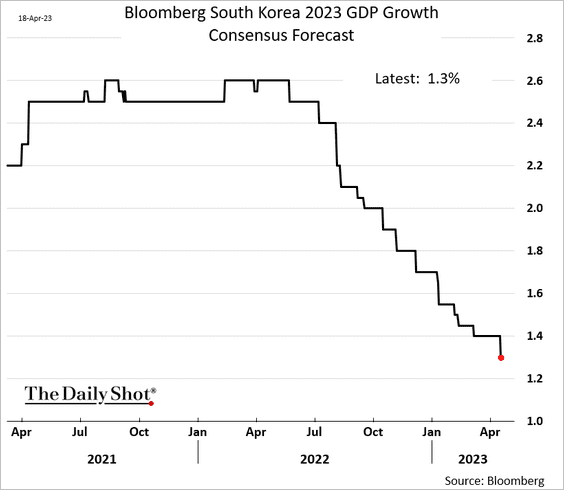
2. Economists have been downgrading South Korea’s growth estimates for this year.
Back to Index
China
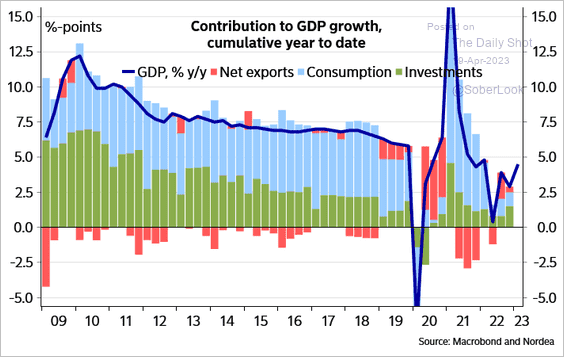
1. Nordea sees China’s economy growing by 6% this year.
 Source: Nordea Markets
Here are the key economic indicators (levels).
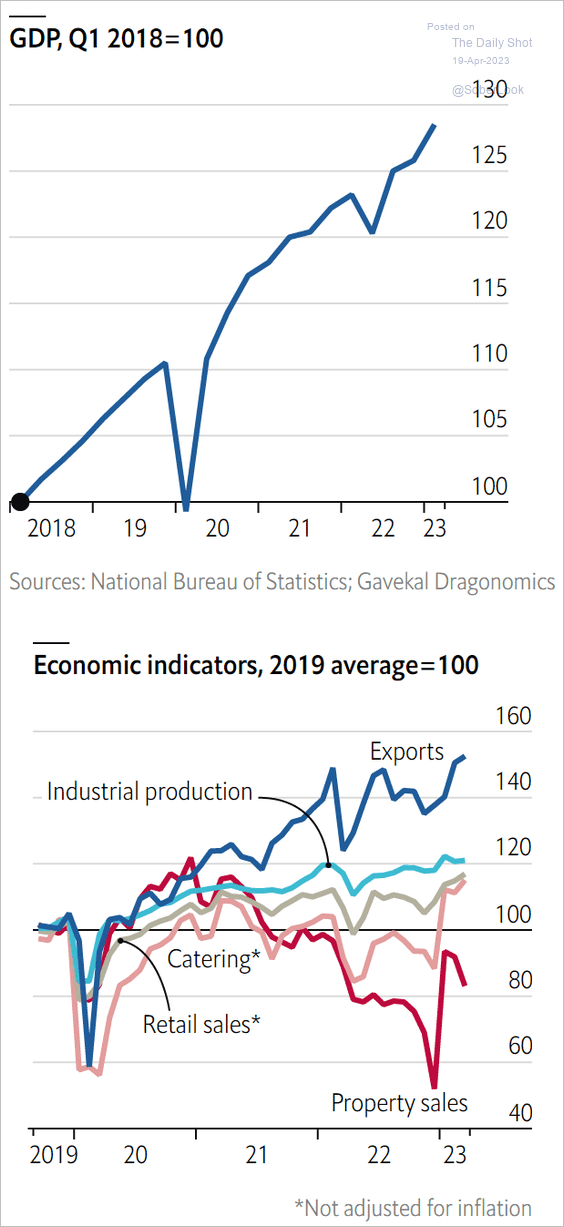 Source: The Economist Read full article
And this chart shows the GDP components for Q4 and Q1.
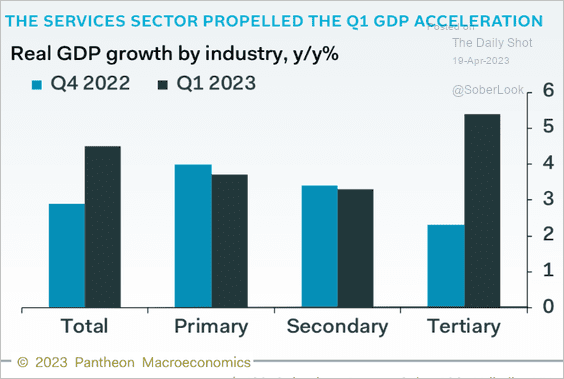 Source: Pantheon Macroeconomics
——————–
2. The World Economics SMI report shows robust business expansion this month, driven by services.
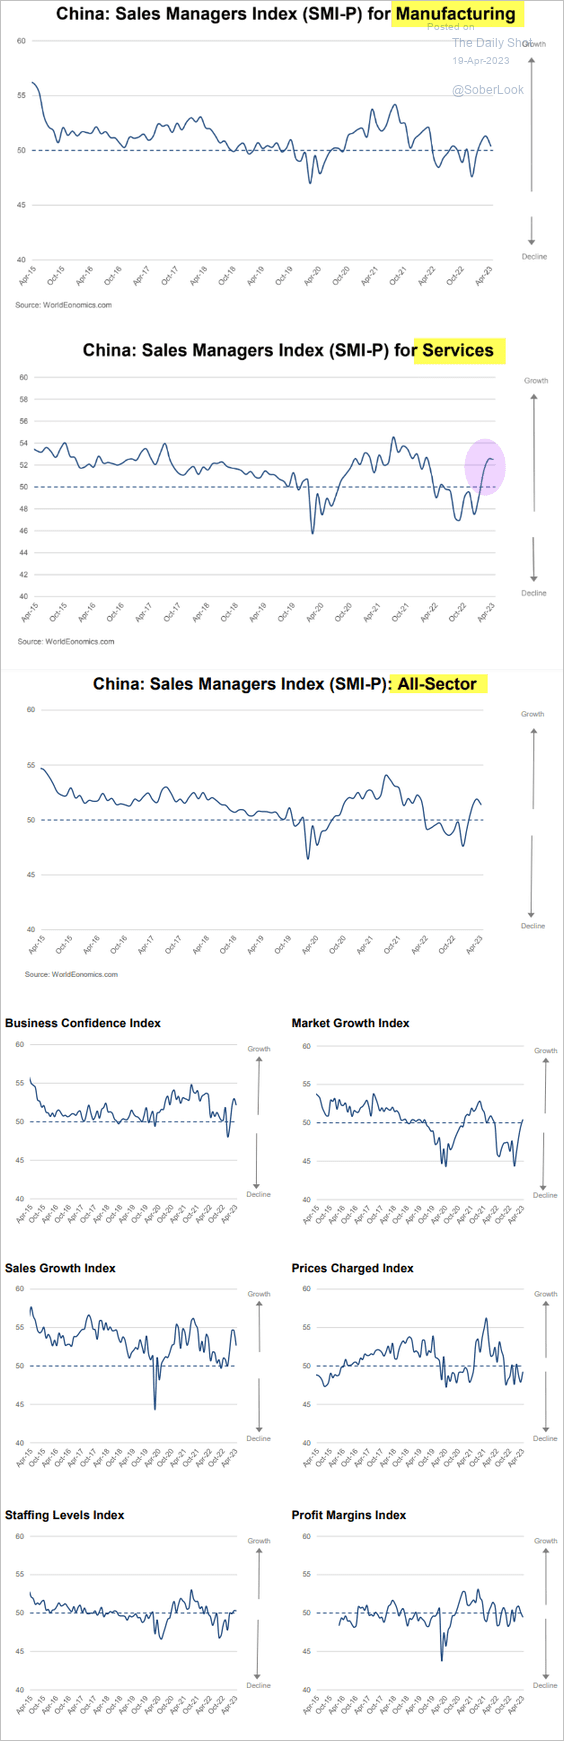 Source: World Economics
China’s consumers are back.
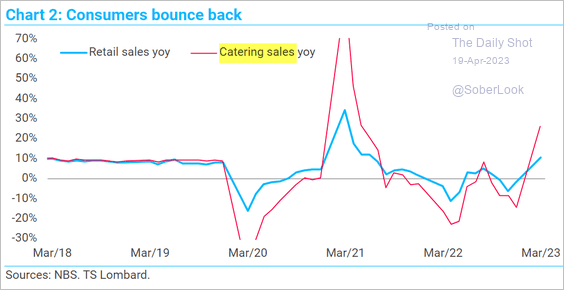 Source: TS Lombard
——————–
3. This chart shows the percentage of goods trade settled in RMB.
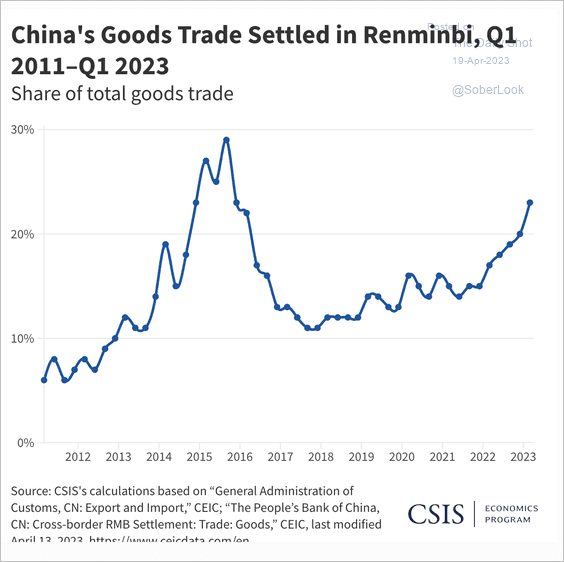 Source: CSIS Read full article
Who has currency swap agreements with the PBoC?
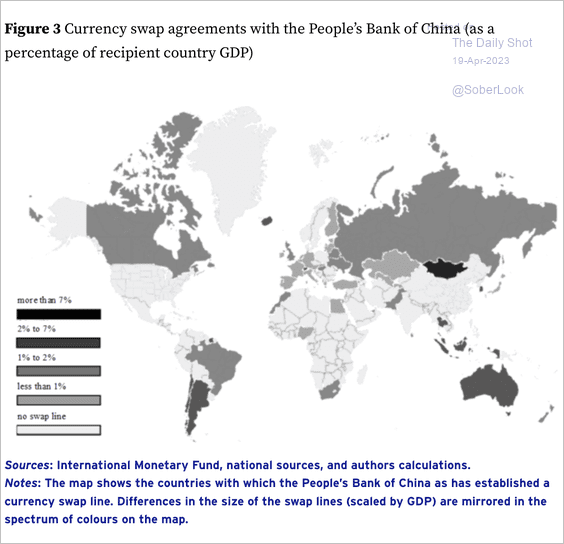 Source: VOX EU Read full article
Back to Index
Commodities
1. Given that the Fed’s tightening cycle is still in place, gold looks overpriced. But the debt ceiling impasse is a tailwind for the precious metal.
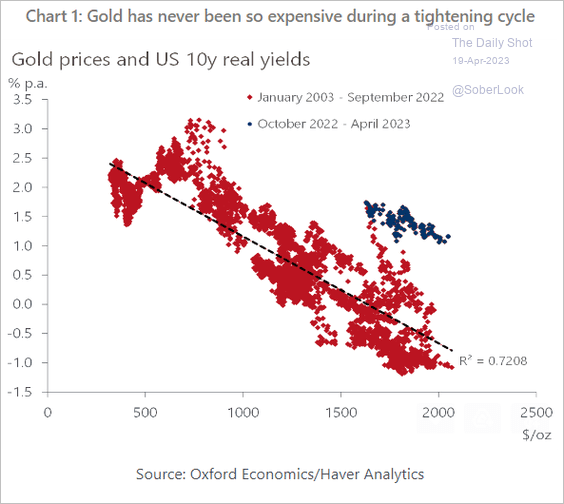 Source: Oxford Economics
This chart shows asset performance around recessions.
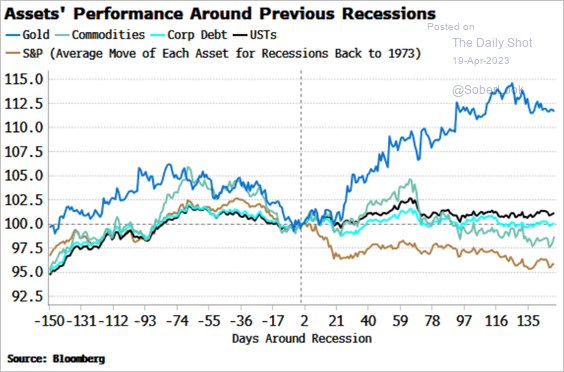 Source: Simon White, Bloomberg Markets Live Blog
——————–
2. The rebound in agricultural commodities signals higher food prices ahead.
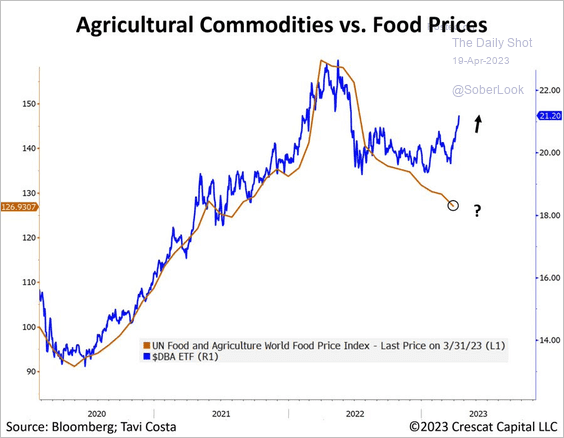 Source: @TaviCosta; h/t @dailychartbook
3. Coffee futures are surging.
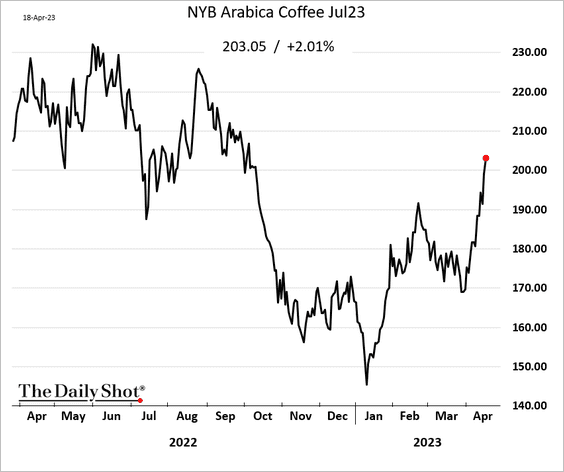
 Source: barchart.com Read full article
——————–
4. Finally, we have the distribution of global rare-earths production.
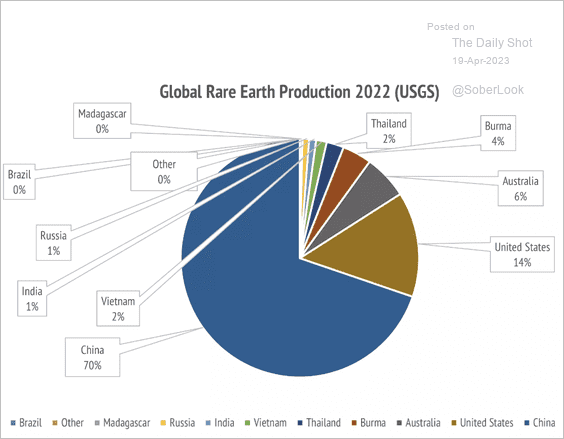 Source: Livewire Read full article
Back to Index
Energy
1. The Henry Hub natural gas futures curve is in deep contango.
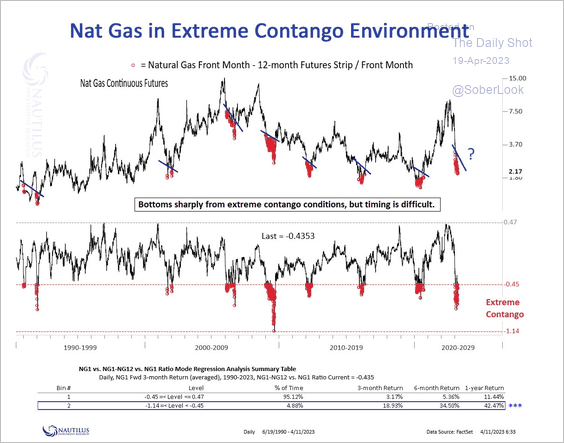 Source: @NautilusCap
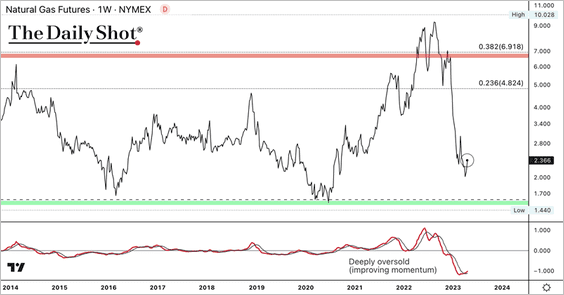
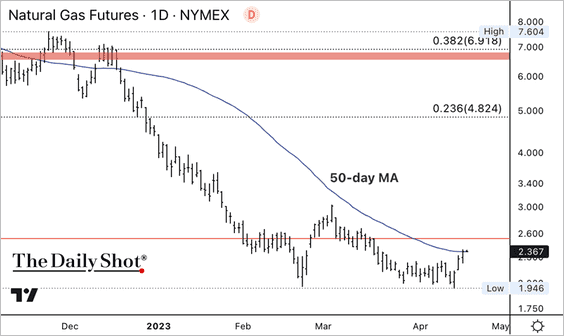
• Long-term momentum is starting to improve for natural gas but remains negative. A decisive break above the 50-day moving average could stabilize the downtrend. (2 charts)
• Henry Hub natural gas has strong seasonality toward June.
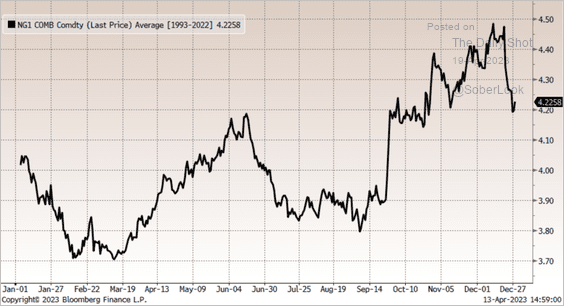 Source: Aazan Habib, Paradigm Capital
2. US LNG projects are getting more expensive.
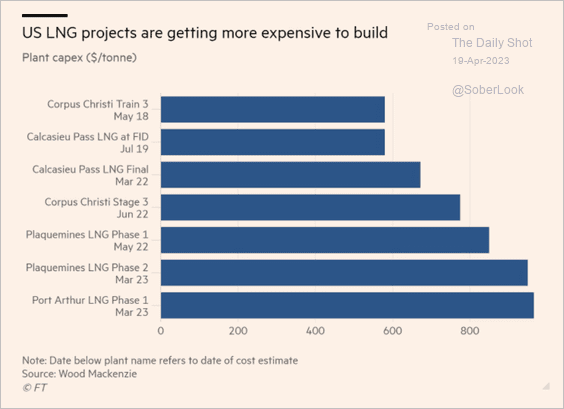 Source: @financialtimes Read full article
Back to Index
Equities
1. Despite big swings over the past two years, the S&P 500’s performance during the period is almost flat.
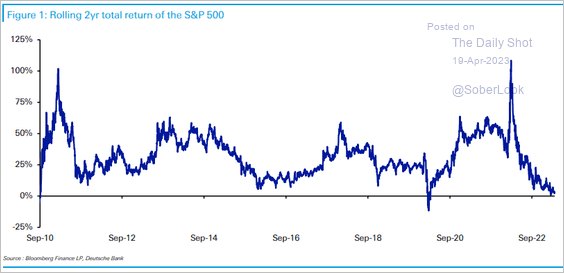 Source: Deutsche Bank Research
2. The percentage of JP Morgan’s clients who plan to increase exposure to stocks keeps falling.
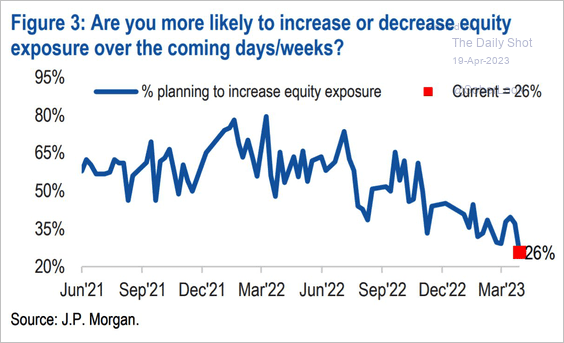 Source: JP Morgan Research
3. How much do dividends decline during recessions?
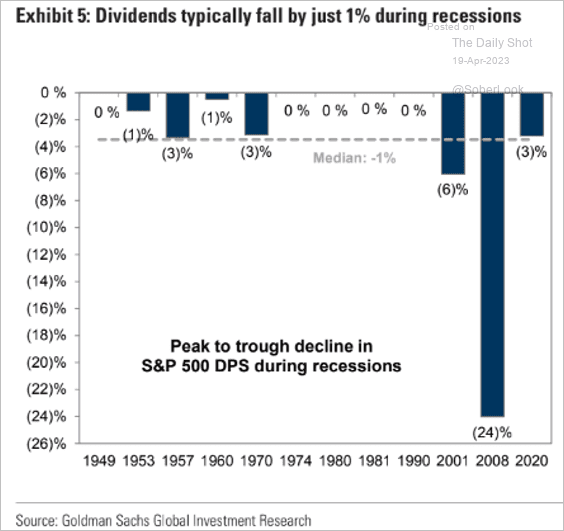 Source: Goldman Sachs; @MikeZaccardi
4. Will we see a breakout or breakdown in the S&P 500 and the dollar?
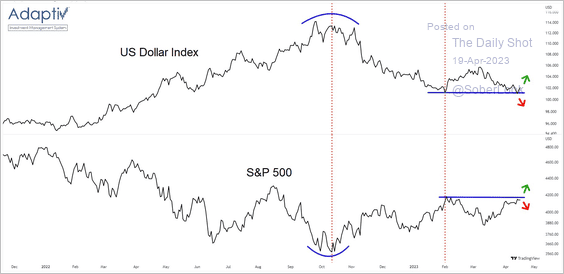 Source: @the_chart_life
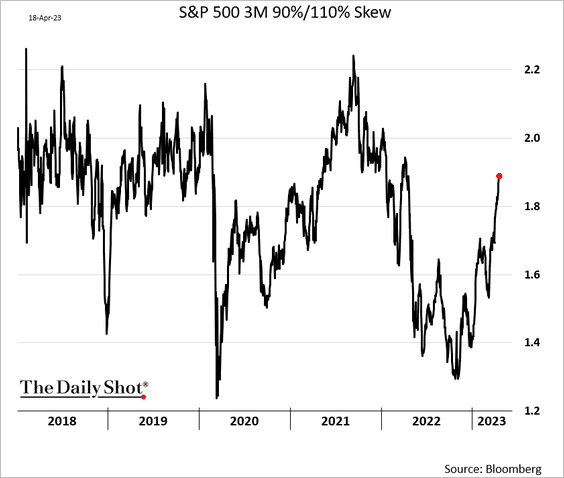
5. Demand for downside protection has been increasing as the market grinds higher.
6. Next, we have some sector updates.
• Fund flows:
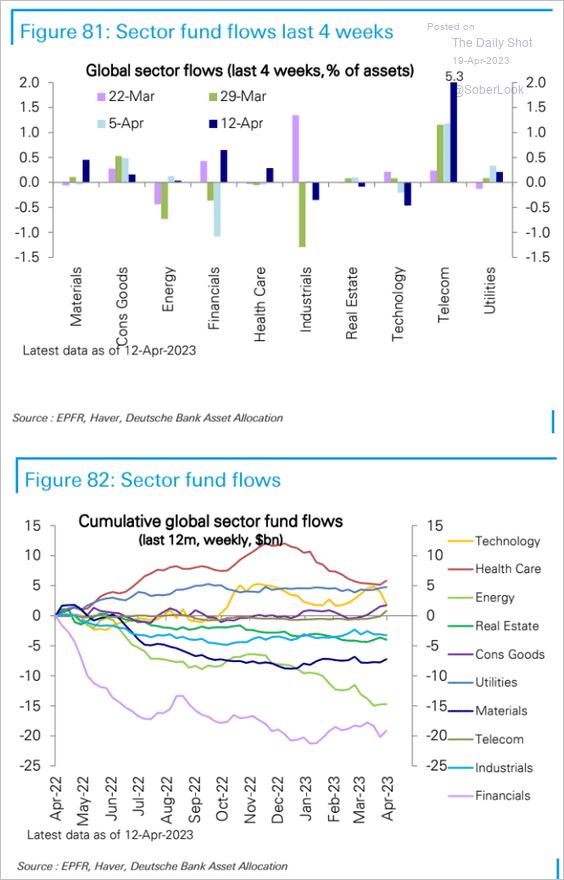 Source: Deutsche Bank Research
• Global fund manager positioning:
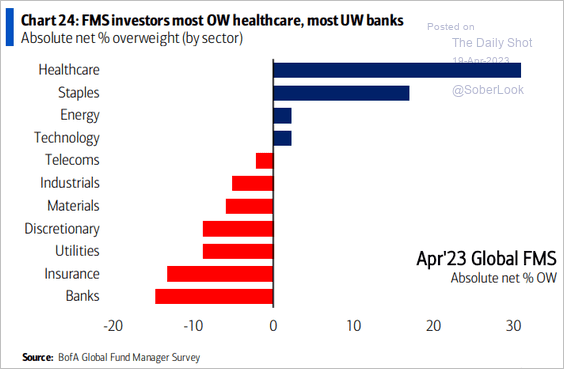 Source: BofA Global Research
• EPS drawdowns during recessions vs. current consensus expectations:
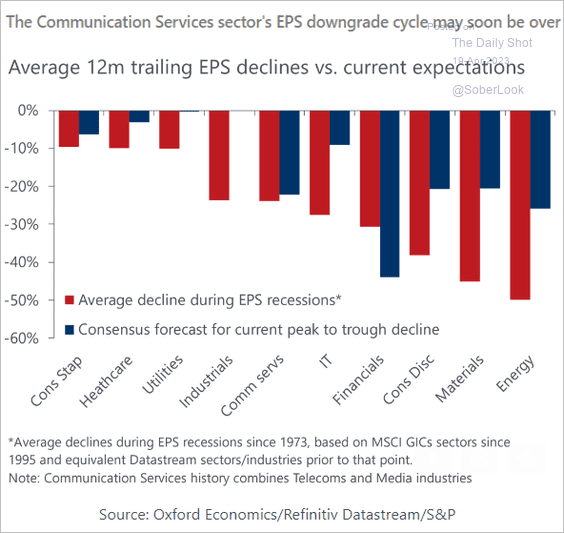 Source: Oxford Economics
• Which sectors are most vulnerable to a recession?
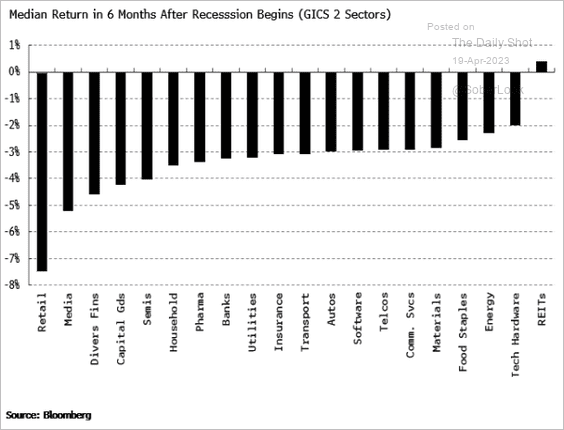 Source: Simon White, Bloomberg Markets Live Blog
• Which sectors have the most volatile earnings?
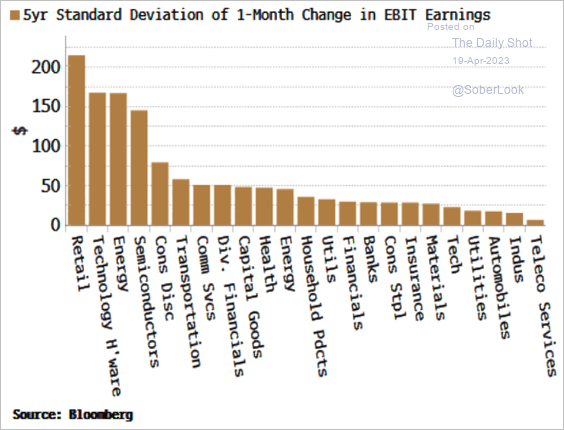 Source: Simon White, Bloomberg Markets Live Blog
• Share buyback activity by sector:
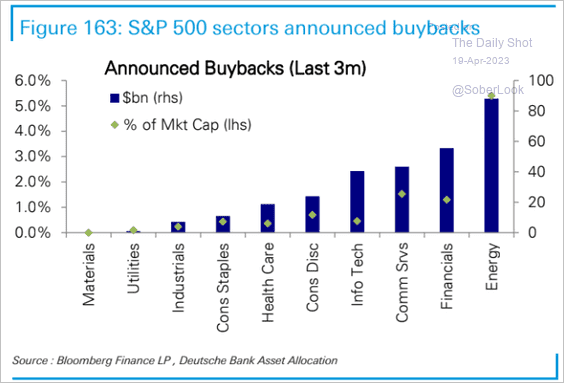 Source: Deutsche Bank Research
• Communication services stocks are still relatively inexpensive.
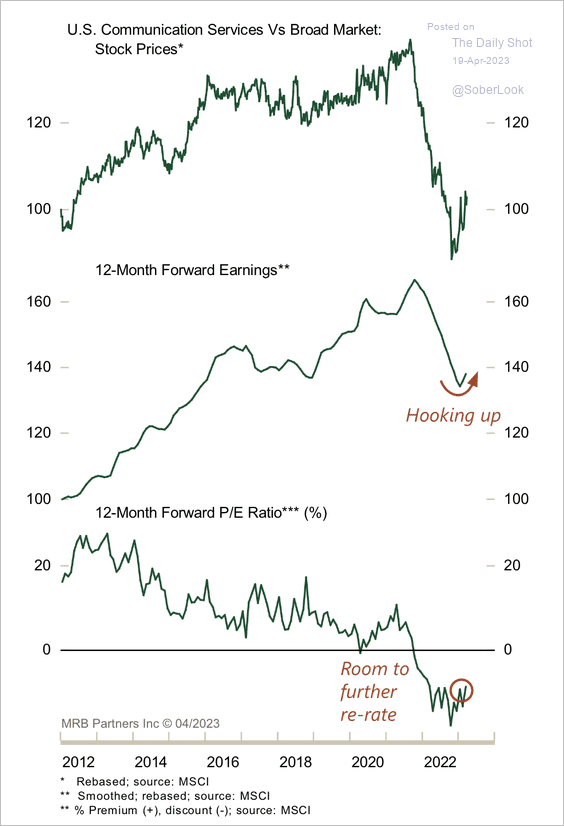 Source: MRB Partners
• Industrials could face headwinds as CapEx plunges.
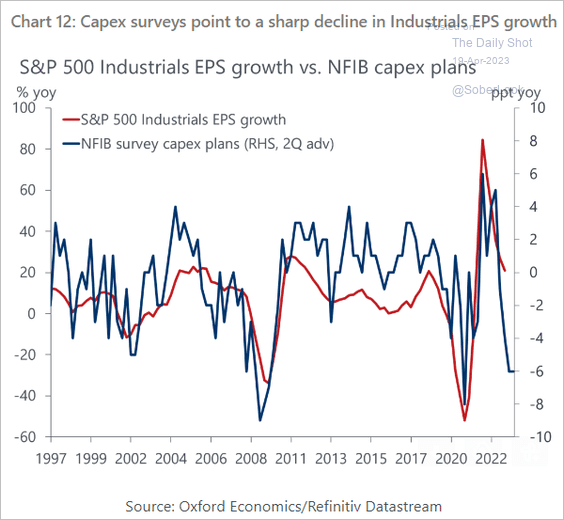 Source: Oxford Economics
Back to Index
Alternatives
1. In three years, alternatives are expected to hit 19% of the total asset management universe.
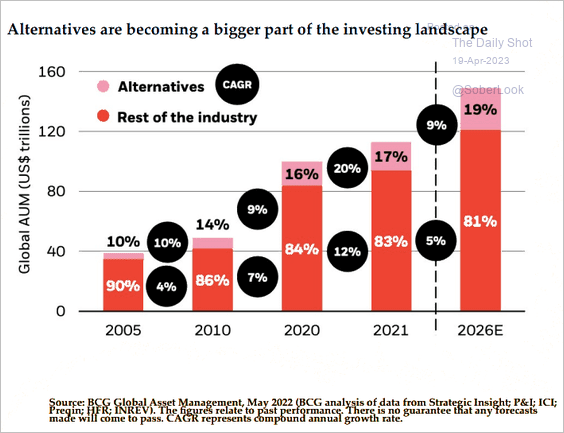 Source: LSM Management
2. Business-to-consumer M&A activity and valuations have weakened over the past year. (2 charts)
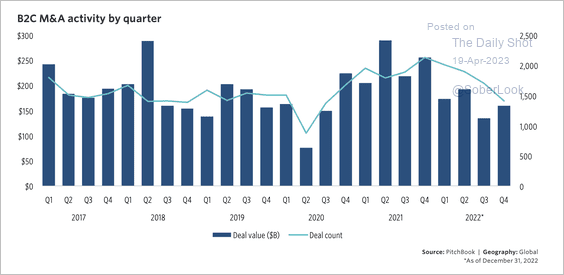 Source: PitchBook
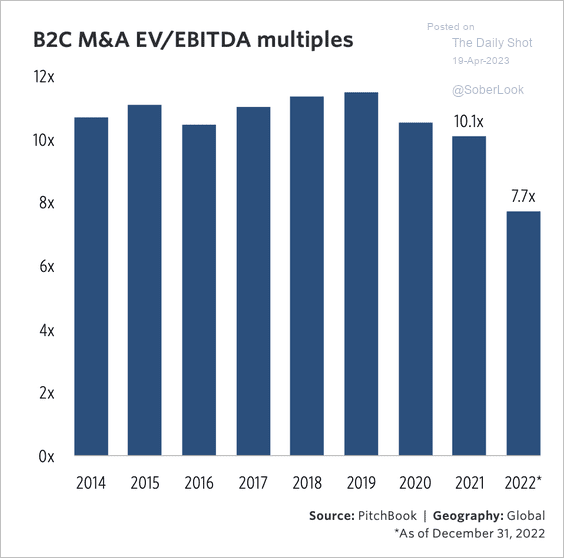 Source: PitchBook
Healthcare and IT M&A activities were also soft.
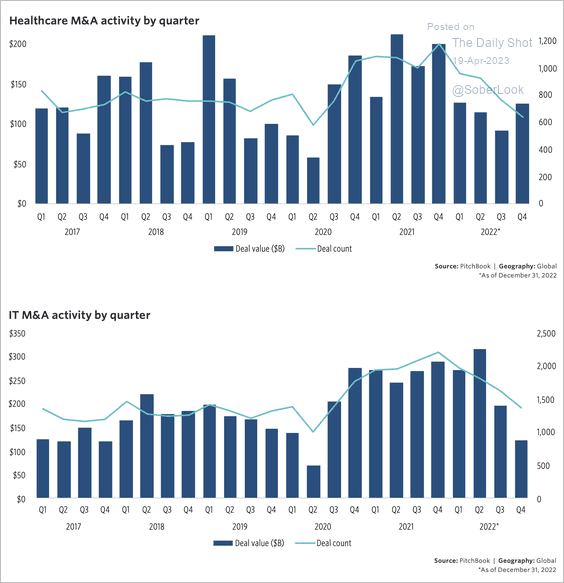 Source: PitchBook
Back to Index
Credit
1. A credit slump ahead?
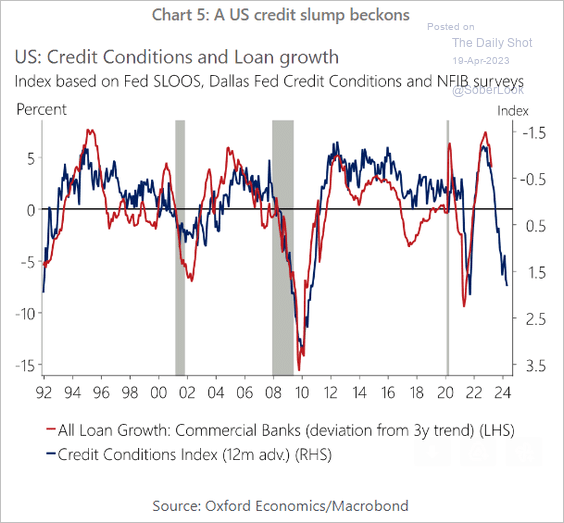 Source: Oxford Economics
2. Spreads on bank floating rate notes have risen sharply (boosting banks’ cost of funds).
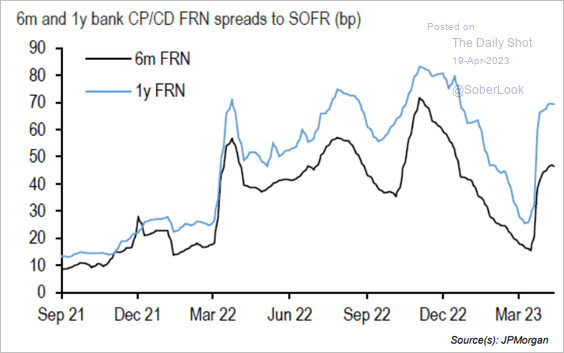 Source: JP Morgan Research; III Capital Management
This chart shows CD rates by region.
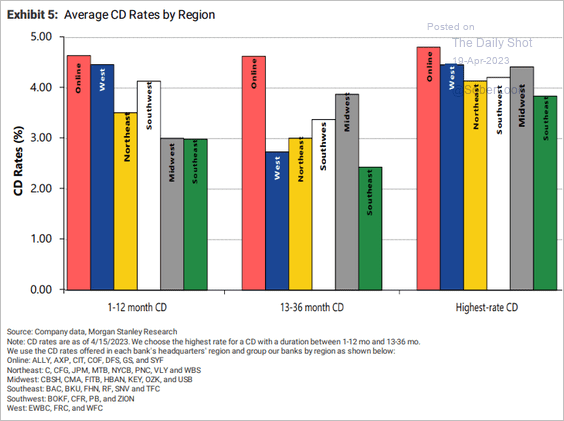 Source: Morgan Stanley Research
——————–
3. Bank capital levels are much higher than in 2008. But that didn’t prevent Credit Suisse from failing.
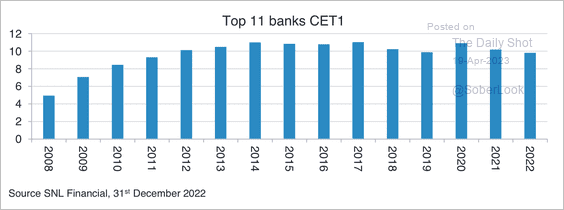 Source: Fidelity International
4. Reserve balances could become dangerously low next year as the Fed’s QT continues. This could create funding problems in US dollar money markets (such as the repo problem in 2019).
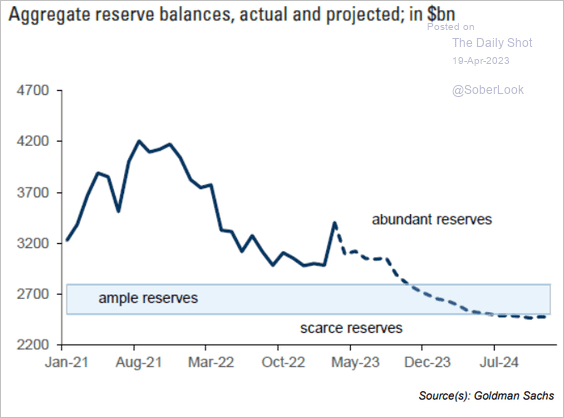 Source: Goldman Sachs; III Capital Management
5. What’s the biggest tail risk according to global fund managers?
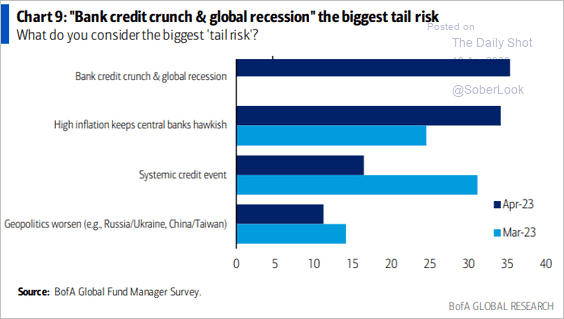 Source: BofA Global Research
Back to Index
Global Developments
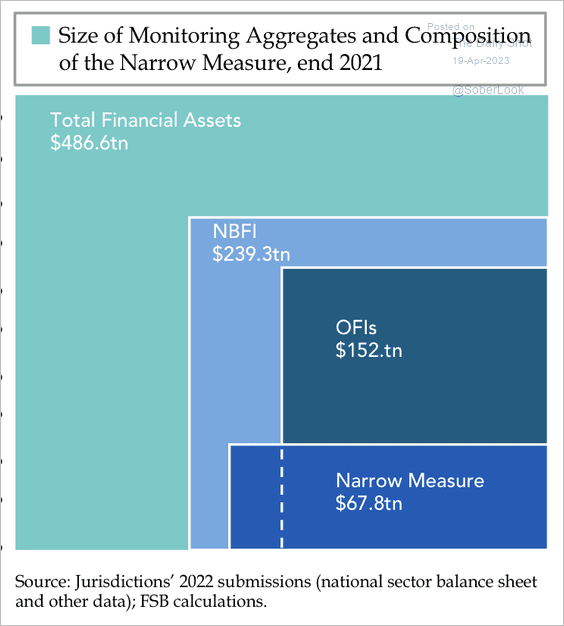
1. Nonbank financial intermediaries (NBFI) are nearly half of the global financial system. (2 charts)
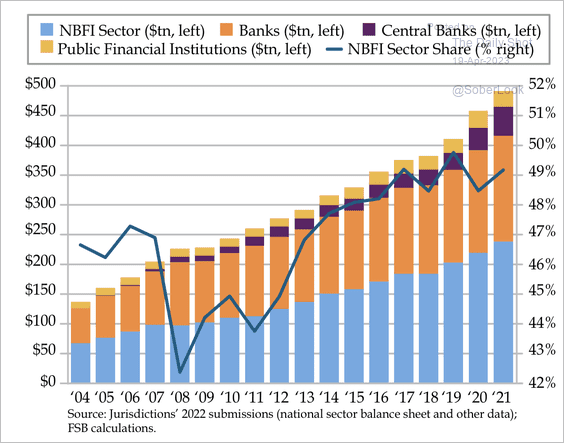 Source: Quill Intelligence
 Source: Quill Intelligence
——————–
2. Here is a look at the total value of real estate relative to other asset classes.
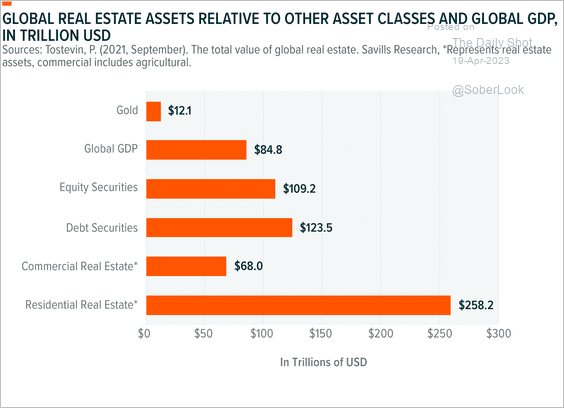 Source: Global X ETFs Read full article
3. Shippers continue to have a depressed outlook on demand, …
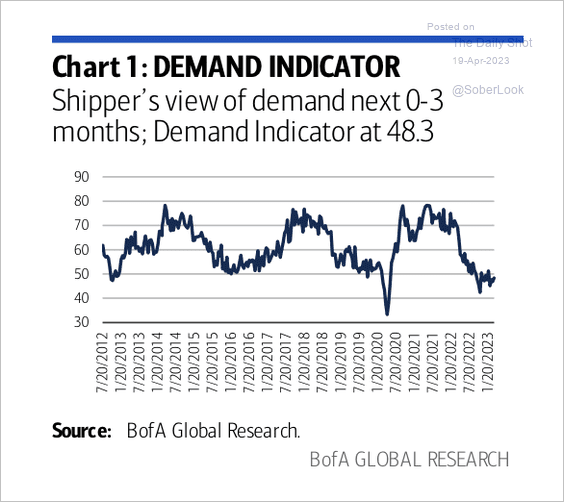 Source: BofA Global Research
… although their outlook on shipping rates may have bottomed.
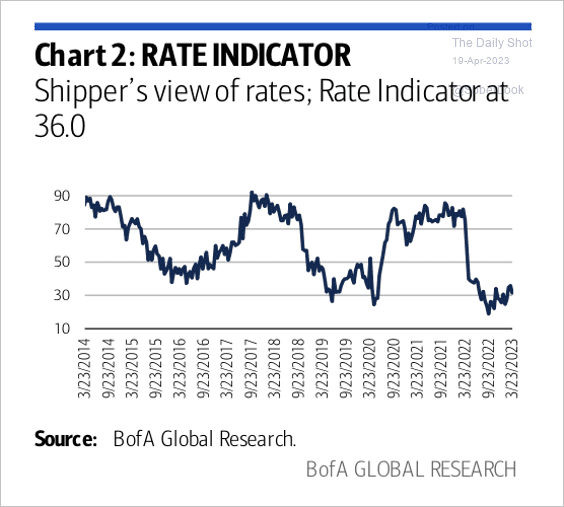 Source: BofA Global Research
——————–
Food for Thought
1. Who stopped working in 2020?
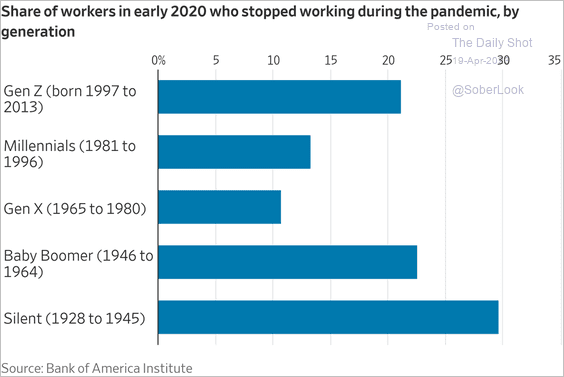 Source: @WSJ Read full article
2. Working past 65:
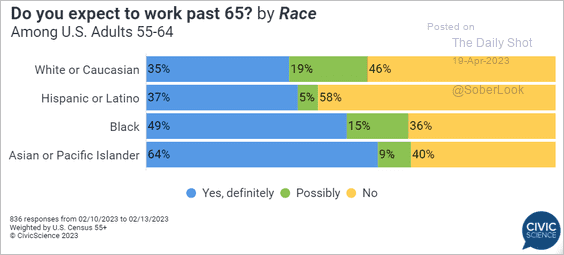 Source: @CivicScience Read full article
3. Spreadsheets and accounting/analyst jobs:
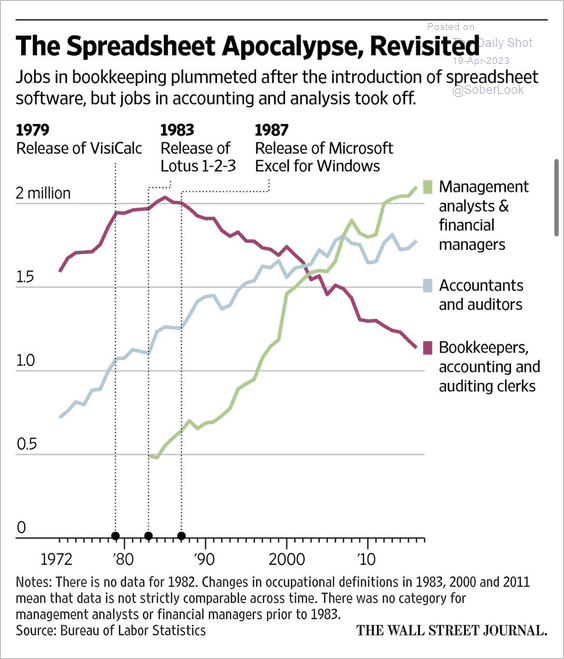 Source: @WSJ Read full article
4. Podcast categories with the longest surviving episodes:
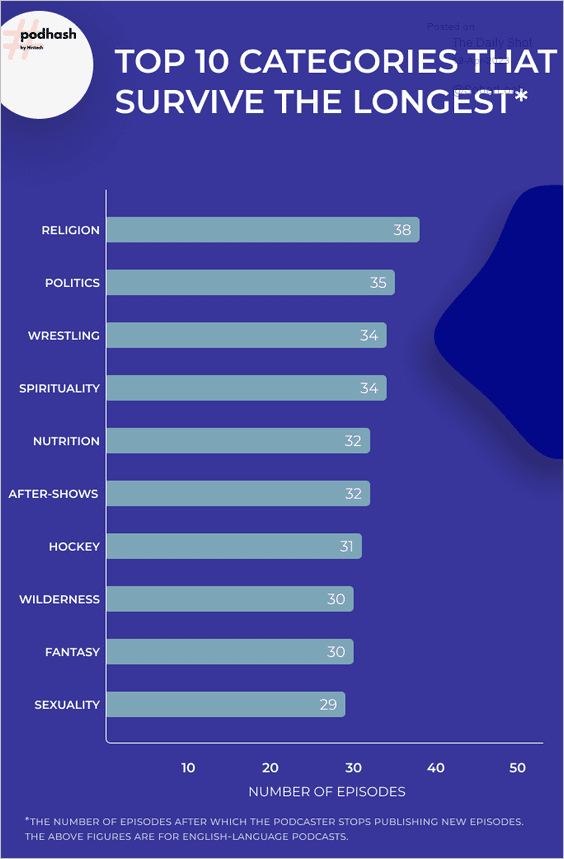 Source: podhash.com
• Categories with the longest podcast episodes:
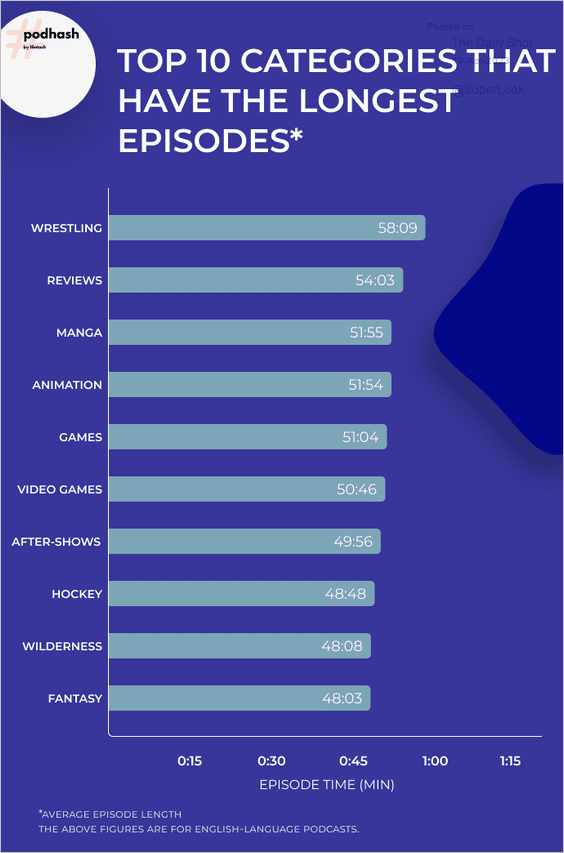 Source: podhash.com
• Podcast categories with episodes that fade quickly:
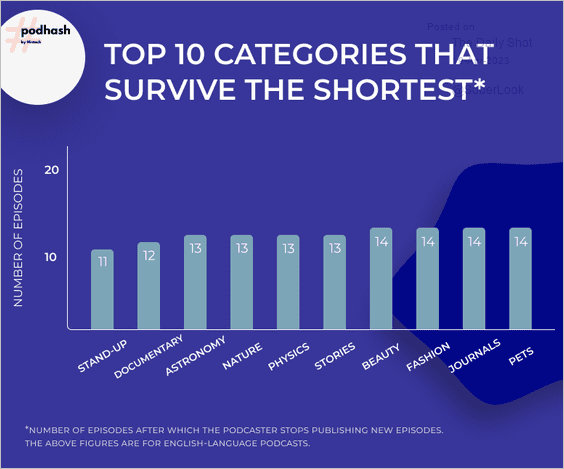 Source: podhash.com
——————–
5. US movie theater visits:
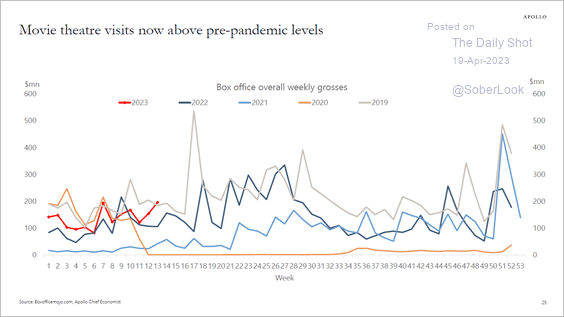 Source: Torsten Slok, Apollo
6. A “good place” for racial and ethnic minorities in select Middle East countries/regions:
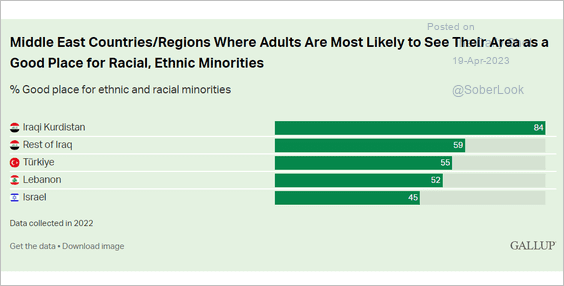 Source: Gallup Read full article
7. An estimate of Russian forces killed:
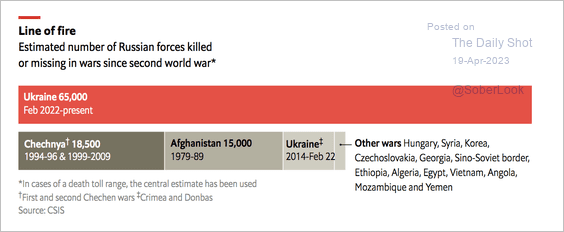 Source: The Economist Read full article
8. Wait times for disability application decisions:
 Source: USAFacts
9. The latest GOP nomination poll:
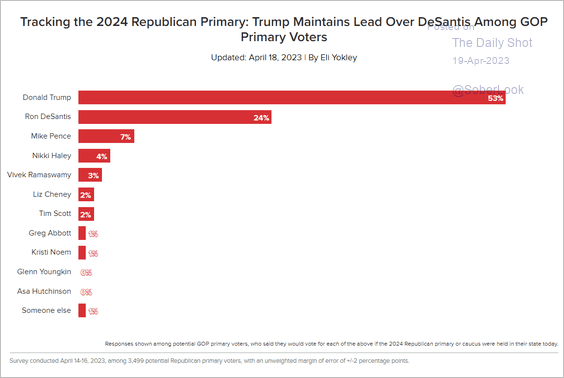 Source: Morning Consult Read full article
• GOP nomination probabilities in the betting markets:
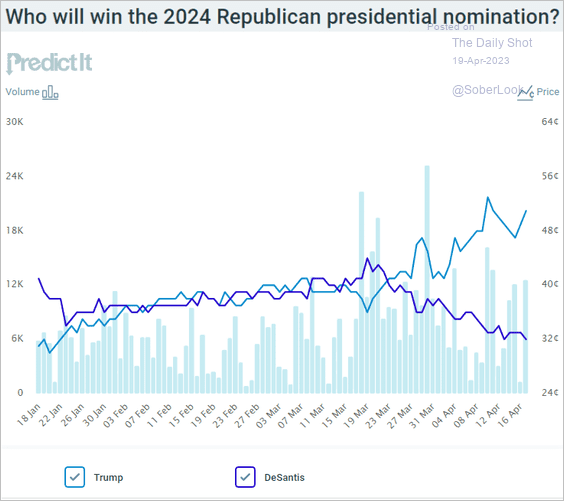 Source: @PredictIt
——————–
10. UFO sightings:
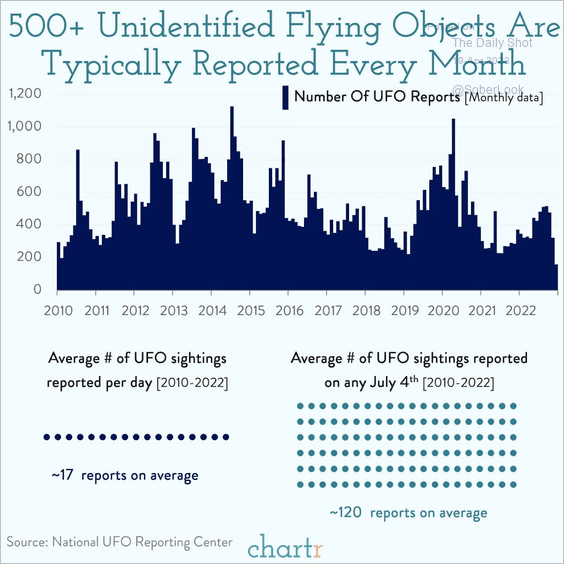 Source: @chartrdaily
——————–
Back to Index