The Daily Shot: 26-Apr-23
• The United States
• The United Kingdom
• The Eurozone
• Asia – Pacific
• China
• Emerging Markets
• Commodities
• Energy
• Equities
• Credit
• Rates
• Global Developments
• Food for Thought
The United States
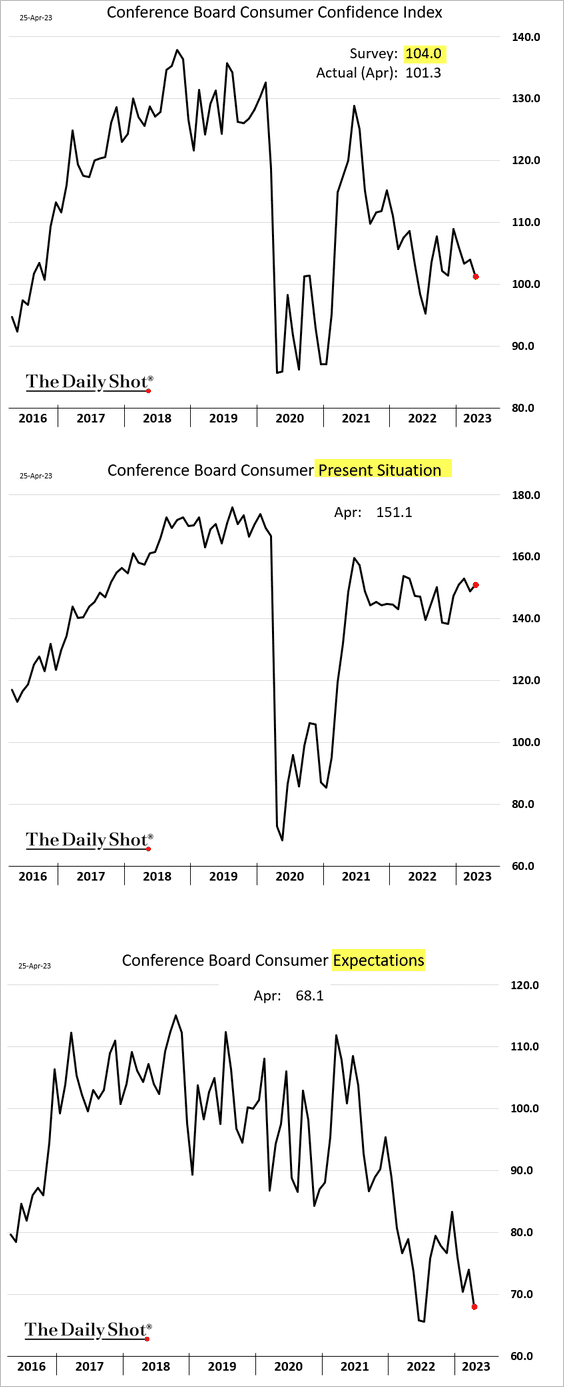
1. The Conference Board’s consumer confidence index declined further this month, driven by weakening expectations (3rd panel). The index of current conditions edged higher (2nd panel).
 Source: MarketWatch Read full article
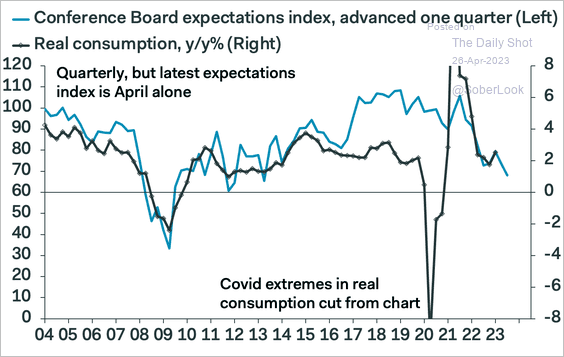
• The expectations index signals slower consumption ahead.
 Source: Pantheon Macroeconomics
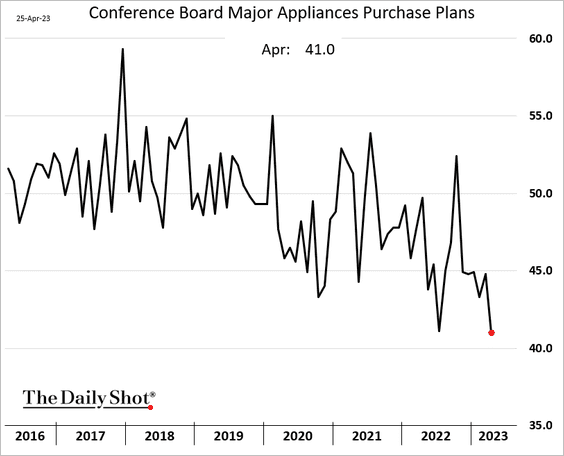
• The buying climate has deteriorated.
• The labor differential, the spread between “jobs plentiful” and “jobs hard to get” indices, edged higher. The index remains elevated, pointing to a robust labor market.
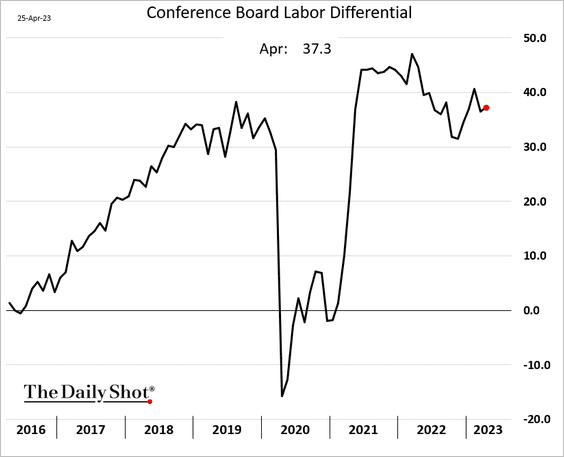
The current employment situation is keeping the Conference Board’s index from crashing.
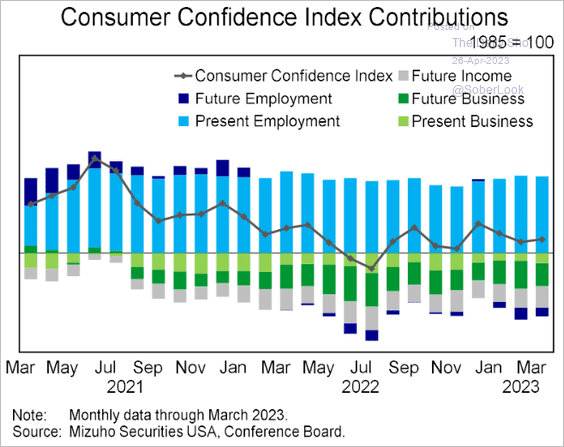 Source: Mizuho Securities USA
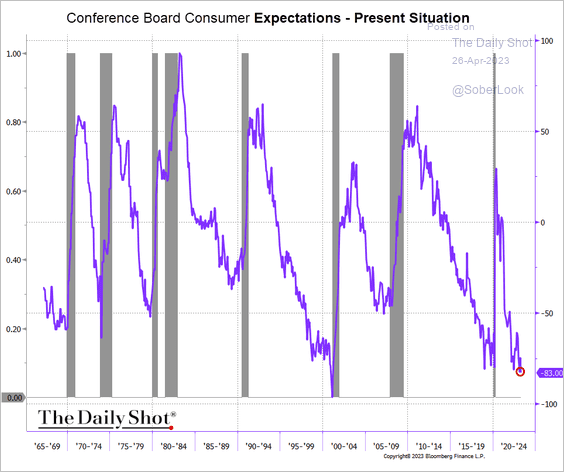
• The spread between the Conference Board’s expectations and present situation indices has hit its lowest level in over two decades, which is typically a precursor to a recession.
 Source: AEI Housing Center
——————–
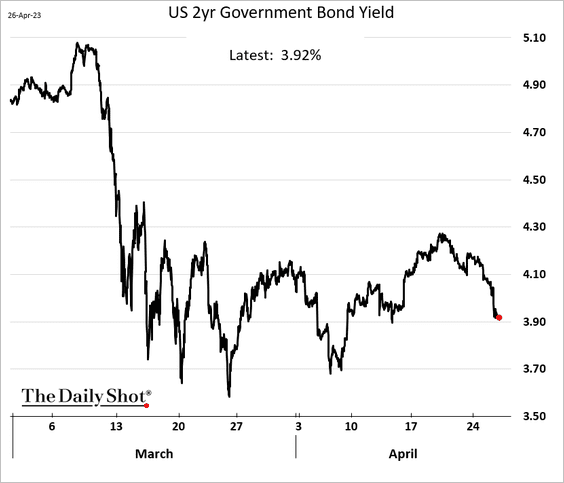
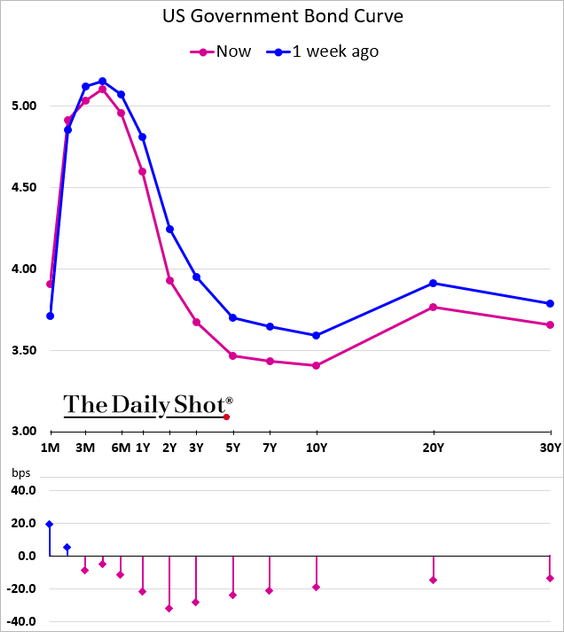
2. The 2yr Treasury yield is back below 4% as banking concerns resurface.
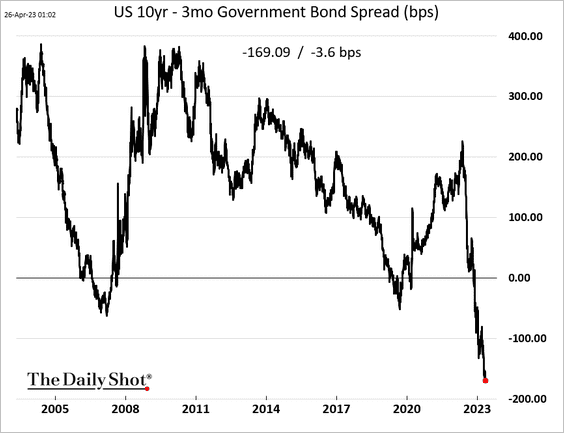
• The 10-year/3-month Treasury spread is nearing -170 bps for the first time in decades.
Here is the yield curve.
——————–
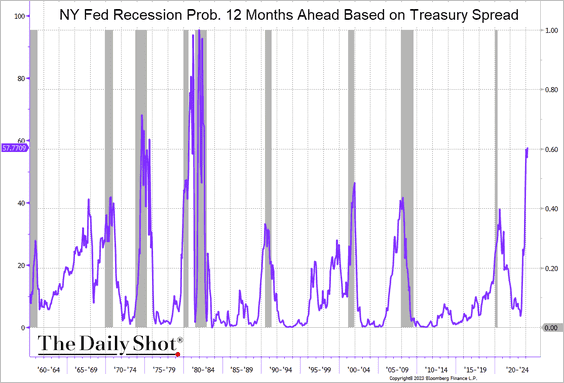
3. Similar to the Conference Board’s spread, the NY Fed’s yield curve indicator signals a recession in the months ahead.
 Source: @TheTerminal, Bloomberg Finance L.P.
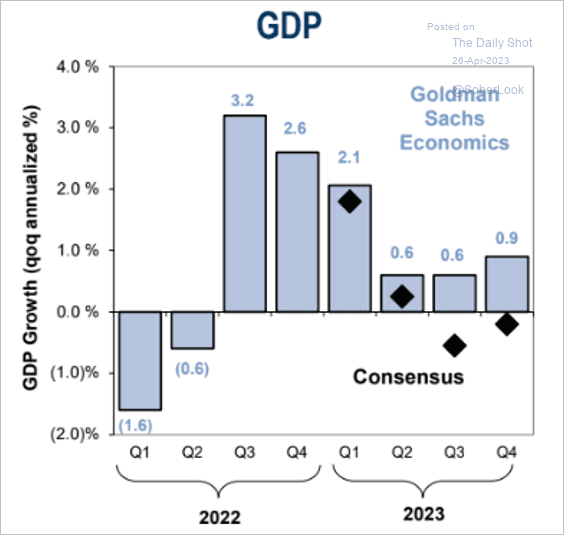
• Goldman still does not expect a recession this year – just slow growth.
 Source: Goldman Sachs; @MikeZaccardi
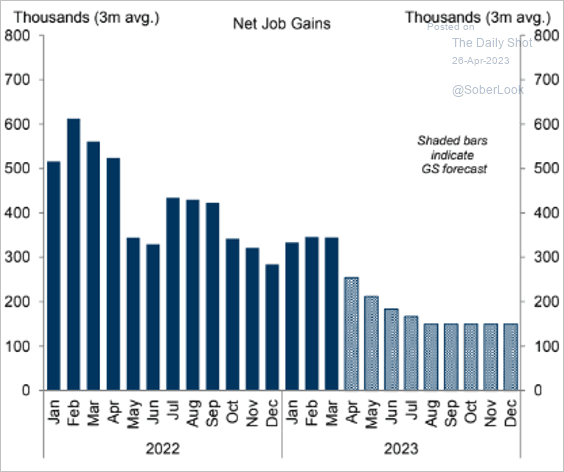
The firm sees robust job growth, albeit slower, for the rest of 2023.
 Source: Goldman Sachs; @MikeZaccardi
——————–
4. Next, we have some updates on the housing market.
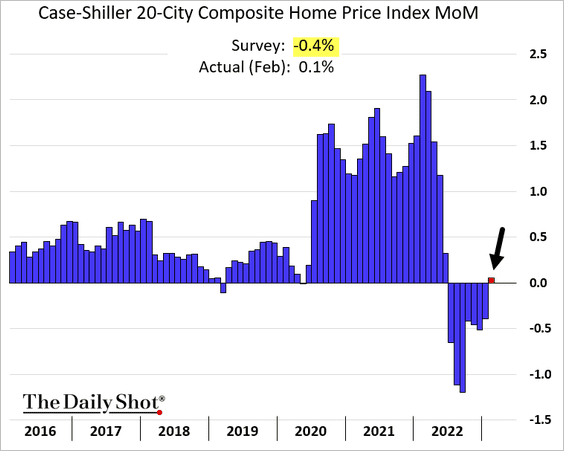
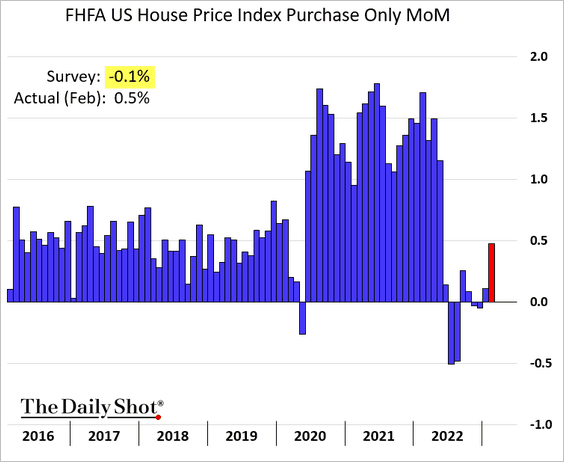
• Home prices unexpectedly increased in February (2 charts).
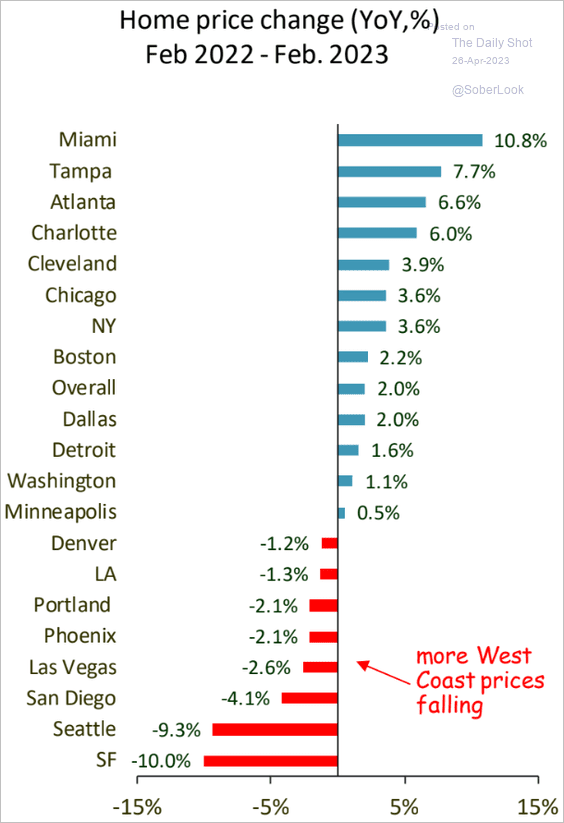
Below is the metro-area breakdown.
 Source: Piper Sandler
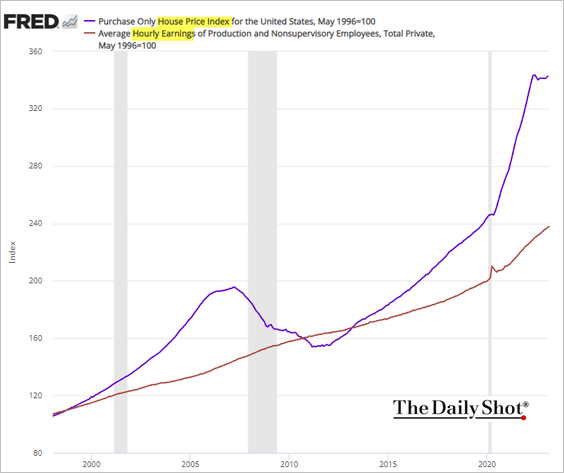
• Affordability will remain a headwind for the housing market. Here are the relative changes in home prices and wages.
• New home sales were less than three percent below last year’s levels in March, topping expectations.
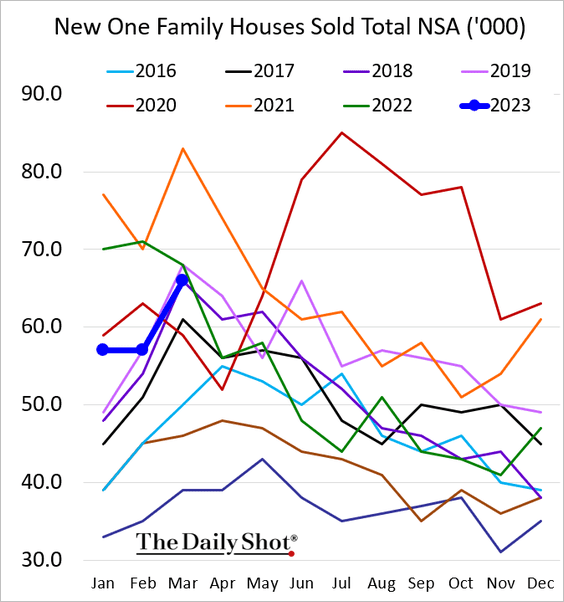
However, weaker mortgage applications signal trouble ahead.
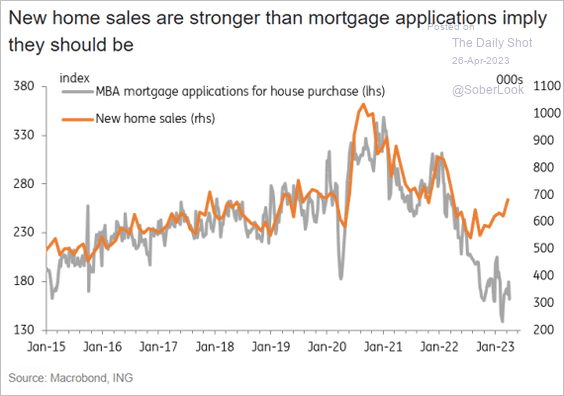 Source: ING
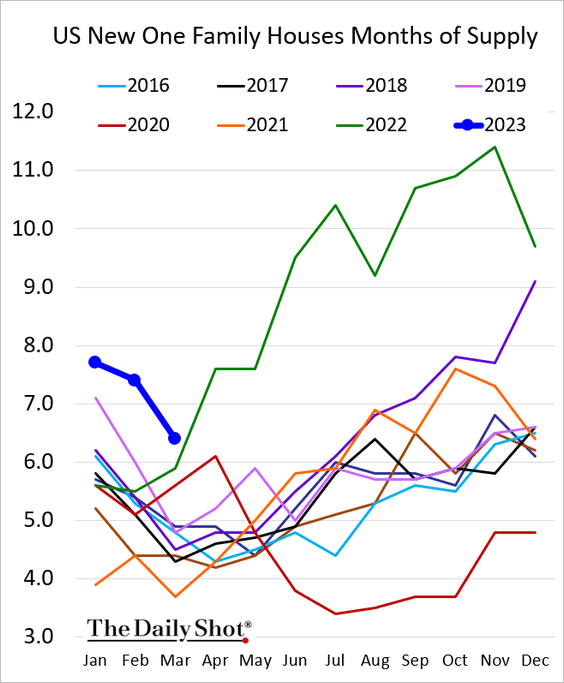
• New home inventories are still high but are nearing last year’s levels.
This chart shows the percentage of new homes in the total housing inventory.
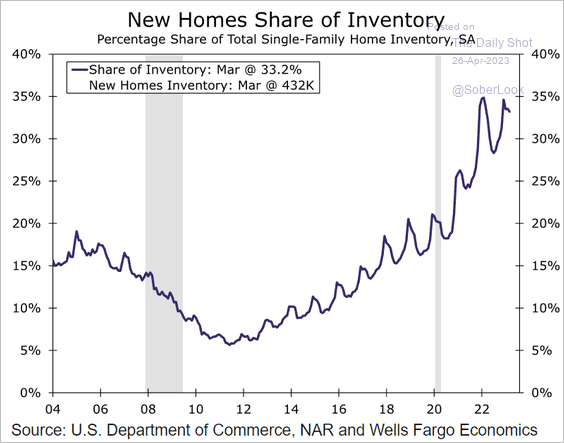 Source: Wells Fargo Securities
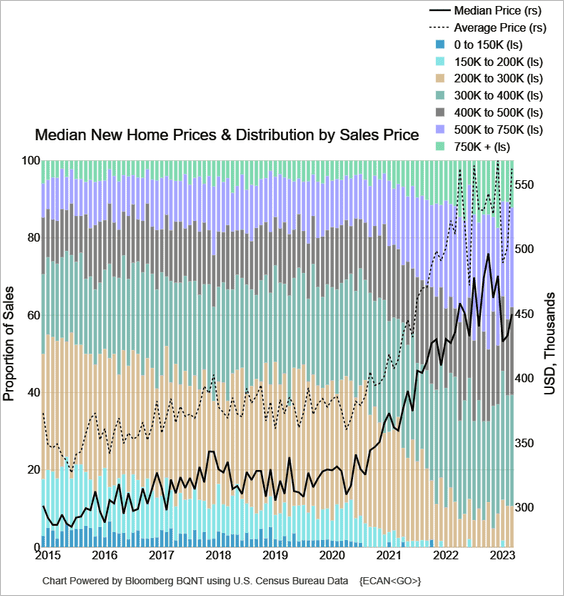
• The median price increased. This chart shows the distribution of price tiers over time.
 Source: @TheTerminal, Bloomberg Finance L.P.
——————–
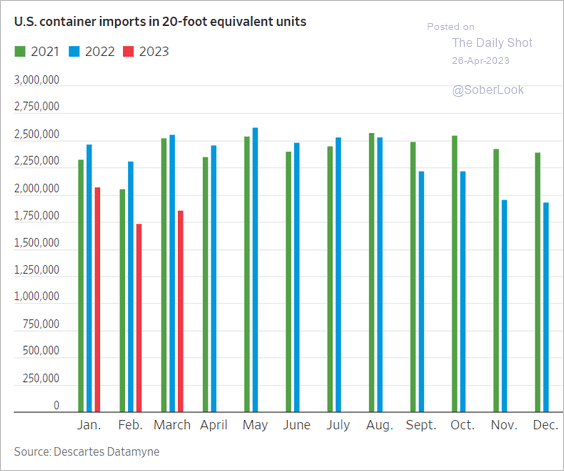
5. US container imports have slowed substantially.
 Source: @WSJ Read full article
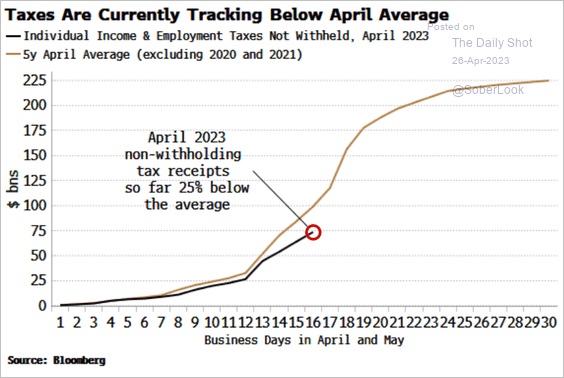
6. Federal tax receipts are currently running below average trend.
 Source: Simon White, Bloomberg Markets Live Blog
Back to Index
The United Kingdom
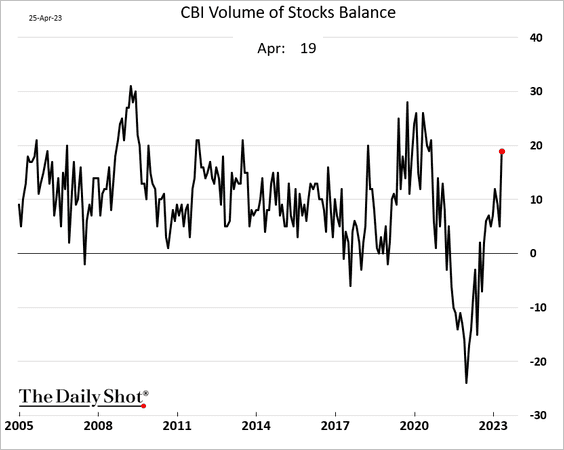
1. Industrial orders remain soft, according to CBI.
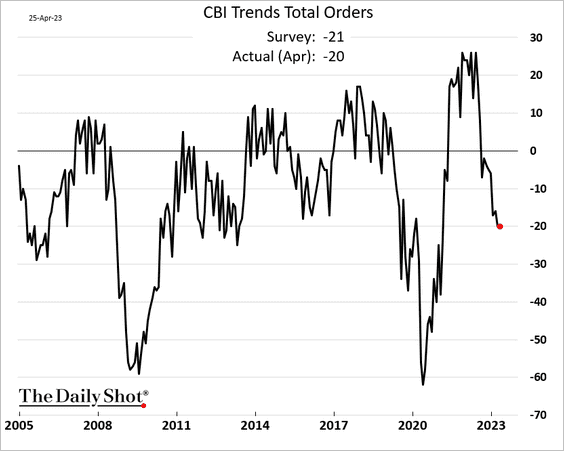
• Inventories are rising at a faster pace.
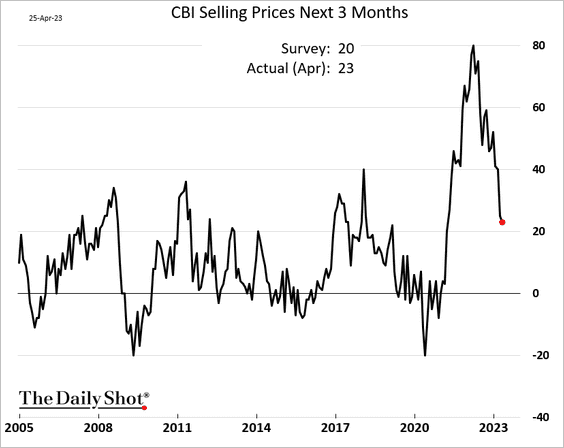
• Price pressures are easing, which should be reflected in the PPI.
——————–
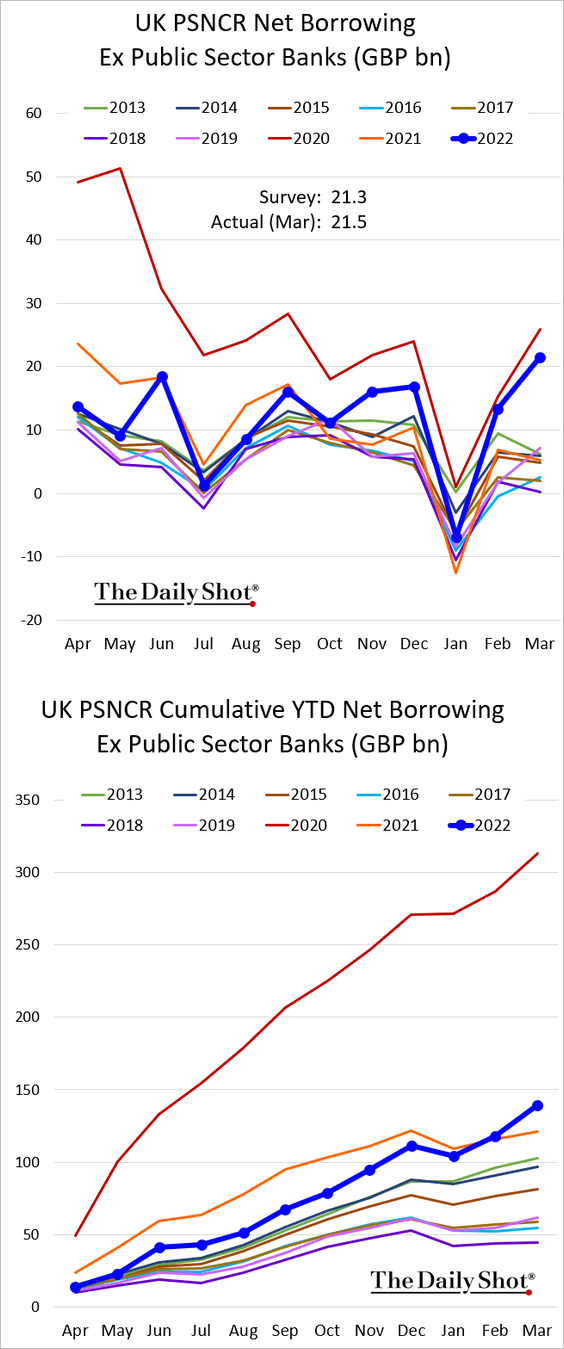
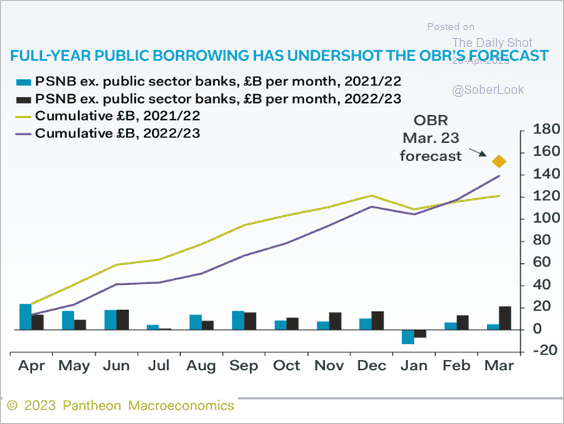
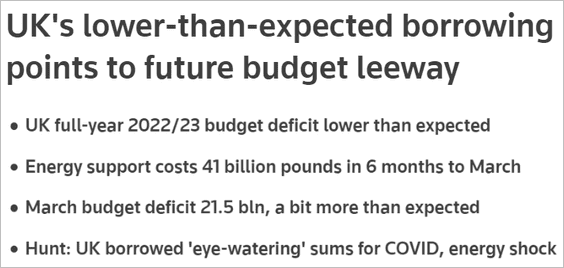
2. Although massive, UK government borrowing has remained below the government’s forecasts.
 Source: Pantheon Macroeconomics
 Source: Reuters Read full article
——————–
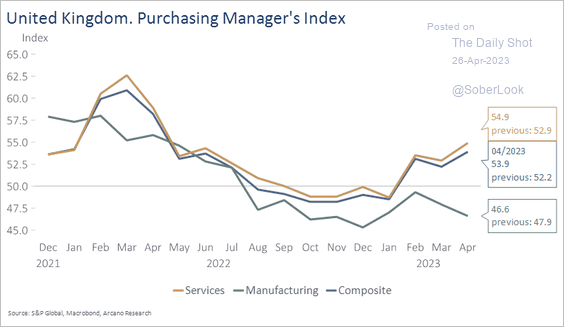
3. This chart illustrates the divergence between services and manufacturing activity.
 Source: Arcano Economics
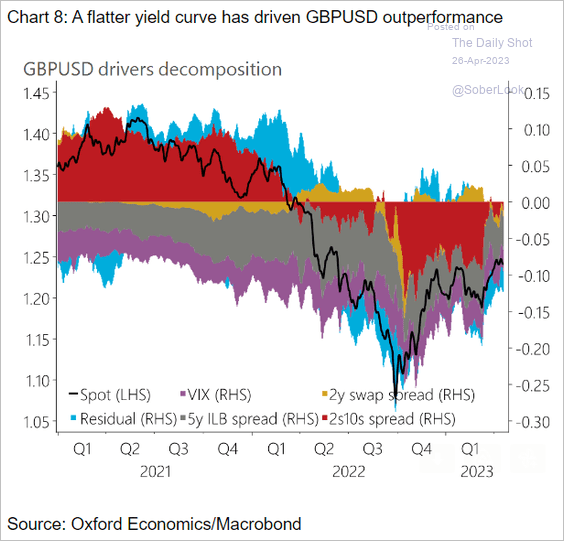
4. What are the drivers of the recent GBP rebound?
 Source: Oxford Economics
Back to Index
The Eurozone
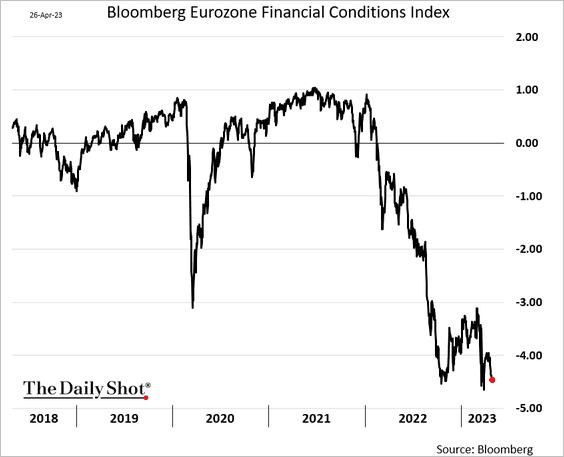
1. Financial conditions remain tight, according to Bloomberg.
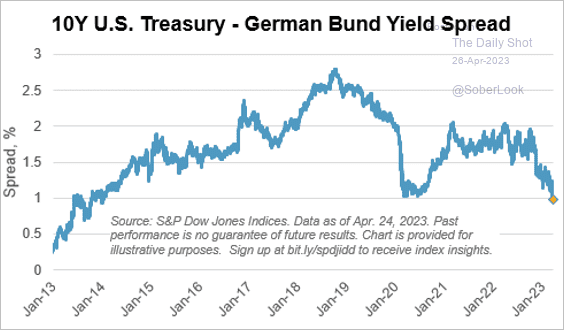
2. Germany’s 10-year yield differential with the US has tightened sharply.
 Source: S&P Dow Jones Indices
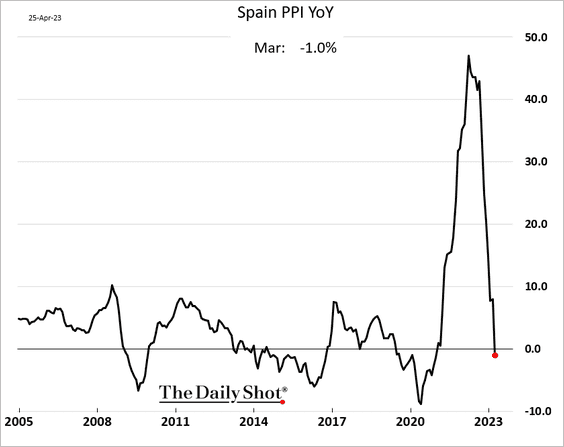
3. Spain’s PPI dipped into negative territory.
Back to Index
Asia – Pacific
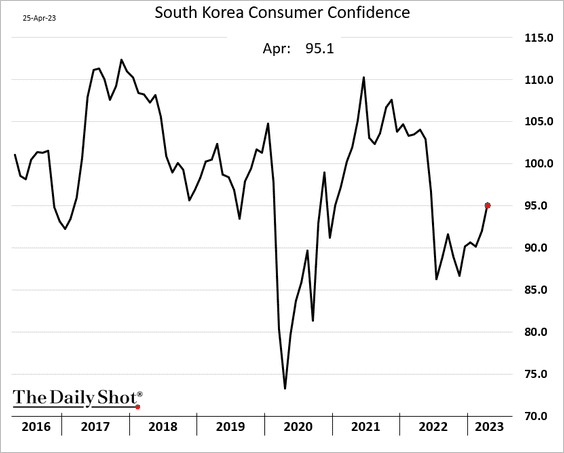
1. South Korea’s consumer confidence continues to rebound.
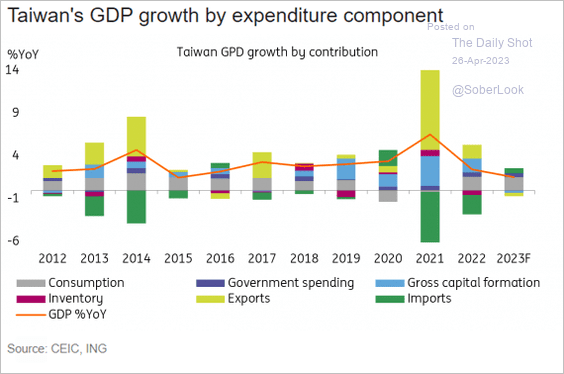
2. Taiwan’s 2023 economic growth is expected to be the slowest in years.
 Source: ING
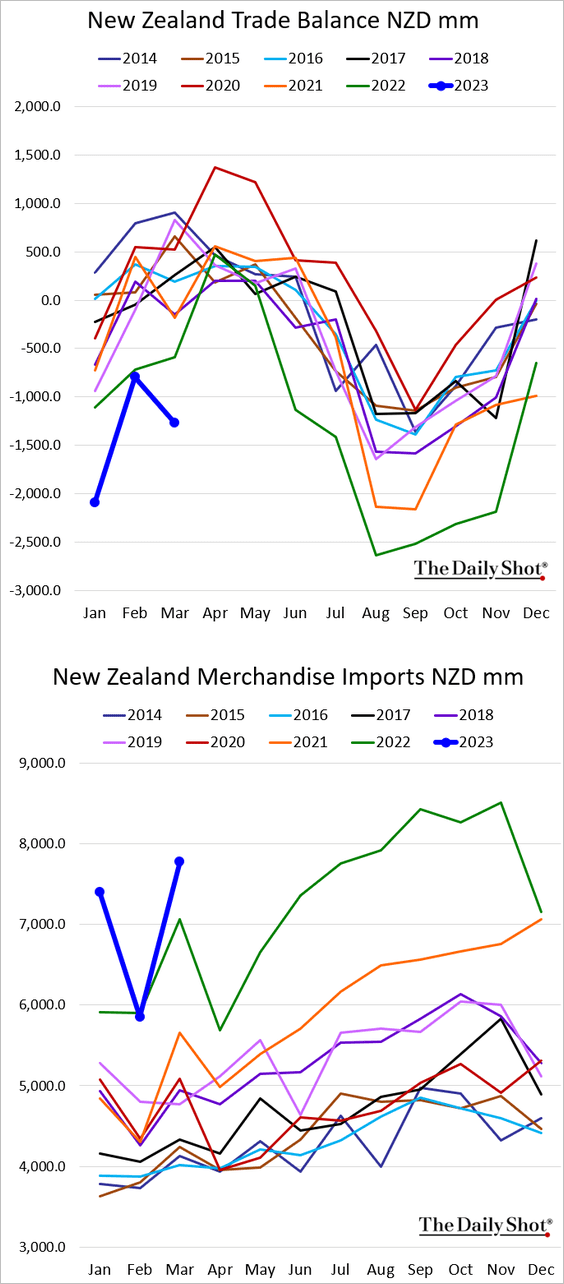
3. New Zealand’s trade deficit widened again as imports surged.
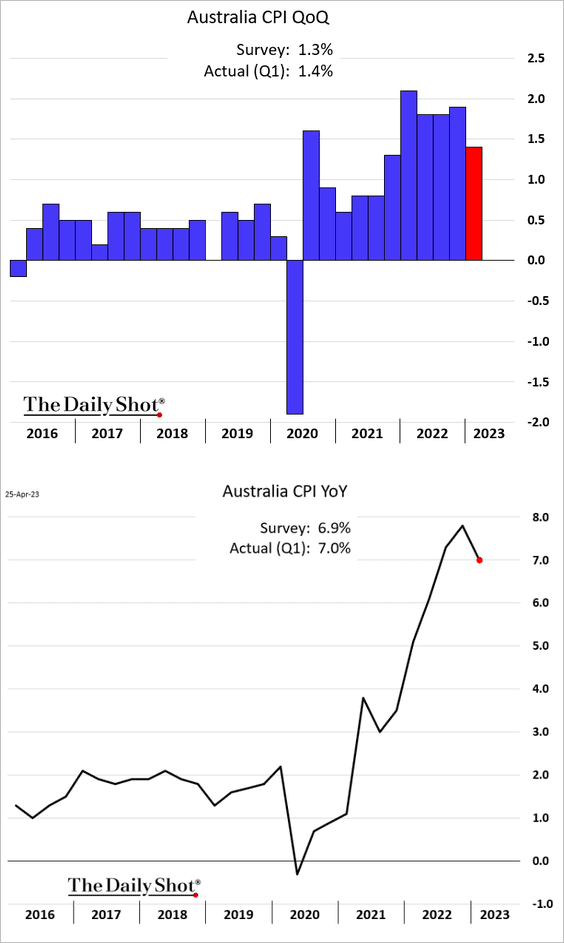
4. Australia’s inflation slowed in Q1.
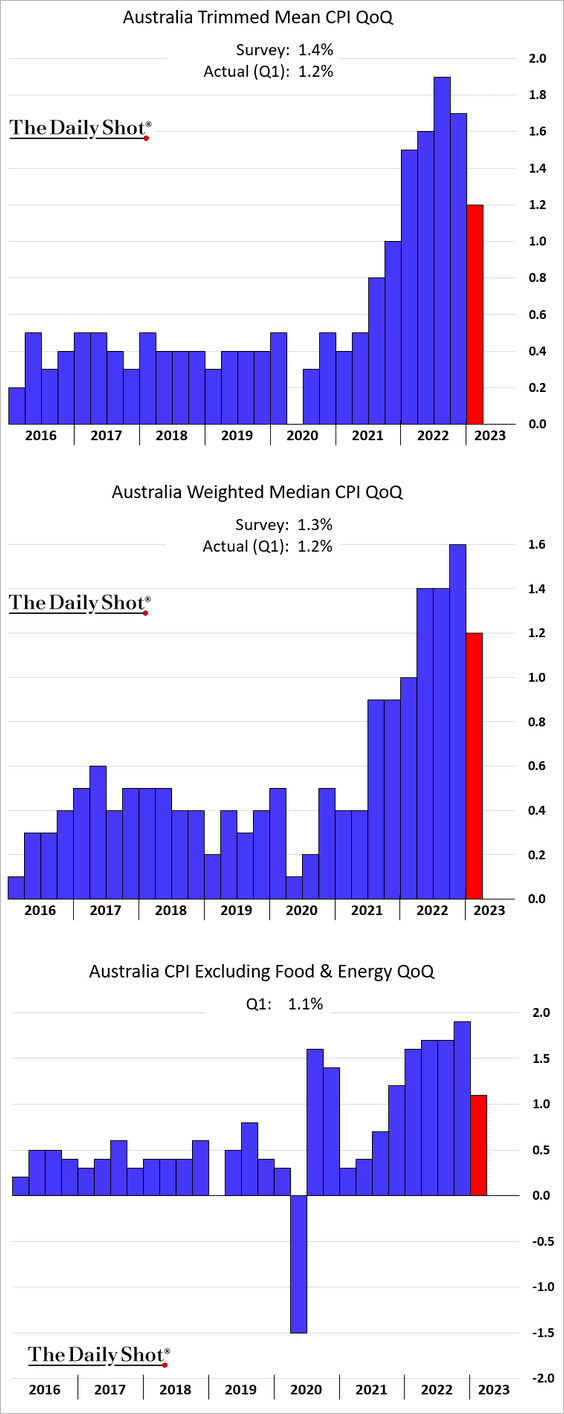
Here are the measures of core inflation.
Back to Index
China
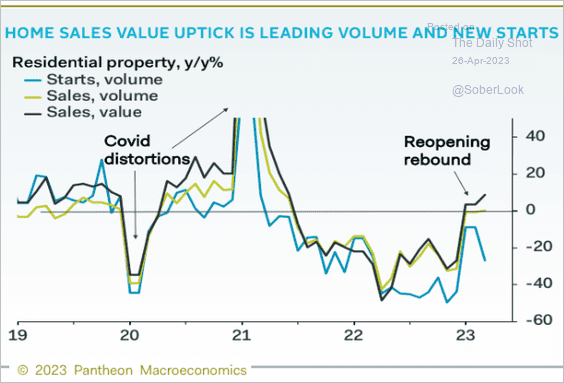
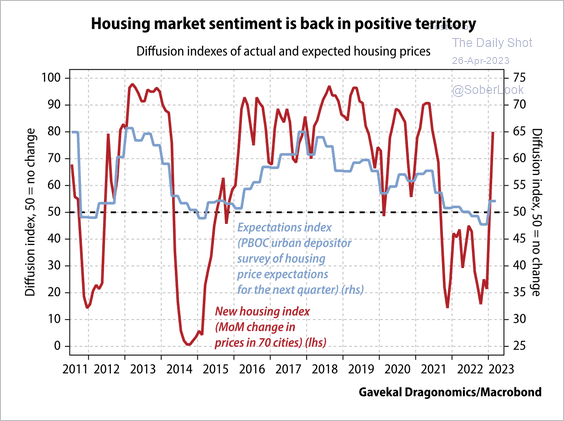
1. Home sales are rebounding.
 Source: Pantheon Macroeconomics
House price expectations remain below pre-pandemic levels, although the recent bounce is similar to the housing market bottom in 2015.
 Source: Gavekal Research
——————–
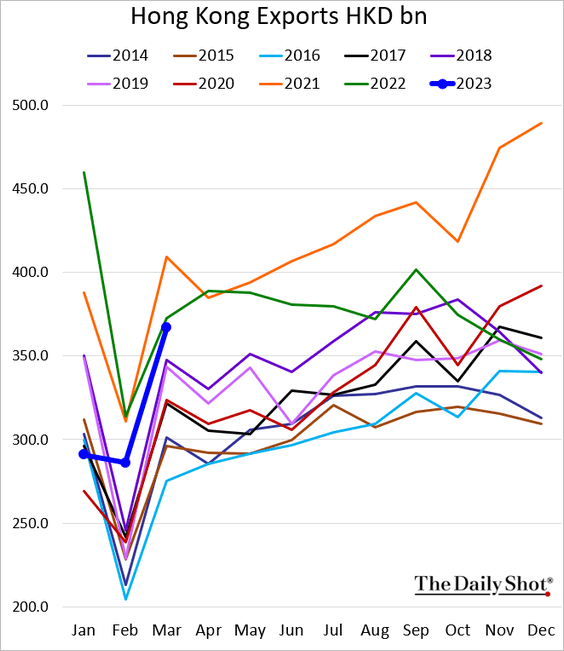
2. Hong Kong’s exports are back near last year’s levels.
Back to Index
Emerging Markets
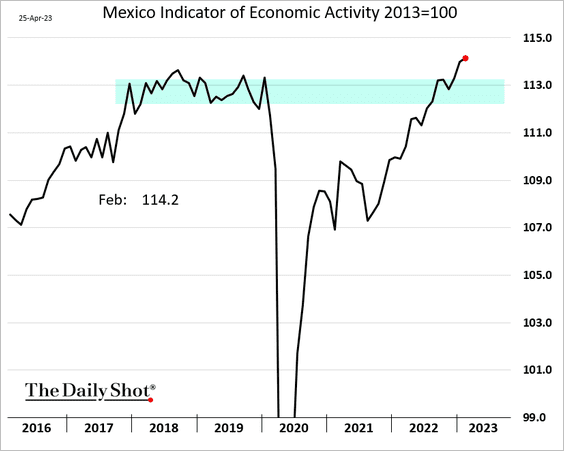
1. Mexico’s economic activity continued to climb in February.
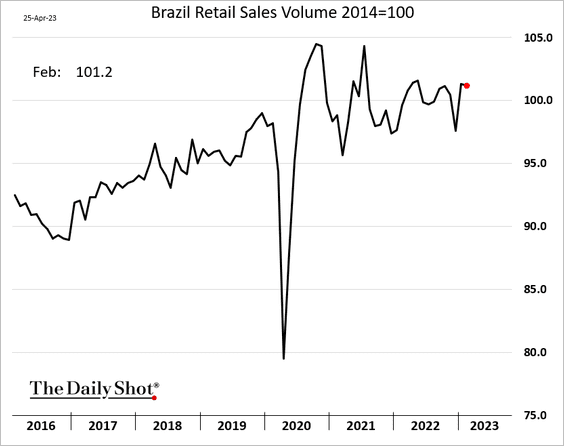
2. Brazil’s retail sales edged lower.
 Source: MarketWatch Read full article
——————–
3. In Argentina’s unofficial exchange markets, the peso is experiencing a sharp decline, deviating even further from the official exchange rate.
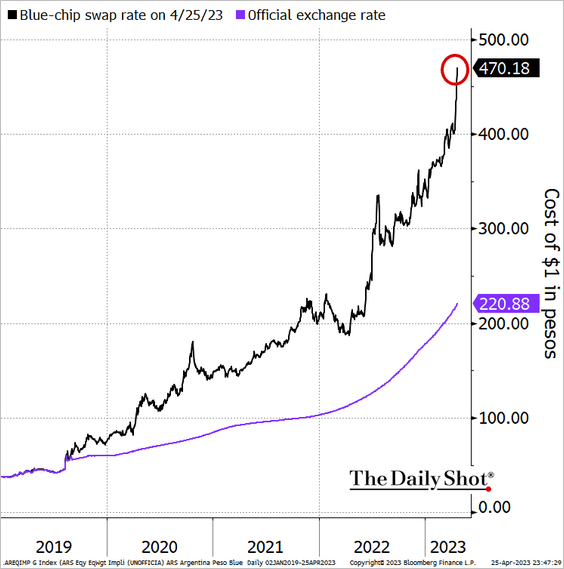 Source: @TheTerminal, Bloomberg Finance L.P.
4. In Turkey’s unofficial FX markets, the US dollar is commanding an increasingly higher premium compared to the official exchange rate.
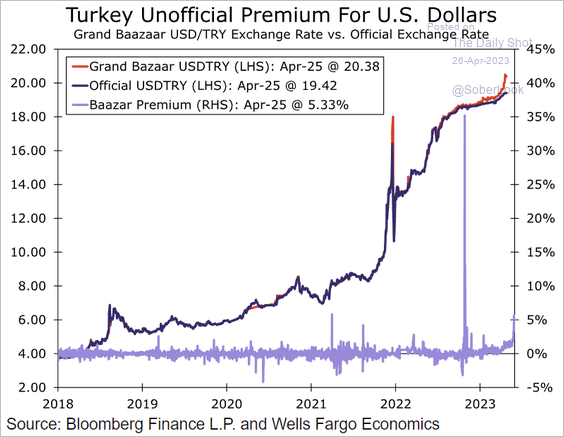 Source: Wells Fargo Securities
5. India’s unemployment remains elevated.
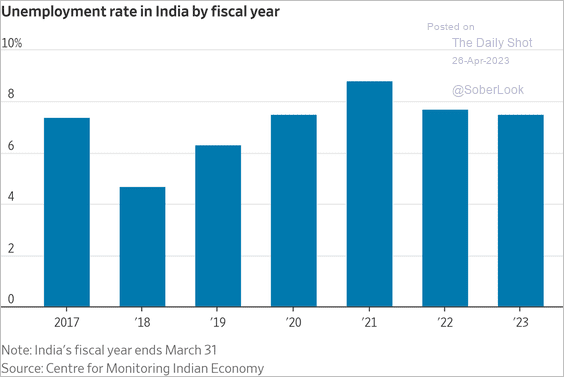 Source: @WSJ Read full article
6. EM stocks continue to underperform advanced economies.
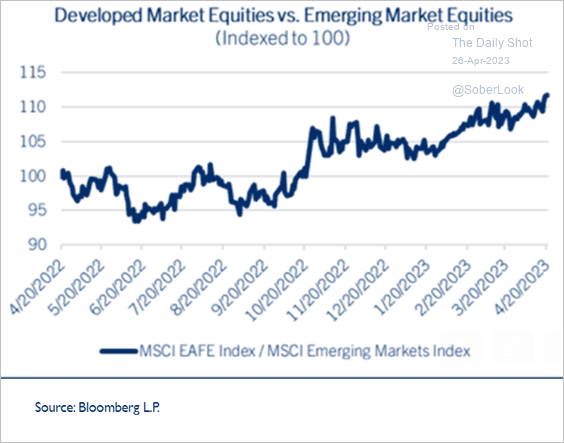 Source: Comerica Wealth Management
Back to Index
Commodities
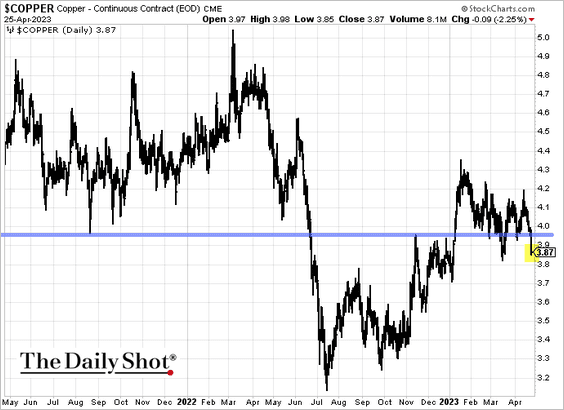
1. Copper prices eased due to an apparent decrease in demand from China and a growing inventory at the LME.
A recovery in China’s energy and electricity consumption is needed to support a rise in copper prices.
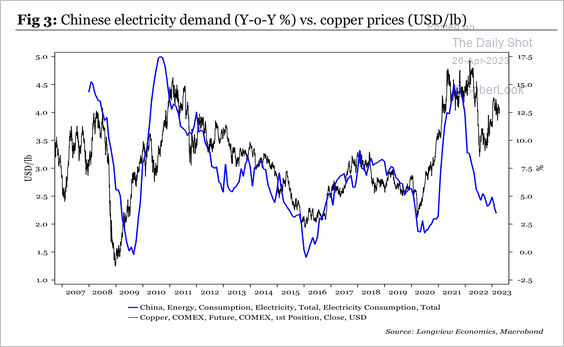 Source: Longview Economics
——————–
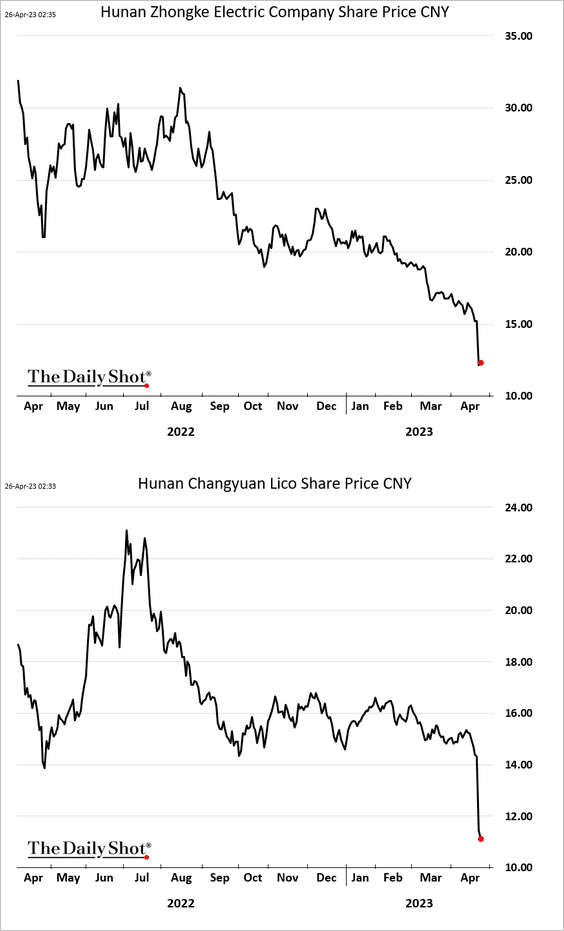
2. Chinese lithium stocks, constituting 36.5% of the Global X Lithium ETF (chart below), experienced a downturn …
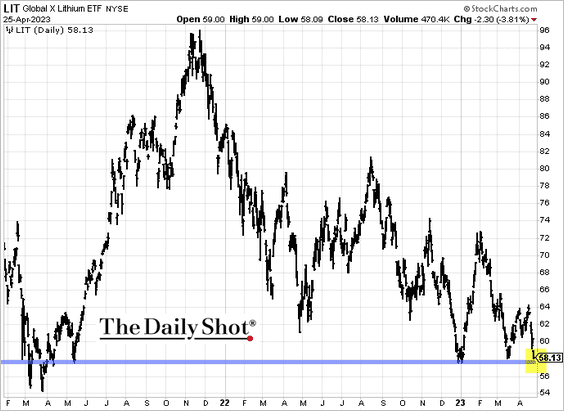
… following significant Q1 profit declines reported by several Chinese lithium firms due to falling lithium carbonate prices.
——————–
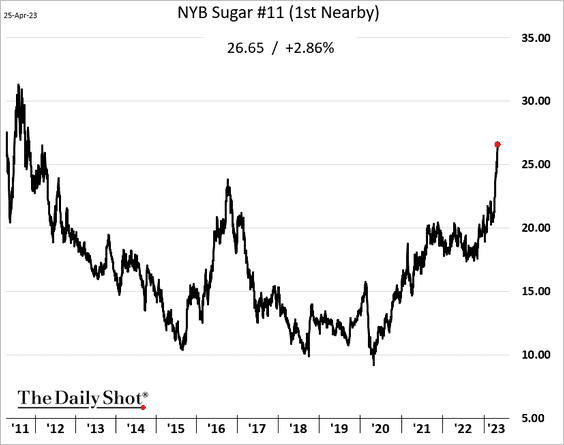
3. Due to the scarcity of physical sugar supplies in the spot market for futures deliveries, traders are forced to pay a premium to cover their short positions in sugar futures contracts.
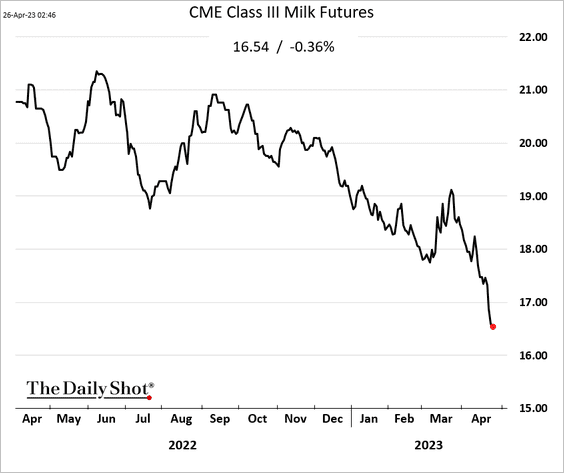
4. CME Class III milk futures continue to sink (class III milk is used to make cheese).
5. The May lumber futures hit a contract low.

Back to Index
Energy
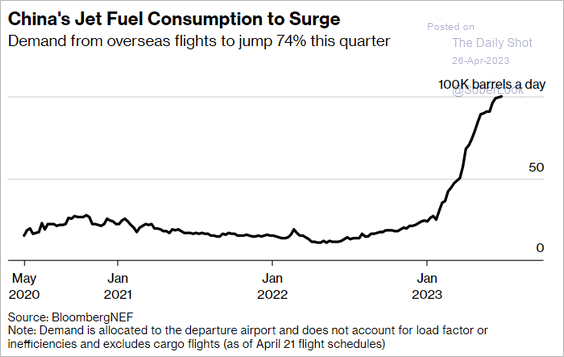
1. China’s jet fuel demand should rise with increased overseas flights.
 Source: @markets Read full article
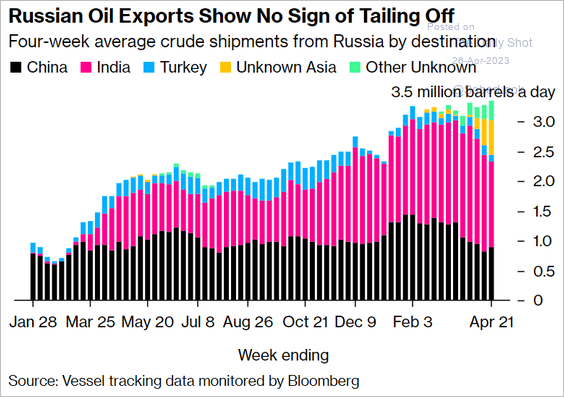
2. Russian oil sales show no signs of easing.
 Source: @JLeeEnergy, @markets Read full article
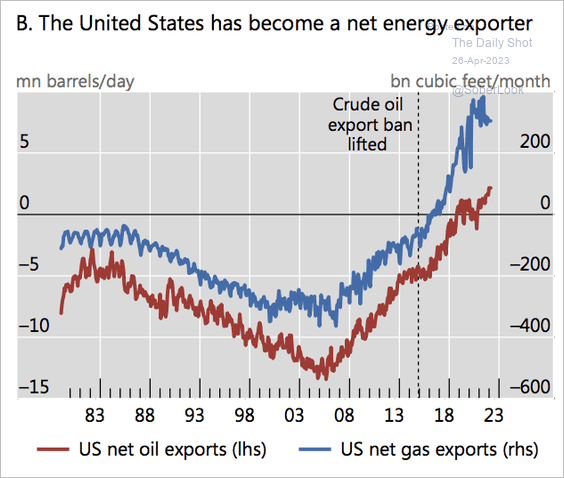
3. The US is a net energy exporter.
 Source: BIS Read full article
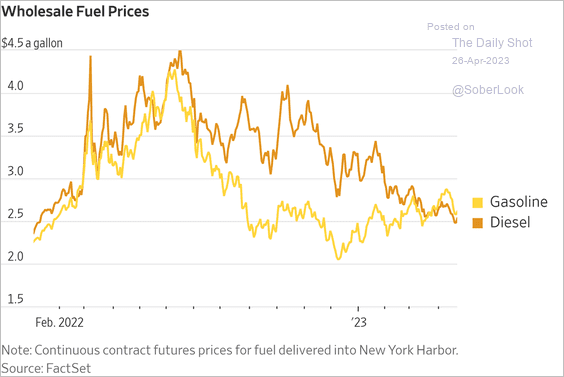
4. US diesel and gasoline prices have converged as distillates shortages ease.
 Source: @WSJ Read full article
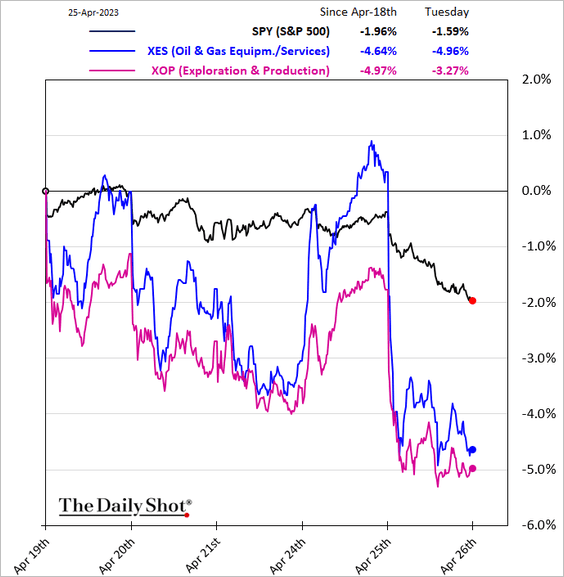
5. Energy companies have been underperforming.
Back to Index
Equities
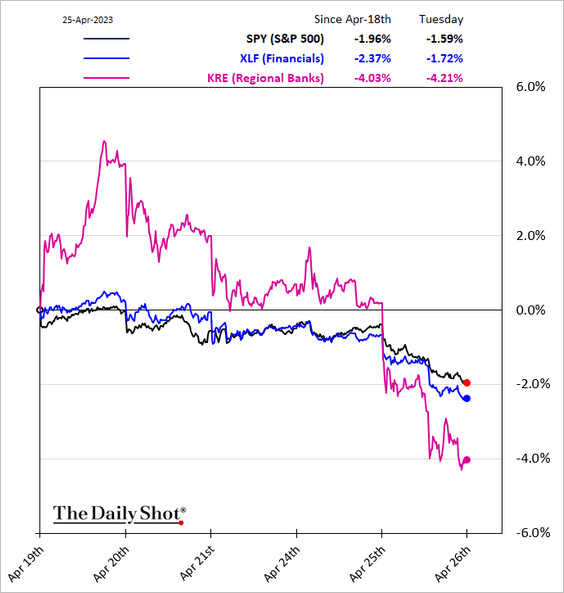
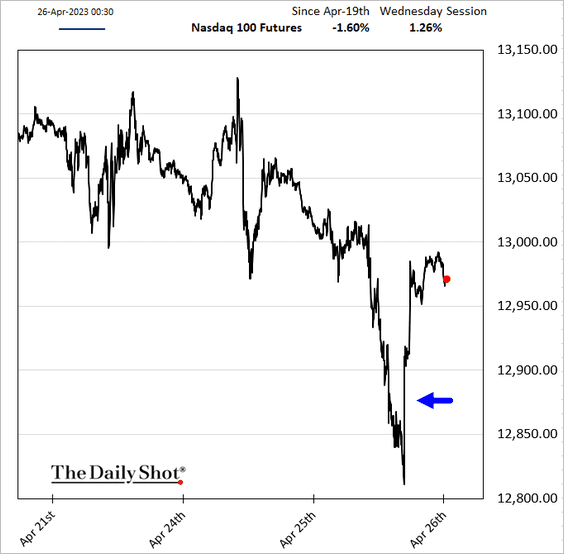
1. The lull in volatility ended on Tuesday as banking concerns resurfaced.
 Source: @financialtimes Read full article
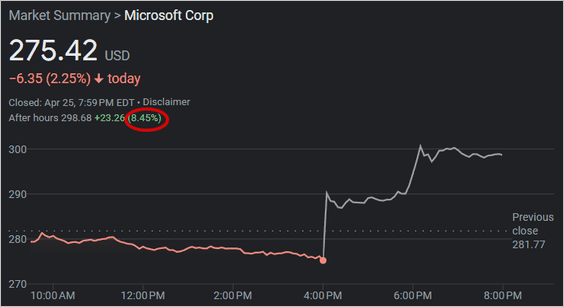
But stocks are up after the close as Microsoft’s earnings beat.
 Source: CNBC Read full article
——————–
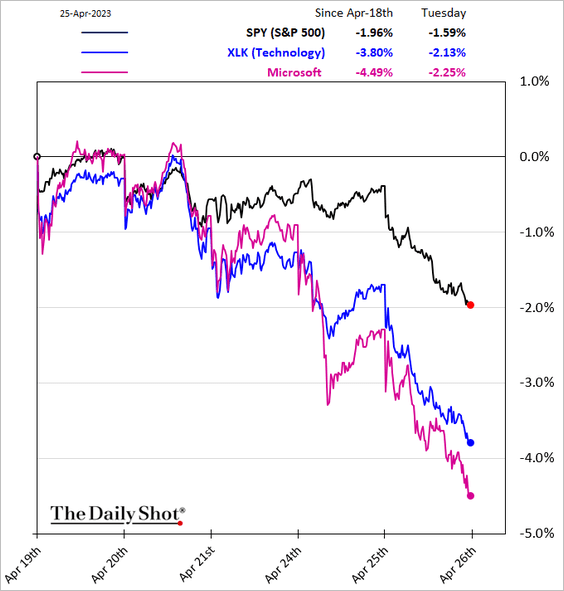
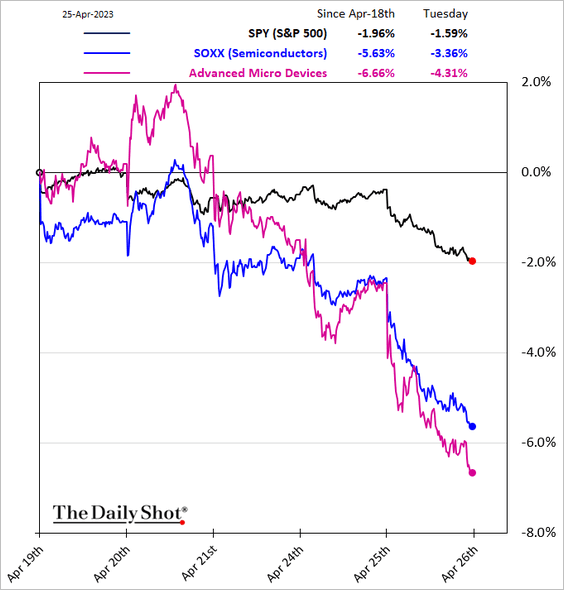
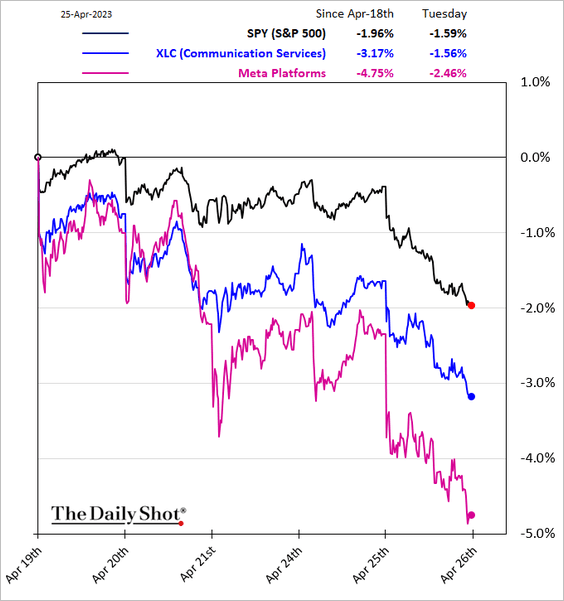
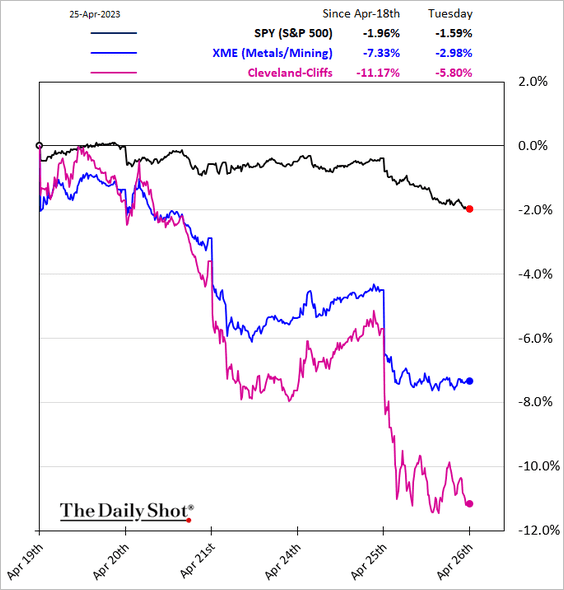
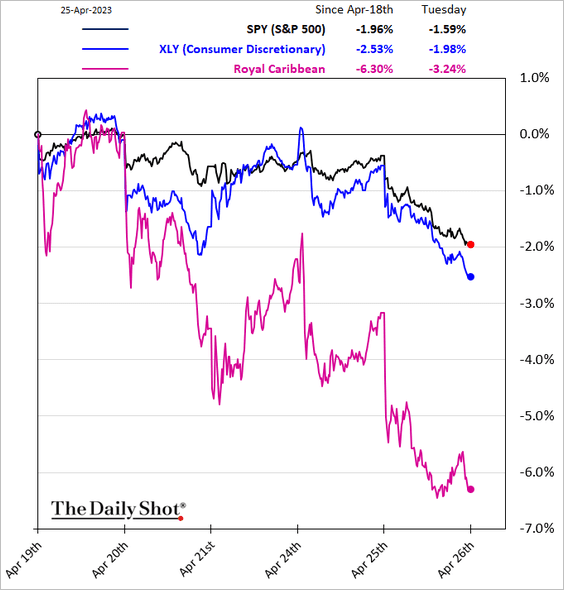
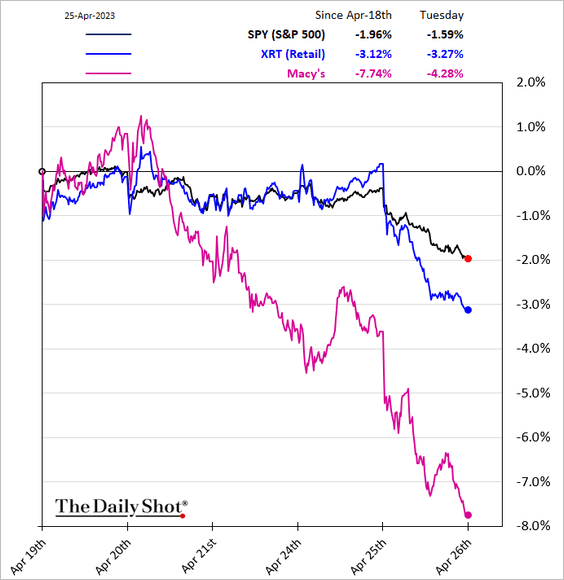
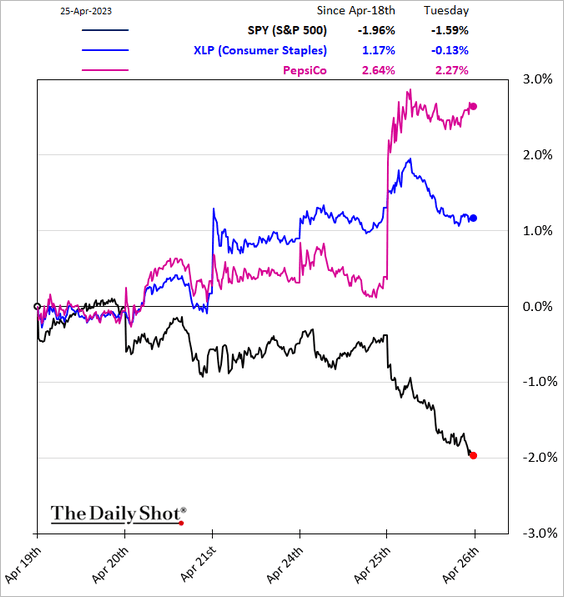
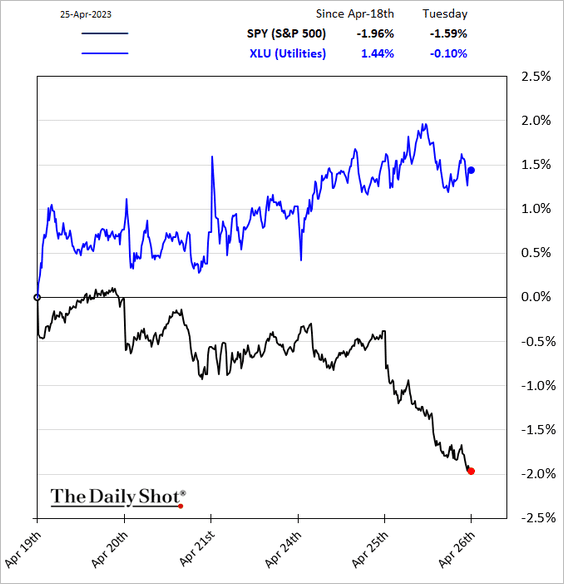
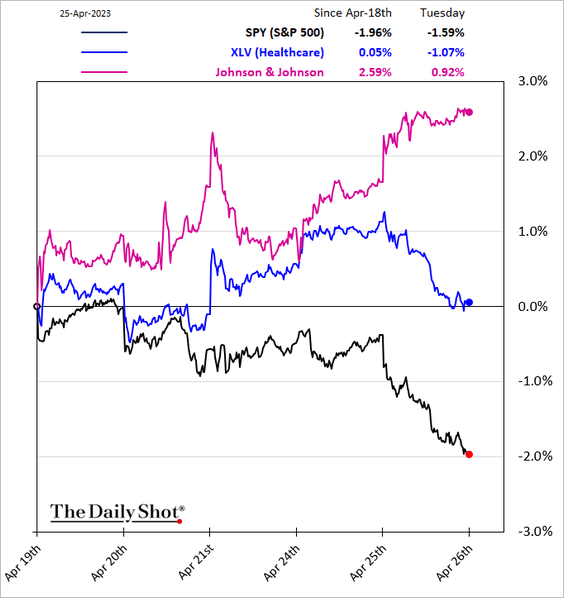
2. Here are some sector trends over the past five business days.
• Tech:
– Semiconductors:
– Communication Services:
• Metals & Mining:
• Consumer discretionary and retail:
Defensives outperformed.
• Consumer staples:
• Utilities:
• Healthcare:
——————–
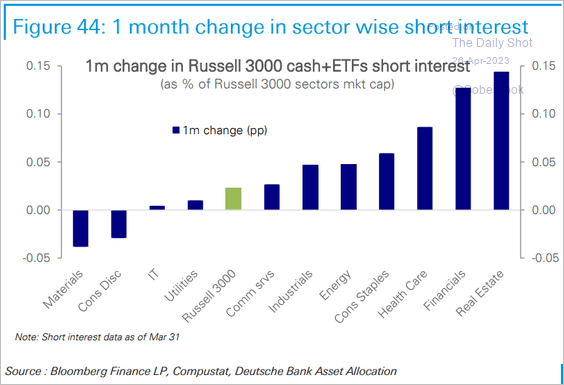
3. Below are some additional sector trends.
• This chart shows one-month changes in short interest by sector.
 Source: Deutsche Bank Research
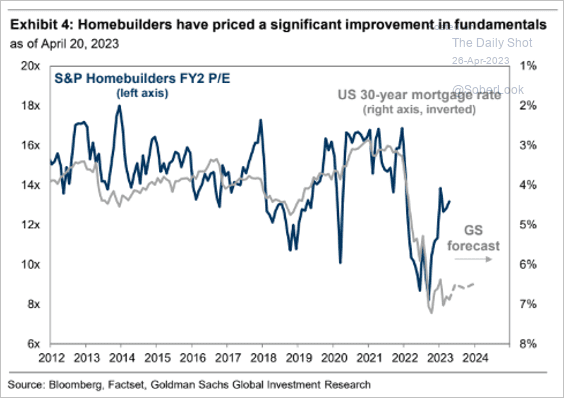
• Homebuilder stocks are pricing in an unrealistic rebound in fundamentals.
 Source: Goldman Sachs; @MikeZaccardi
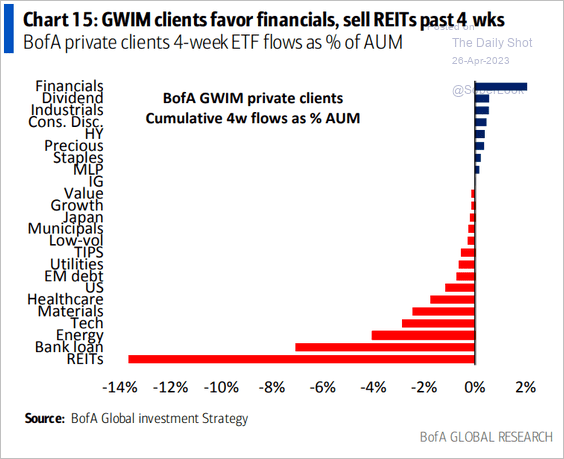
• BofA private clients have been getting back into financials and dumping REITs.
 Source: BofA Global Research
——————–
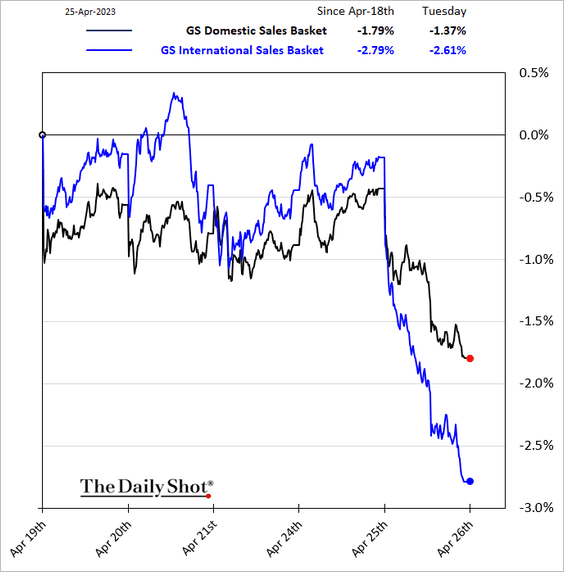
4. Stocks with high international sales underperformed on Tuesday as the dollar gained.
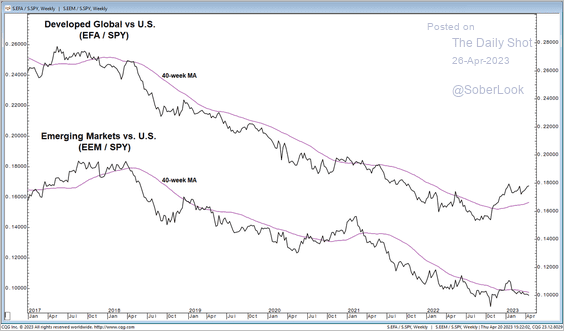
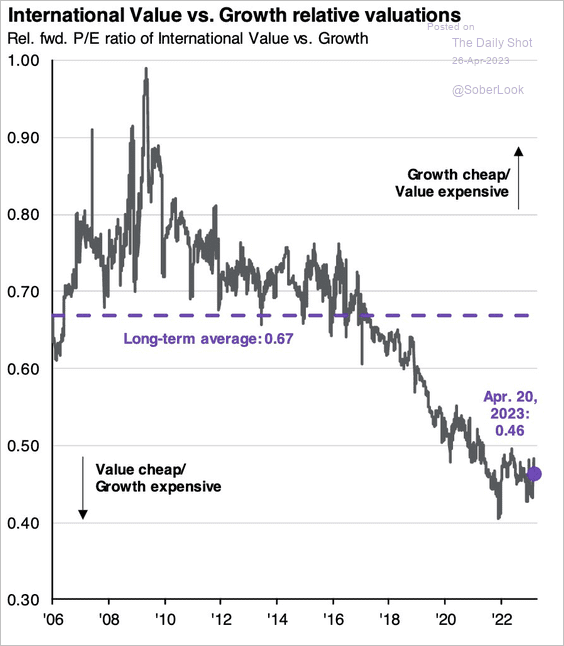
5. International equity markets are starting to stabilize versus the US, pointing to a long-term shift from bearish to bullish momentum.
 Source: @StocktonKatie
International value stocks appear attractive relative to their growth counterparts.
 Source: J.P. Morgan Asset Management
——————–
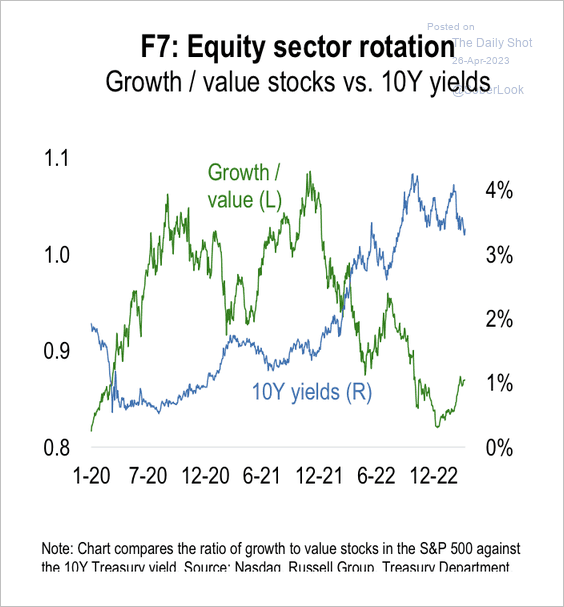
6. A decline in Treasury yields could support a recovery in growth versus value stocks.
 Source: Numera Analytics (@NumeraAnalytics)
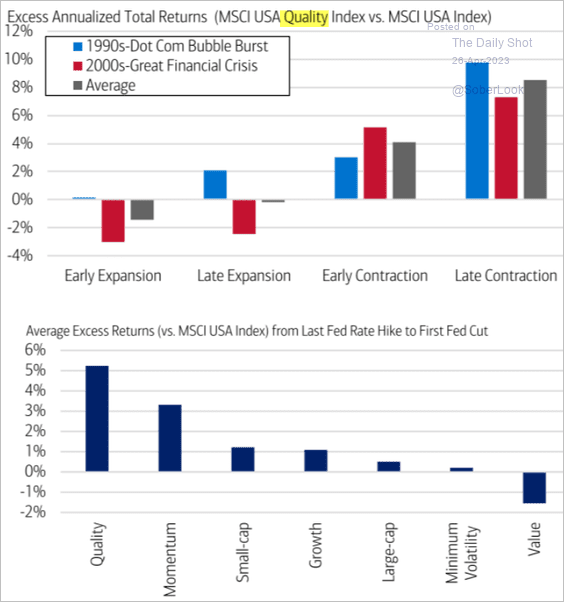
7. The quality factor tends to outperform during slowdowns.
 Source: BofA Global Research
Back to Index
Credit
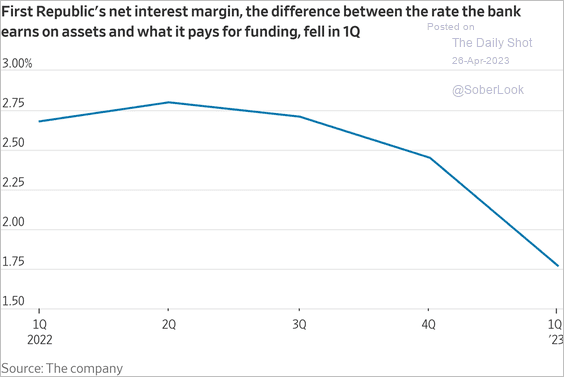
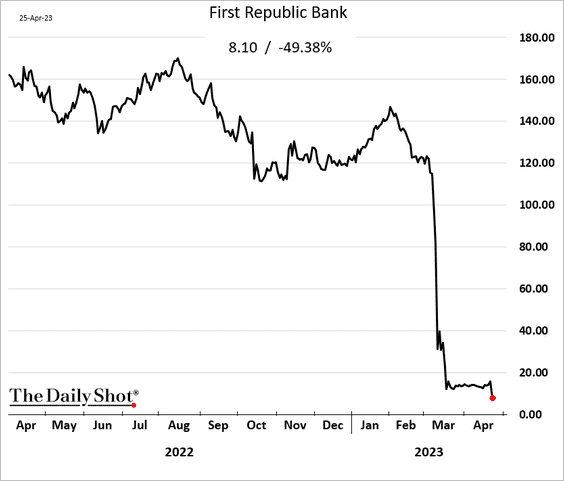
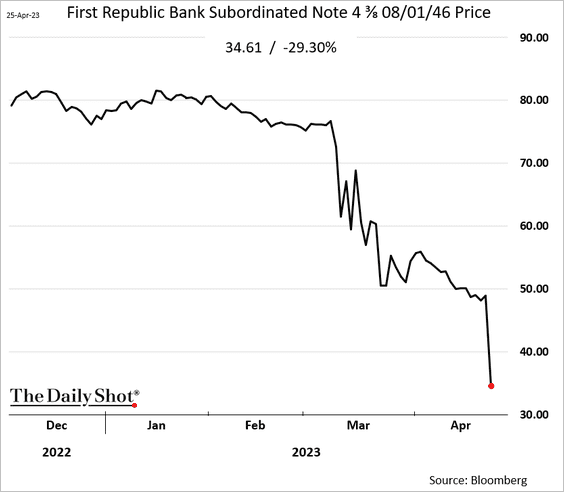
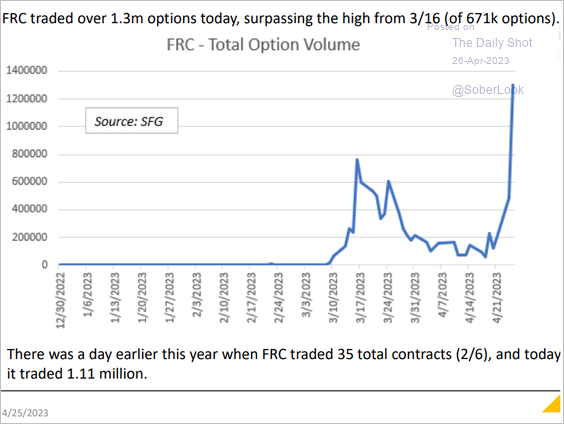
1. At this point, it seems unlikely that First Republic Bank will survive on its own.
 Source: @WSJ Read full article
 Source: Reuters Read full article
• Interest margin:
 Source: @WSJ Read full article
• Stock price:
• Sub debt:
There was a surge in options trading for First Republic Bank.
 Source: Chris Murphy, Susquehanna International Group
——————–
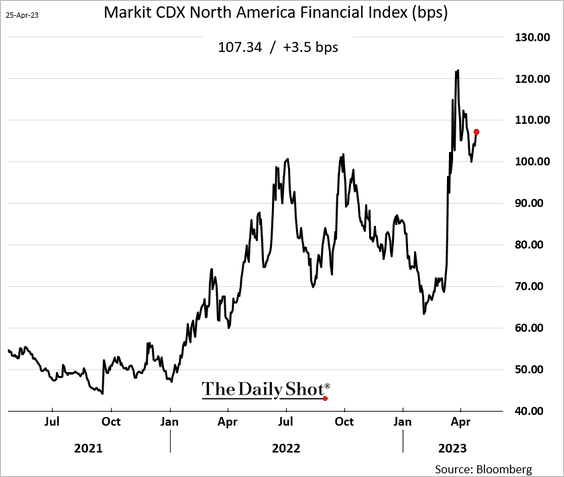
2. US financials’ credit default swap spreads remain elevated.
Back to Index
Rates
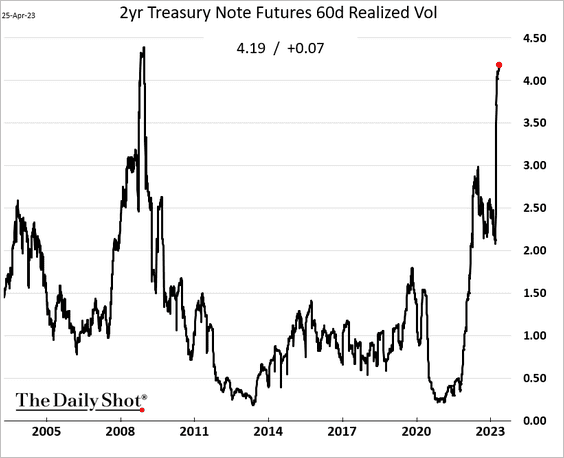
The 2-year Treasury futures realized volatility is nearing the GFC peak.
Back to Index
Global Developments
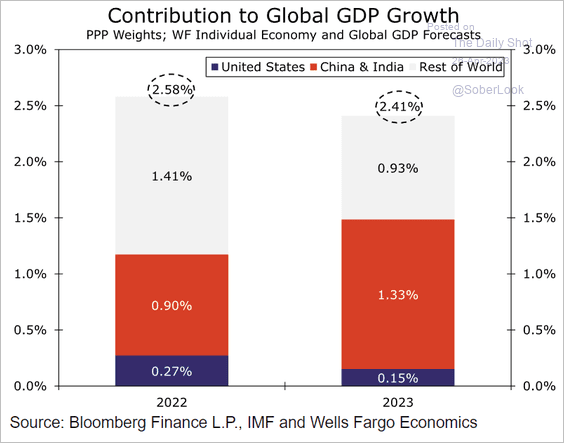
1. China and India are expected to generate over half of the global GDP growth this year.
 Source: Wells Fargo Securities
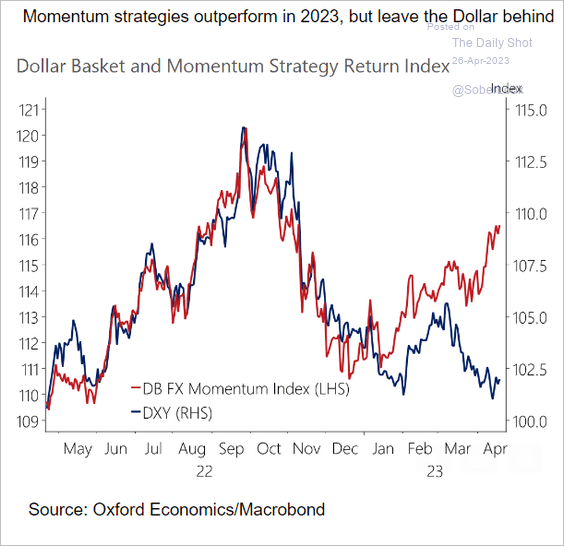
2. Deutsche Bank’s currency momentum index has been outperforming the US dollar.
 Source: Oxford Economics
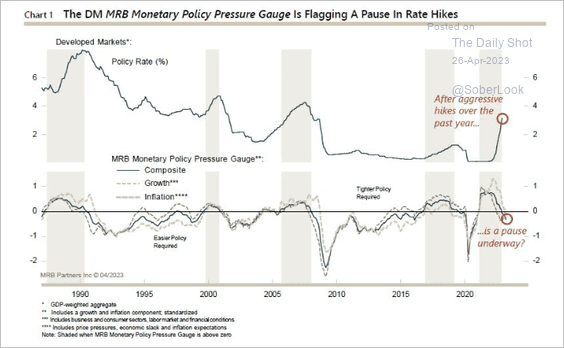
3. MRB Partners’ models suggest a pause in developed market rate hikes.
 Source: MRB Partners
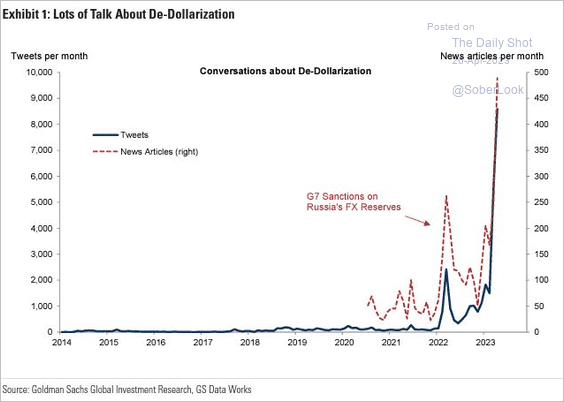
4. This chart shows the number of Tweets and news articles on de-dollarization.
 Source: Goldman Sachs
——————–
Food for Thought
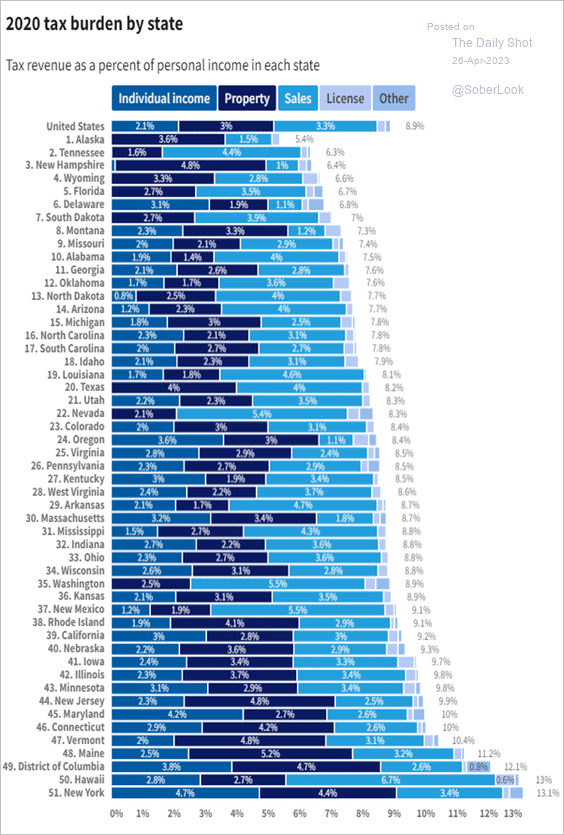
1. The tax burden by state:
 Source: USAFacts Read full article
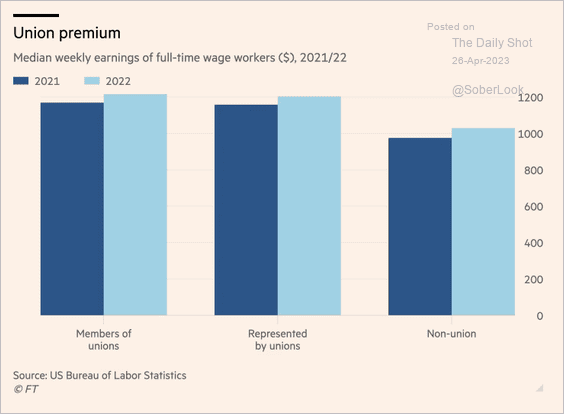
2. The union premium:
 Source: @financialtimes Read full article
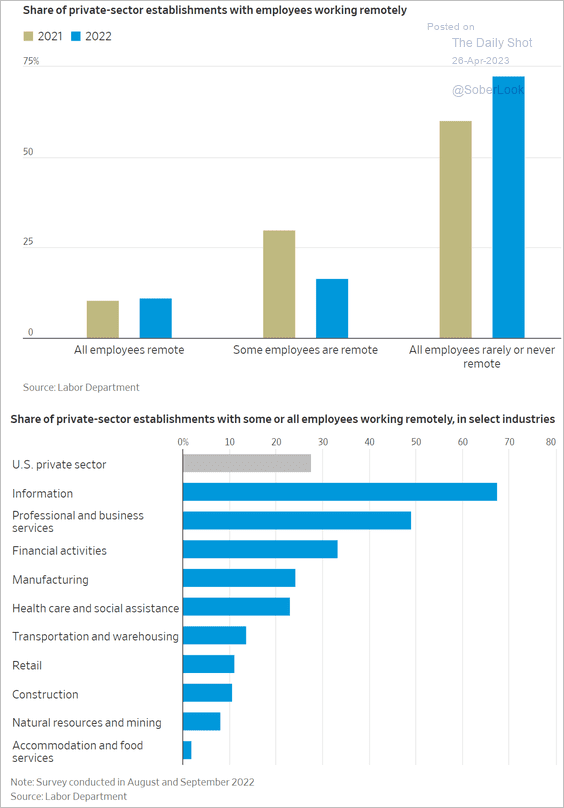
3. Remote work:
 Source: @WSJ Read full article
4. Parental family leave trends:
 Source: @WSJ Read full article
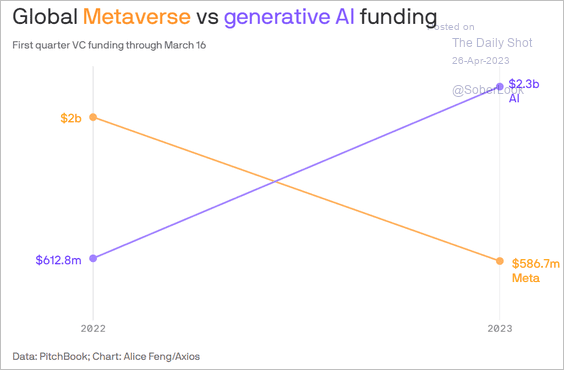
5. Metaverse vs. generative AI:
 Source: @axios Read full article
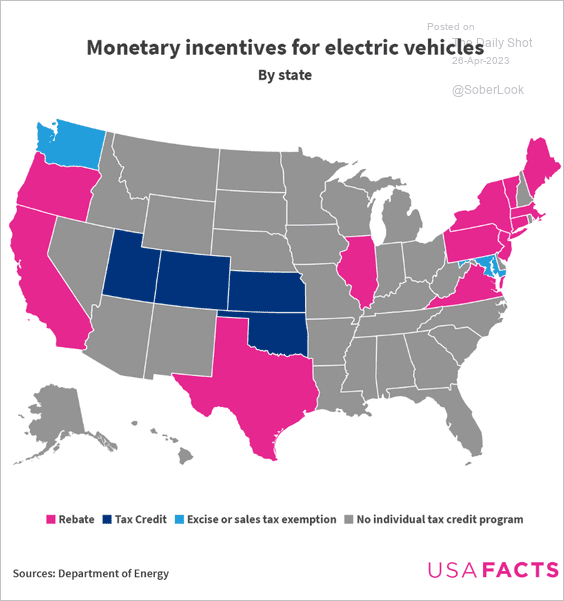
6. Monetary incentives for electric vehicles:
 Source: USAFacts
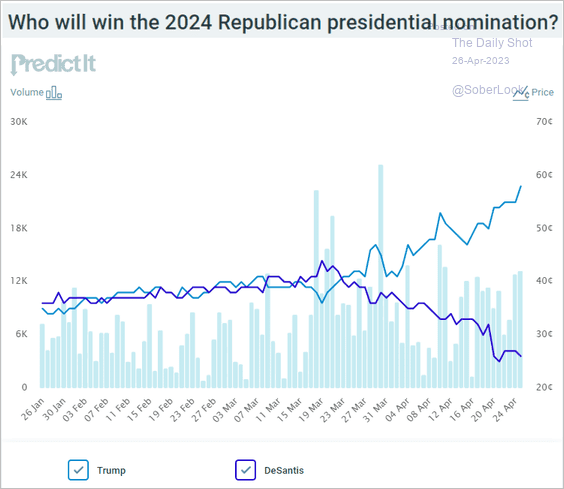
7. The 2024 GOP presidential nomination probabilities in the betting markets:
 Source: @PredictIt
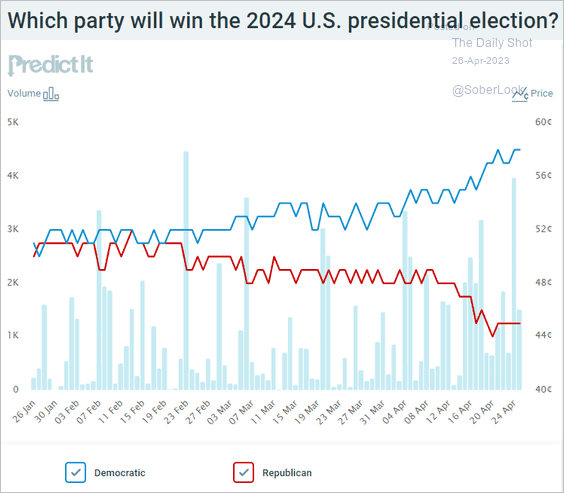
• The 2024 general election probabilities in the betting markets:
 Source: @PredictIt
——————–
8. The race for the Moon:
 Source: Statista
——————–
Back to Index
