
The Daily Shot: 27-Apr-23
• The United States
• The Eurozone
• Sweden
• Asia – Pacific
• China
• Emerging Markets
• Cryptocurrency
• Commodities
• Energy
• Equities
• Credit
• Rates
• Global Developments
• Food for Thought
The United States
1. Durable goods orders jumped in March, boosted by aircraft purchases.
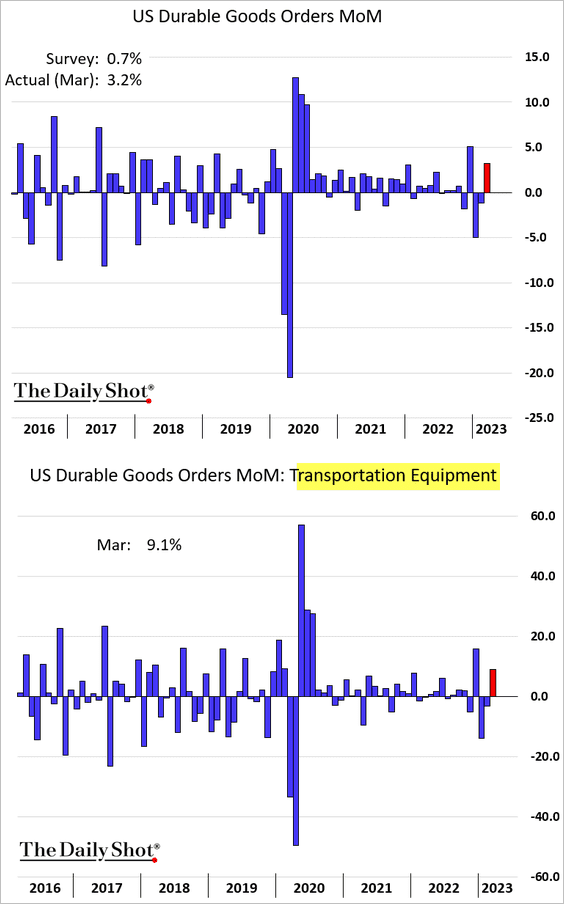
• Excluding transportation, durable goods orders showed a small gain.
![]()
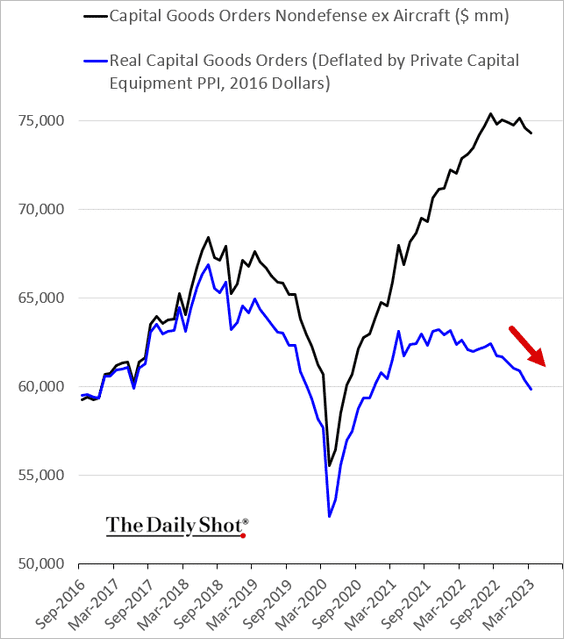
• But capital goods orders were down for the second month.
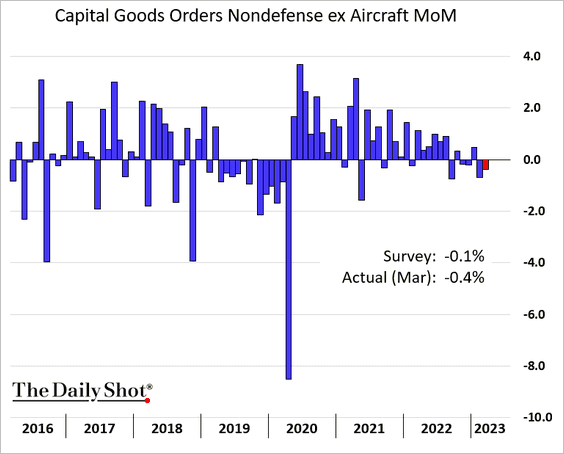
Moreover, adjusted for inflation, capital goods orders continue to roll over, signaling a retreat in business investment.
——————–
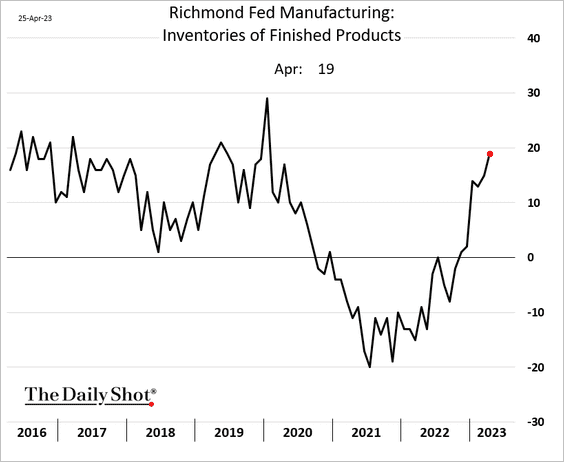
2. The Richmond Fed’s manufacturing index shows an ongoing contraction in the Mid-Atlantic and Southeastern US factory activity.
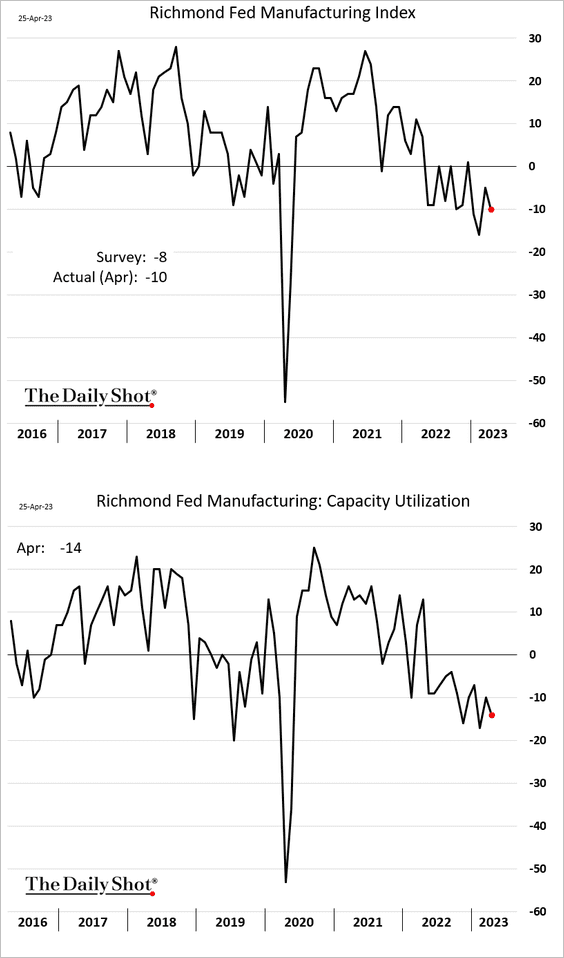
More firms see increases in finished product inventories.
——————–
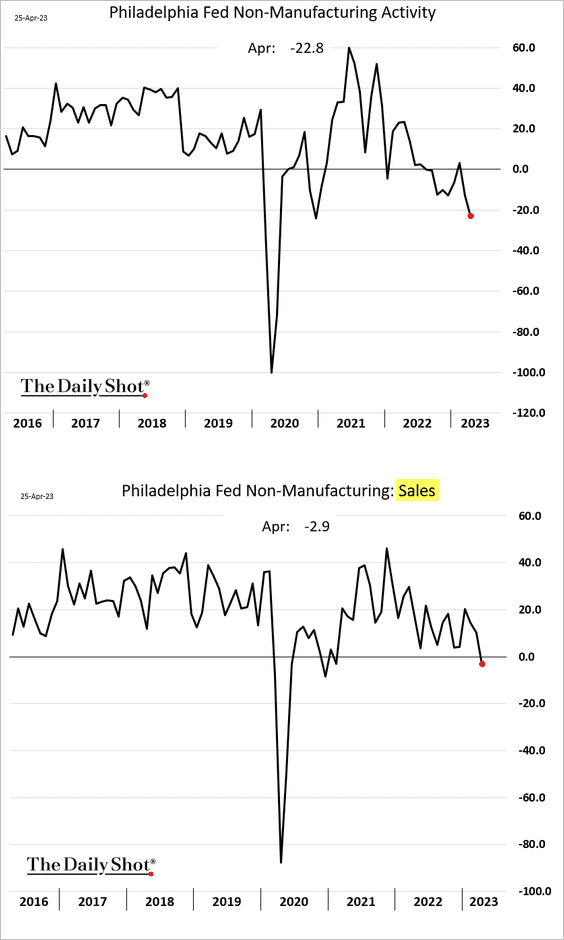
3. The Philly Fed’s regional services index shows slowing activity.
4. The GDPNow model estimate for Q1 growth has declined sharply in recent days (approaching 1%).
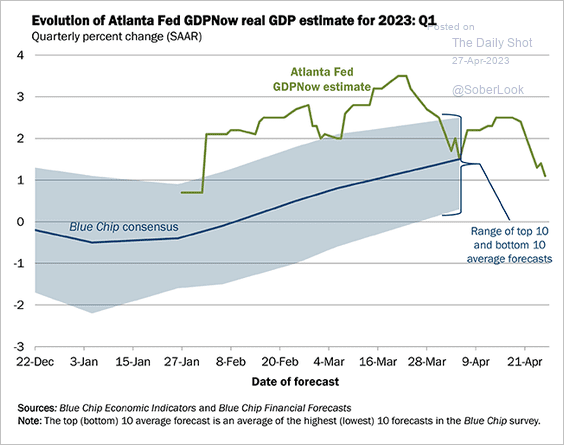 Source: @AtlantaFed Read full article
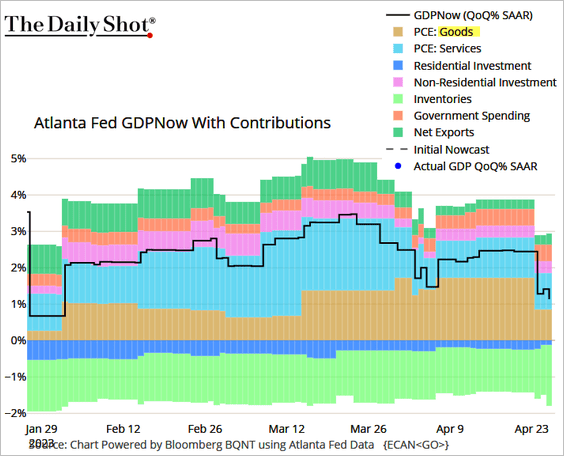
The biggest driver of the decline is goods spending.
 Source: @TheTerminal, Bloomberg Finance L.P.
The reason for the downward shift in the GDPNow index is attributed to the downward revision to core retail sales.
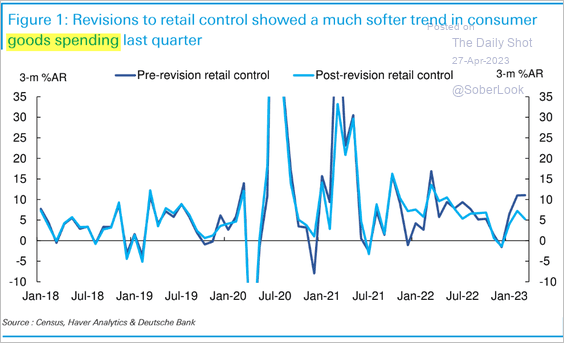 Source: Deutsche Bank Research
• Separately, NBER indicators are not showing any signs of a recession for now.
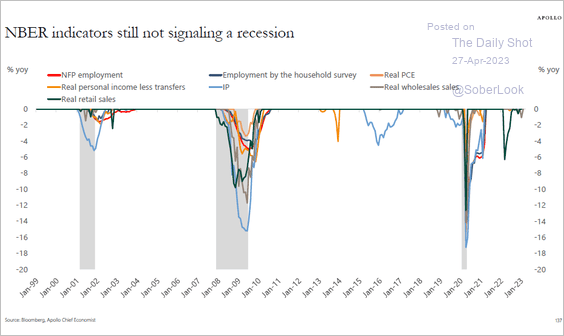 Source: Torsten Slok, Apollo
——————–
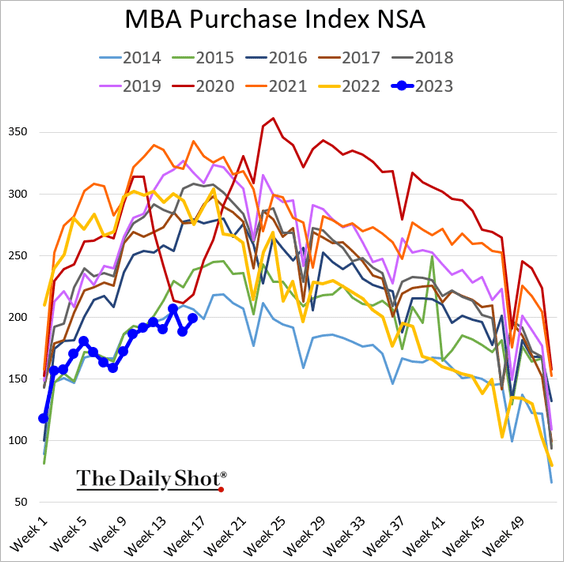
5. Mortgage applications remain below 2014 levels.
The rate lock count continues to deteriorate.
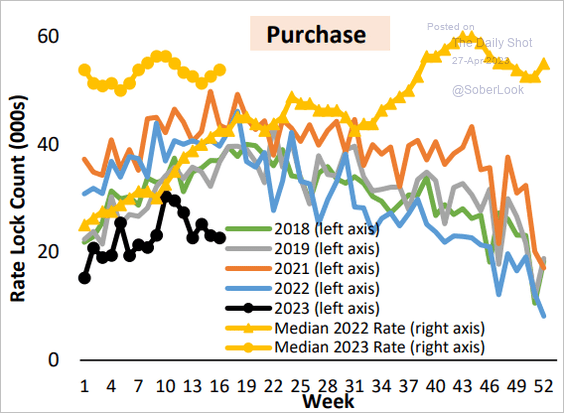 Source: AEI Housing Center
• Layoffs are coming to the real estate brokerage business.
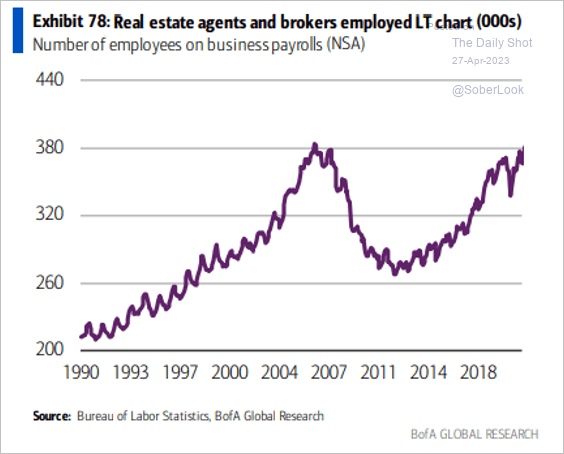 Source: BofA Global Research; @MikeZaccardi
——————–
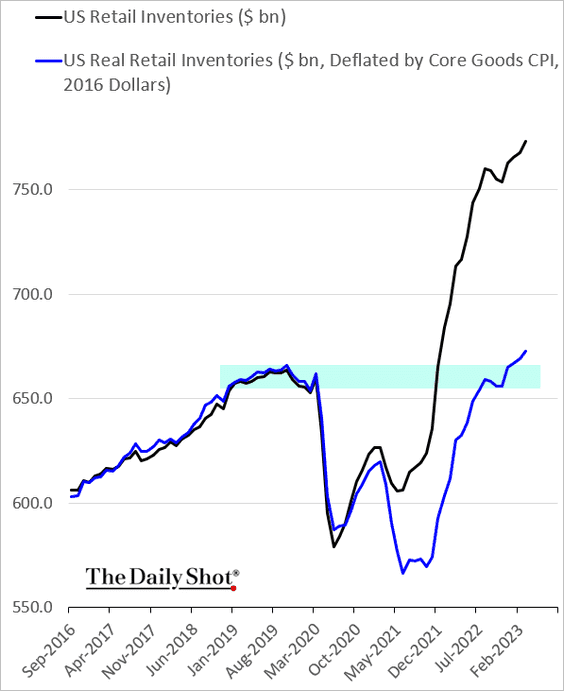
6. Retail inventories jumped more than expected in March.
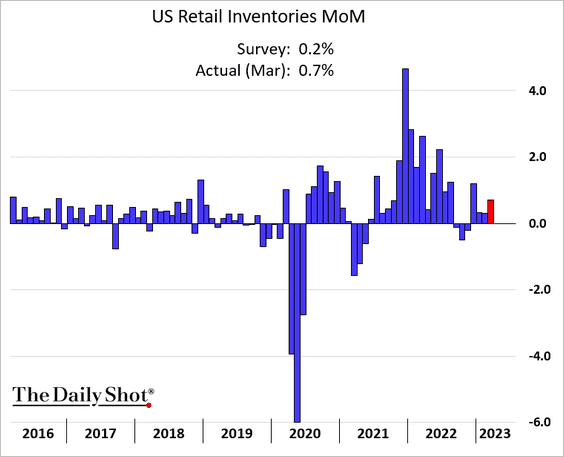
Adjusted for inflation, retail inventories are now well above pre-COVID levels.
——————–
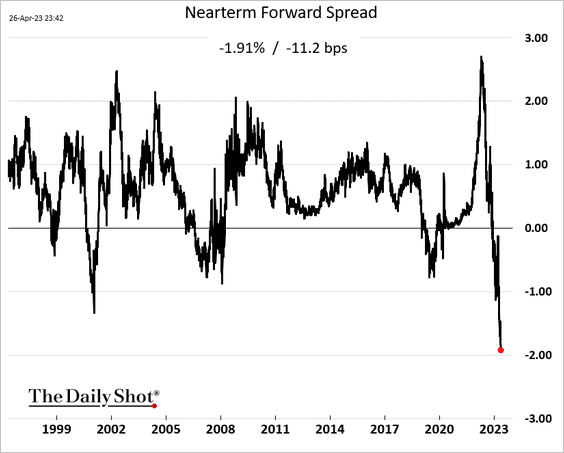
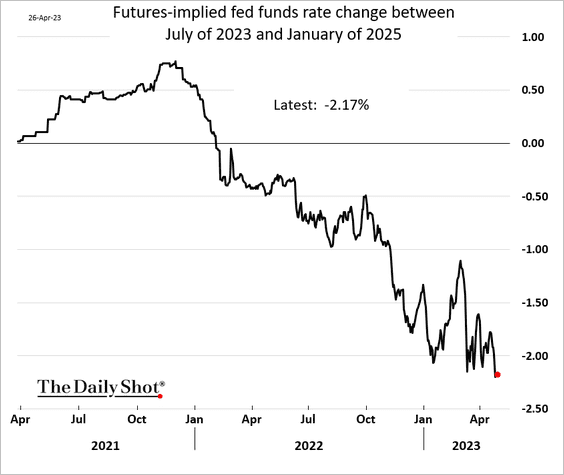
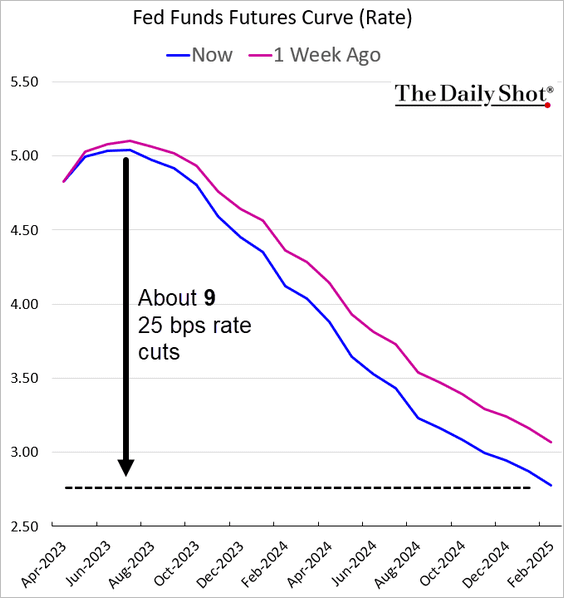
7. The market continues to price in deep rate cuts over the next 18 months amid concerns about the banking sector and the debt ceiling. This chart shows the difference between the implied interest rate on a three-month Treasury bill six quarters ahead and the current three-month Treasury bill rate.
And here is what the fed funds futures are telling us (2 charts).
Back to Index
The Eurozone
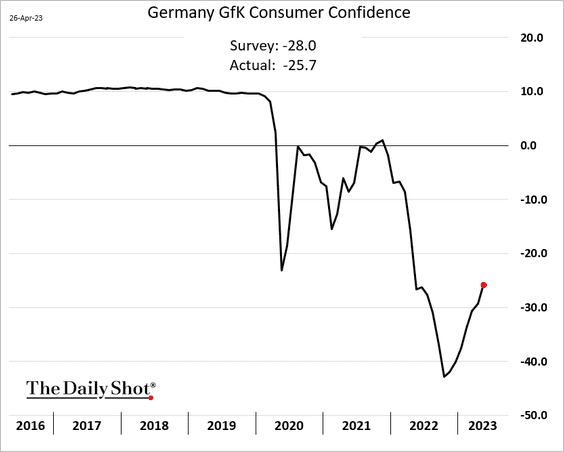
1. Germany’s consumer confidence continues to recover, topping expectations.
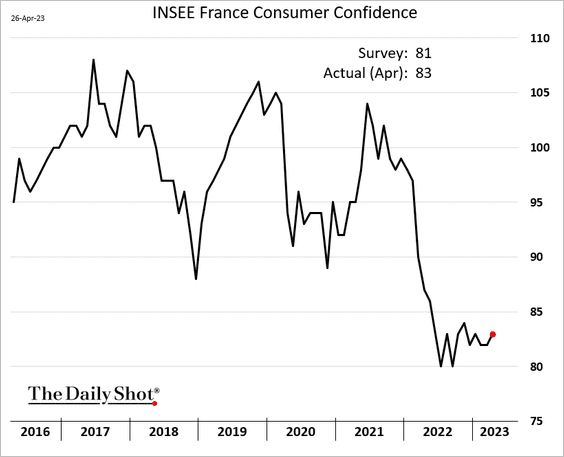
French consumer confidence edged higher despite the protests.
——————–
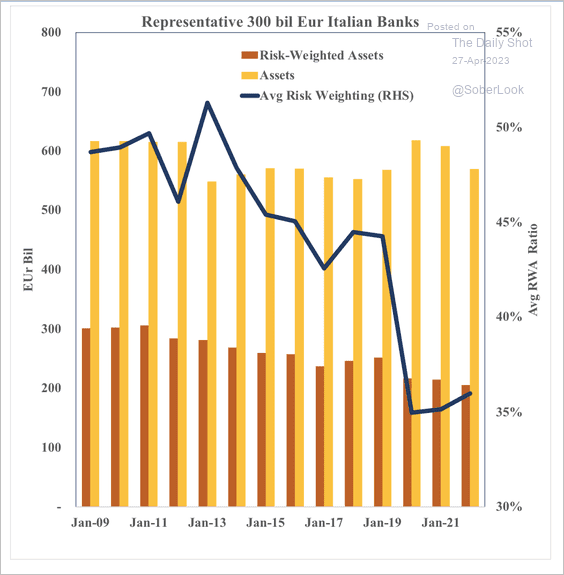
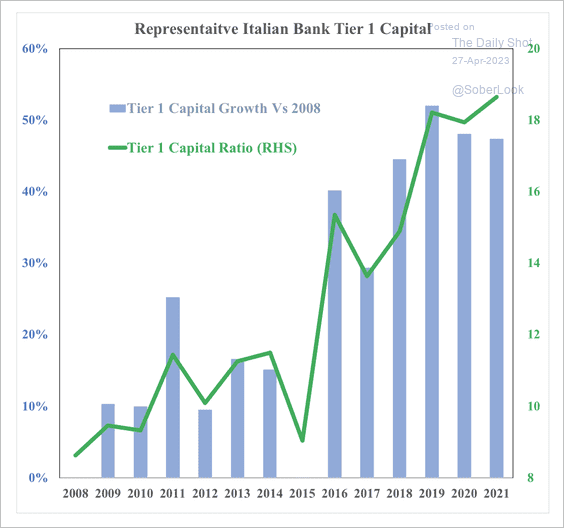
2. Italian banks have reduced asset risk and raised capital. (2 charts)
 Source: SOM Macro Strategies
 Source: SOM Macro Strategies
——————–
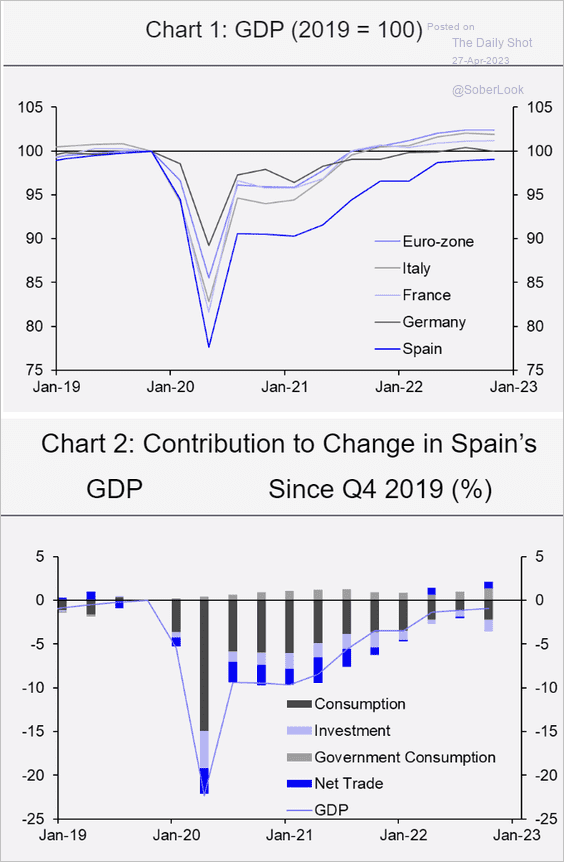
3. Spain’s economic recovery has lagged behind the rest of the Eurozone.
 Source: Capital Economics
Back to Index
Sweden
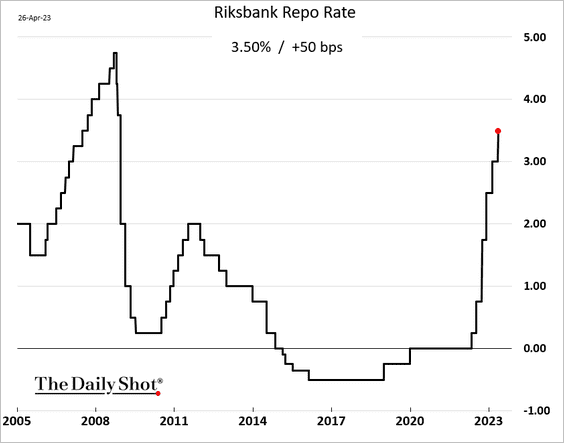
1. Riksbank hiked rates by 50 bps (as expected) and signaled a pause.
 Source: Reuters Read full article
Here is the central bank’s updated rate forecast compared to market pricing (OIS).
 Source: Scotiabank Economics
2. Riksbank projected a deeper recession for the housing market.
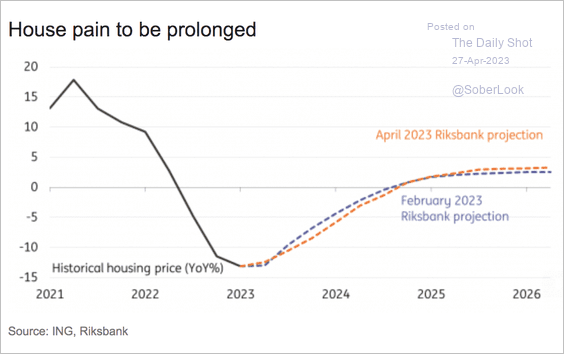 Source: ING
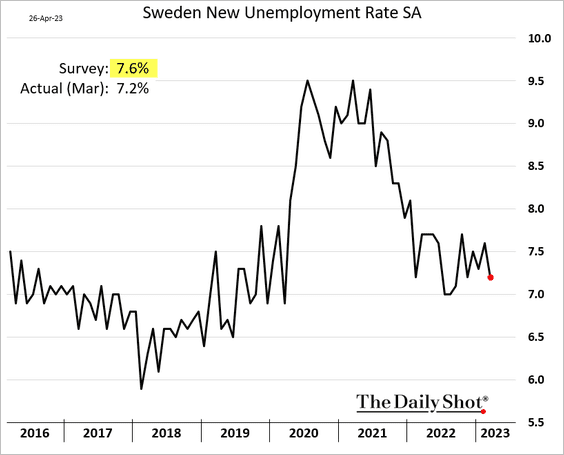
3. The March unemployment rate surprised to the downside.
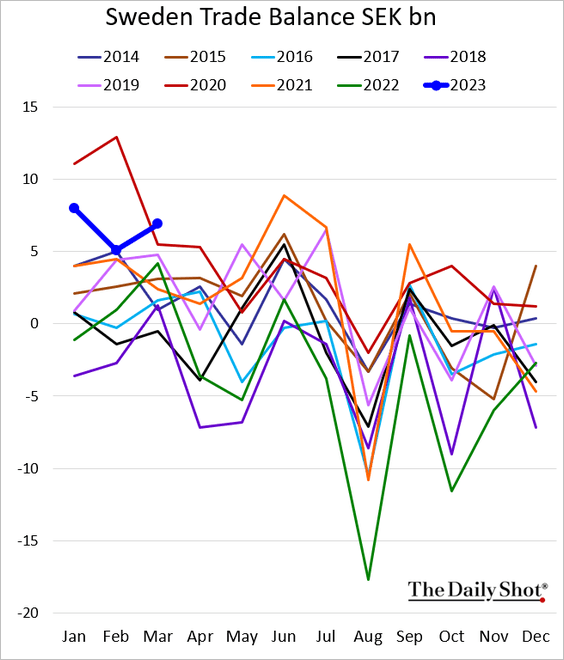
4. The trade surplus hit a multi-year high for this time of the year.
Back to Index
Asia – Pacific
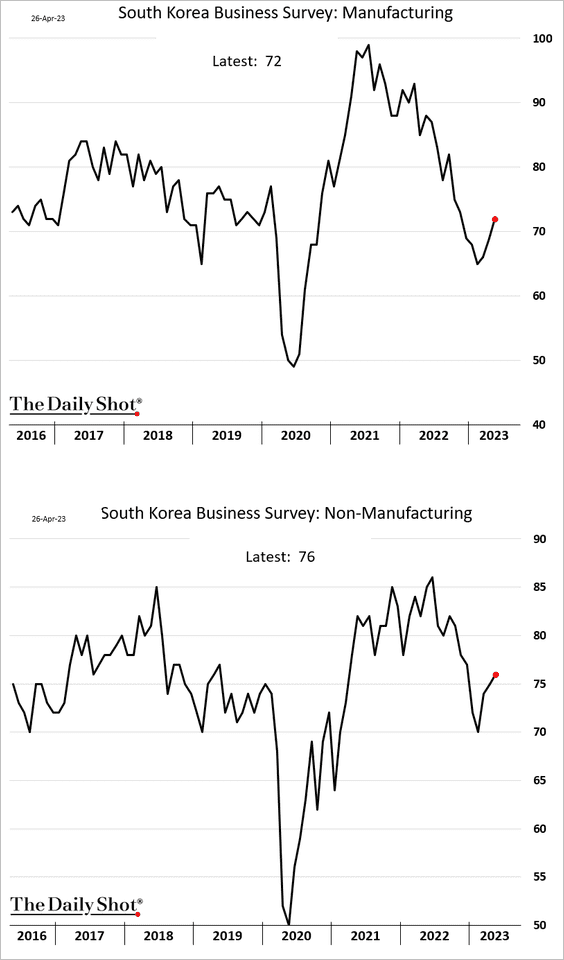
1. South Korea’s business sentiment is rebounding.
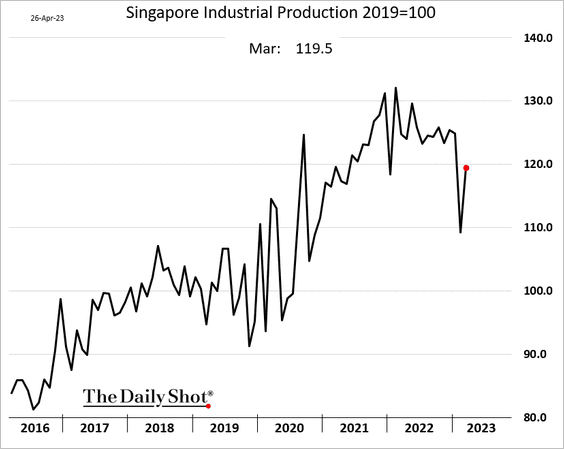
2. Singapore’s industrial production bounced in March but is still well below last year’s levels.
3. Next, we have some data on Tawian’s exports.
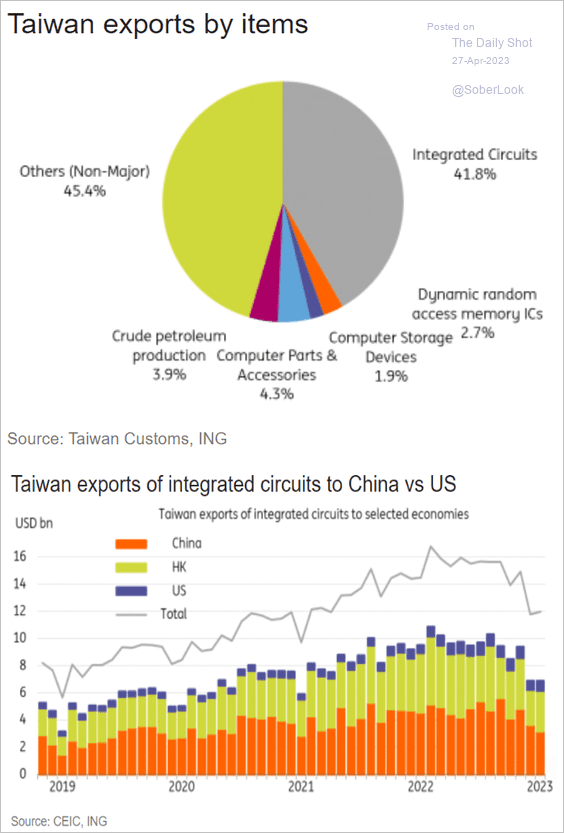 Source: ING
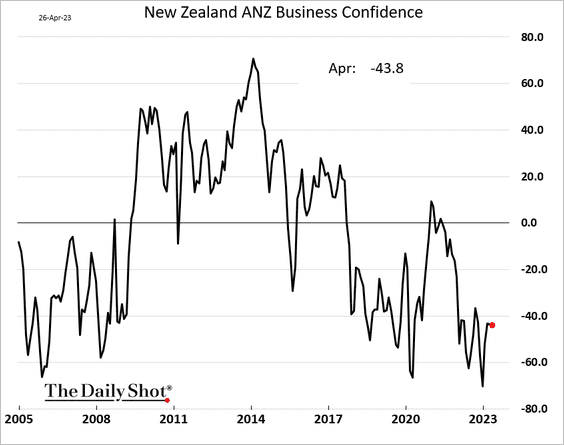
4. New Zealand’s business confidence remains depressed.
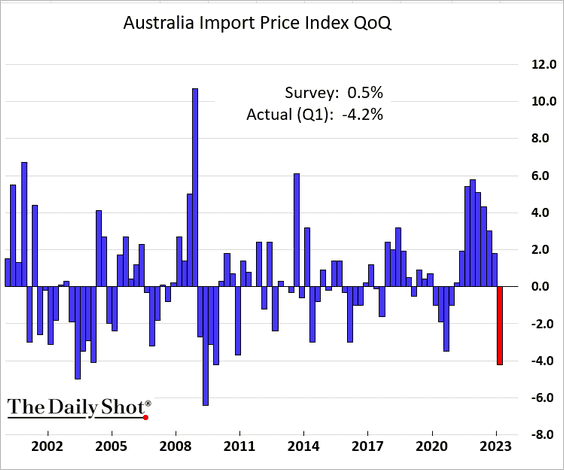
5. Australia’s import prices unexpectedly tumbled in the first quarter.
Back to Index
China
1. So far, onshore markets have not signaled an economic recovery.
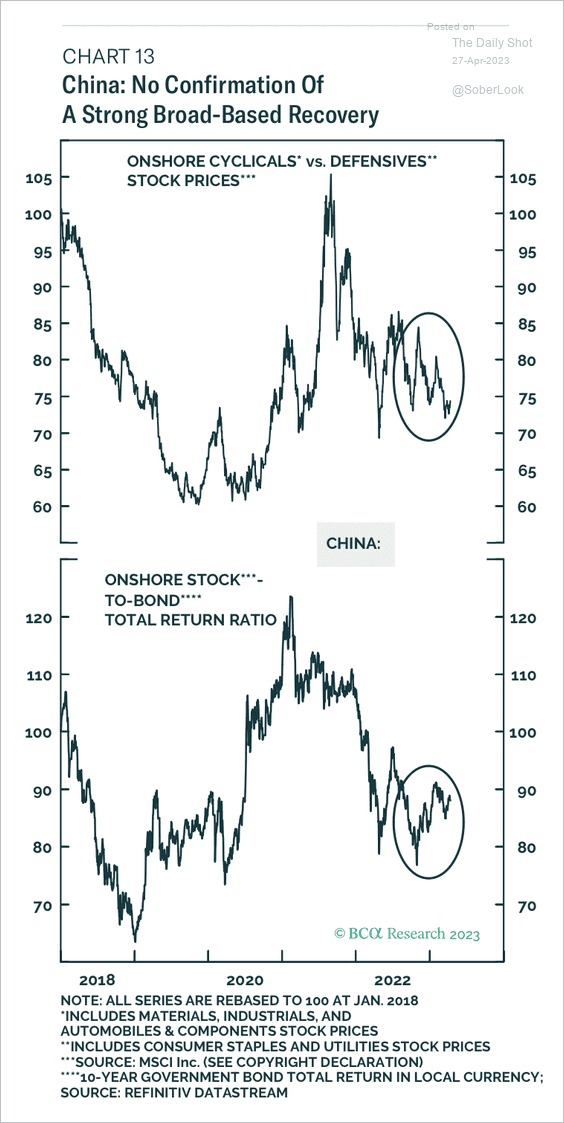 Source: BCA Research
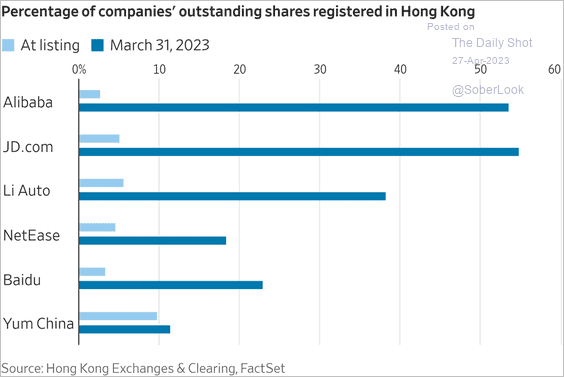
2. US-listed Chinese companies are shifting to Hong Kong.
 Source: @WSJ Read full article
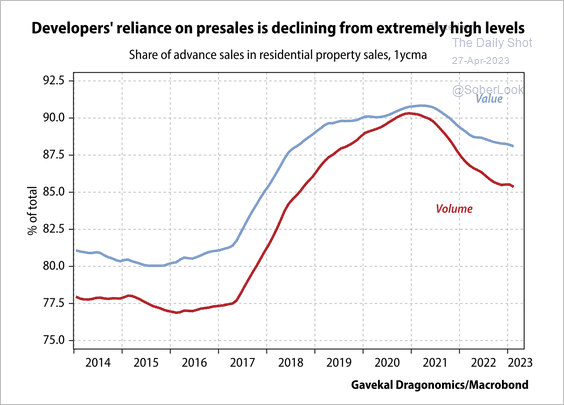
3. Advance home sales still account for a large share of total residential property sales, although developers have shied away in recent years.
 Source: Gavekal Research
Back to Index
Emerging Markets
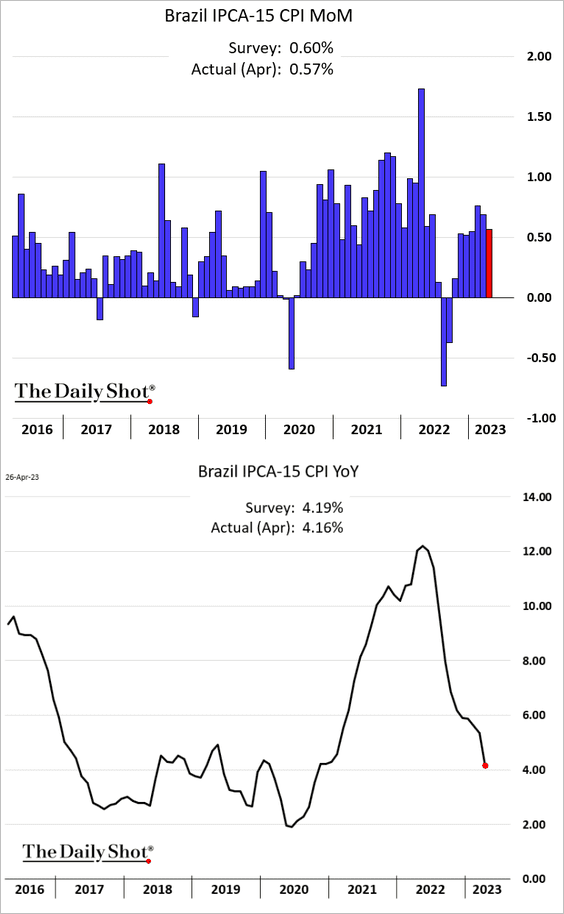
1. Brazil’s inflation is moderating.
 Source: Reuters Read full article
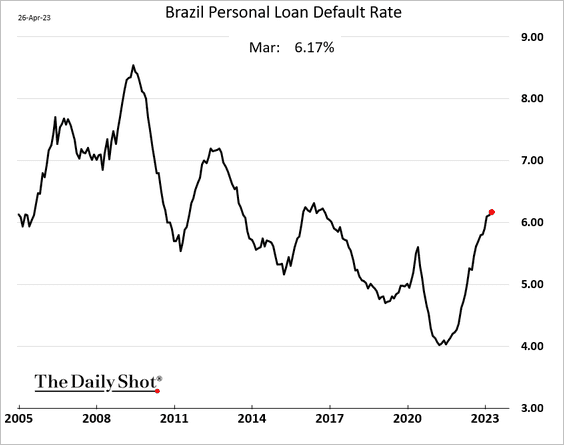
Separately, consumer loan defaults are grinding higher.
——————–
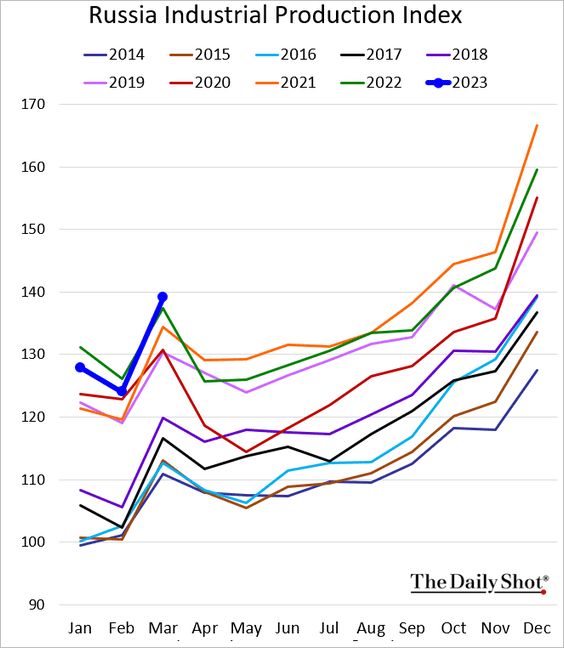
2. Here is Russia’s industrial production index (as reported by the government).
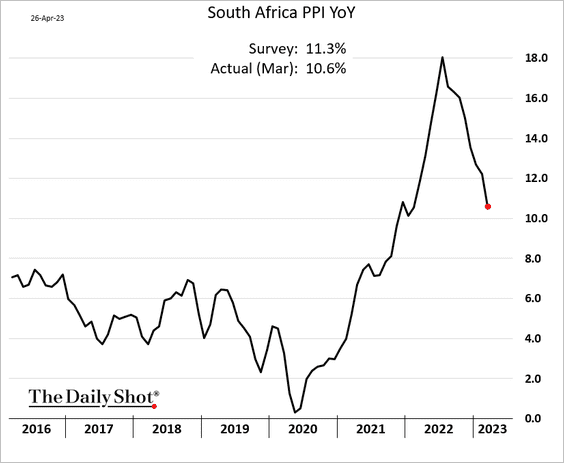
3. South Africa’s producer price gains are slowing.
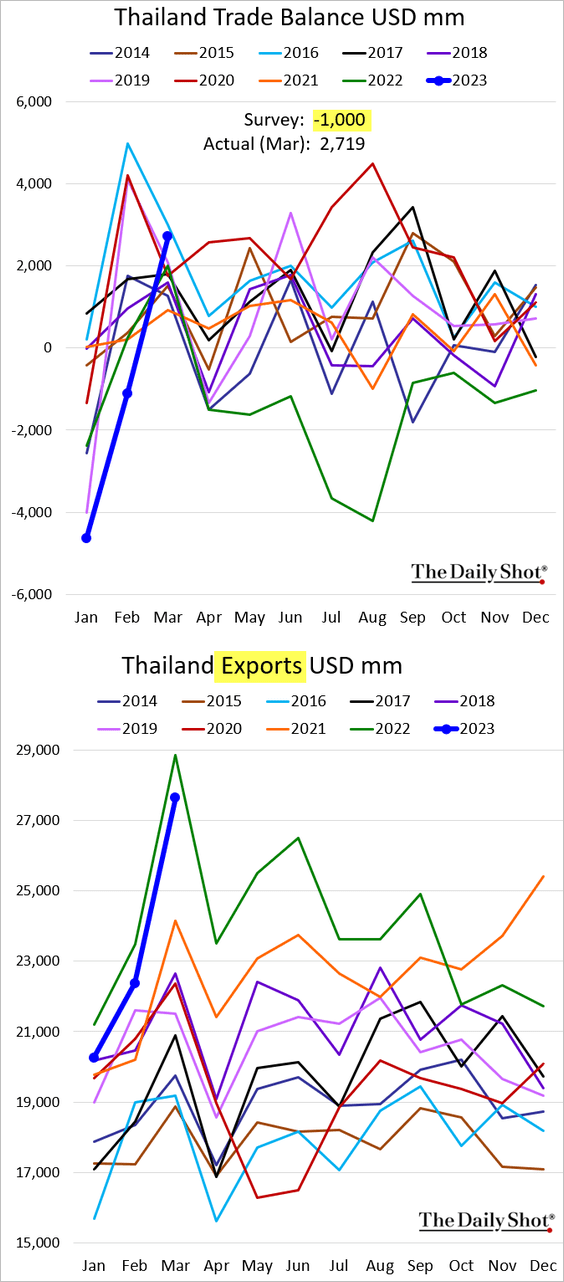
4. Thailand’s trade balance unexpectedly swung into surplus, boosted by stronger-than-expected exports.
Back to Index
Cryptocurrency
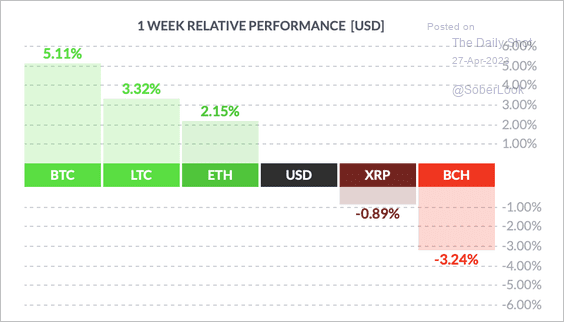
1. So far, it has been a mixed week for cryptos with bitcoin outperforming.
 Source: FinViz
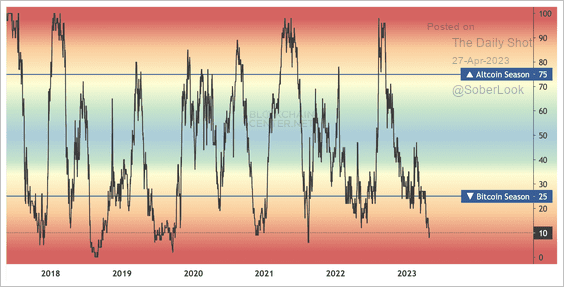
2. Only 10% of altcoins have outperformed bitcoin over the past quarter – the lowest since August 2021.
 Source: Blockchain Center
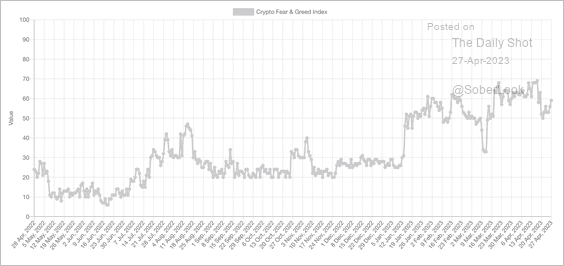
3. The Crypto Fear & Greed Index remains in “greed” territory.
 Source: Alternative.me
4. Bitcoin’s liquidity tapers off during the weekend.
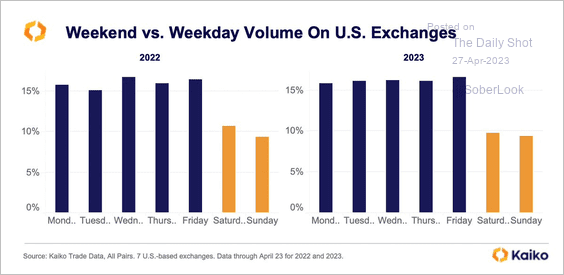 Source: @KaikoData
5. Bitcoin’s correlation with gold reached the highest level in almost two years.
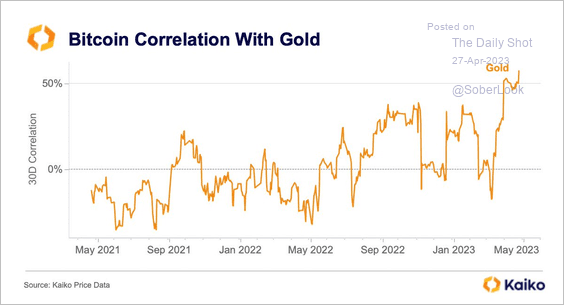 Source: @KaikoData
6. Bitcoin transactions per second remain below the 2018 highs (much slower than other electronic payment systems).
![]() Source: BCA Research
Source: BCA Research
Back to Index
Commodities
1. This scatterplot shows gold demand vs. price.
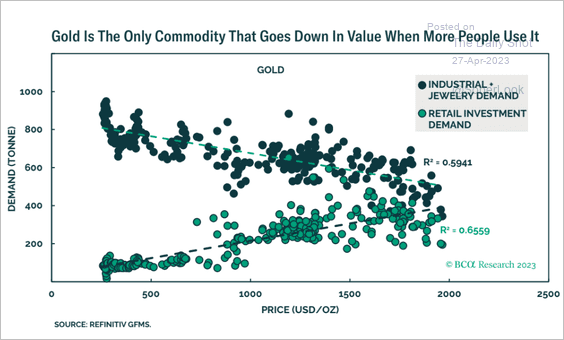 Source: BCA Research
Gold ETF flows haven’t kept up with the latest gold rally.
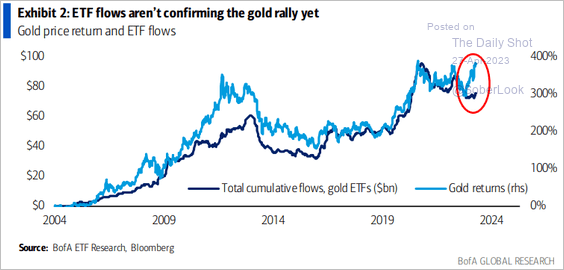 Source: BofA Global Research; @MikeZaccardi
——————–
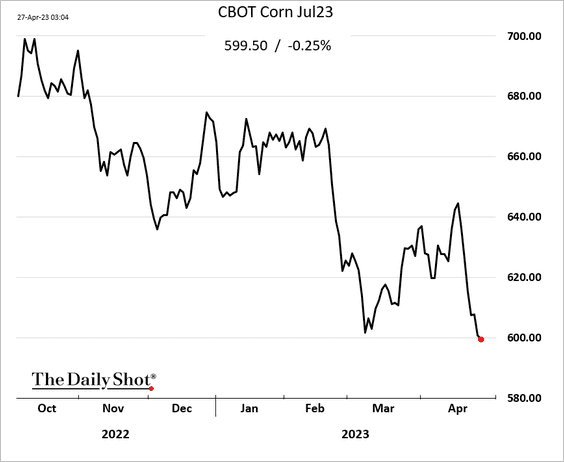
2. CBOT corn futures are under pressure after China canceled some purchases of US supplies.
Back to Index
Energy
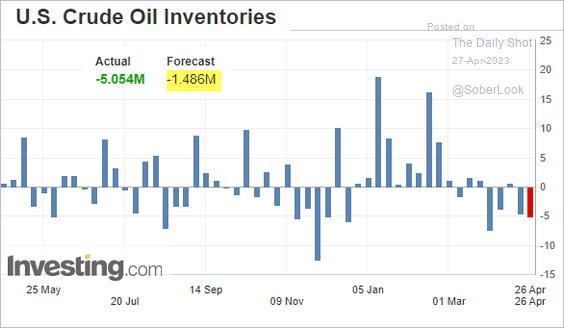
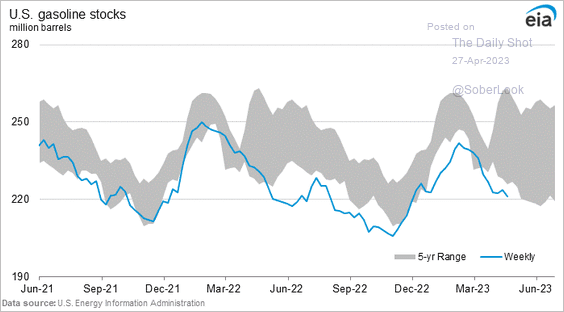
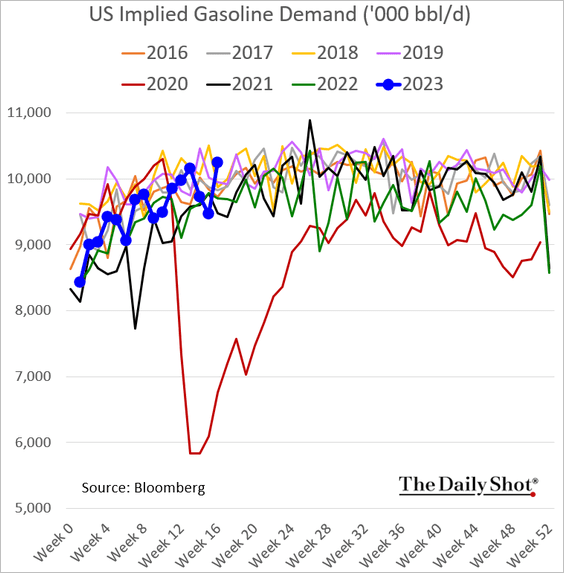
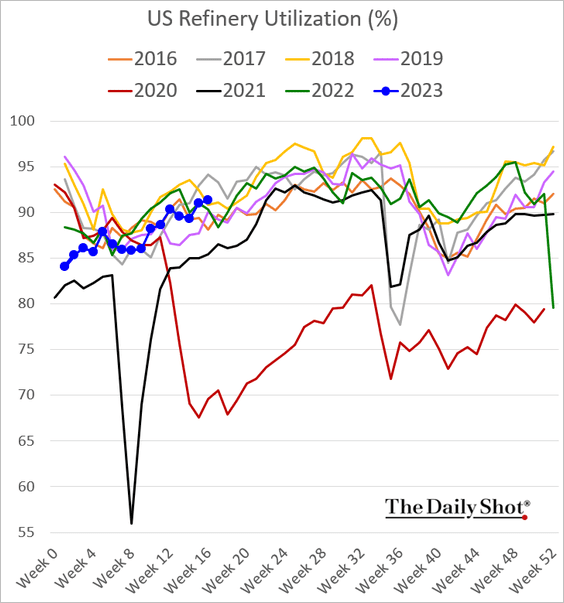
1. The US Department of Energy’s inventory report was bullish.
• Oil stockpile weekly changes …
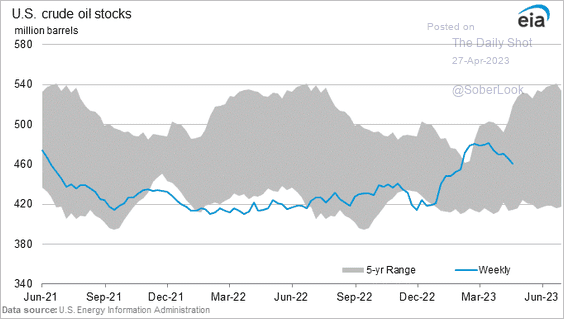
… and level:
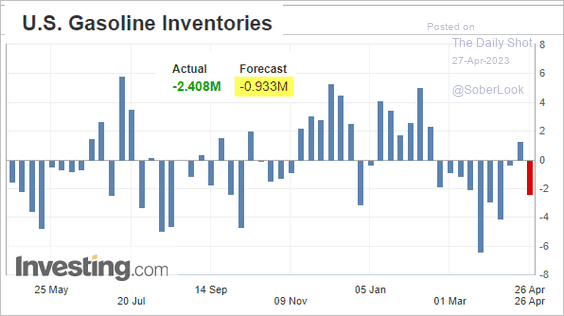
• Gasoline weekly changes and levels:
• Gasoline demand rebounded.
• Refinery utilization has been strengthening.
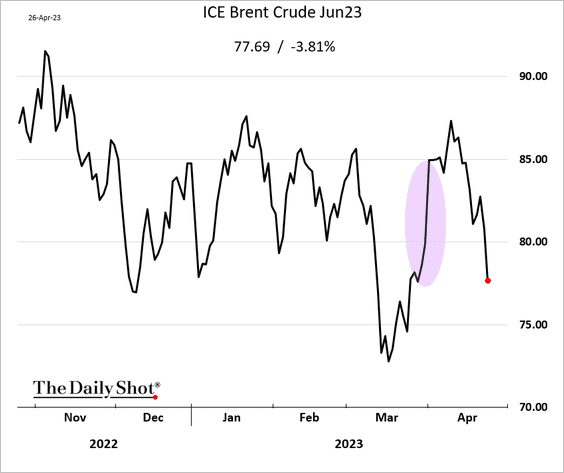
2. However, crude oil has reversed all of the gains from OPEC’s surprise production cut amid concerns about demand.
3. Weak demand has been a drag on oil prices over the past few months.
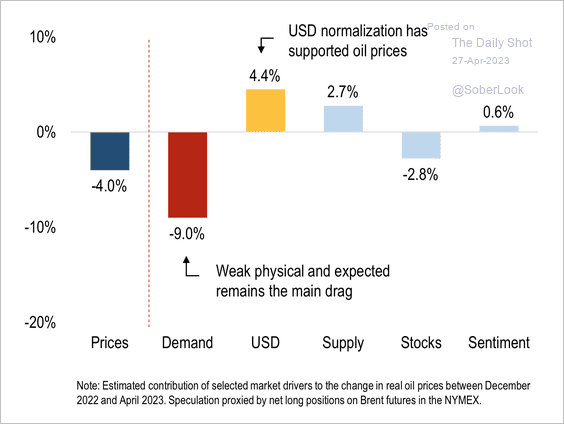 Source: Numera Analytics (@NumeraAnalytics)
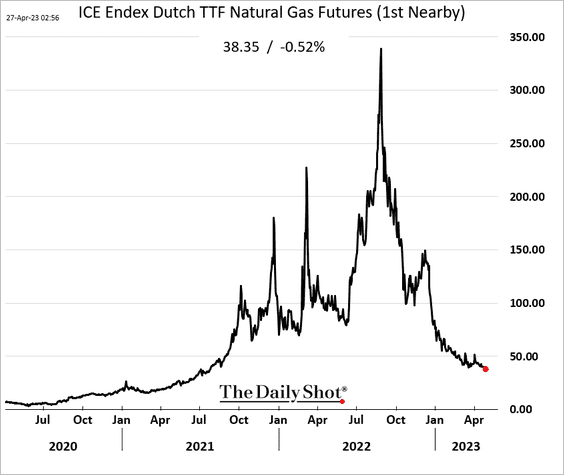
4. The decline in European natural gas prices has been remarkable.
Back to Index
Equities
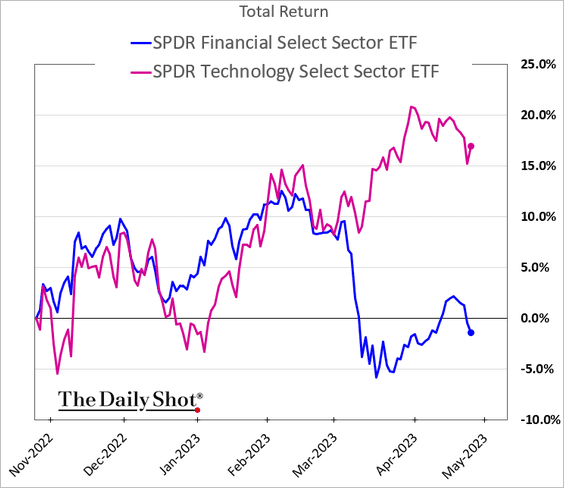
1. The market remains anxious about US regional banks.

On the other hand, tech mega-cap earnings have been better than expected.
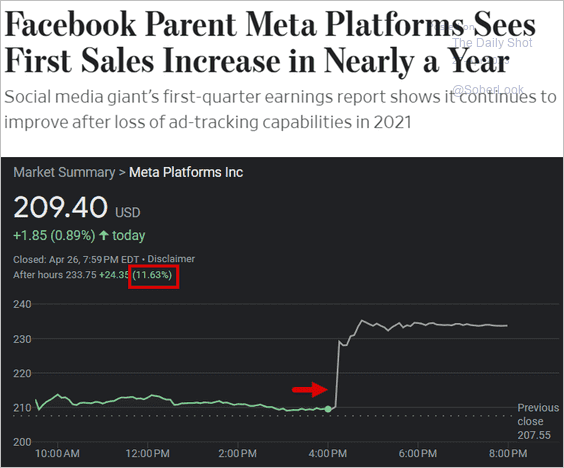 Source: @WSJ Read full article
The tech/financials performance gap has been massive.
——————–
2. Here is an updated year-to-date performance attribution chart.
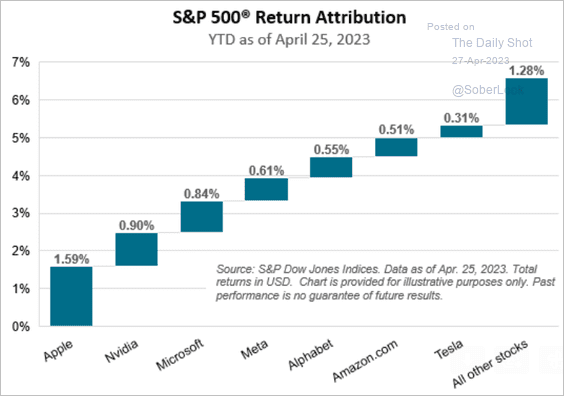 Source: S&P Dow Jones Indices
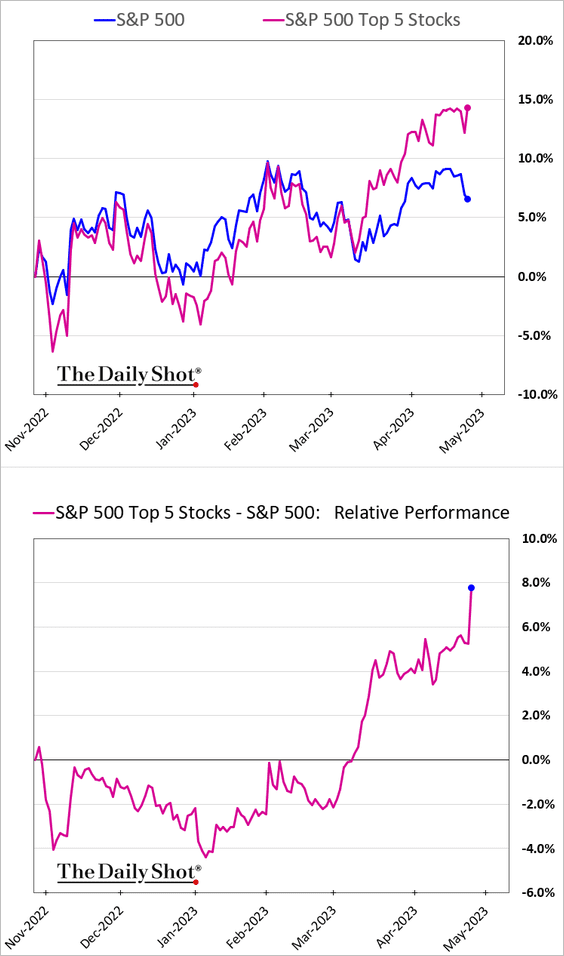
This chart shows the outperformance of the top five stocks in the S&P 500.
——————–
3. US market breadth continues to weaken, evidenced by the decline in microcap stocks.
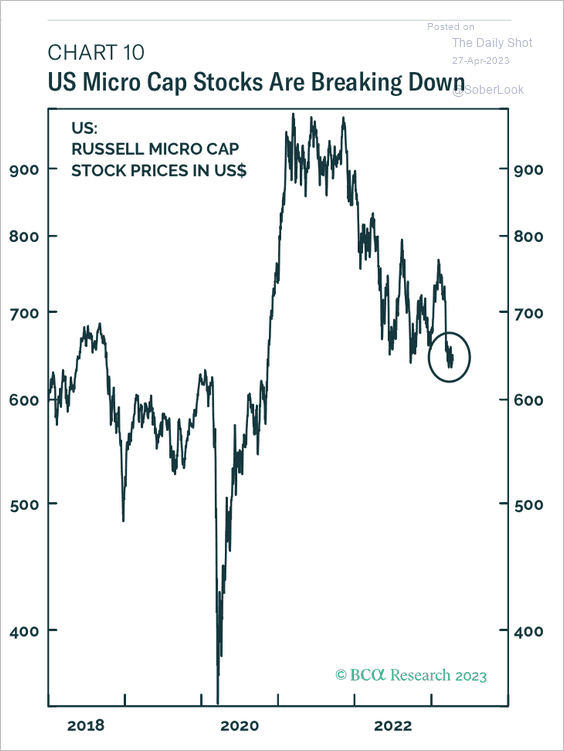 Source: BCA Research
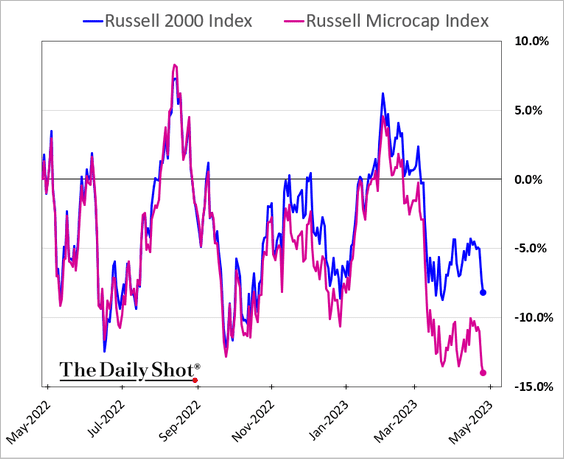
Here is the relative performance of microcaps relative to small caps.
The Nasdaq Composite market breadth has deteriorated sharply.
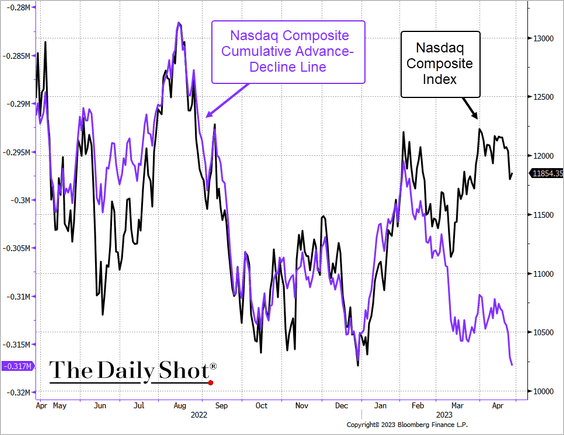 Source: @TheTerminal, Bloomberg Finance L.P.
——————–
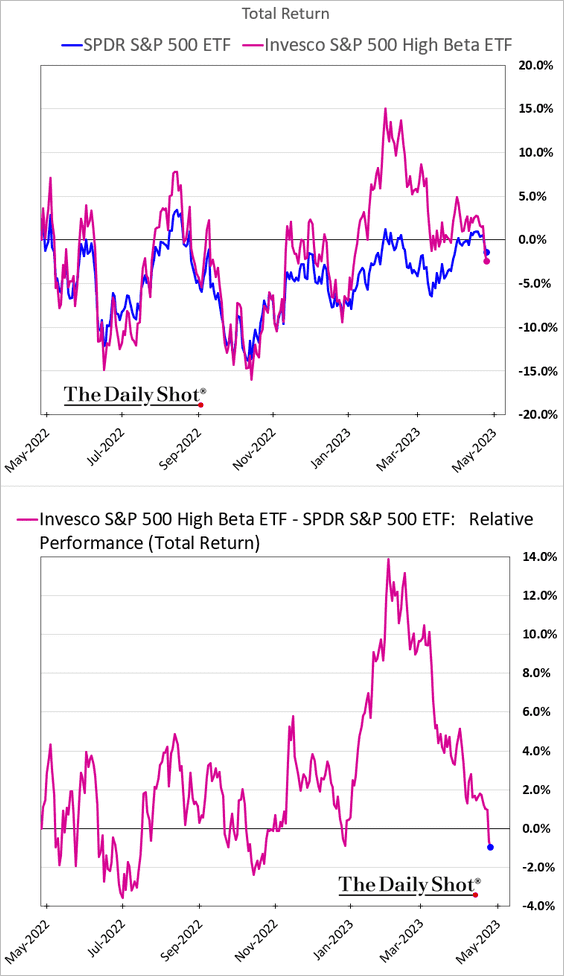
4. High-beta stocks have given up their recent outperformance.
5. Tech valuations look rich amid elevated real rates.
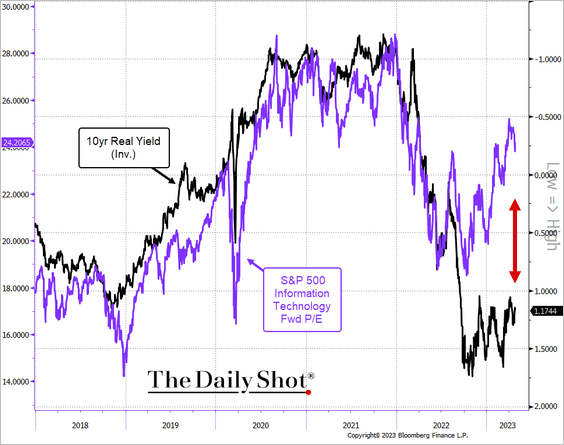 Source: @TheTerminal, Bloomberg Finance L.P.; h/t @chartrdaily. @equitorr, @michaelaarouet
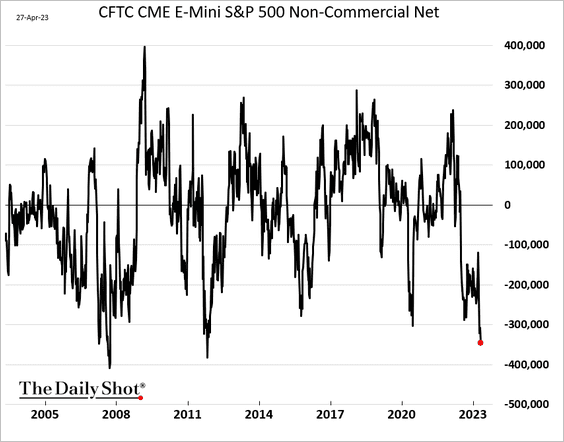
6. S&P 500 futures positioning is the most bearish in over a decade.
7. CTAs chased the recent S&P 500 rally higher.
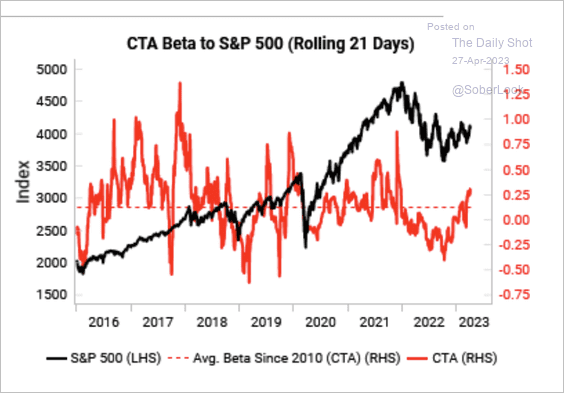 Source: Variant Perception
Back to Index
Credit
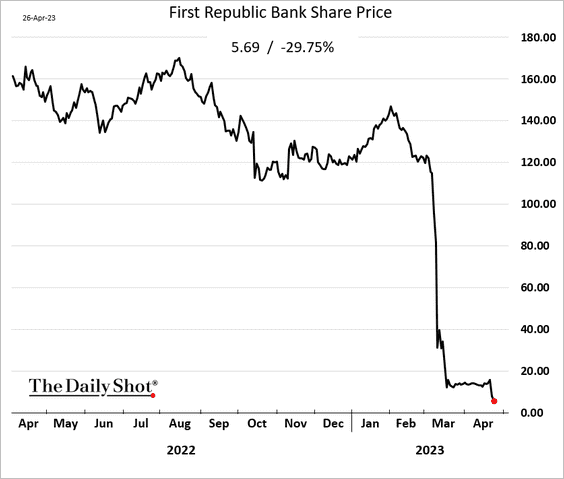
1. It’s hard to see an immediate solution to First Republic’s challenges.
 Source: @jennysurane, @hannahlevitt, @KatLeighDoherty, @business Read full article
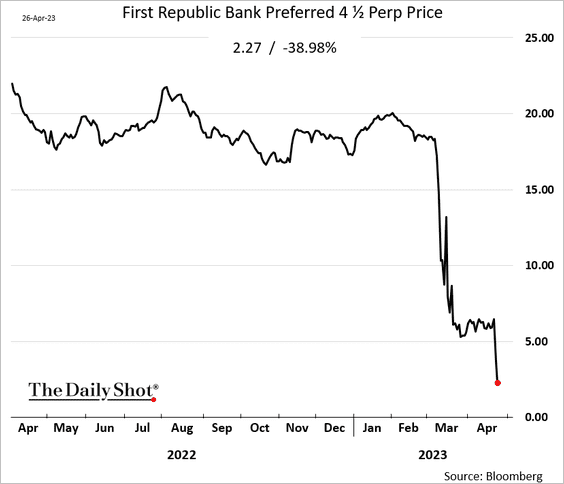
Meanwhile, the market punishment continues.
• The stock price:
• Implied vol:
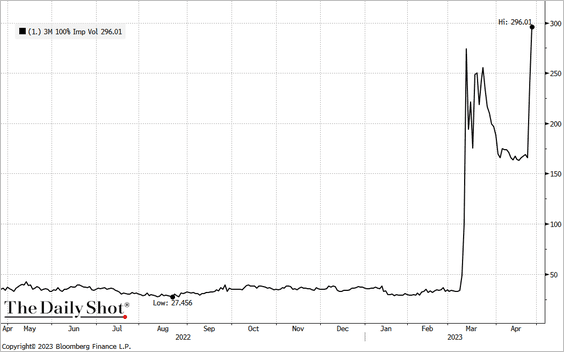 Source: @TheTerminal, Bloomberg Finance L.P.
• Preferred securities:
• Bonds:
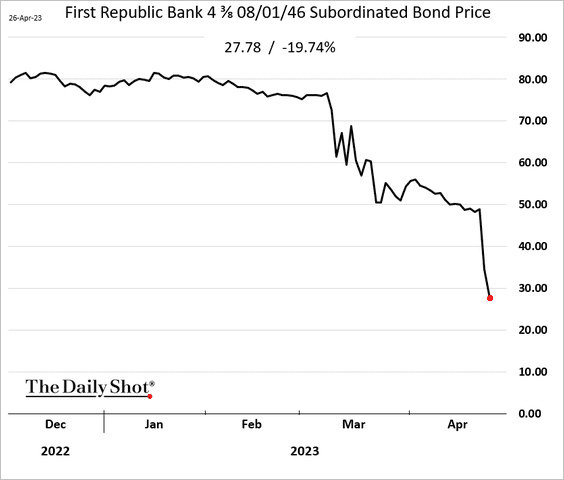 Source: Bloomberg
——————–
2. Here is a look at historical certificate of deposit (CD) rates.
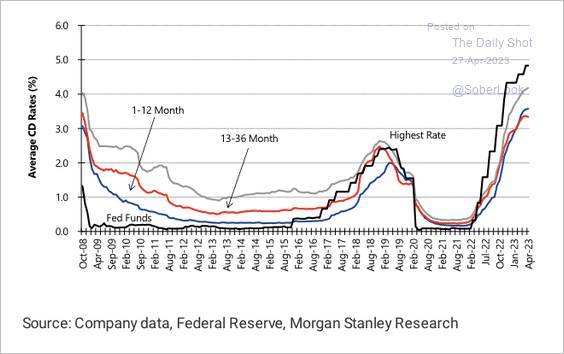 Source: Morgan Stanley Research
The highest/lowest CD rates show a massive divergence in funding costs.
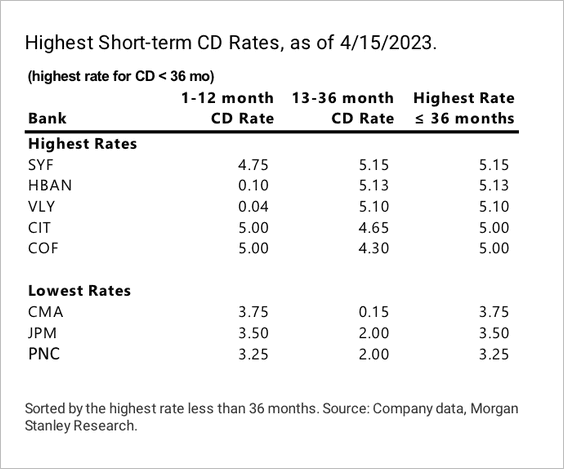 Source: Morgan Stanley Research
Back to Index
Rates
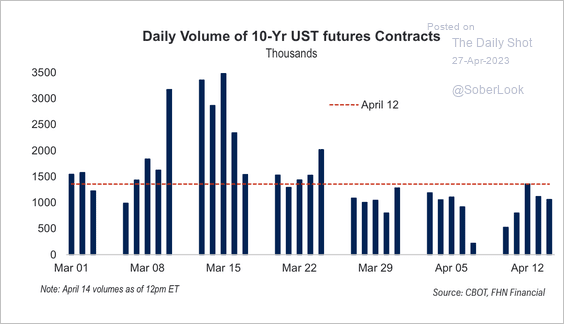
Trading volume declined sharply in 10-year Treasury futures. The volume peak in mid-March occurred during the regional banking crisis. (2 charts)
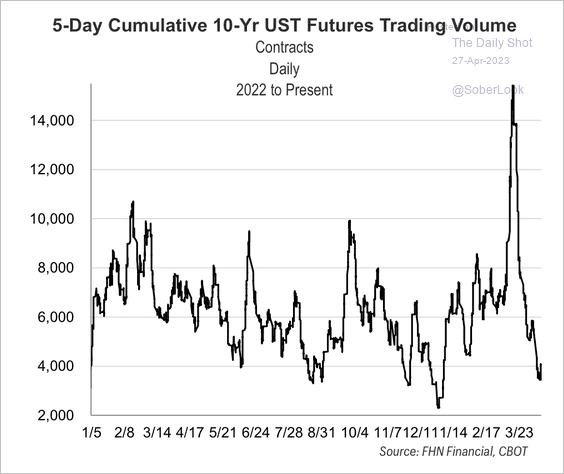 Source: FHN Financial
 Source: FHN Financial
Back to Index
Global Developments
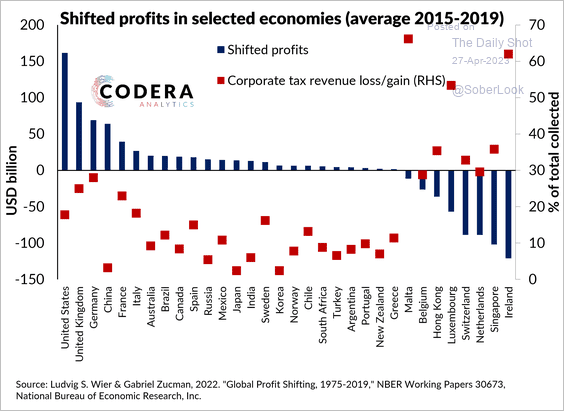
1. Almost 40% of global multinational profits were shifted to tax havens, according to estimates from Wier and Zucman (2022). They estimate that this is the equivalent of around 10% of global corporate tax receipts. Absolute tax losses have been largest in the US and UK (and highest relative to the total tax take in Germany and France). At the same time, Ireland and Singapore have been the world’s largest recipients of shifted corporate profits between 2015 and 2019.
 Source: Codera Analytics Read full article
2. Freight activity has been soft.
 Source: Oxford Economics
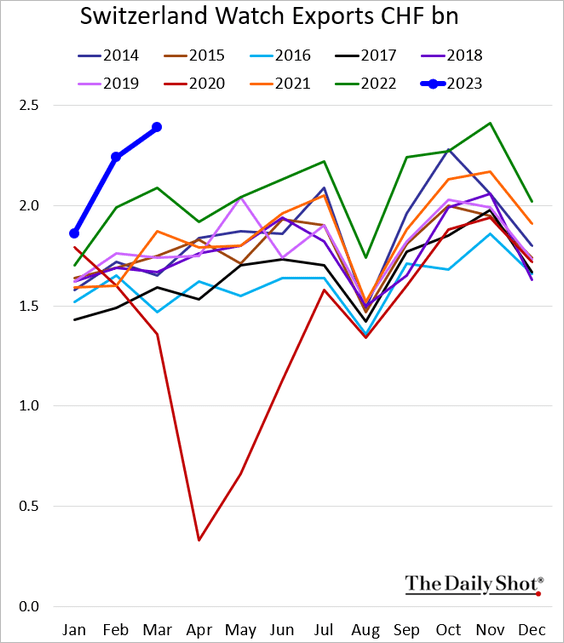
3. Swiss watch exports point to robust demand for luxury products.
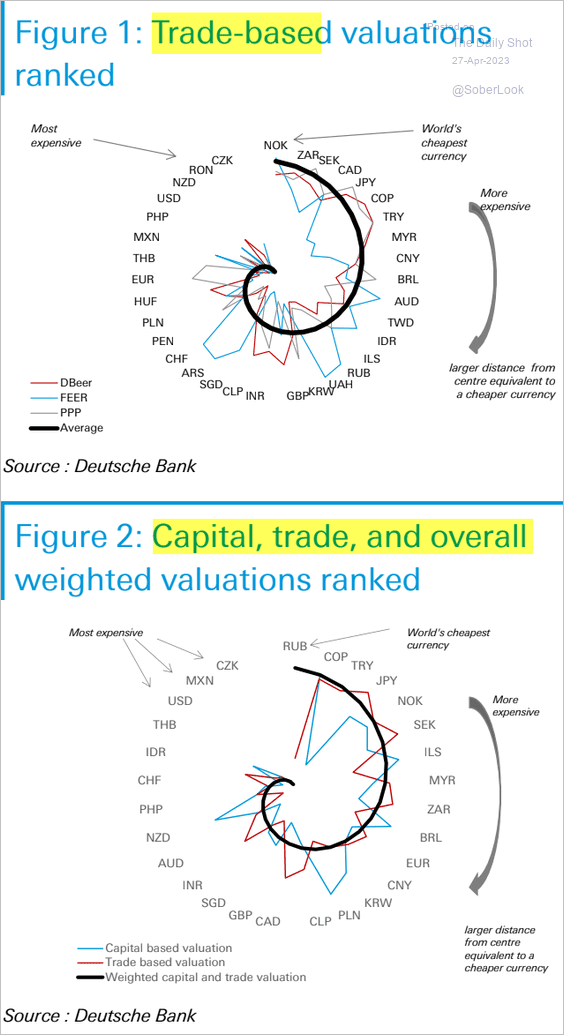
4. This graphic from Deutsche Bank shows relative currency valuations.
 Source: Deutsche Bank Research
——————–
Food for Thought
1. Iran’s oil production and fiscal balance:
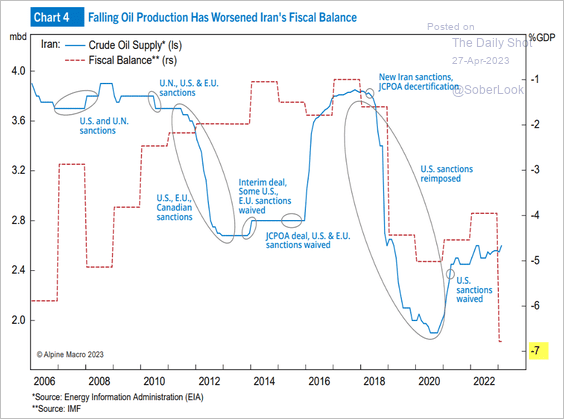 Source: Alpine Macro
2. Clean energy tech manufacturing:
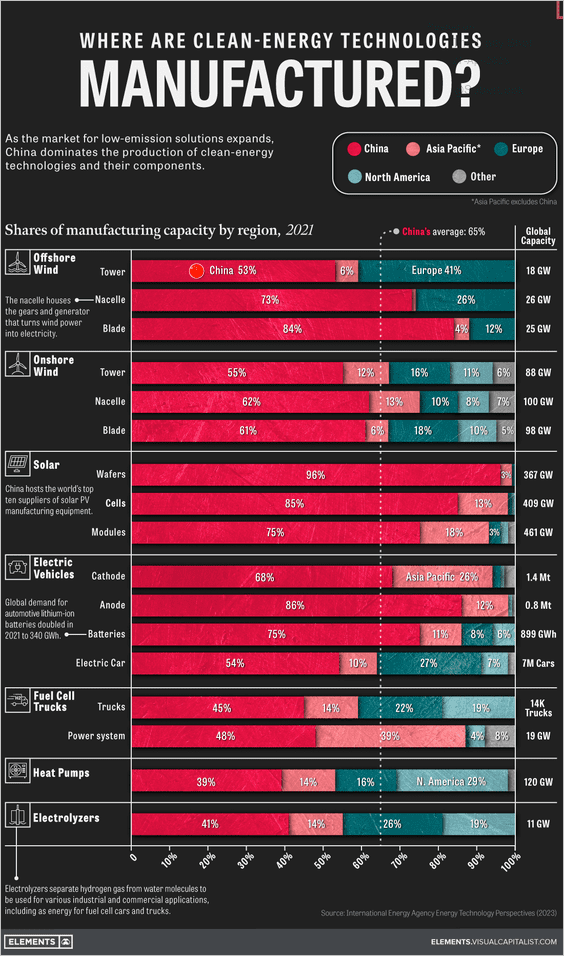 Source: Visual Capitalist Read full article
3. Science publications:
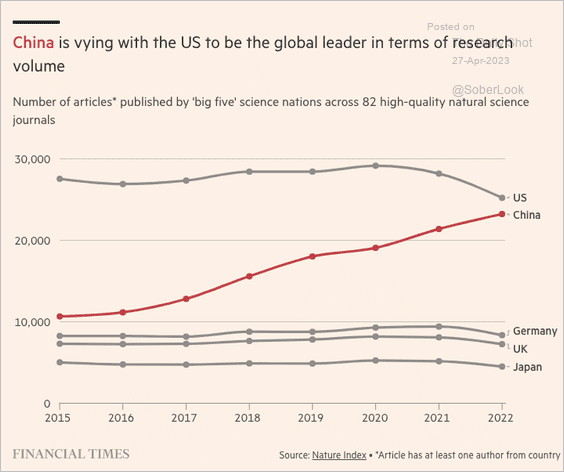 Source: @financialtimes Read full article
4. Deaths related to “The Troubles” in Northern Ireland:
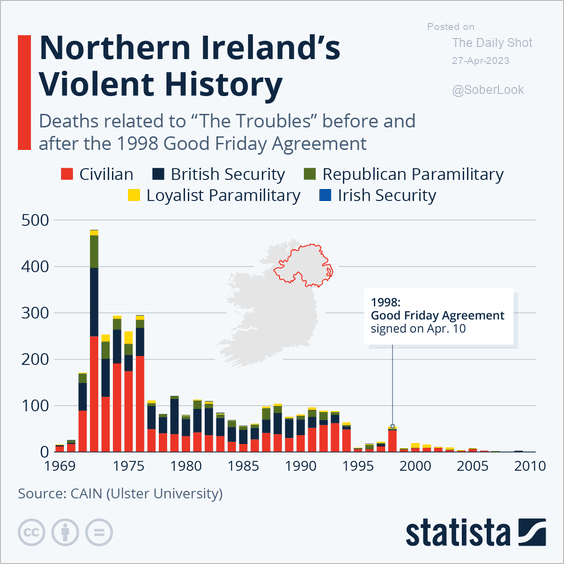 Source: Statista
5. Anxiety and depression in the US:
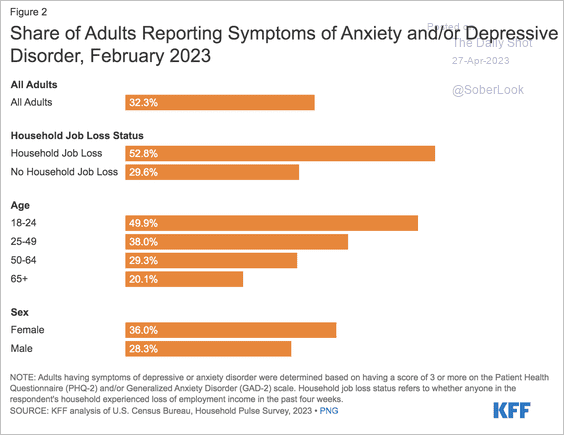 Source: KFF Read full article
6. Density of medical doctors:
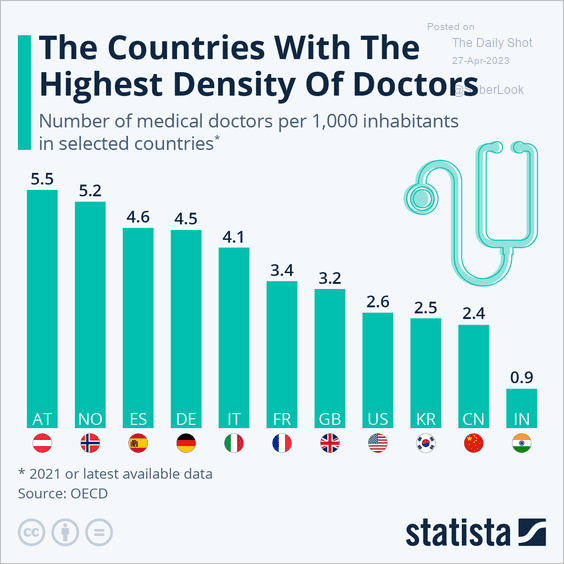 Source: Statista
7. The US marriage rate:
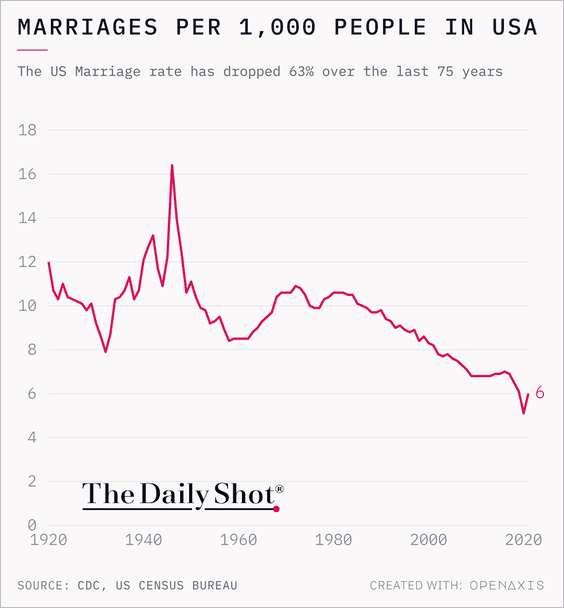 Source: @TheDailyShot
8. Who wants to have a good time?
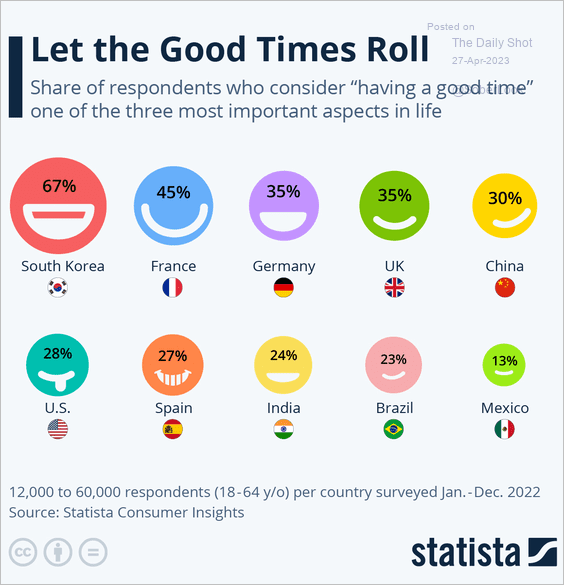 Source: Statista
——————–
Back to Index