
The Daily Shot: 04-May-23
• The United States
• Canada
• The Eurozone
• Europe
• Asia-Pacific
• China
• Emerging Markets
• Commodities
• Energy
• Equities
• Credit
• Rates
• Food for Thought
The United States
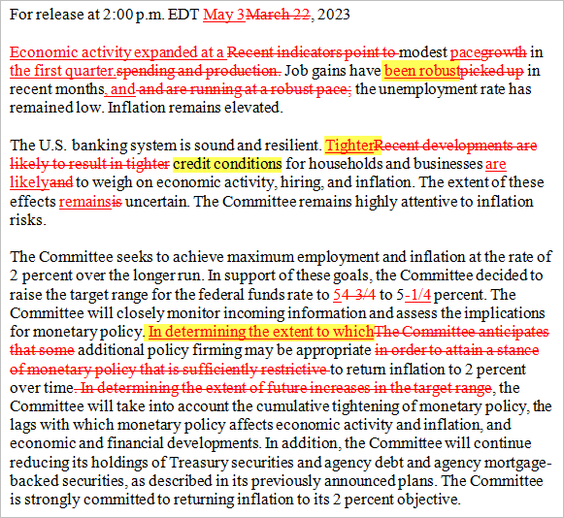
1. The Fed delivered another 25 bps rate hike but hinted at a pause.
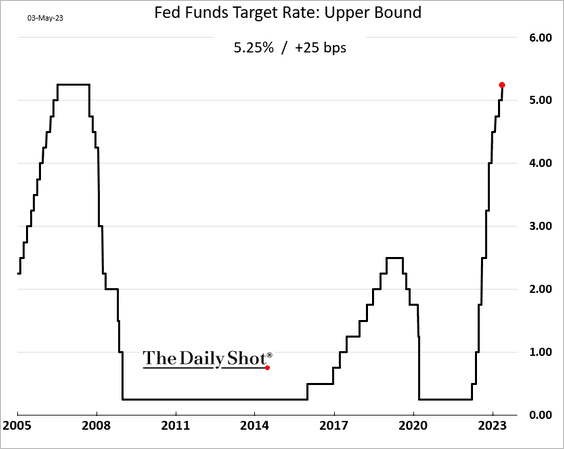
The FOMC pointed to “robust” job gains but acknowledged tightening credit conditions.
 Source: @NickTimiraos
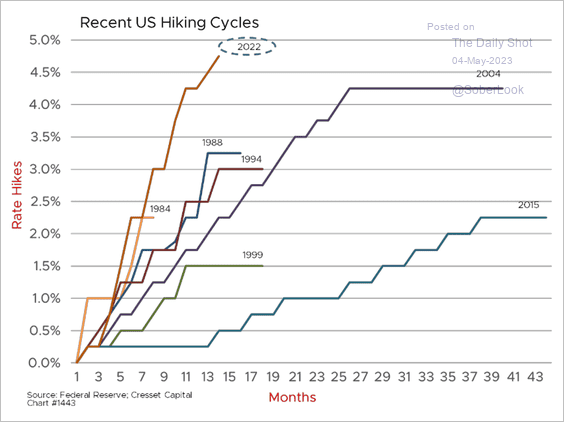
• Here is the current tightening cycle compared to some previous ones.
 Source: Jack Ablin, Cresset Wealth Advisors
• The market expects no more rate hikes in this cycle.
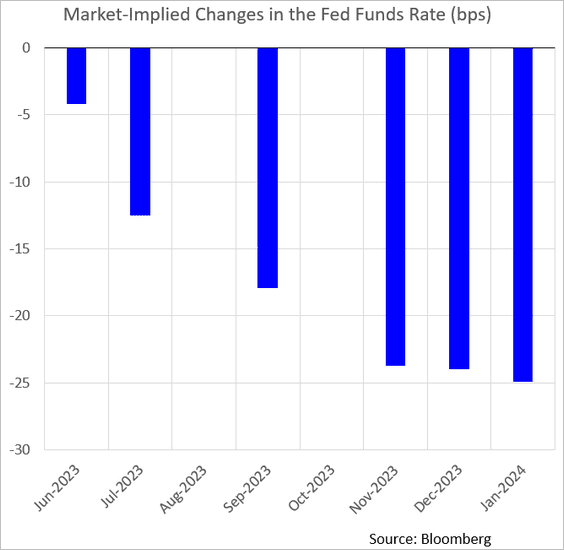
Here is the futures-implied fed funds rate trajectory, with substantial rate cuts priced in.
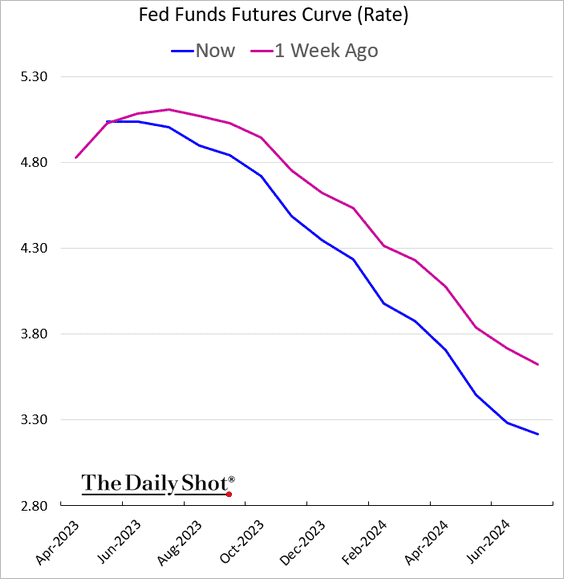
The market is anticipating approximately 180 basis points of rate reductions from the Federal Reserve in the second half of this year and the first half of next year.
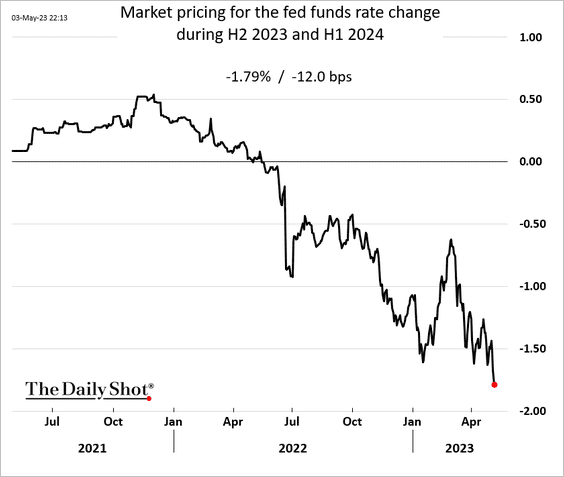
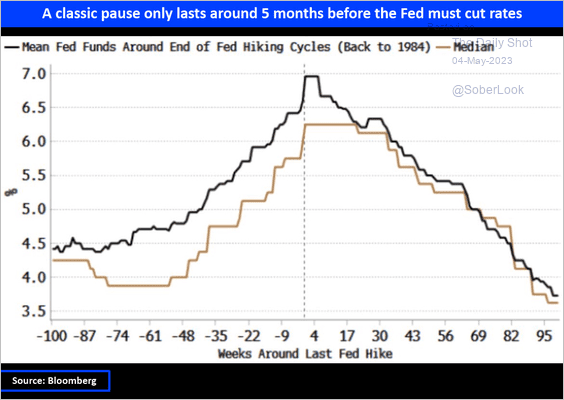
• How long will the pause last before the Fed cuts begin?
 Source: @MacroAlf
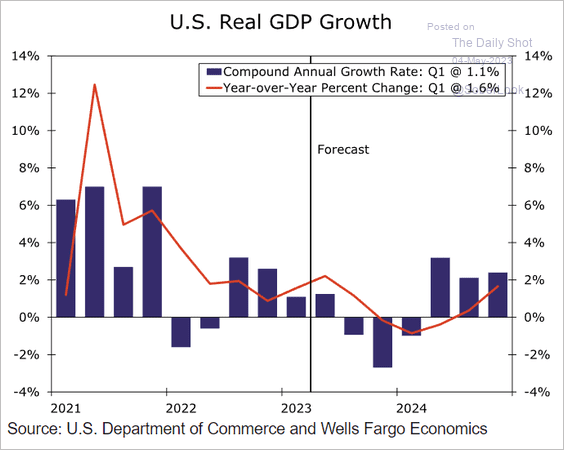
Here is Wells Fargo’s forecast.
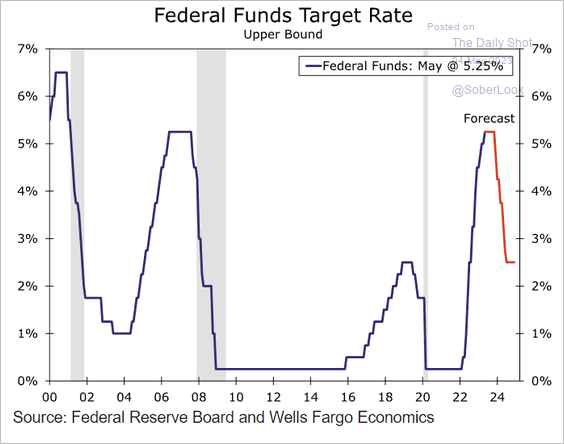 Source: Wells Fargo Securities
The firm sees three consecutive quarters of GDP contraction starting in the second half of this year, which will force the Fed to cut rates.
 Source: Wells Fargo Securities
• However, even in an economic downturn, we should expect less support from the Fed than in the past.
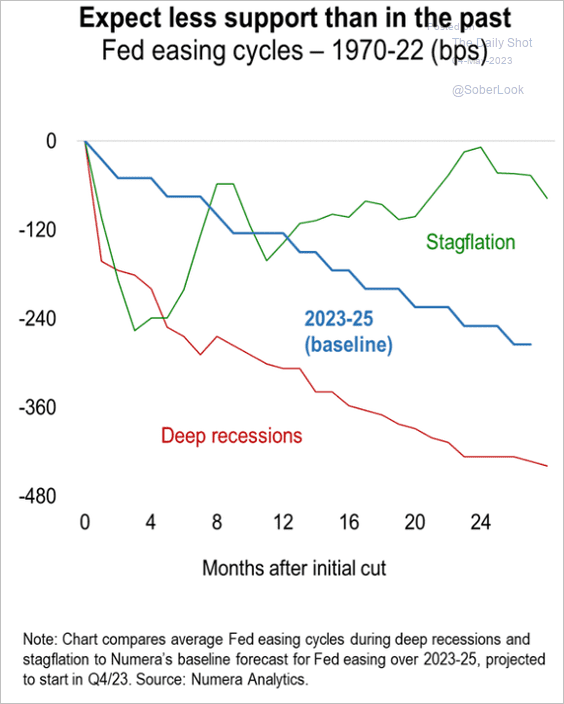 Source: Numera Analytics (@NumeraAnalytics)
• The real fed funds rate is now positive.
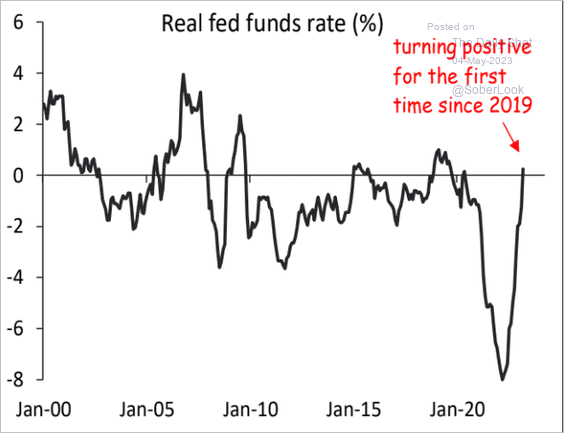 Source: Piper Sandler
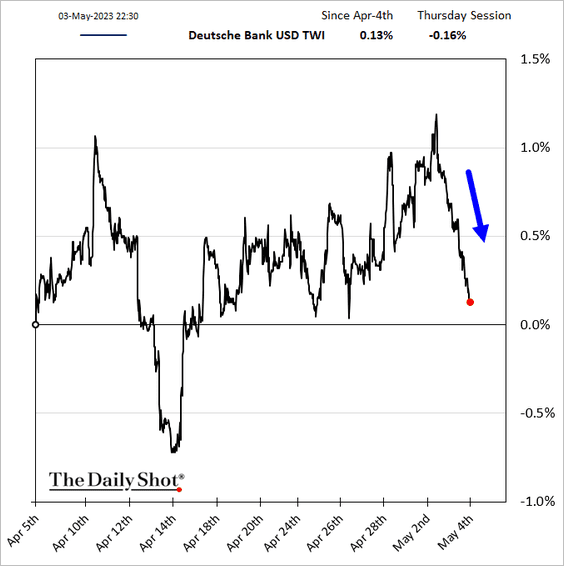
2. Treasury yields declined further due to the Fed’s expected pause as well as persistent banking jitters.
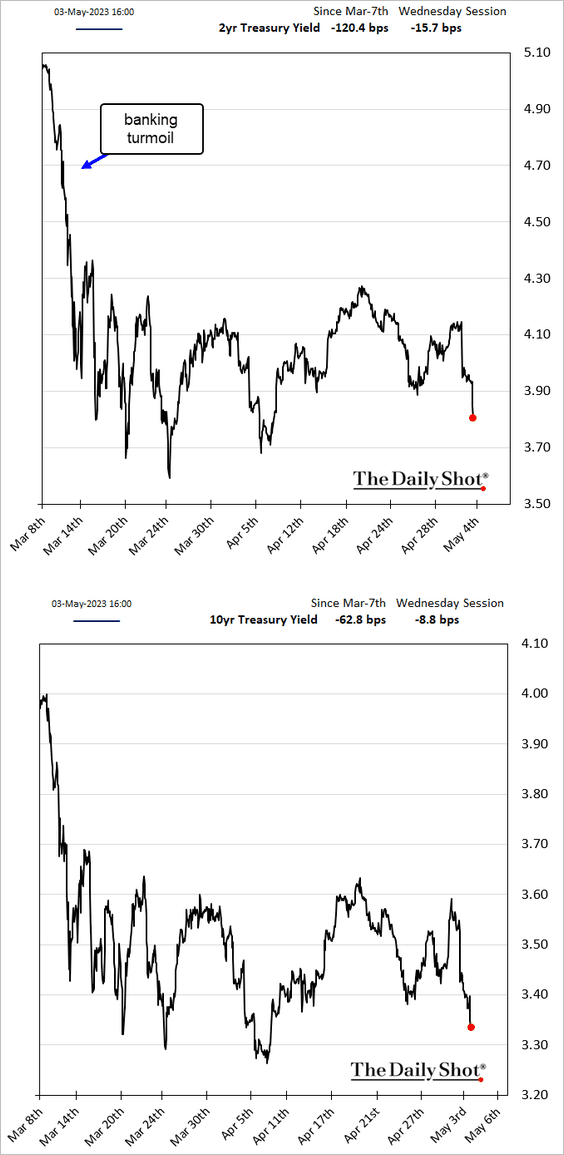
The dollar fell.
——————–
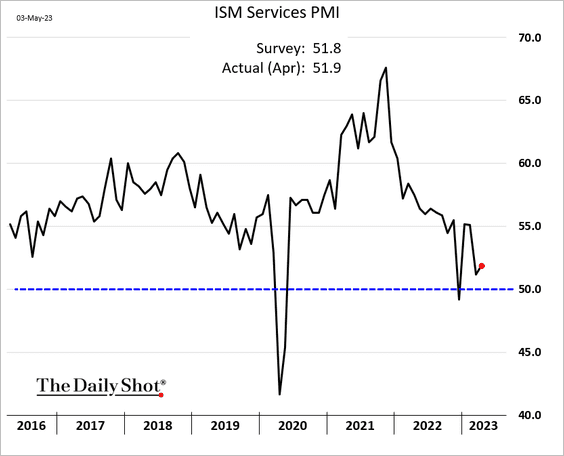
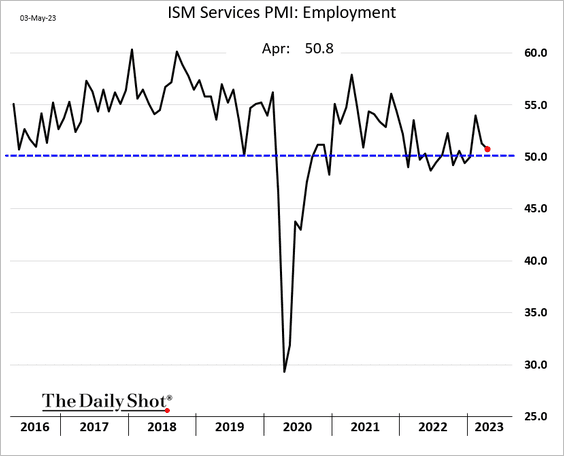
3. The ISM Services PMI report signaled modest growth in April.
• Here are the contributions.
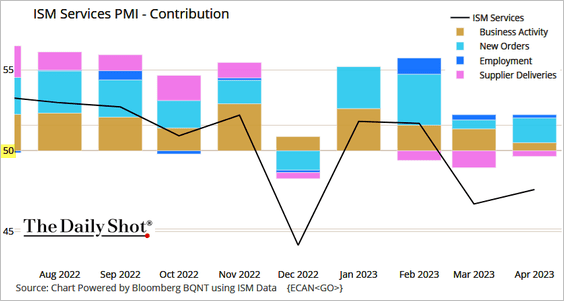 Source: @TheTerminal, Bloomberg Finance L.P.
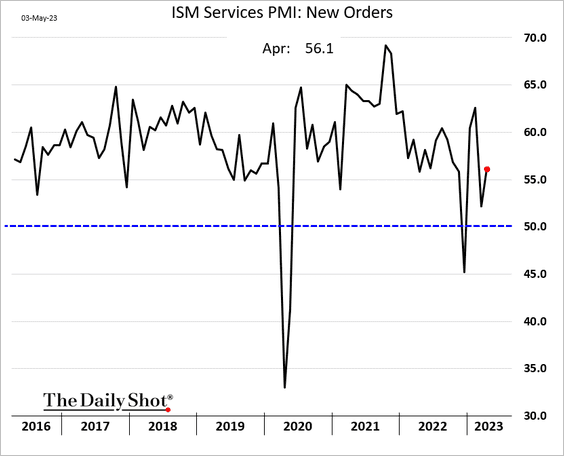
• Demad improved.
• Hiring is slowing.
• The “prices paid” index was unchanged, …
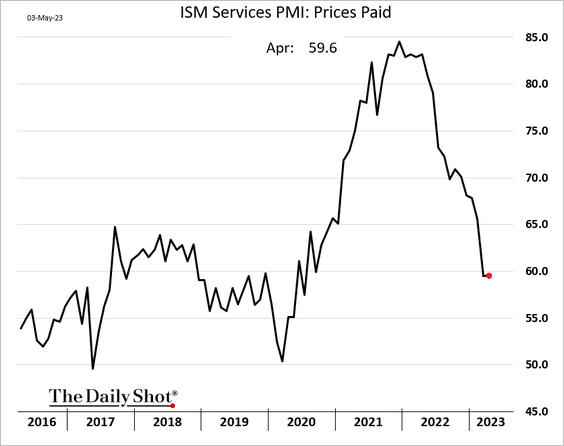
… still signaling lower inflation ahead.
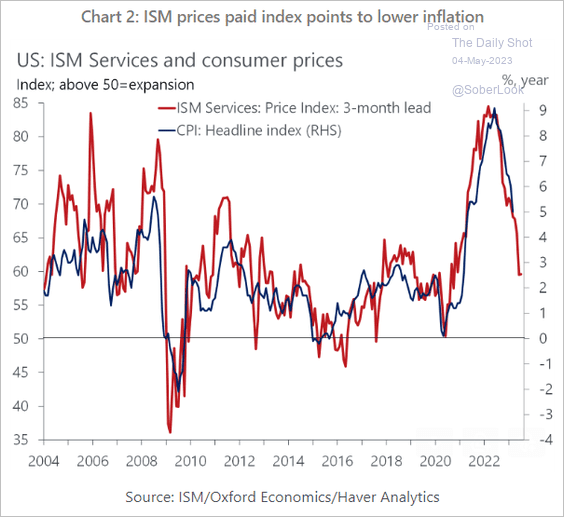 Source: Oxford Economics
——————–
4. Companies increasingly mention weak demand on earnings calls.
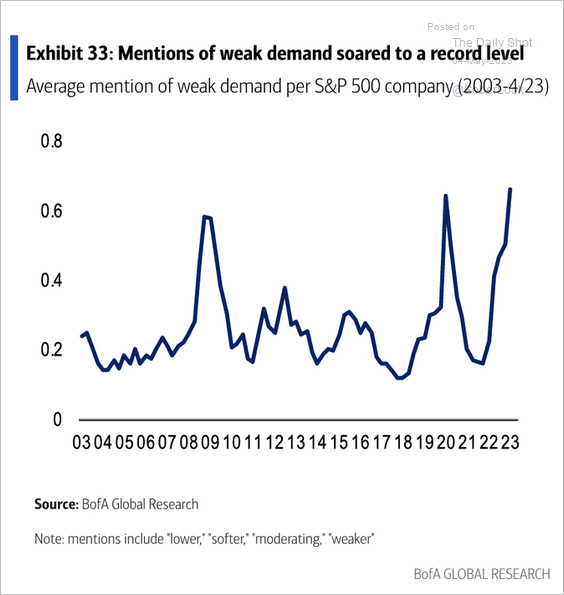 Source: BofA Global Research
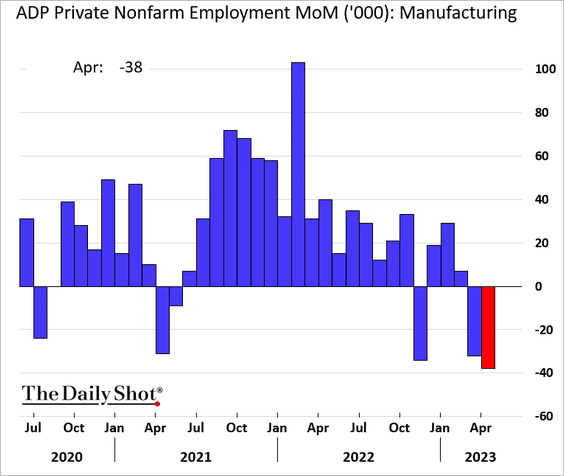
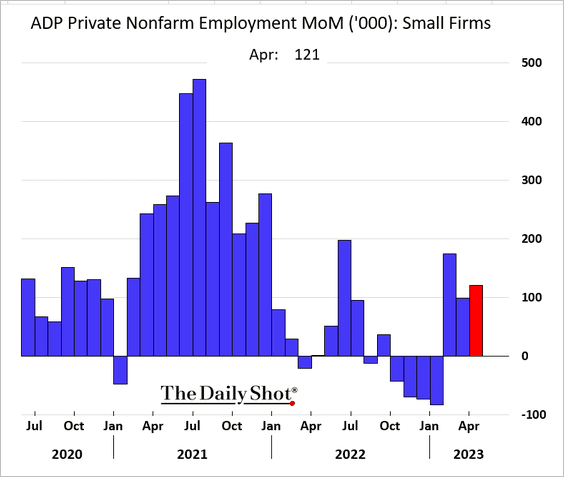
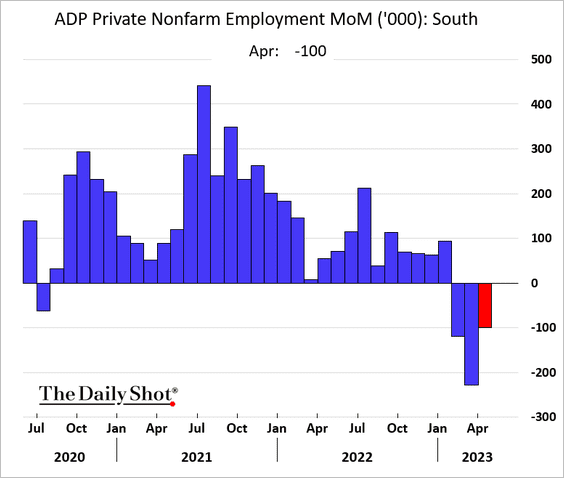
5. The April ADP private payrolls report topped expectations.
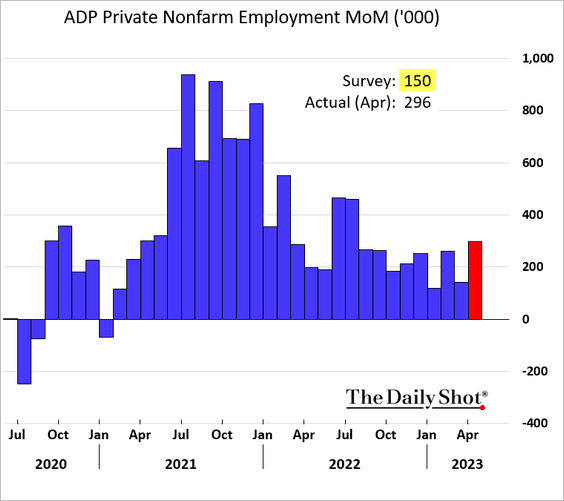
• The ADP index has not been a good predictor of the official jobs figures.
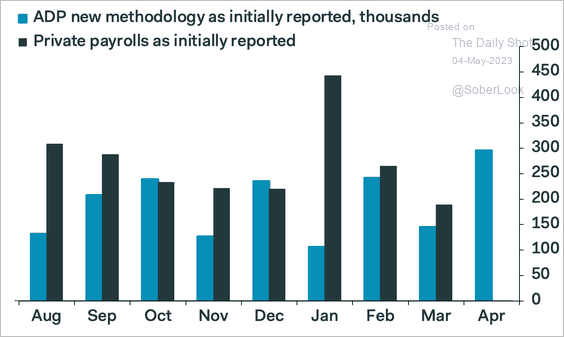 Source: Pantheon Macroeconomics
• Leaisure & Hospitality as well as Education & Health showed stong gains.
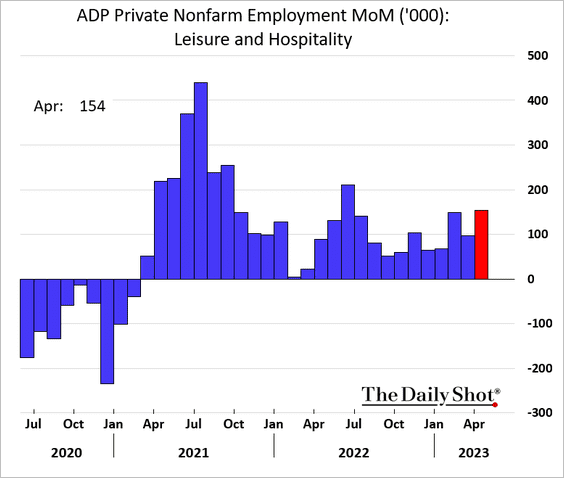
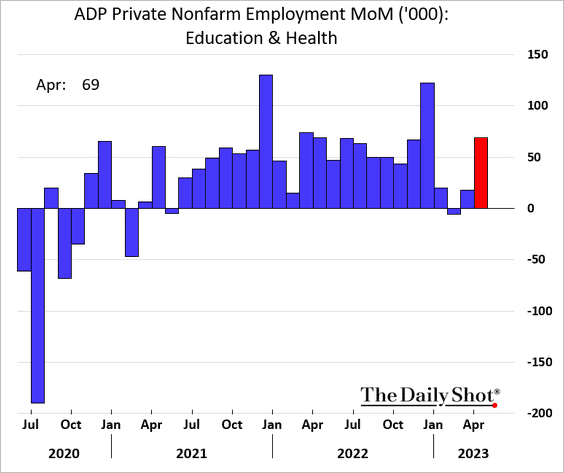
But the manufacturing sector shed jobs again.
• Small businesses are hiring.
• The South continues to show job losses.
——————–
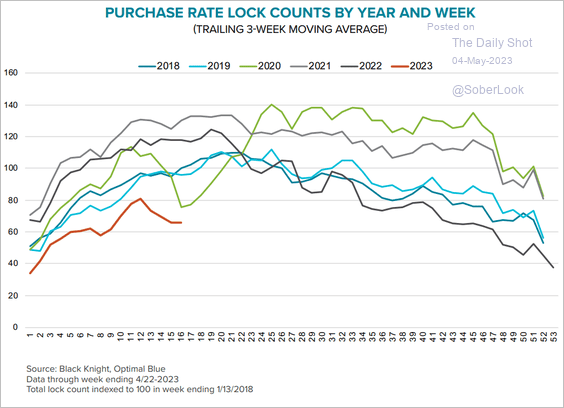
6. Mortgage applications are back in line with 2014 levels.
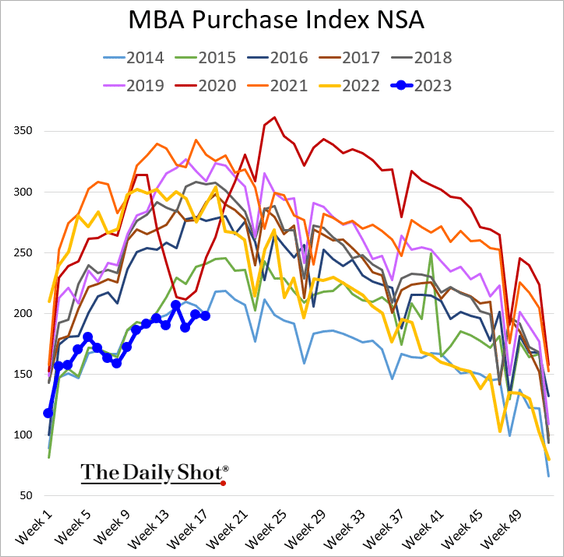
This chart shows mortgage rate-lock counts.
 Source: Black Knight
——————–
7. US direct foreign investment abroad has fully rebounded.
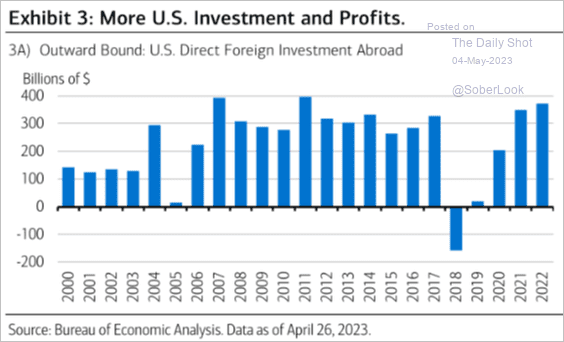 Source: Merrill Lynch
Below is the total affiliate income earned abroad.
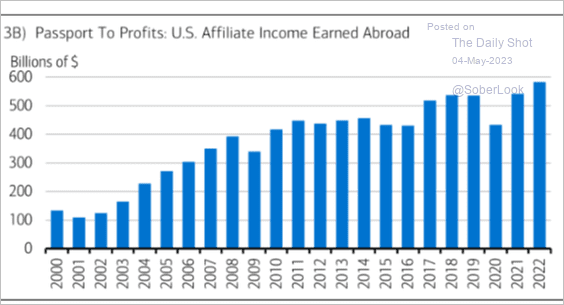 Source: Merrill Lynch
Back to Index
Canada
1. Here is a look at job vacancies in Canada. The labor market is no longer as tight as it was last year.
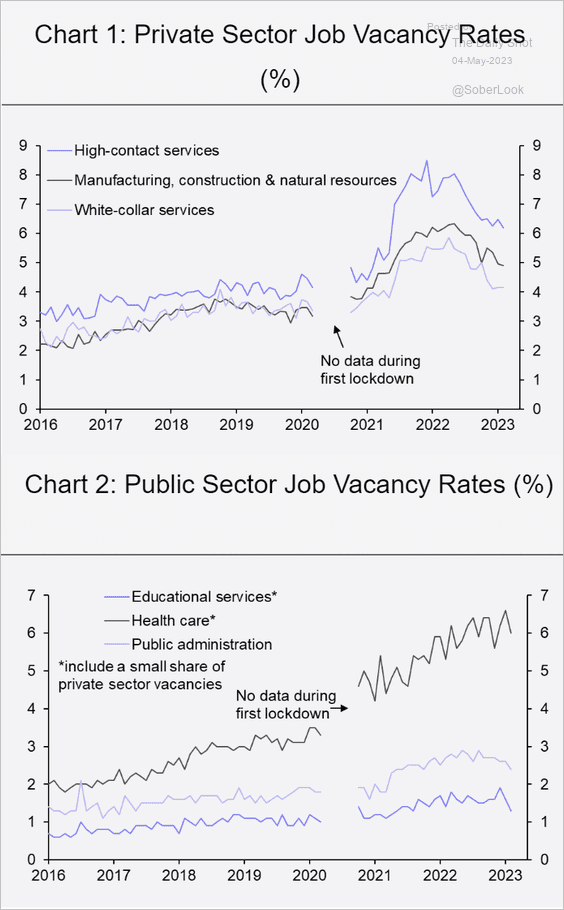 Source: Capital Economics
2. Labor force participation is running well above the levels we see in the US.
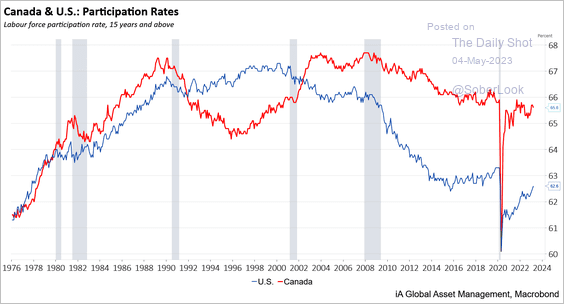 Source: Industrial Alliance Investment Management
Back to Index
The Eurozone
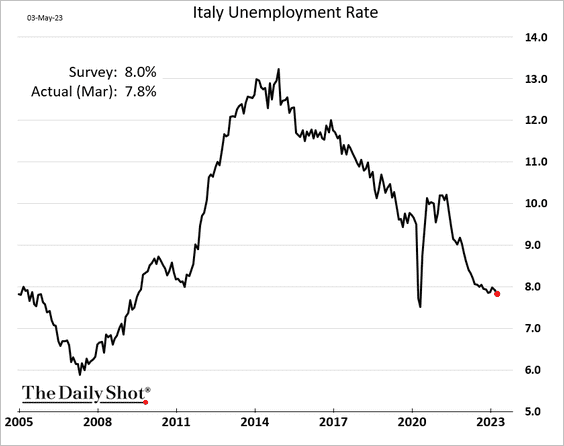
1. The euro-area unemployment rate hit a record low.
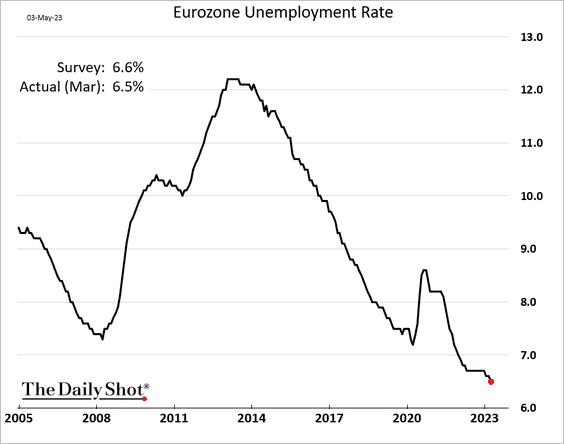
 Source: Barron’s Read full article
Italy’s unemployment rate was lower than expected in March.
——————–
2. Liquidity conditions continue to tighten, with the narrow money supply declining by most on record on a year-over-year basis.
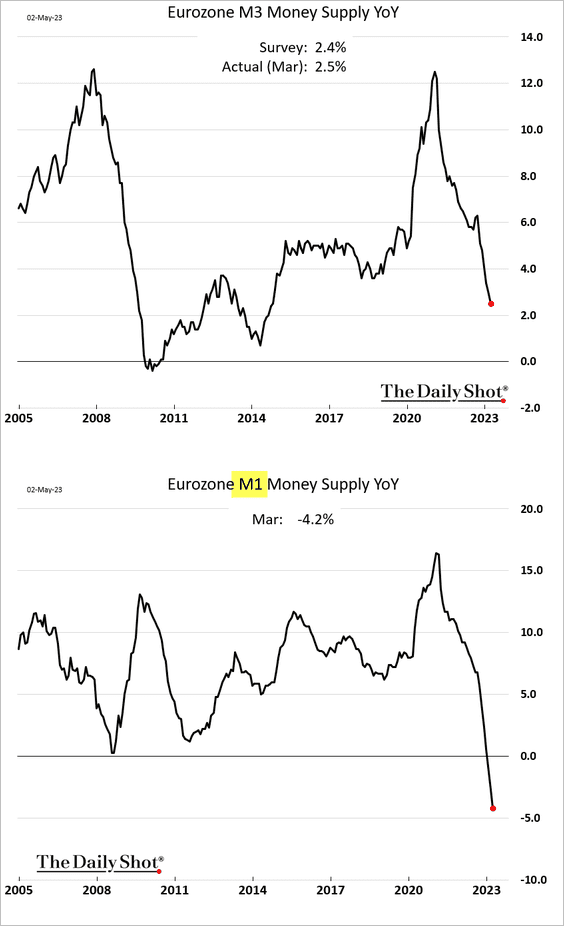
• Loan growth keeps slowing, …
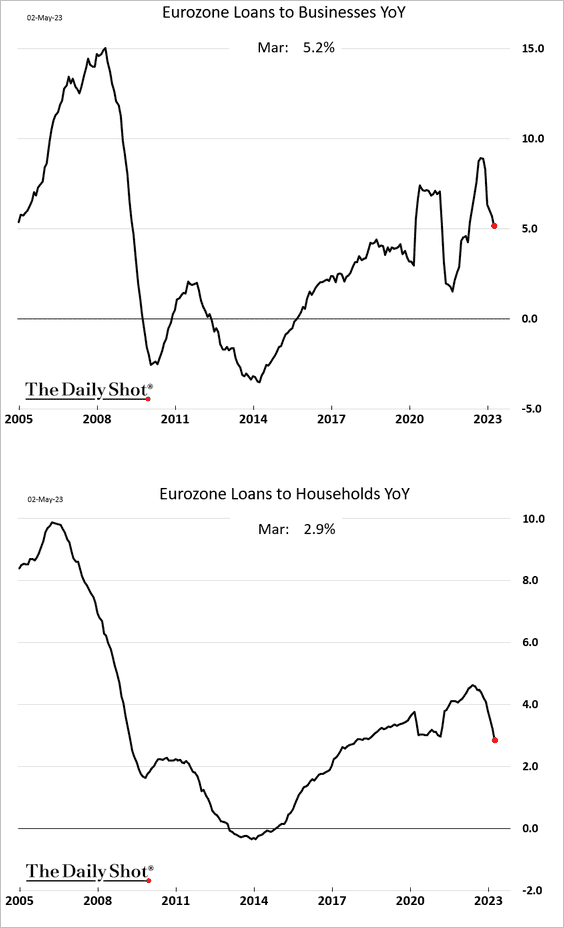
… as loan demand tanks.
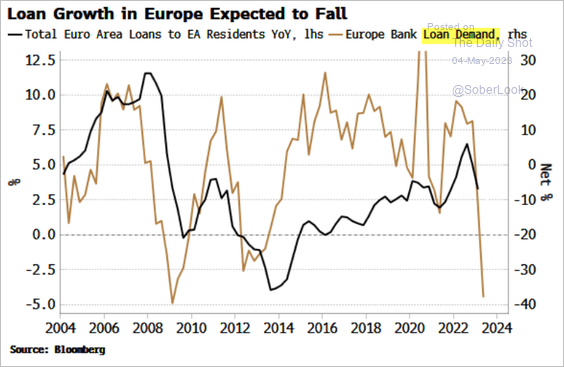 Source: Simon White, Bloomberg Markets Live Blog
• The ECB’s dilemma is that credit conditions are tightening while core inflation remains well above target.
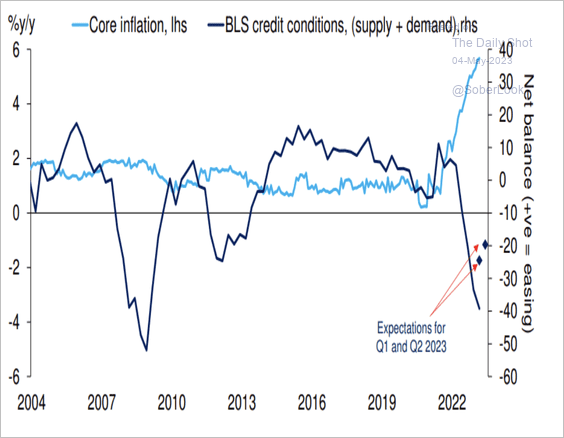 Source: Deutsche Bank Research
——————–
3. How good is the market at predicting ECB rate hikes? A twenty-five basis point hike looks baked in.
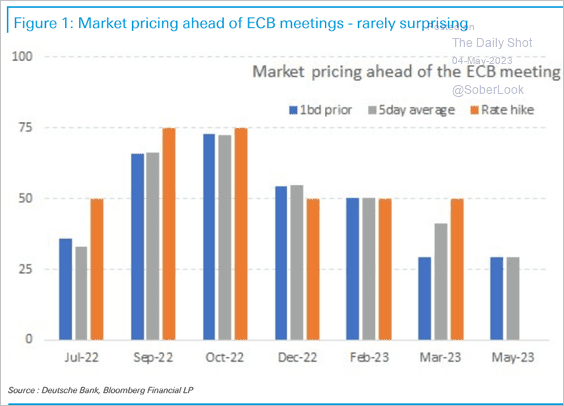 Source: Deutsche Bank Research
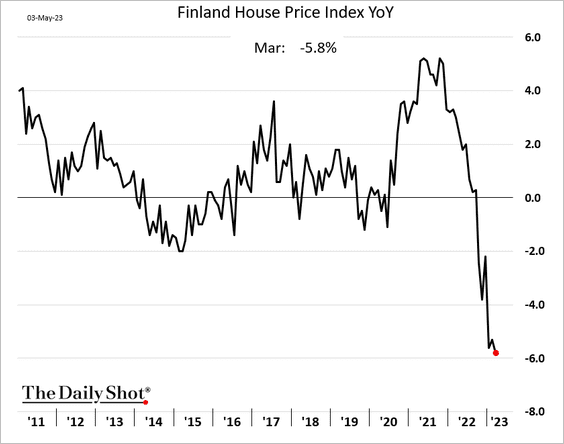
4. Finland’s housing market has been struggling.
Back to Index
Europe
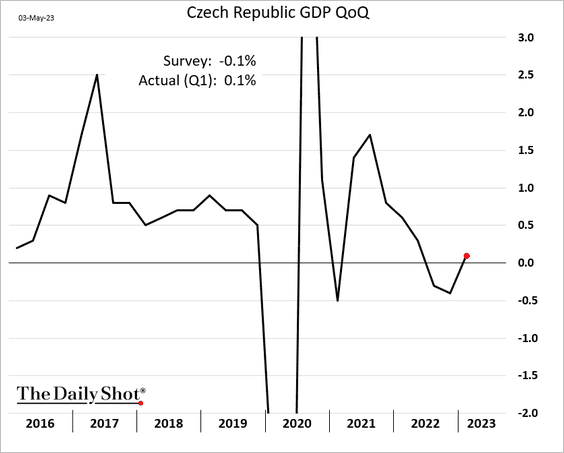
1. The Czech Republic registered a GDP increase in Q1 after two consecutive declines.
2. This chart shows intra-EU exports.
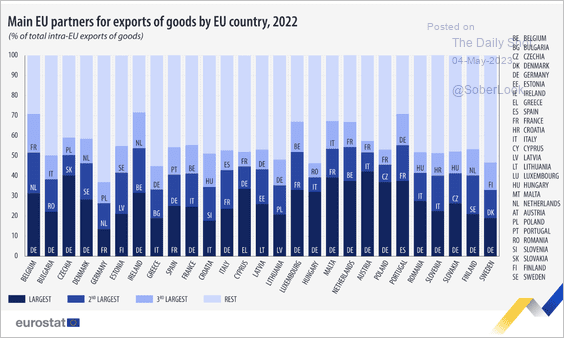 Source: Eurostat Read full article
Next, we have some data on EU trade in agricultural products.
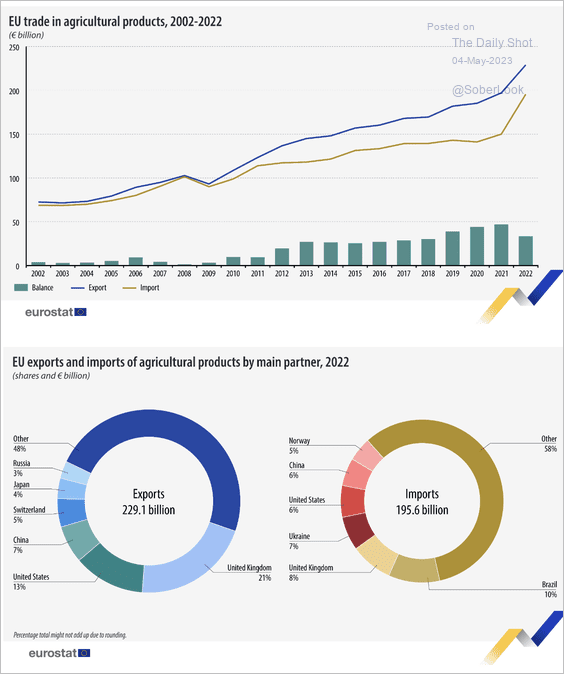 Source: Eurostat Read full article
——————–
3. This map illustrates the drought conditions in Spain and Portugal.
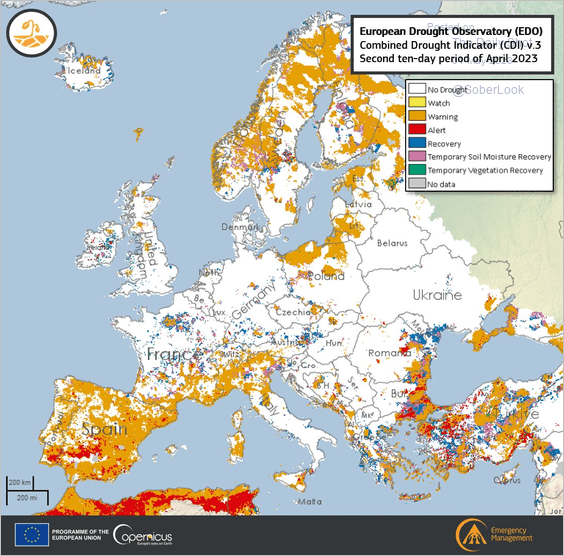 Source: @CopernicusEMS Read full article
Back to Index
Asia-Pacific
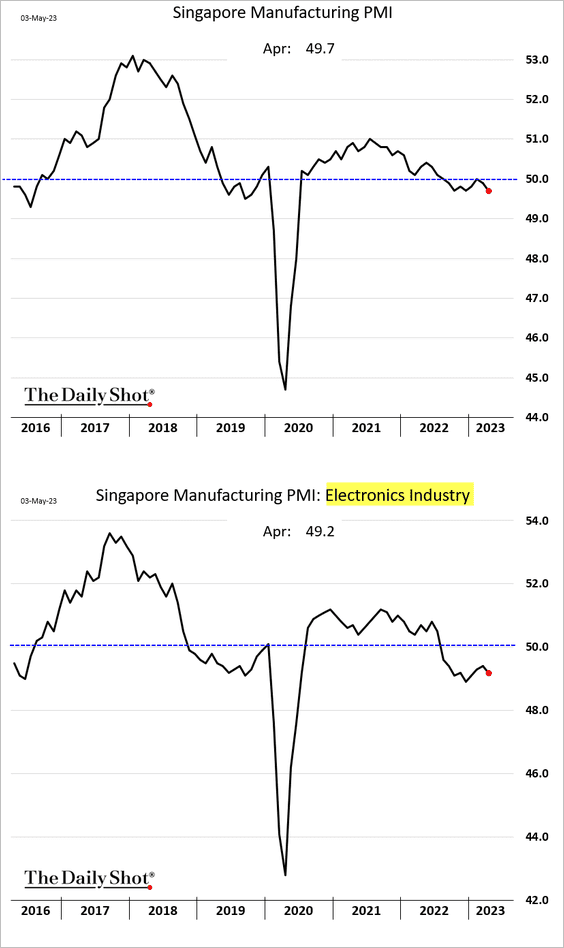
1. Singapore’s manufacturing sector is back in contraction.
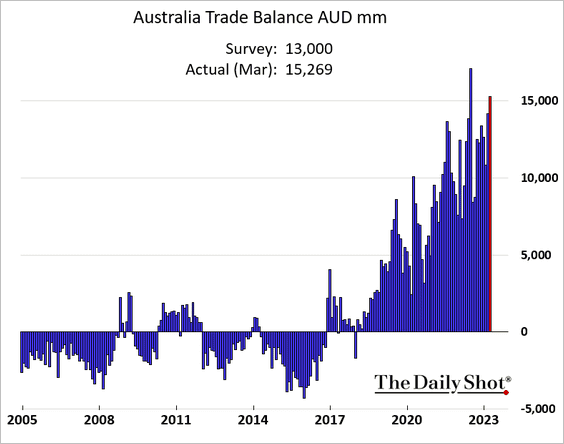
2. Australia’s trade surplus surprised to the upside as exports to China hit record highs.
Back to Index
China
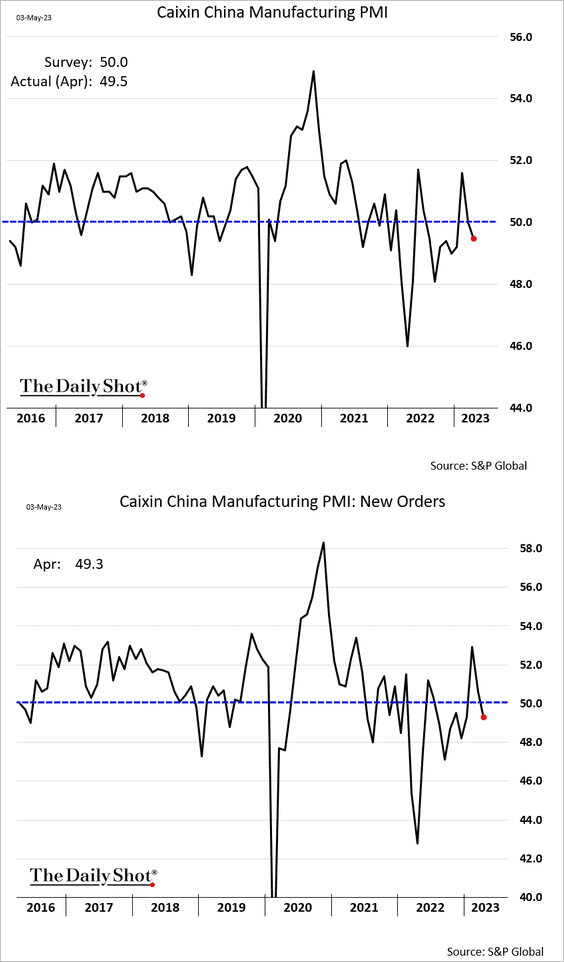
1. The S&P Global manufacturing PMI confirmed the factory sector weakness seen in the official report.
2. The modest bounce in Chinese equities has been supported by a positive credit impulse.
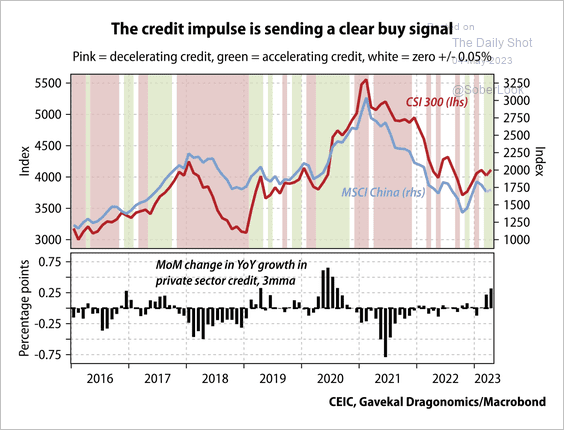 Source: Gavekal Research
Investors remain overweight Chinese markets, although less so over the past month, according to a BofA survey.
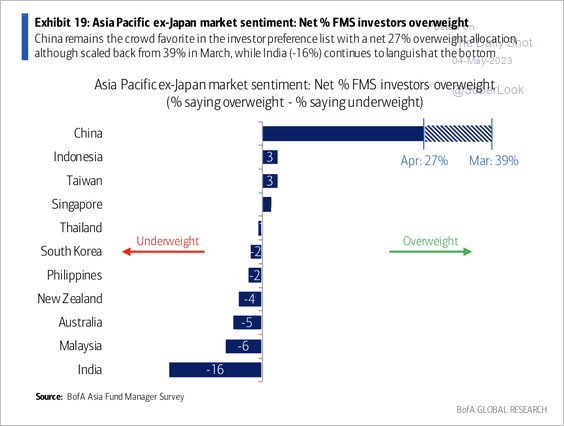 Source: BofA Global Research
——————–
3. After the lockdowns were lifted, China experienced a surge in travel activity.
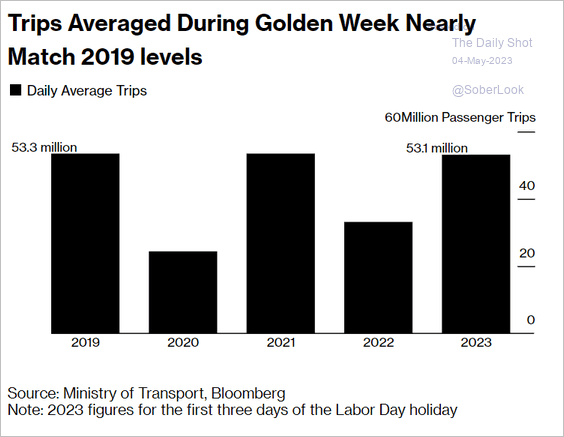 Source: @business Read full article
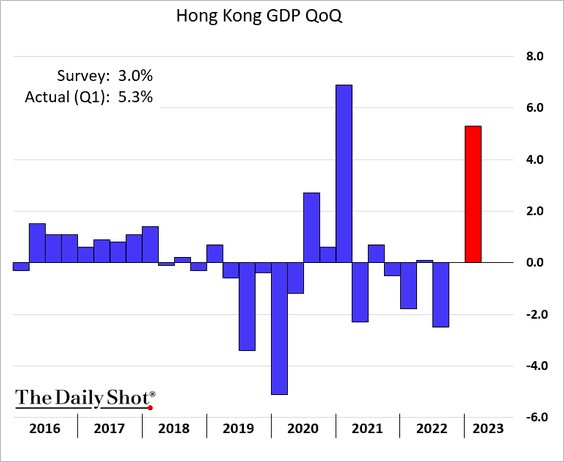
4. Hong Kong’s GDP jumped in the first quarter, topping expectations.
Back to Index
Emerging Markets
1. Continuing with the April PMI reports, factory activity accelerated across ASEAN nations.
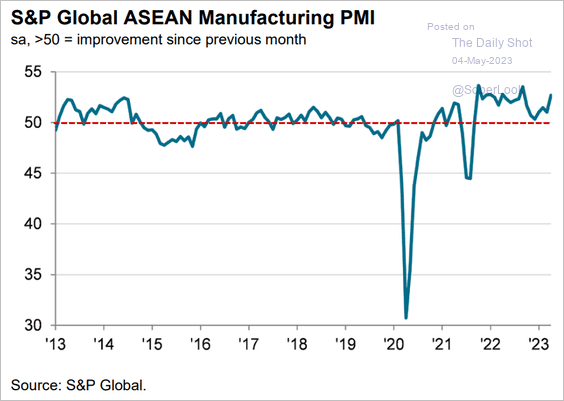 Source: S&P Global PMI
However, Vietnam’s manufacturing sector activity is still shrinking.
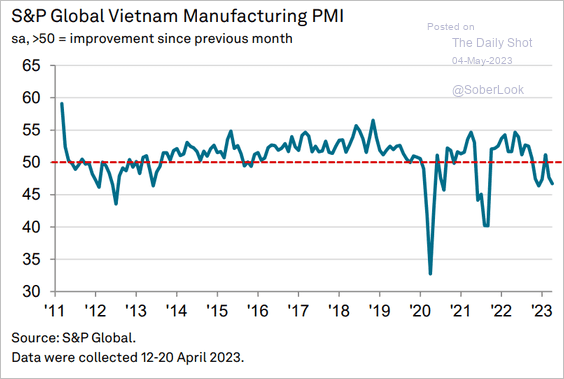 Source: S&P Global PMI
——————–
2. India’s services sector is experiencing growth not seen since 2010.
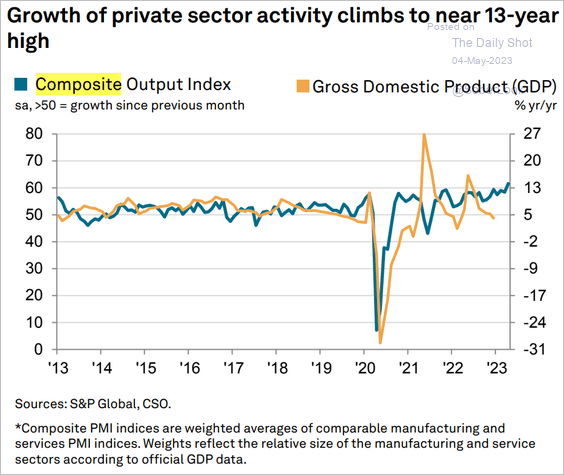 Source: S&P Global PMI
Here is the composite PMI.
Source: S&P Global PMI
——————–
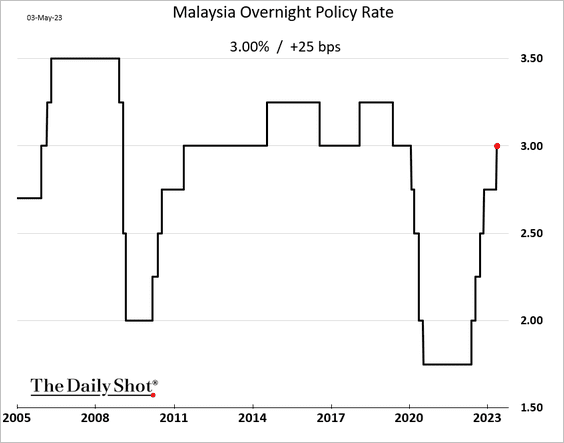
3. Malaysia’s central bank unexpectedly hiked rates.
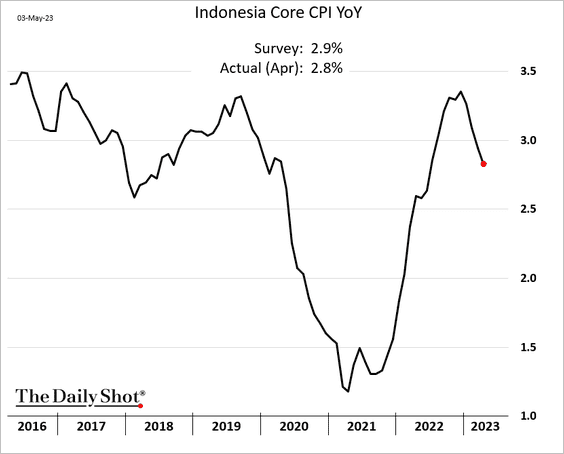
4. Indonesia’s core CPI is moderating.
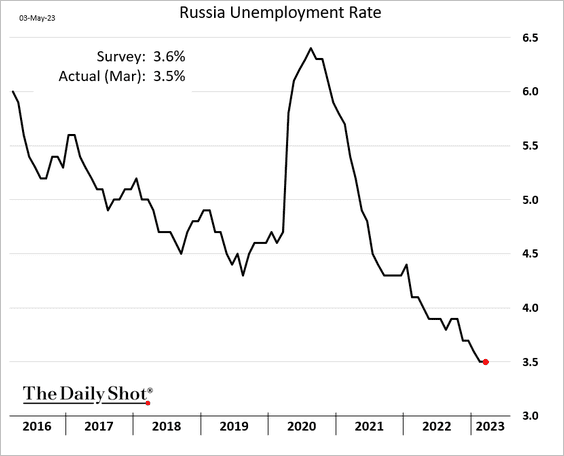
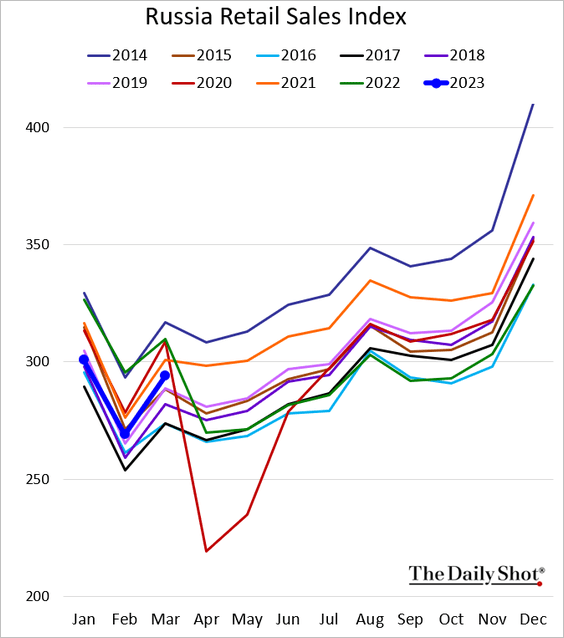
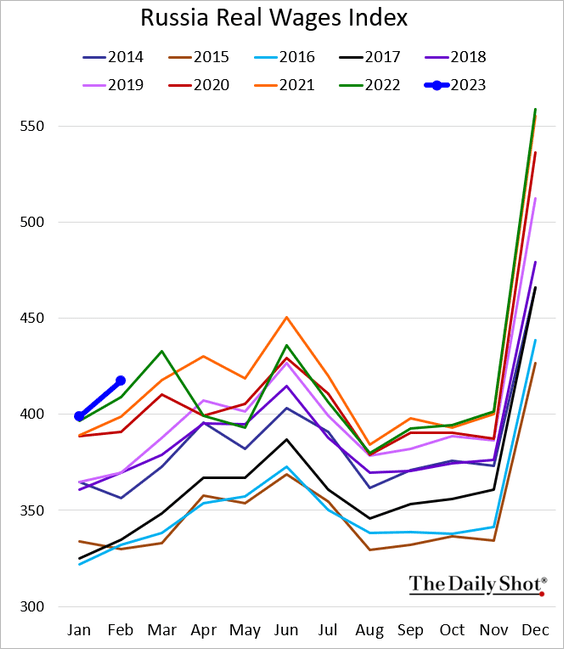
5. Next, we have some updates on Russia. The trends below are reported by the nation’s government and should be taken with a grain of salt.
• Unemployment:
• Retail sales:
• Real wages:
——————–
6. ZAR/USD (South African rand) experienced a deep drawdown despite its decent real carry versus the dollar.
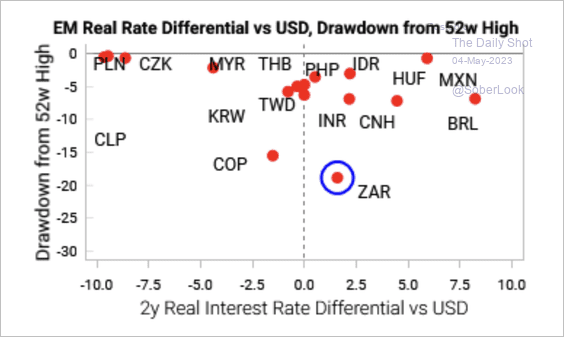 Source: Variant Perception
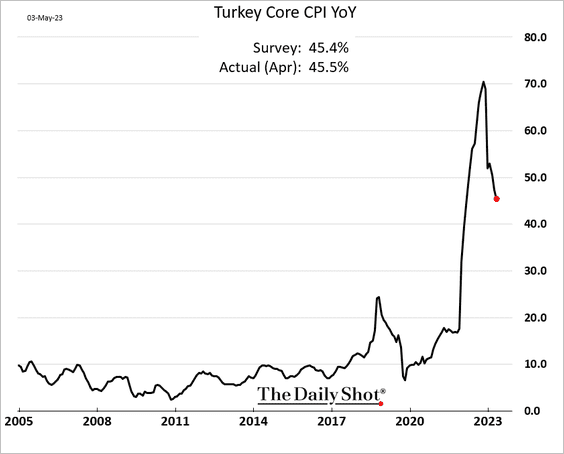
7. Turkey’s core inflation is moderating by remains above 45%.
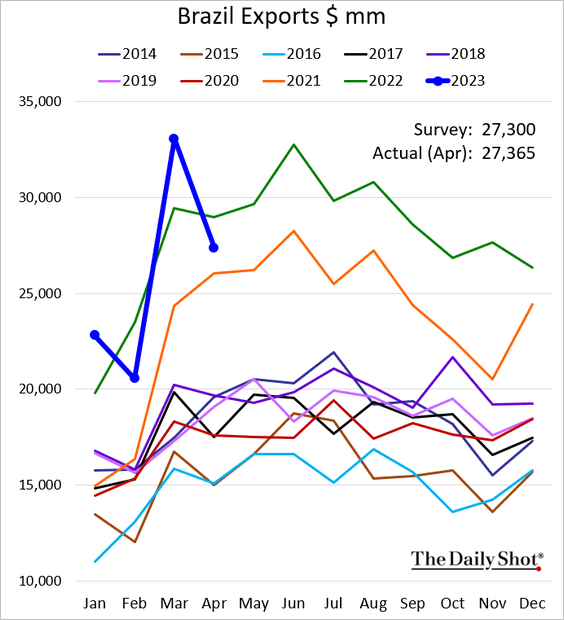
8. Brazil’s exports dipped below last year’s levels but are still quite strong.
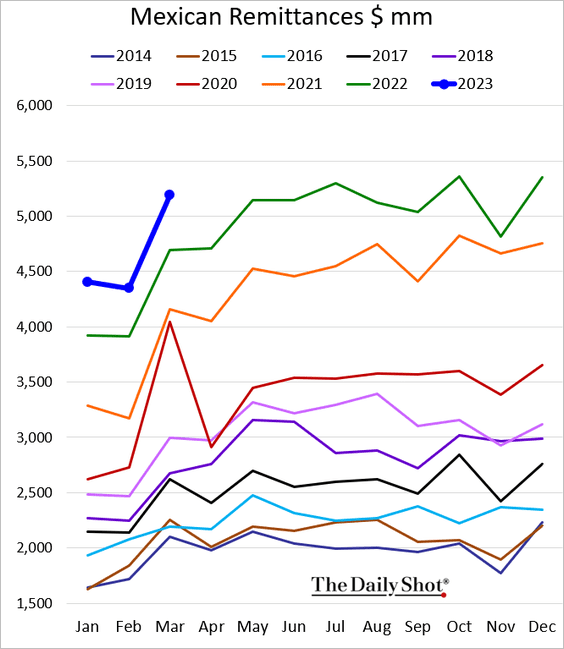
9. Mexican remittances are running at record highs.
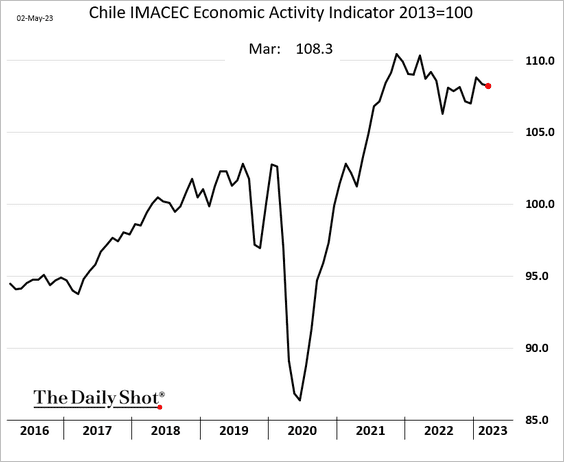
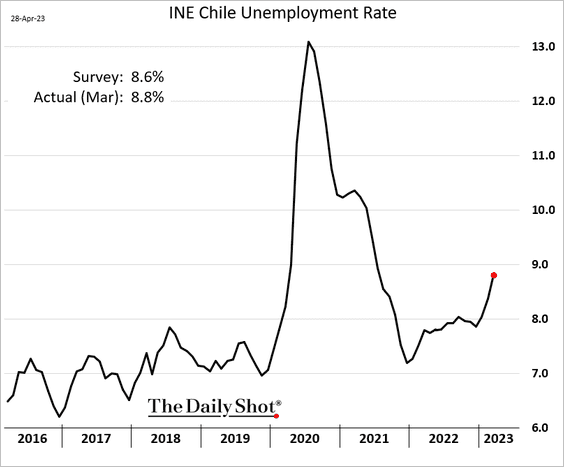
10. Here is a look at some data from Chile.
• Economic activity (slightly lower in March):
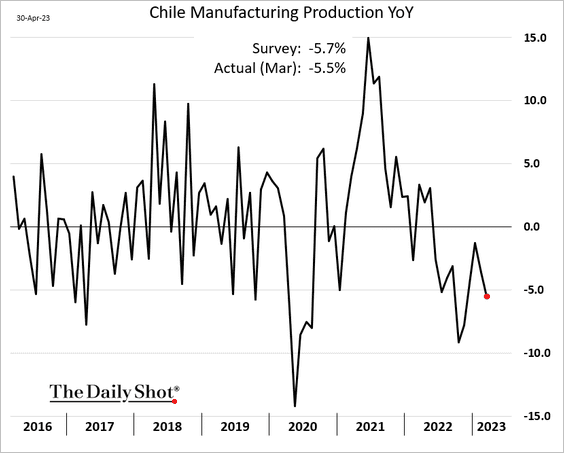
• Industrial production (year-over-year):
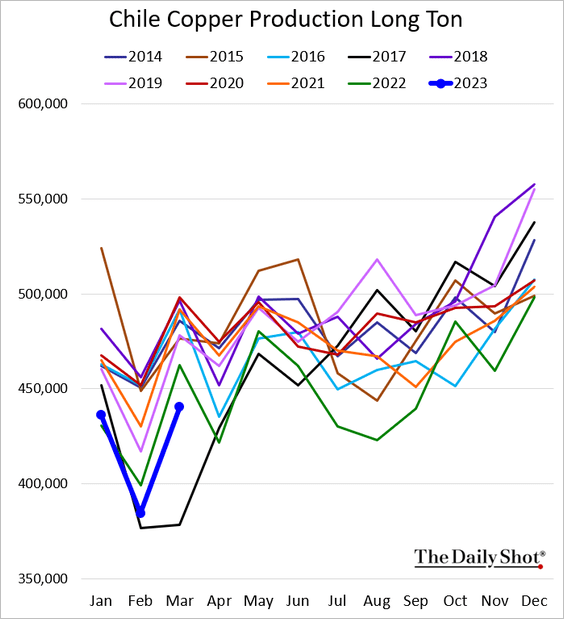
• Copper production:
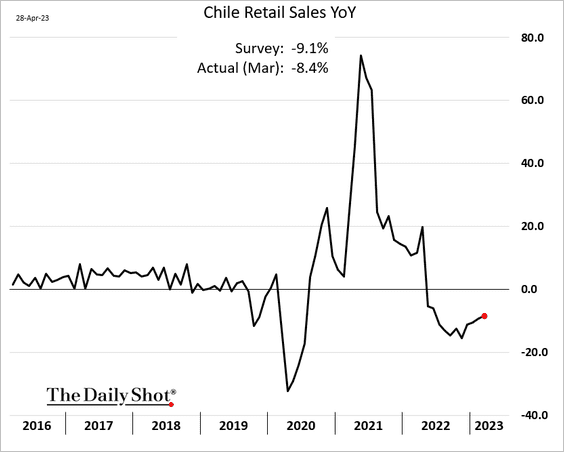
• Retail sales (year-over-year):
• The unemployment rate (above expectations):
——————–
11. EM equity performance has been dragged lower by China.
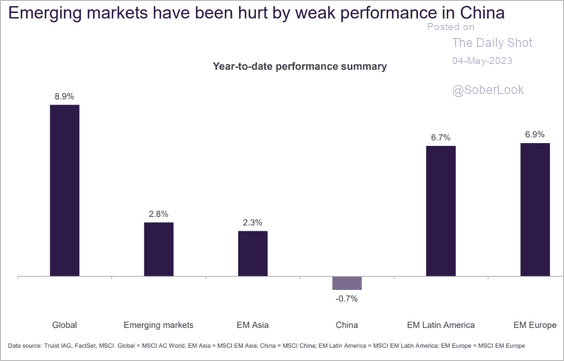 Source: Truist Advisory Services
• Traders are boosting their bets against EM stocks.
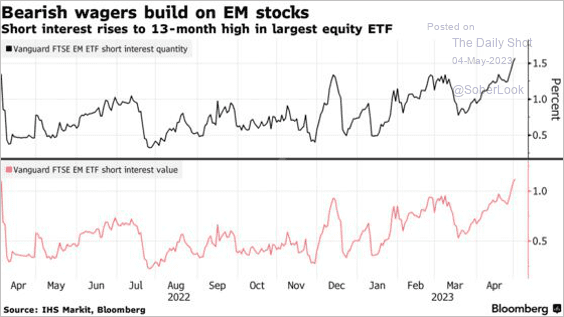 Source: @markets Read full article
• Here is a look at the relative performance of financials over the past two months.
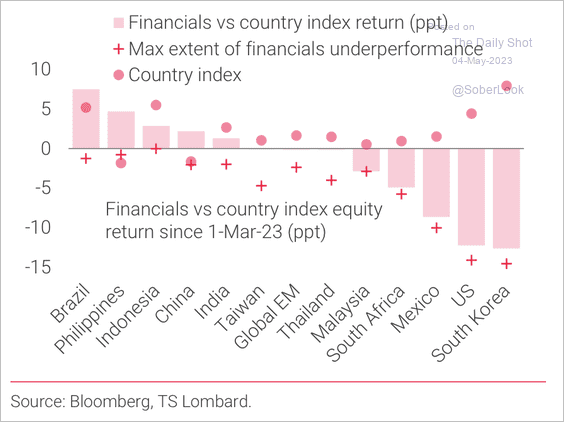 Source: TS Lombard
Back to Index
Commodities
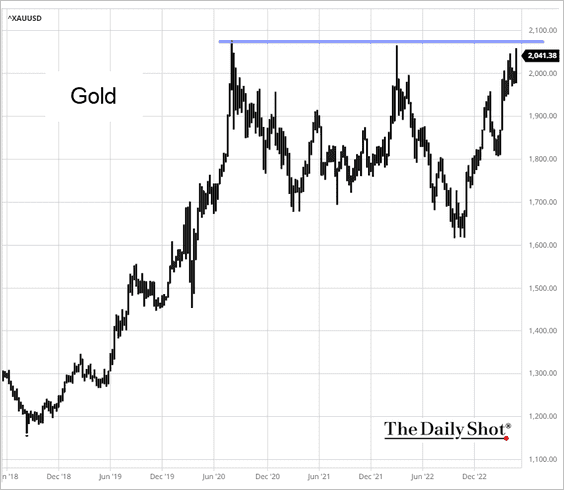
1. Gold jumped on Wednesday, nearing the high reached in 2020, as the Fed signaled a pause and the US dollar moved lower. Persistent turbulence in the US baking sector and the debt ceiling concerns are also driving prices higher.
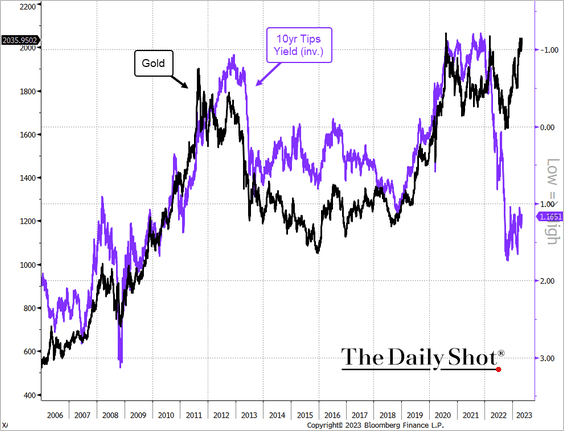
The divergence from real yields points to a large macro risk premium in gold.
——————–
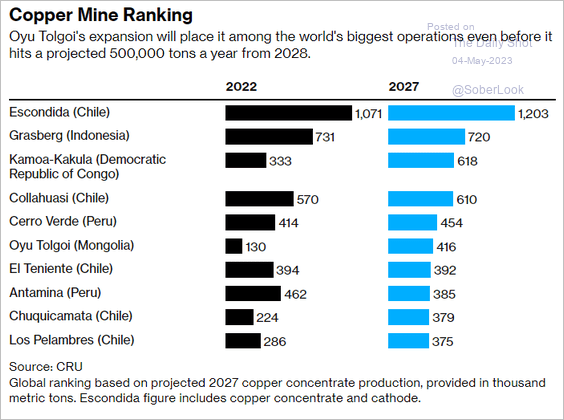
2. This chart shows global copper mine rankings.
 Source: @business Read full article
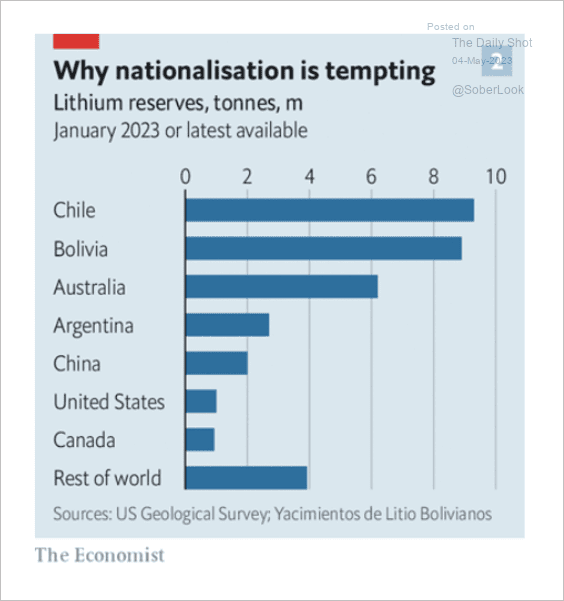
3. Who has the largest lithium reserves?
 Source: The Economist Read full article
4. Wheat bounced from the lows on Wednesday.
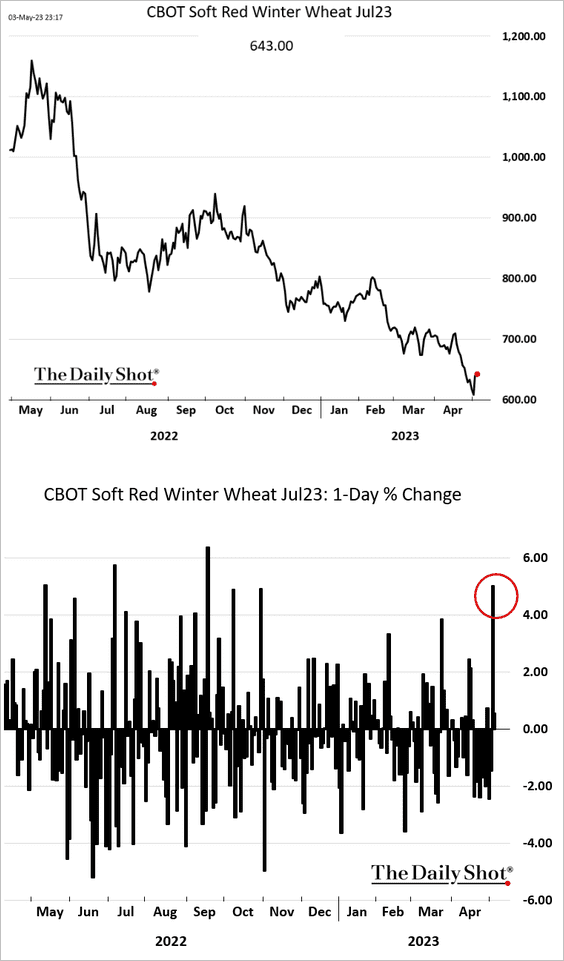
 Source: Reuters Read full article
Back to Index
Energy
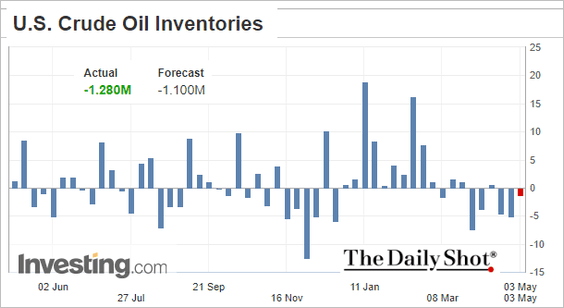
1. This headline summarizes the US Department of Energy’s inventory report for last week.
 Source: Reuters Read full article
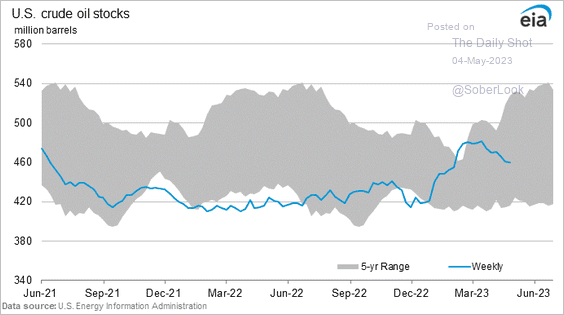
• Oil inventories (week-over-week changes and levels):
• Gasoline inventories (week-over-week changes and levels):
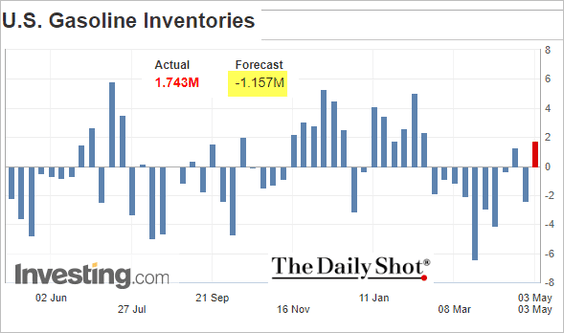
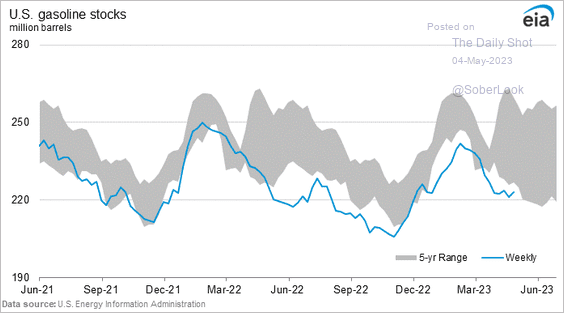
• Gasoline demand declined, …
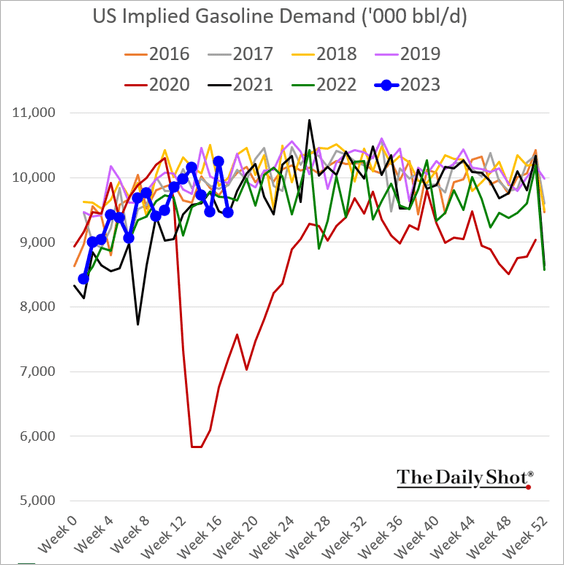
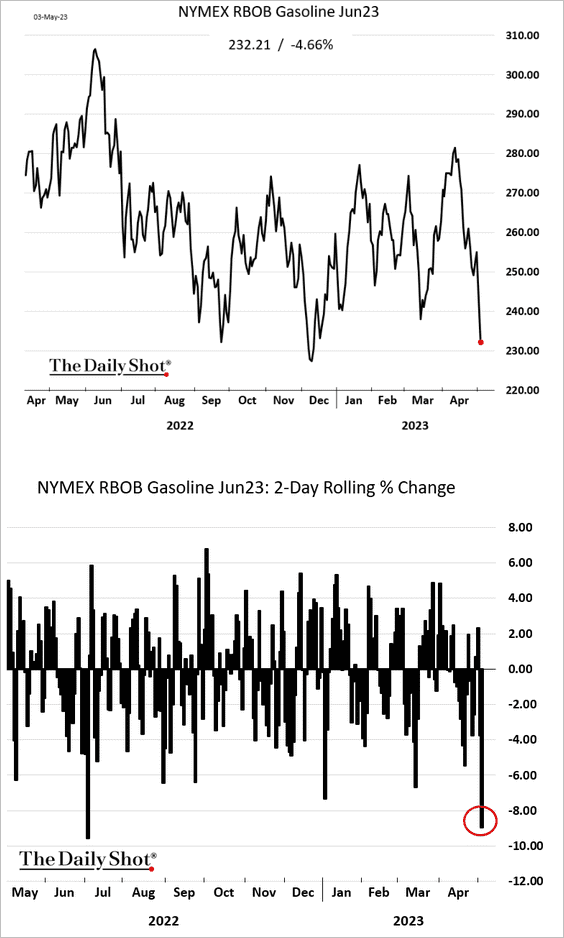
… pressuring prices.
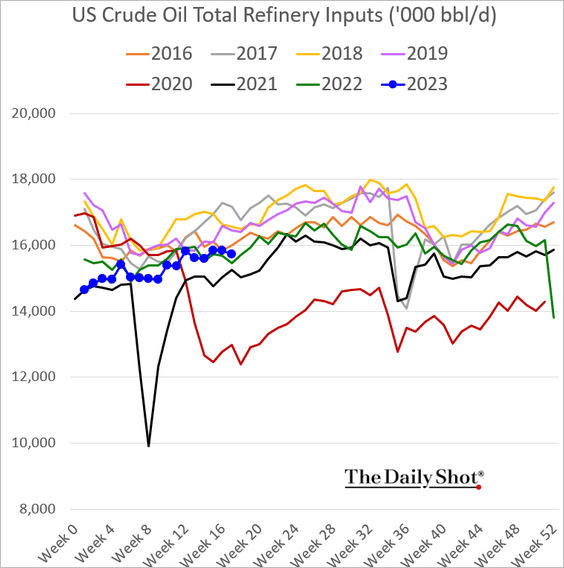
• Refinery inputs are running slightly above last year’s levels.
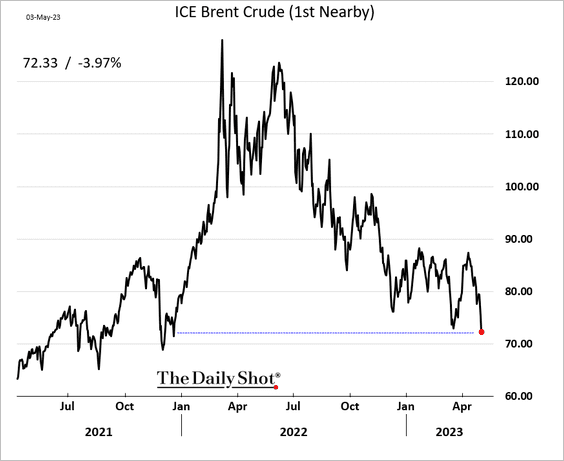
2. Crude oil has been under pressure amid demand concerns.
3. US natural gas inventories are elevated for this time of the year.
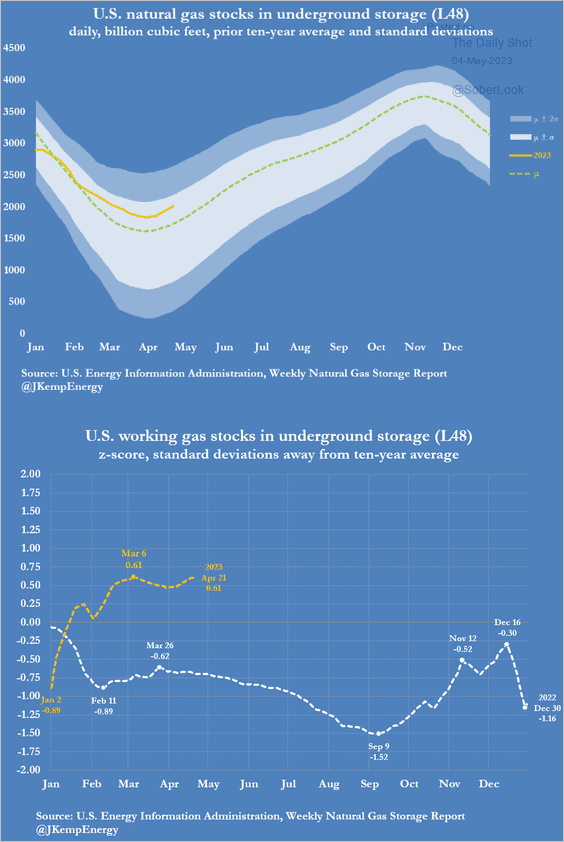 Source: @JKempEnergy
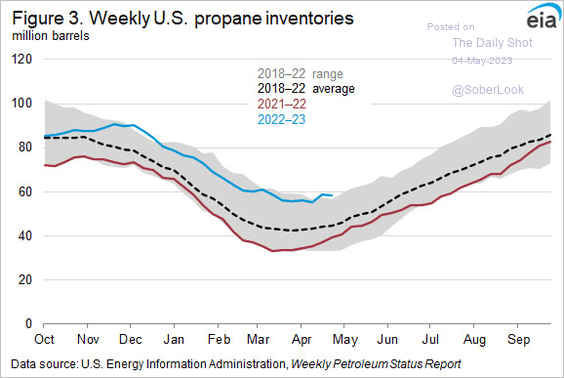
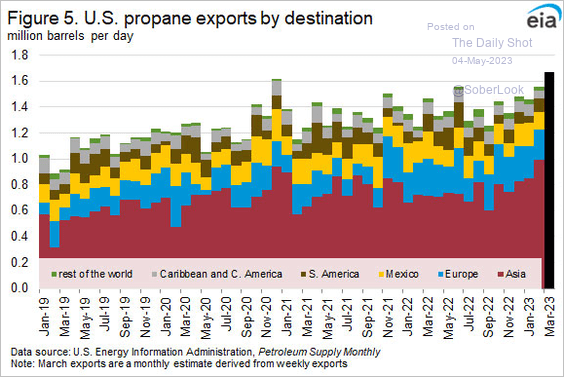
4. Next, we have US propane inventories and exports.
Back to Index
Equities
1. After the market close, US regional bank shares experienced another sharp decline, …
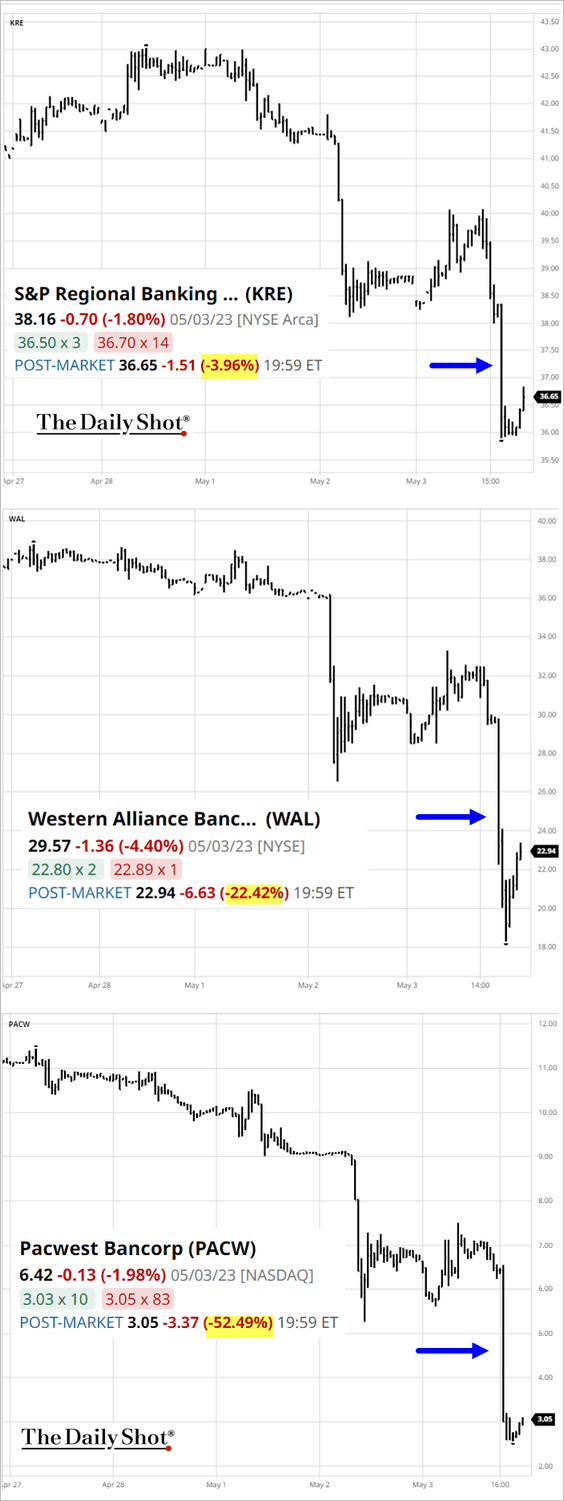 Source: barchart.com
… … prompting PacWest to take steps to calm the markets.
 Source: @ecadman, @business Read full article
——————–
2. The Federal Reserve may not begin cutting rates for some time. In light of this, it’s worth asking whether the recent stock market rally is overdone.
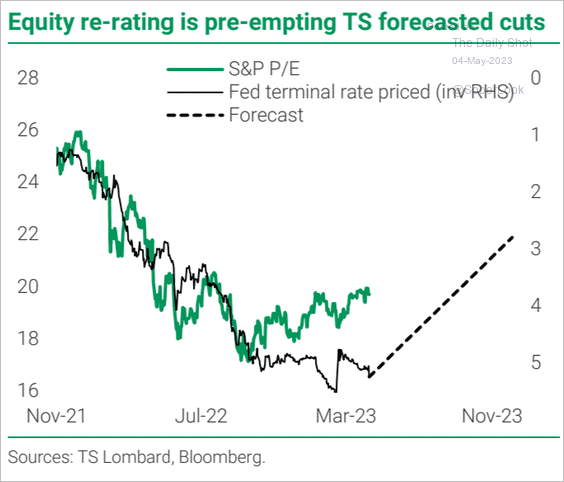 Source: TS Lombard
3. Where do JP Morgan’s clients see the S&P 500 at the end of the year?
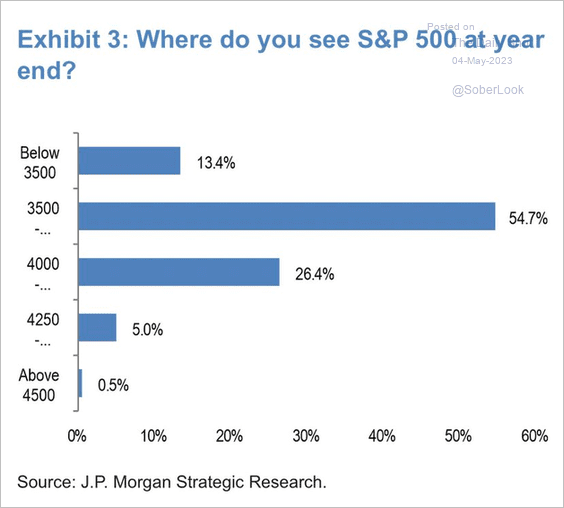 Source: JP Morgan Research
4. Higher volatility ahead?
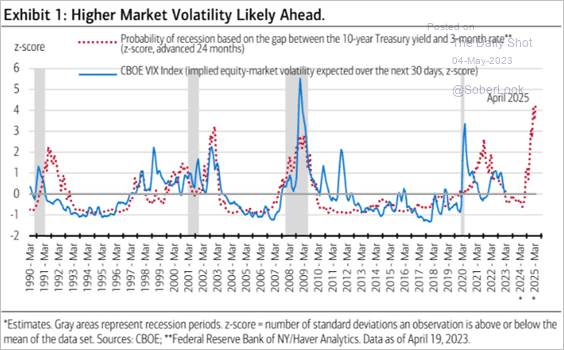 Source: Merrill Lynch
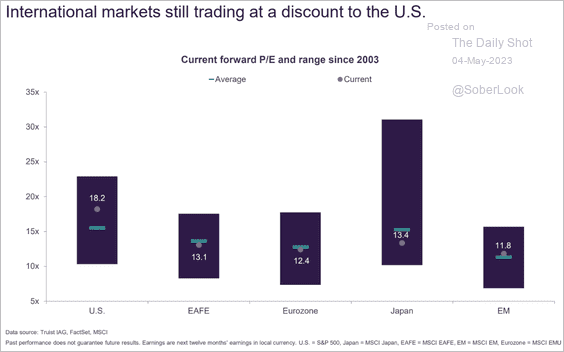
5. US equities remain richly priced versus international peers (2 charts).
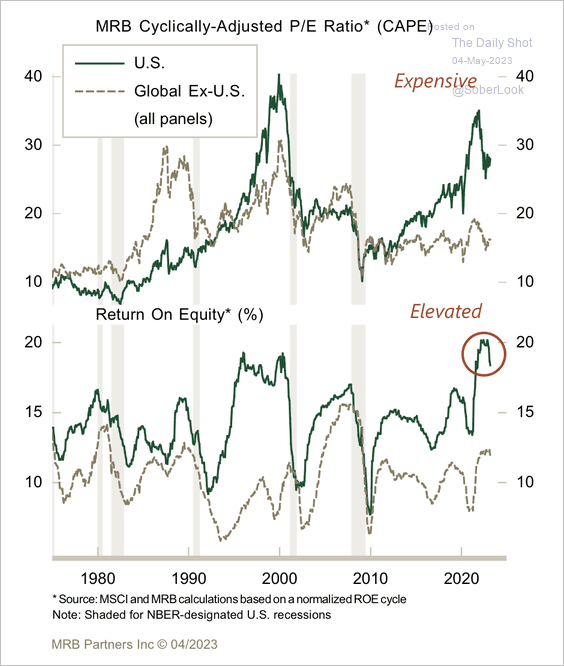 Source: MRB Partners
 Source: Truist Advisory Services
——————–
6. S&P 500 average one-year returns tend to be highest when the equity risk premium is above its 20-year average.
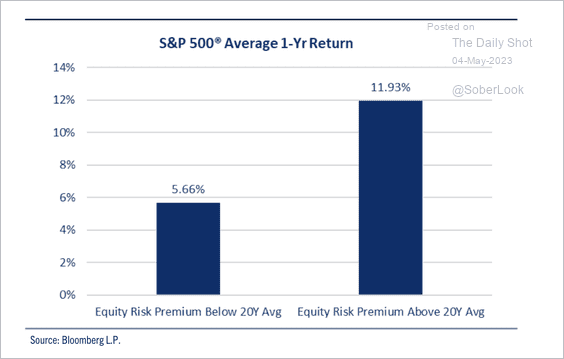 Source: Comerica Wealth Management
7. This chart shows Q1 earnings beats by sector.
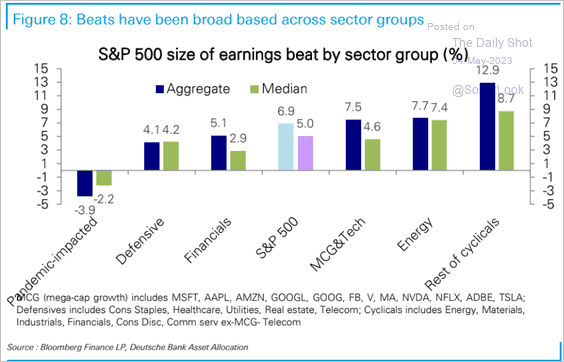 Source: Deutsche Bank Research
• Some sectors have already experienced profit recessions.
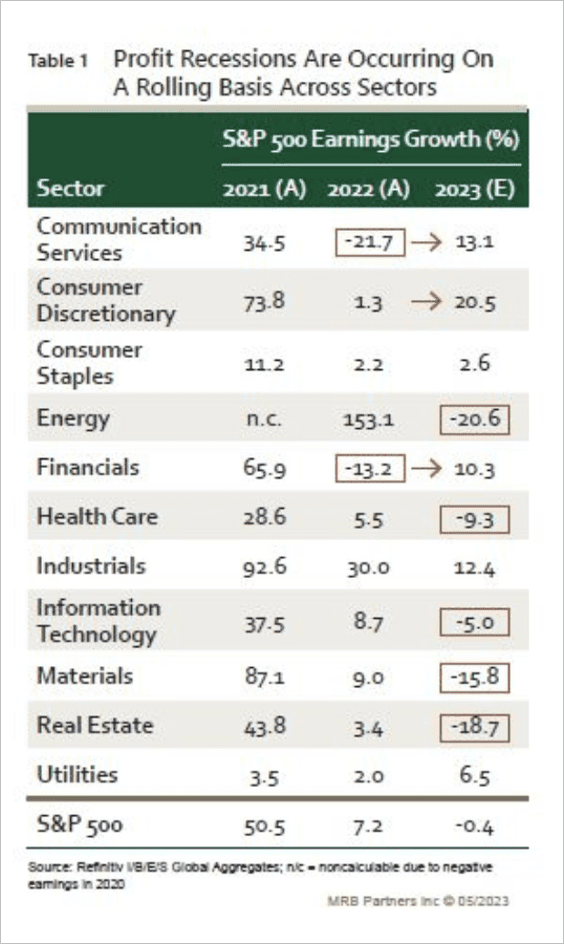 Source: MRB Partners
——————–
8. How much does Amazon contribute to the Consumer Discretionary sector and S&P 500 earnings growth?
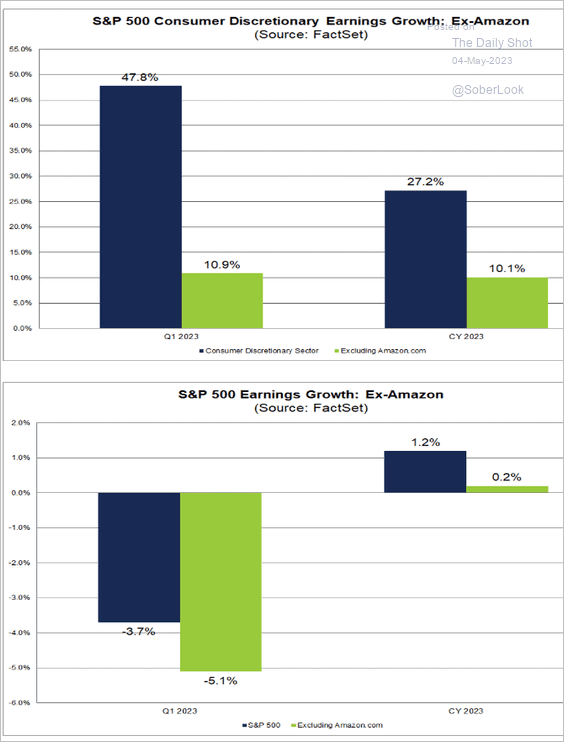 Source: @FactSet Read full article
9. The market is entering a seasonally weaker period, typically spanning from May to October.
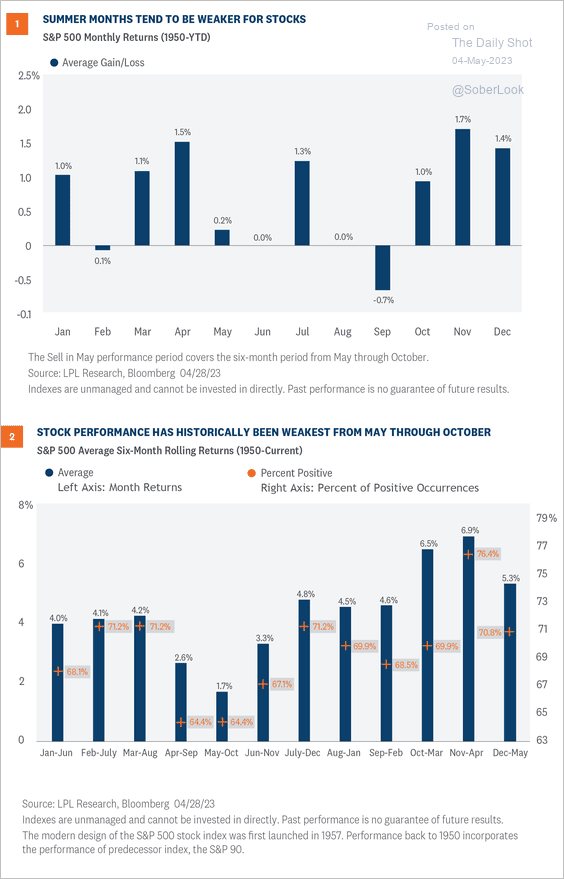 Source: LPL Research
Back to Index
Credit
1. Global credit is getting tight.
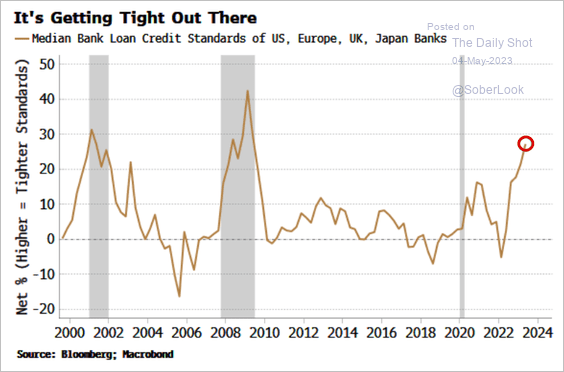 Source: Simon White, Bloomberg Markets Live Blog
Deutsche Bank’s model points to further tightening ahead for the US.
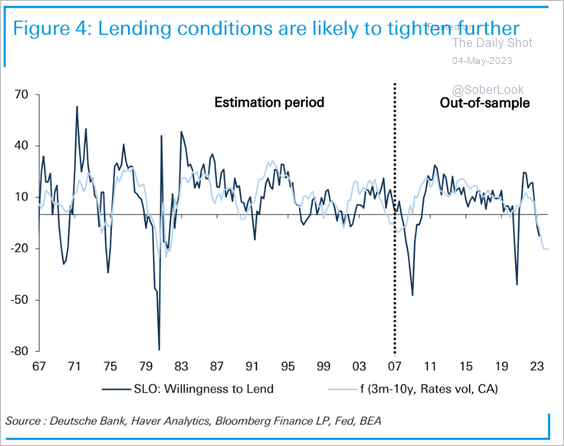 Source: Deutsche Bank Research
——————–
2. Insolvencies of large US firms have been rising this year.
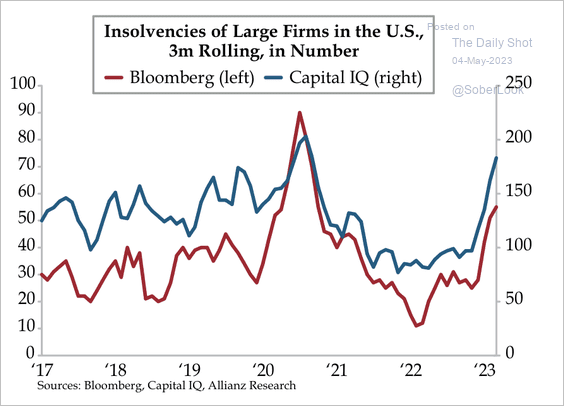 Source: Quill Intelligence
3. The Ares BDC financials show interest coverage deteriorating at US middle-market firms.
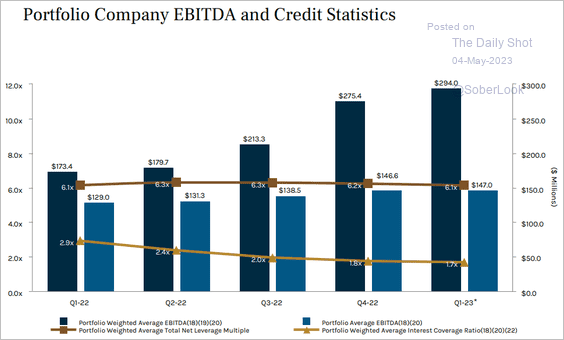 Source: Ares Capital Corporation
Back to Index
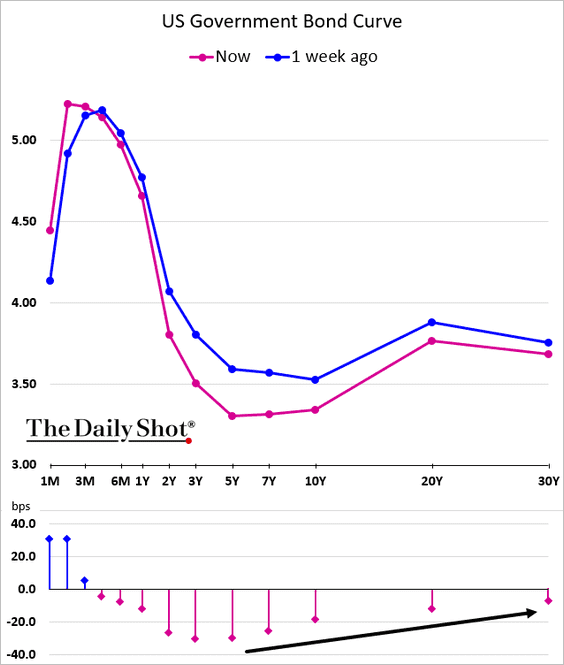
Rates
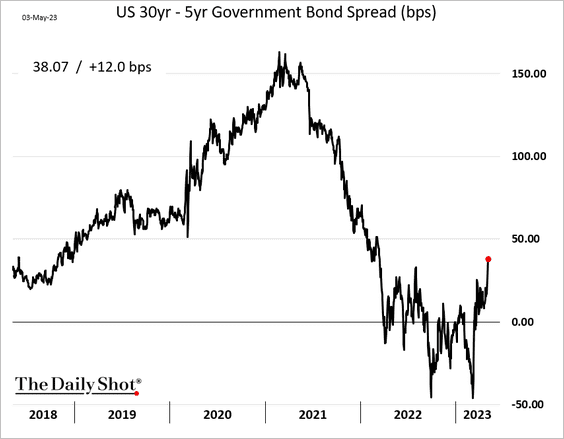
The Treasury curve is steepening at the long end (bull steepener).
——————–
Food for Thought
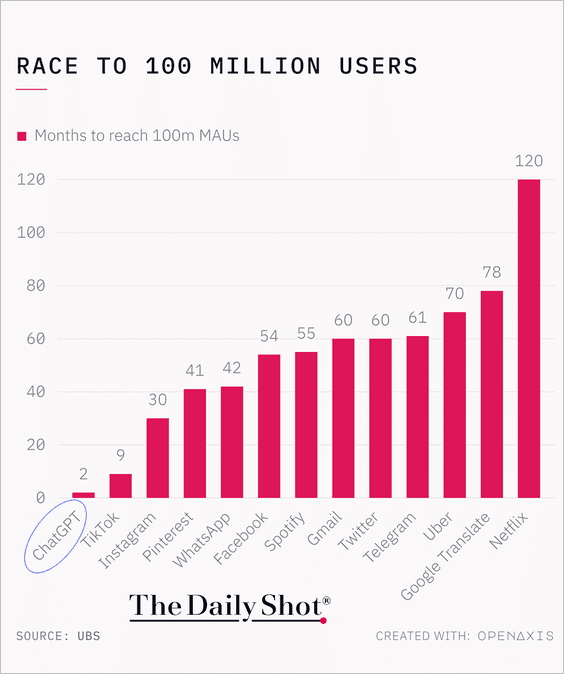
1. Months to reach 100 million users:
 Source: @TheDailyShot
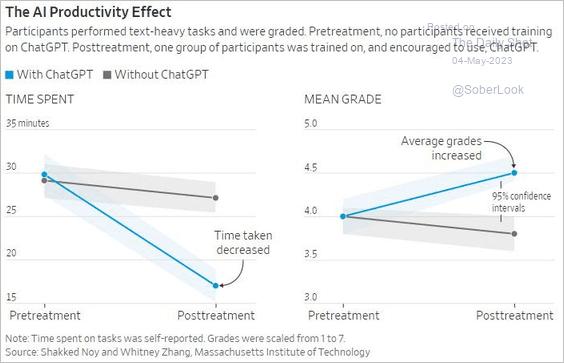
2. Efficiency improvements with ChatGPT:
 Source: @WSJ Read full article
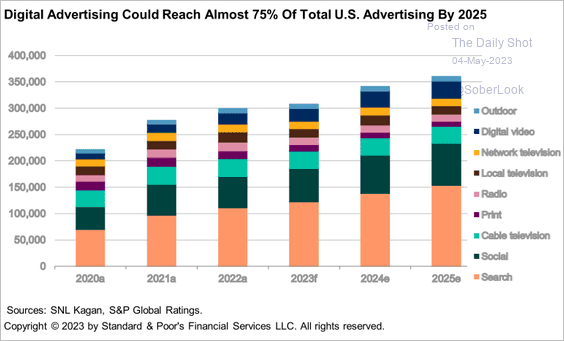
3. Digital advertising:
 Source: S&P Global Ratings
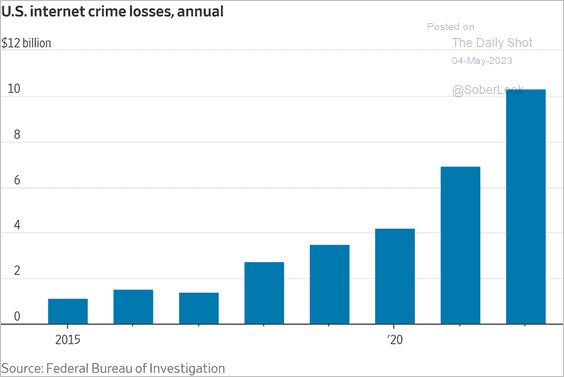
4. Internet crime losses:
 Source: @WSJ Read full article
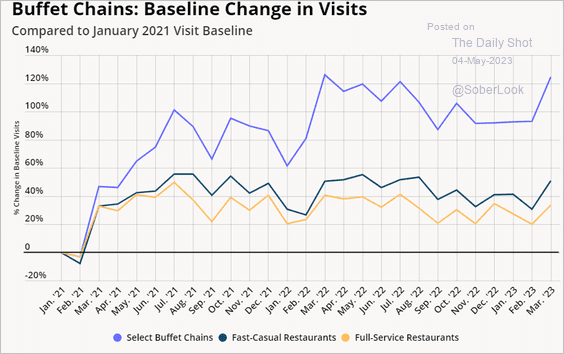
5. Buffet restaurants’ foot traffic:
 Source: Placer.ai
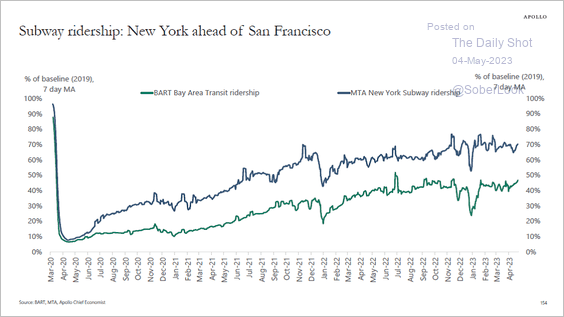
6. Subway ridership:
 Source: Torsten Slok, Apollo
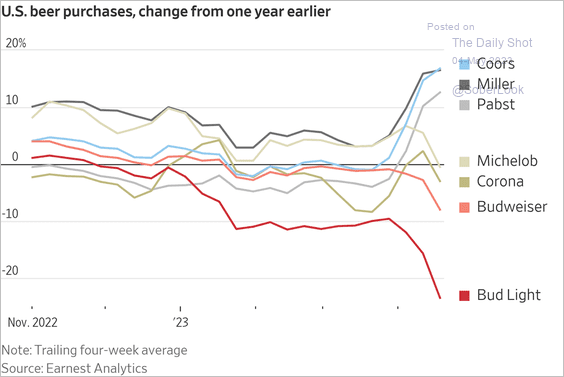
7. US beer purchases:
 Source: @WSJ Read full article
——————–
Back to Index