
The Daily Shot: 05-May-23
• The United States
• Canada
• The United Kingdom
• The Eurozone
• Europe
• Asia-Pacific
• China
• Emerging Markets
• Cryptocurrency
• Commodities
• Energy
• Equities
• Credit
• Rates
• Global Developments
• Food for Thought
The United States
1. Growth in labor costs remains sticky, with the Q1 unit labor costs topping expectations. This poses a challenge to the Fed’s efforts to control inflation.
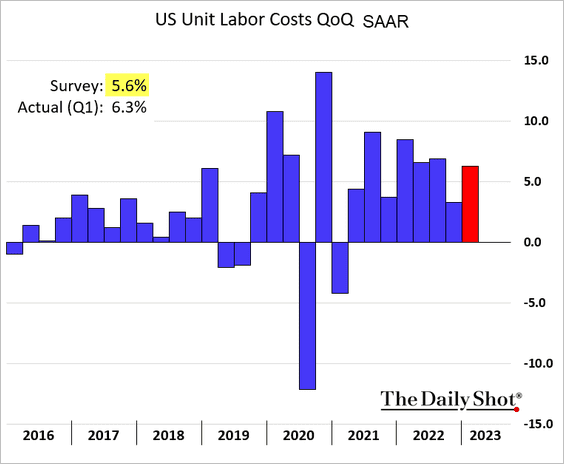
Wage growth is still too high to support a sustained drop in inflation.
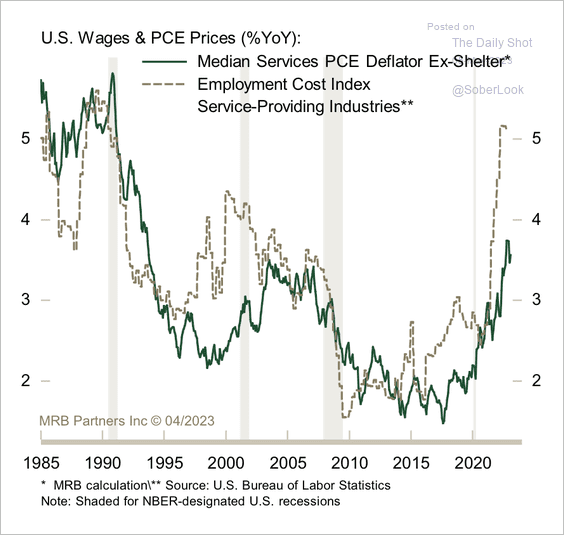 Source: MRB Partners
• Productivity declined.
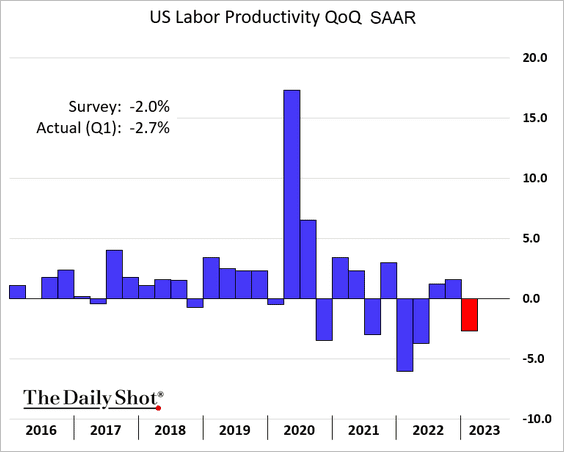
 Source: Reuters Read full article
Stalled productivity and weak labor force expansion make it hard to grow the economy.
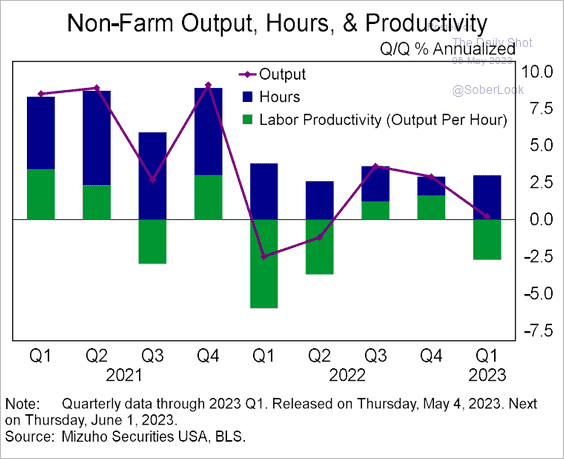 Source: Mizuho Securities USA
——————–
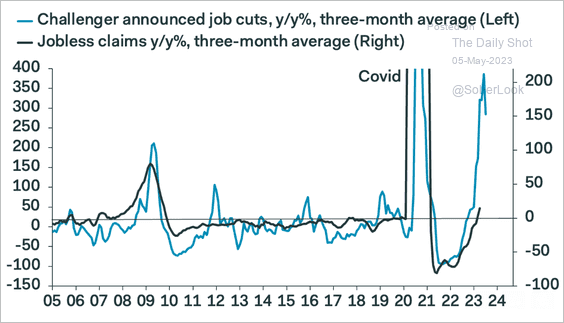
2. Next, we have some updates on the labor market.
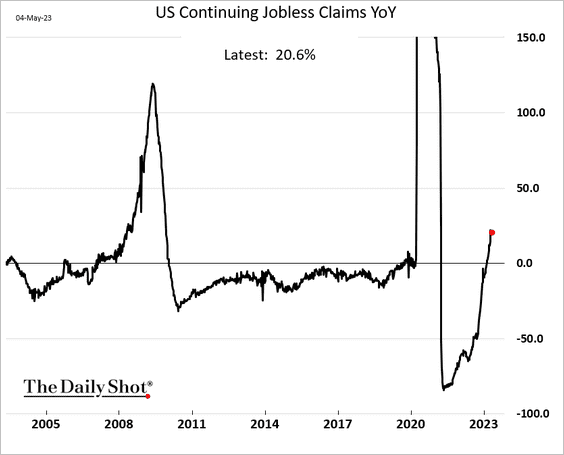
• Initial jobless claims remain above last year’s levels but are not surging.
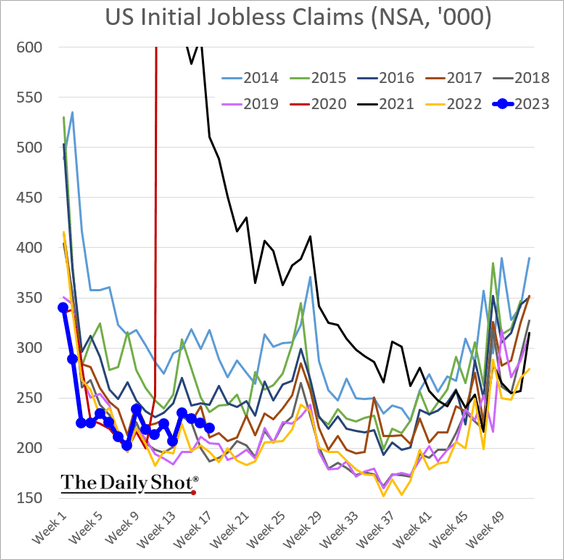
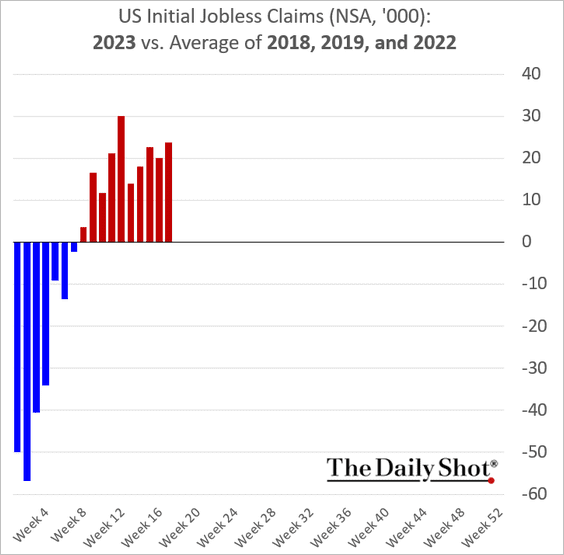
But higher layoffs signal an increase ahead for unemployment claims.
 Source: Pantheon Macroeconomics
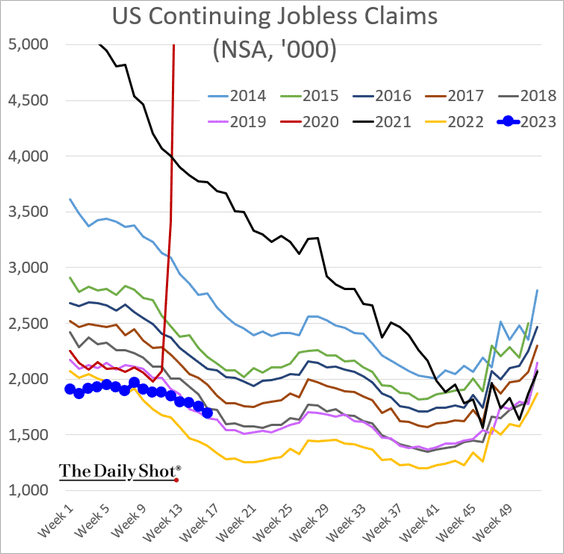
The charts below show continuing claims and the year-over-year changes.
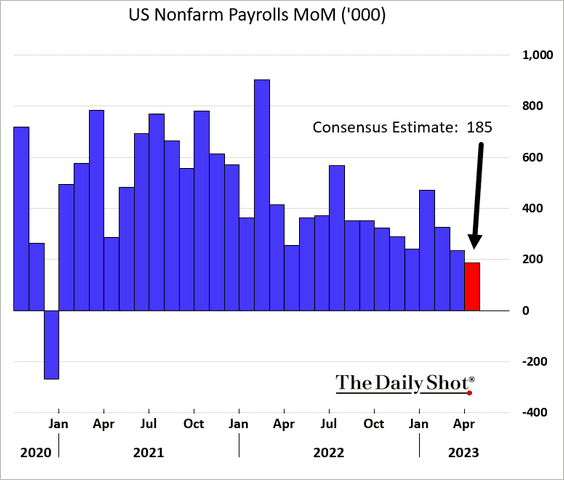
• The market expects today’s employment report to show 185k new jobs created in April.
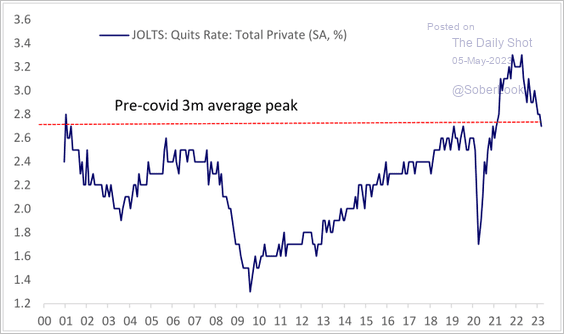
• The rate of private-sector voluntary resignations is nearing pre-COVID levels, a sign of easing labor market imbalances.
 Source: Deutsche Bank Research
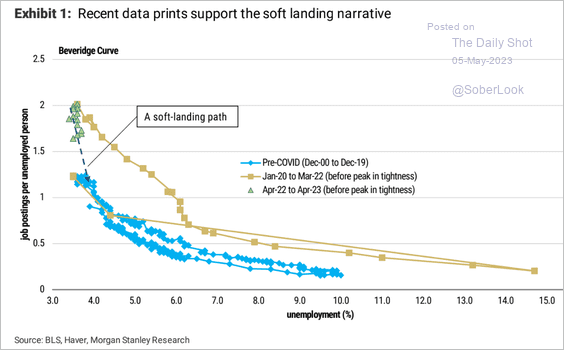
• Morgan Stanley sees a smaller increase in unemployment than the FOMC, pointing to a “soft landing.”
 Source: Morgan Stanley Research
• The gig economy has peaked.
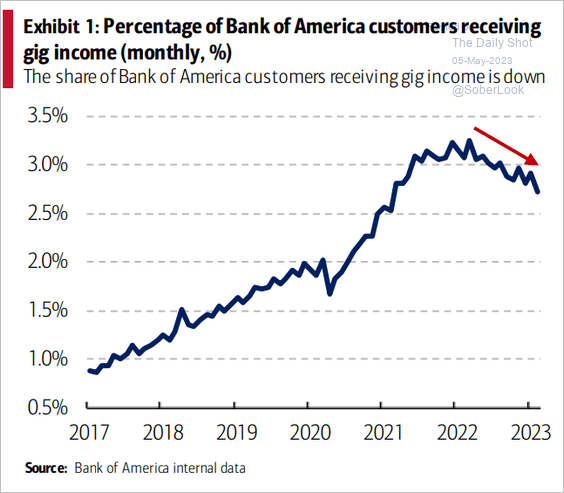 Source: BofA Global Research
Here is the Gen-Z gig income vs. their labor force participation.
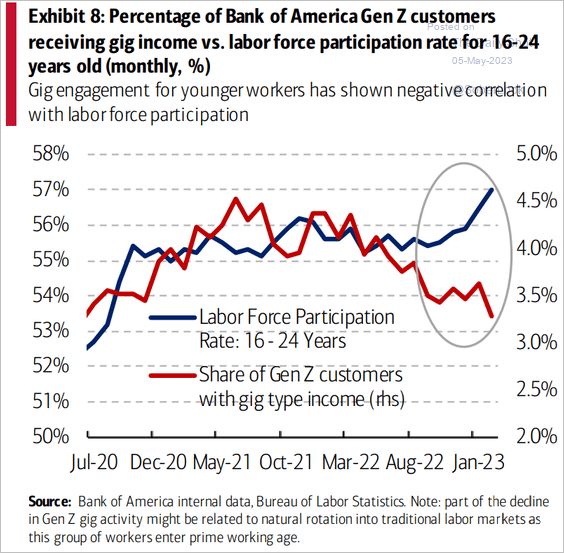 Source: BofA Global Research
——————–
3. Small business wage growth remains elevated but appears to be peaking.
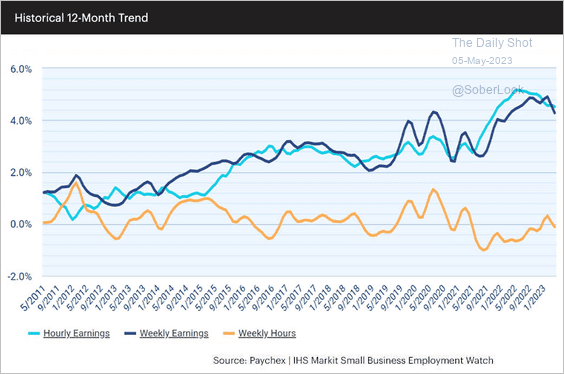 Source: Small Business Employment Index
• Small businesses have reported weaker investment and hiring plans.
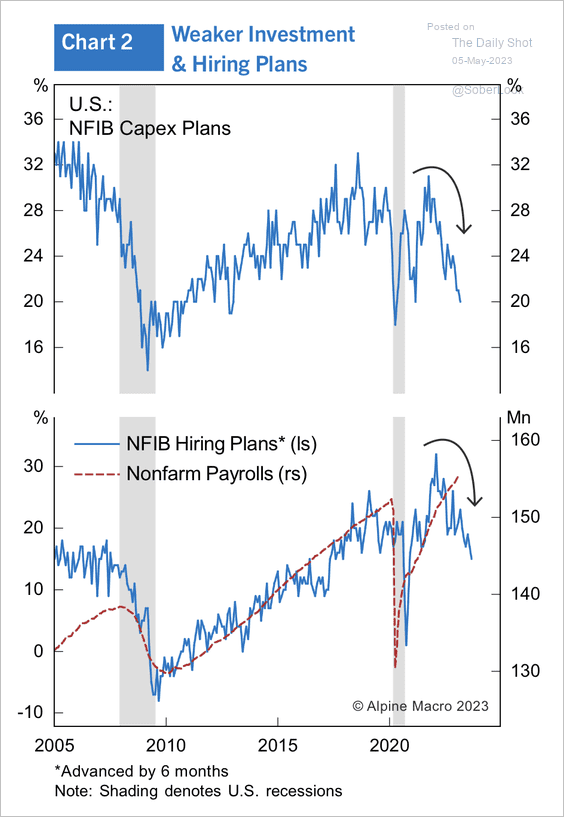 Source: Alpine Macro
• The NFIB survey suggests that small business bankruptcies will rise quickly going forward.
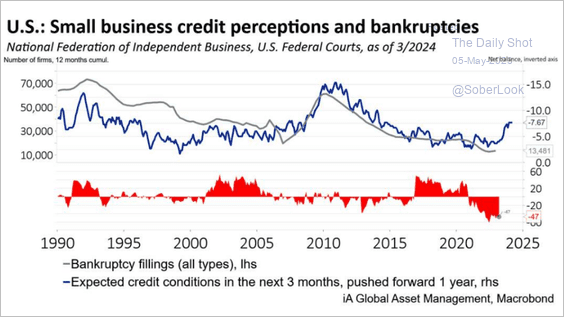 Source: Industrial Alliance Investment Management
——————–
4. The Atlanta Fed’s GDPNow model is tracking Q2 growth at 2.7% (annualized), well above economists’ consensus estimate.
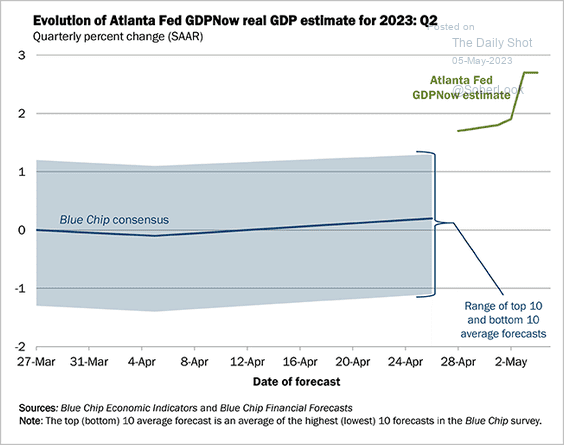 Source: Federal Reserve Bank of Atlanta
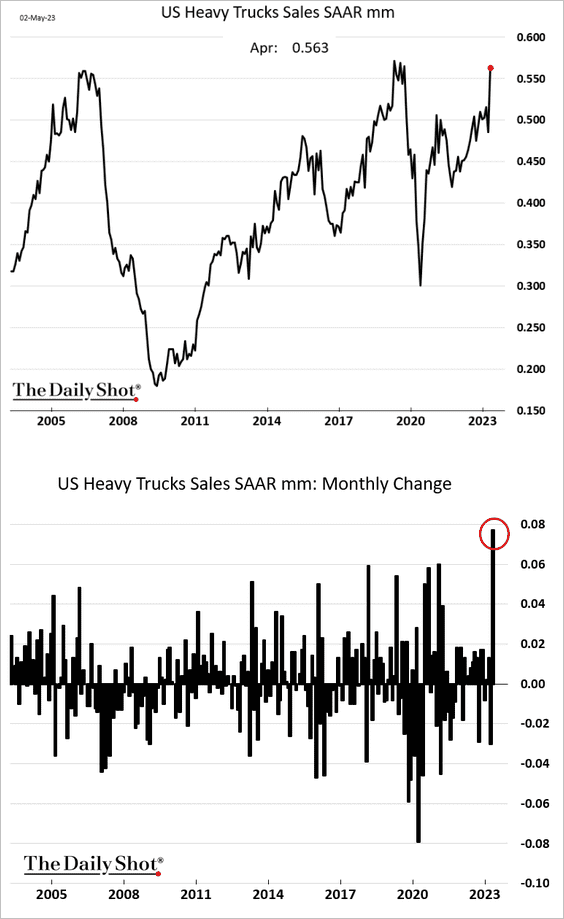
5. Heavy truck sales surged in April. We are likely to see much slower growth in the months ahead.
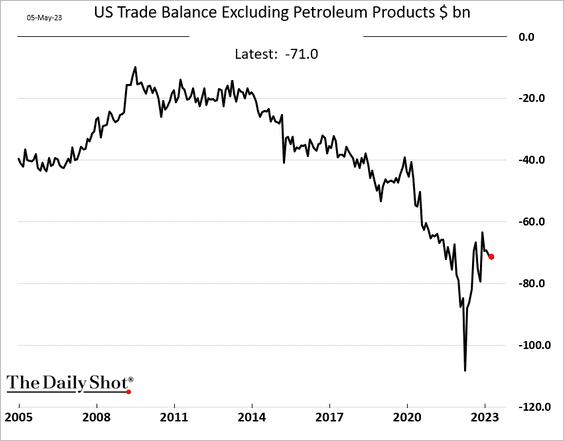
6. The trade deficit narrowed in March.
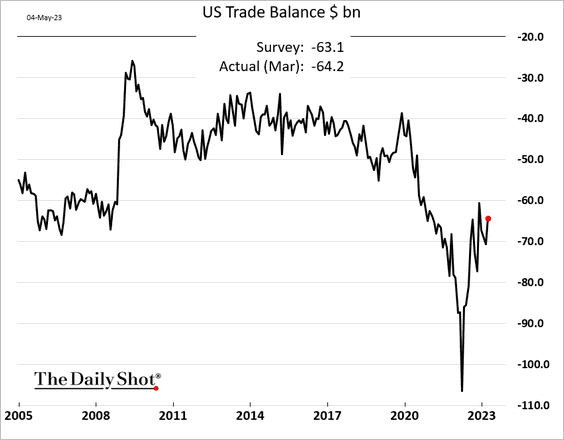
 Source: MarketWatch Read full article
However, excluding petroleum trade, the deficit continued to widen.
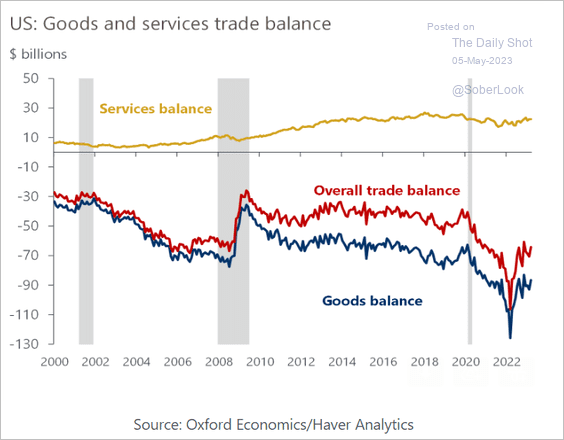
This chart shows the trade balance in services.
 Source: Oxford Economics
Back to Index
Canada
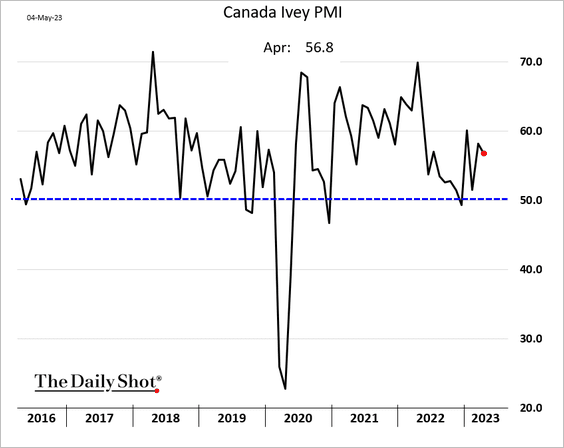
1. The Ivey PMI, which includes private and public organizations, showed solid growth in April.
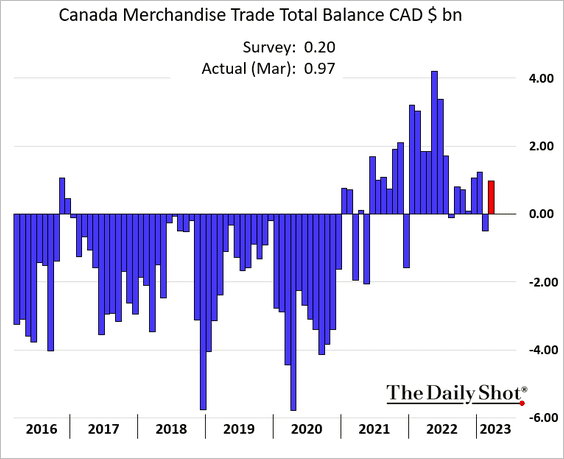
2. Canada’s trade is back in surplus, topping expectations.
Back to Index
The United Kingdom
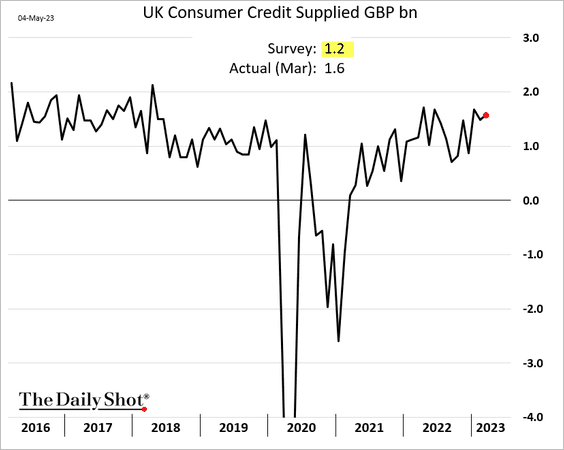
1. Growth in consumer credit is holding up well.
• Mortgage approvals topped expectations.
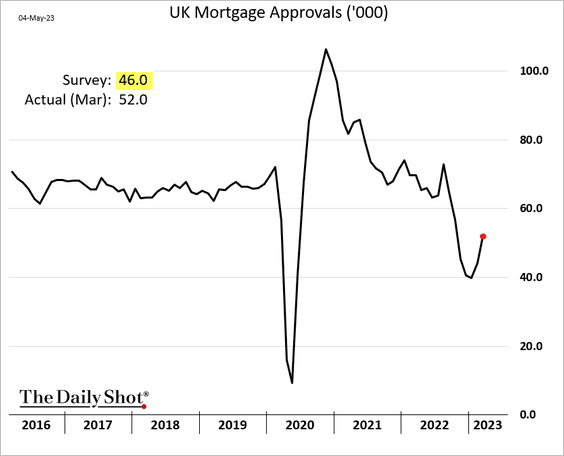
 Source: Reuters Read full article
• The money supply growth continues to slow.
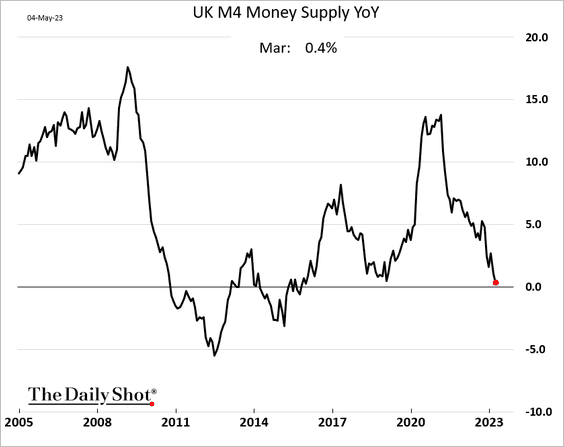
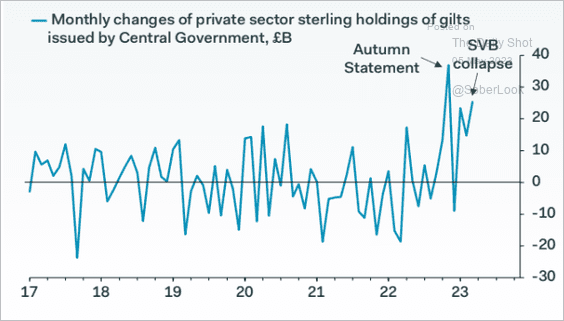
Households have been pulling cash out of their bank accounts.
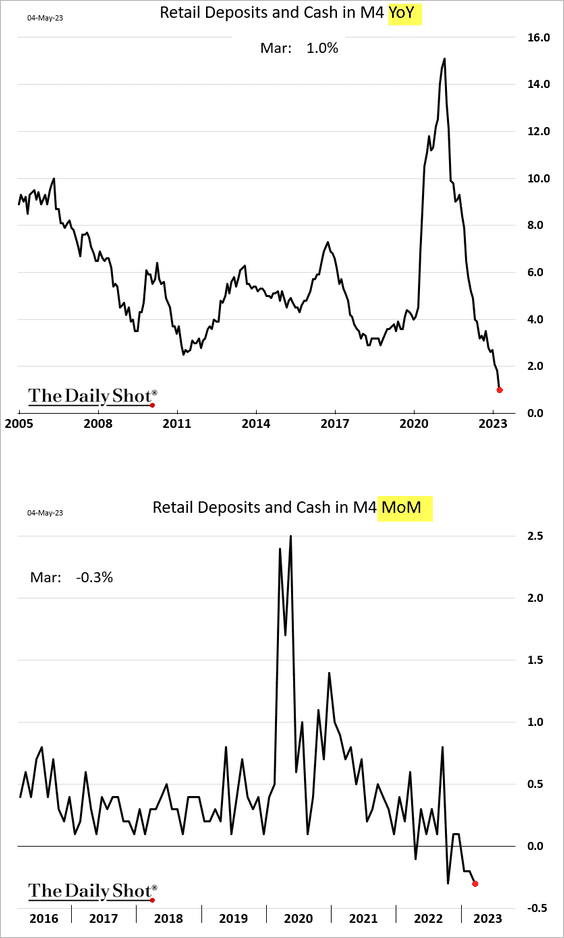
And some have been buying gilts.
 Source: Pantheon Macroeconomics
——————–
2. The final services PMI report was stronger than the flash figure.
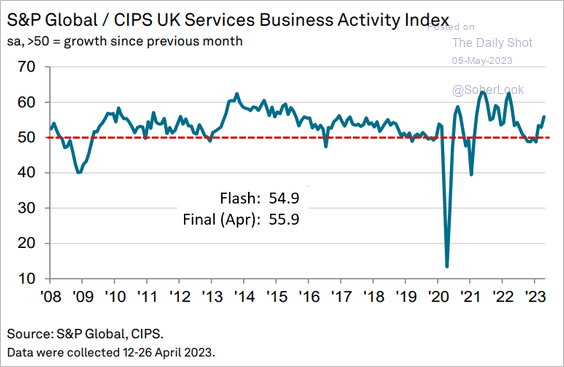 Source: S&P Global PMI
The composite PMI signals a rebound in GDP growth.
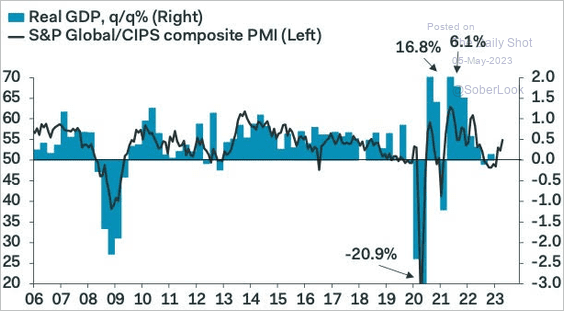 Source: Pantheon Macroeconomics
——————–
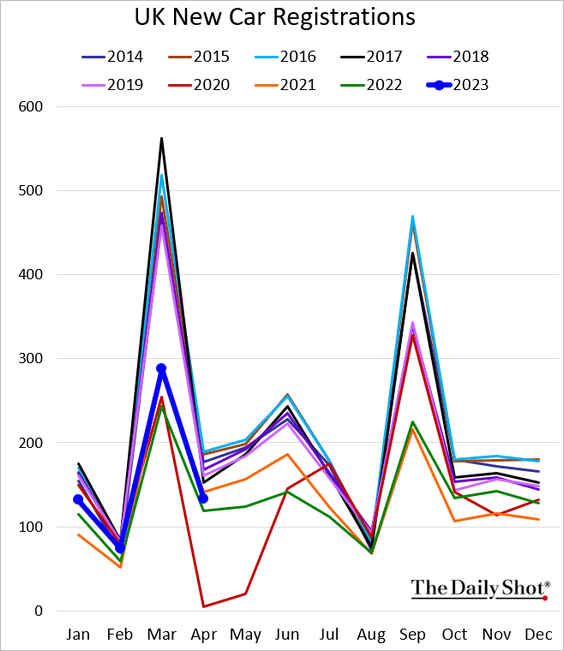
3. New car registrations remain above last year’s levels.
4. What is the general perception of the monarchy among the British population?
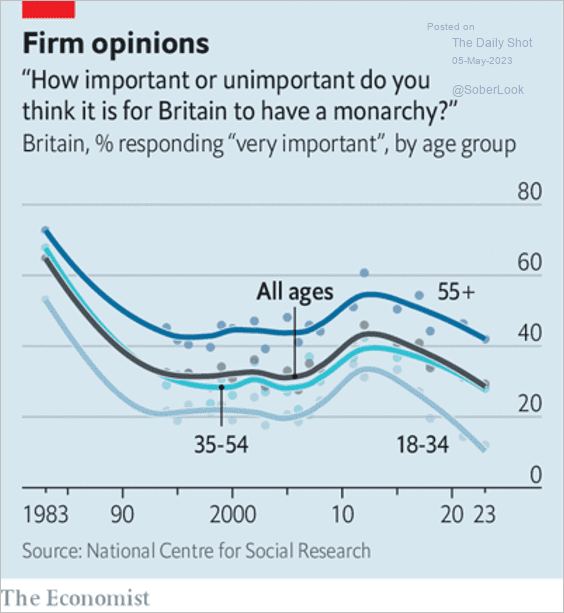 Source: The Economist Read full article
Back to Index
The Eurozone
1. As expected, the ECB hiked rates by 25 bps. But unlike the Fed, the ECB signaled more hikes to come. The market perceived the central bank’s announcement a bit dovish.
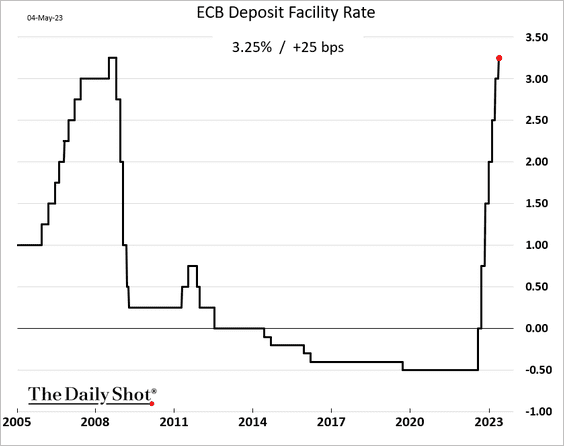
 Source: Reuters Read full article
• Most analysts see just one more rate hike ahead before the end of the cycle. Here is a forecast from Wells Fargo.
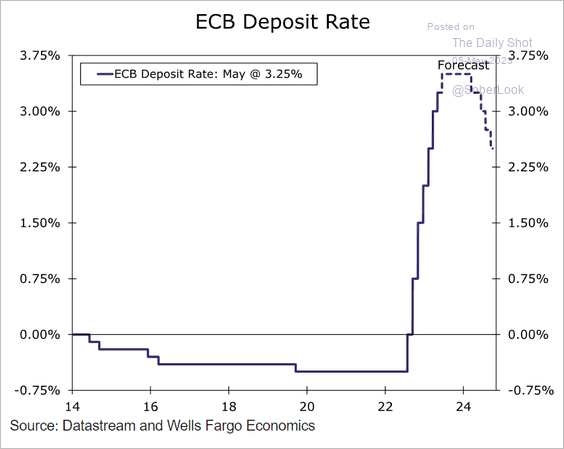 Source: Wells Fargo Securities
Will the ECB overshoot on rate hikes?
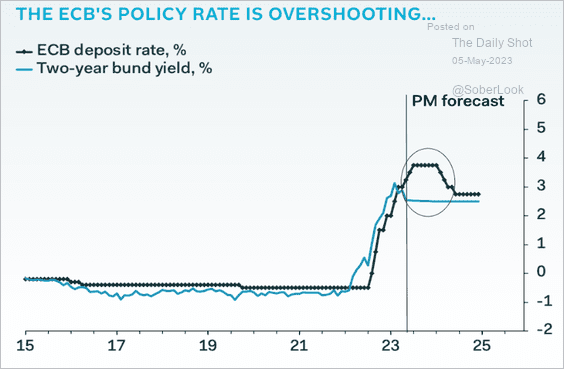 Source: Pantheon Macroeconomics
• The market has tempered the terminal rate expectations.
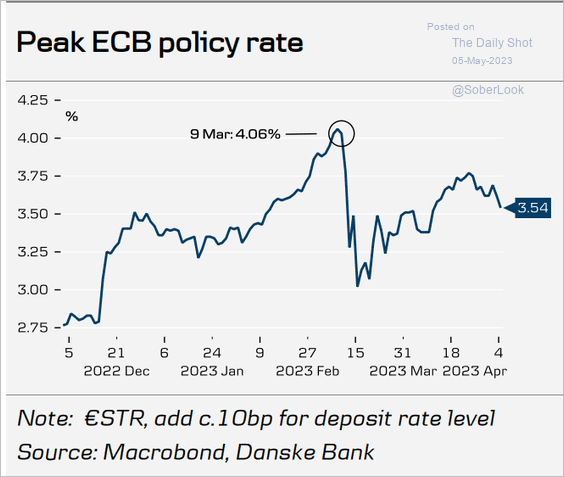 Source: Danske Bank
• The ECB’s policy rate tends to peak close to the Fed’s.
 Source: @CraigStirling, @greg_ritchie, @economics Read full article
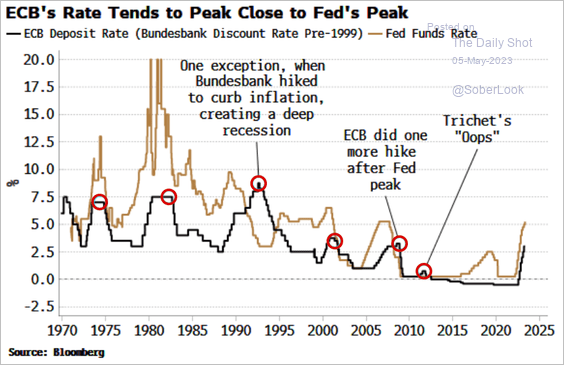 Source: Simon White, Bloomberg Markets Live Blog
——————–
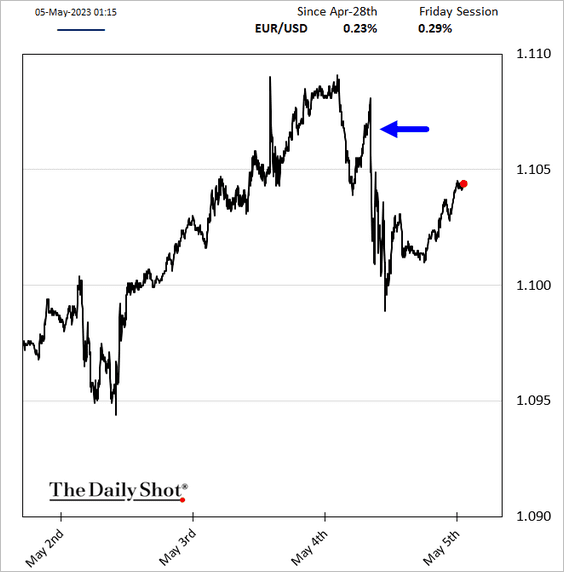
2. The euro eased but has been rebounding this morning.
Bund yields continue to trend lower.
——————–
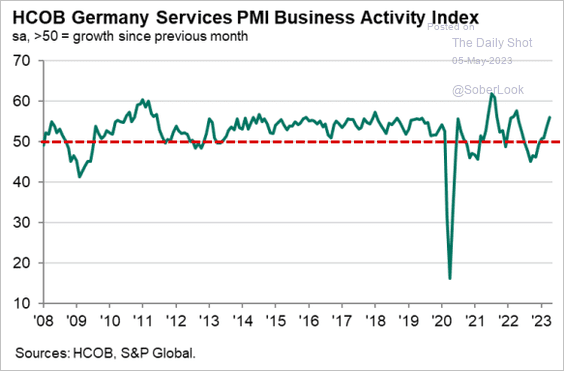
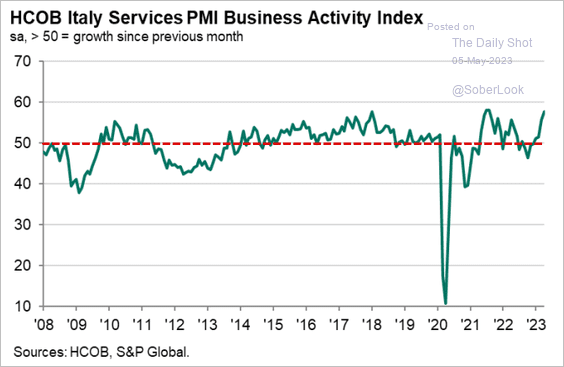
3. As we saw in the flash report, euro-area services PMI was quite strong.
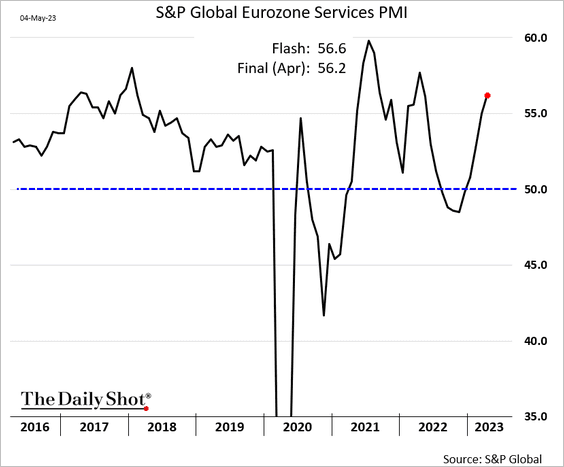
• Germany:
 Source: S&P Global PMI
• Italy:
 Source: S&P Global PMI
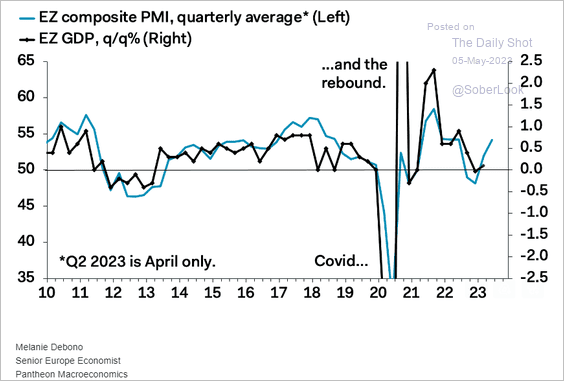
The composite PMI points to a GDP rebound.
 Source: Pantheon Macroeconomics
——————–
4. What are the drivers of weakening loan demand?
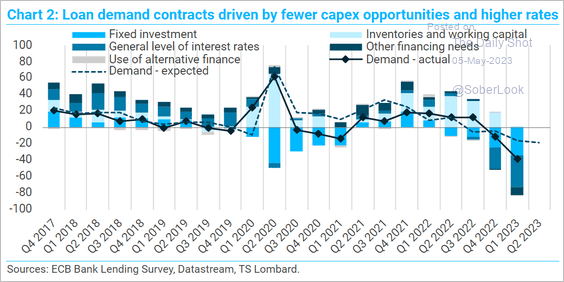 Source: TS Lombard
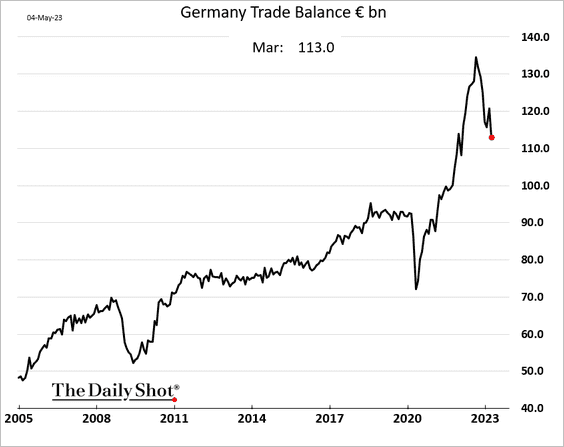
5. Germany’s trade surplus continues to rebound, …
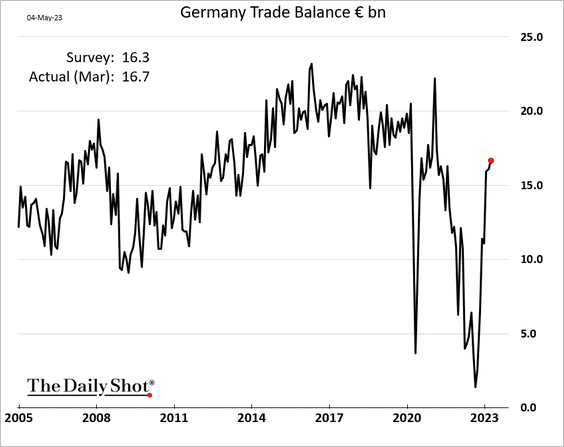
… as imports slow with falling energy costs.
This chart shows the trade balance as a share of Germany’s GDP.
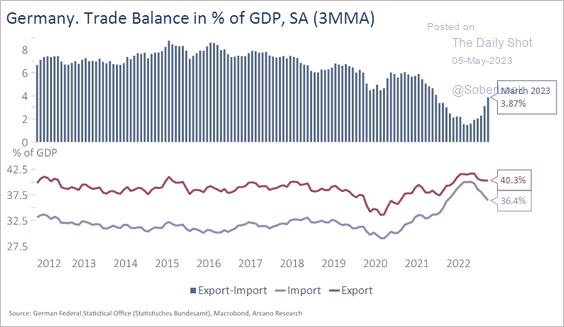 Source: Arcano Economics
Back to Index
Europe
1. Norway’s central bank hiked rates, …
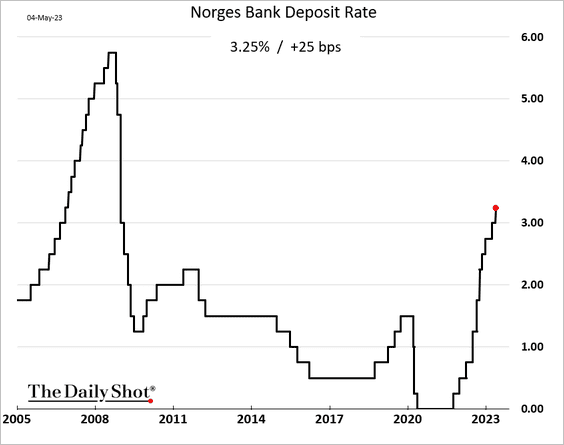
… arresting the krone’s declines (for now).
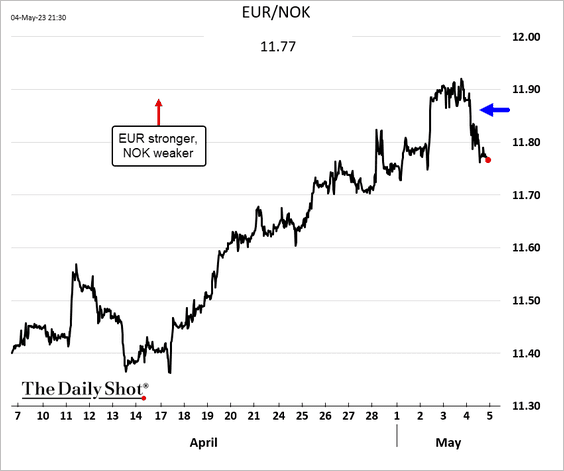
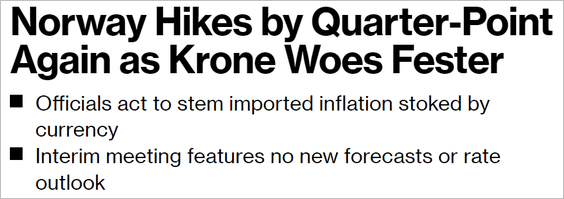 Source: @ottummelas, @economics Read full article
——————–
2. The Danish central bank follows the ECB with a 25bp policy rate hike.
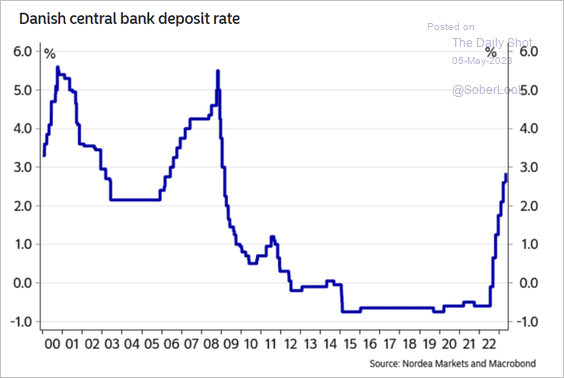 Source: Nordea Markets
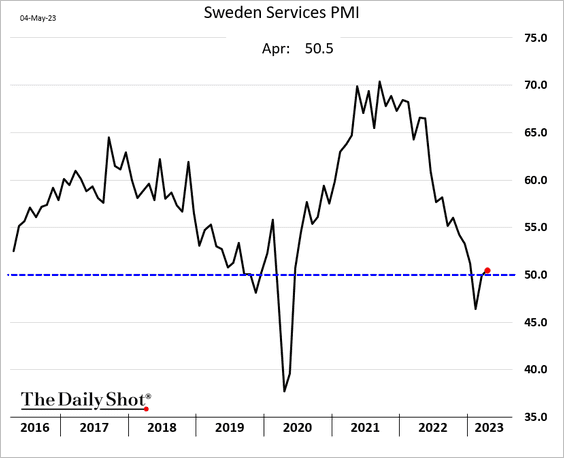
3. Sweden’s services activity is back in growth mode.
Back to Index
Asia-Pacific
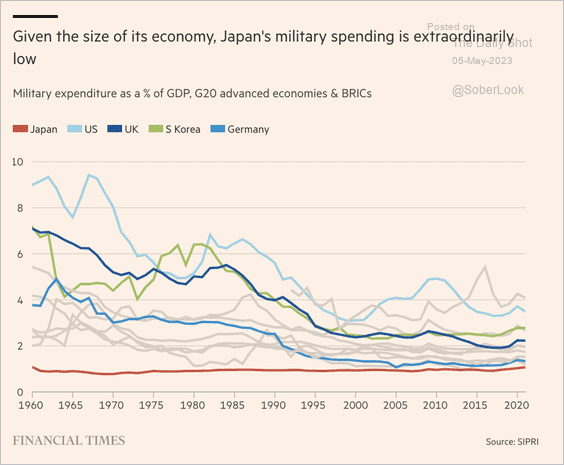
1. Japan’s military spending has been very low relative to the size of its economy.
 Source: @financialtimes Read full article
2. Next, we have some updates on Australia.
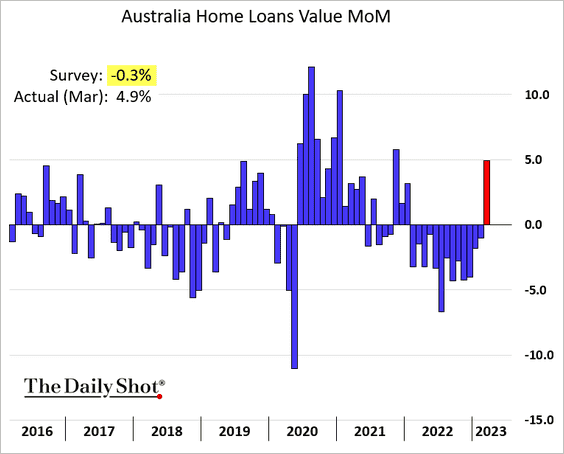
• Mortgage lending unexpectedly jumped in March.
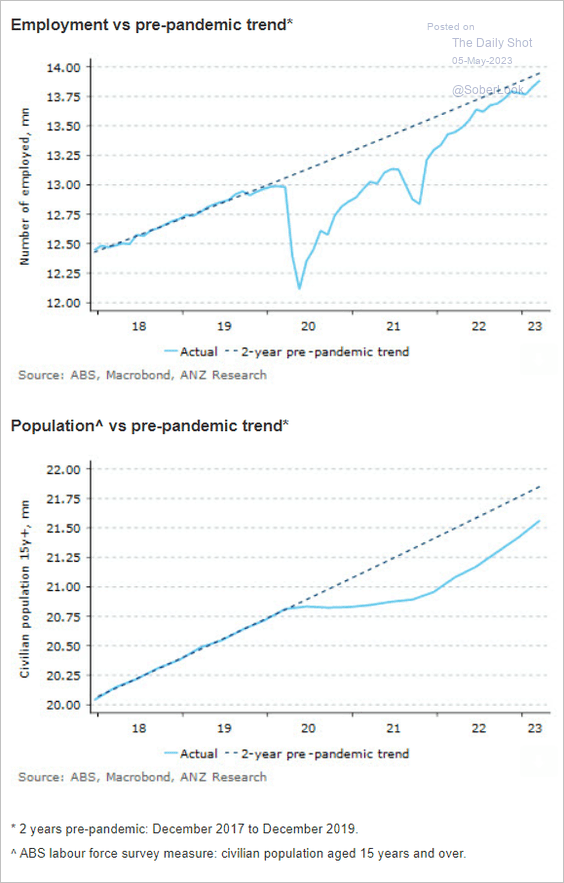
• This chart illustrates why Australia’s labor market is tight.
 Source: @ANZ_Research
Back to Index
China
1. The PMI report from S&P Global showed robust service sector growth.
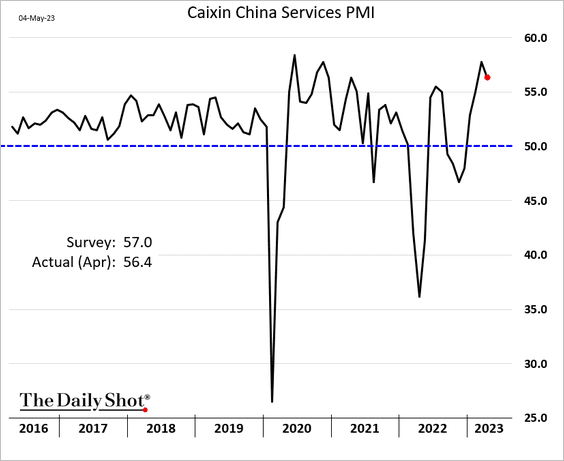
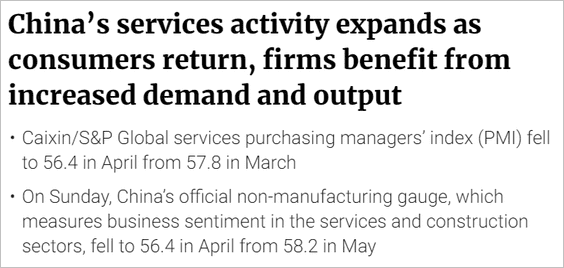 Source: South China Morning Post Read full article
——————–
2. Is consumer spending reverting to its long-term trend?
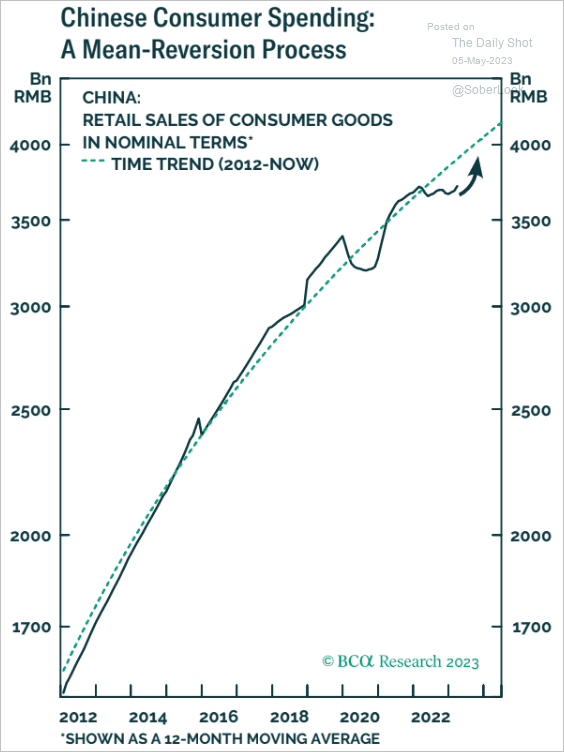 Source: BCA Research
3. A slower saving rate could fuel consumption growth.
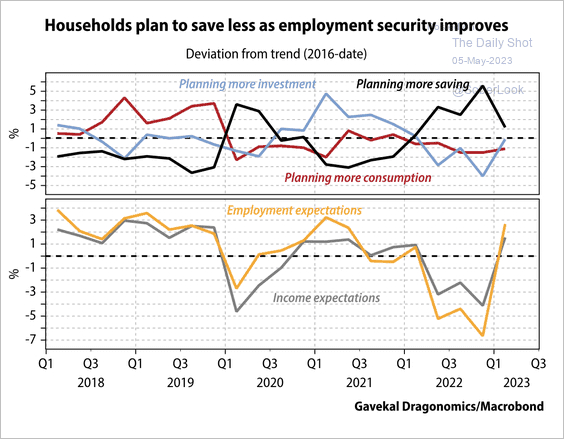 Source: Gavekal Research
4. The business cycle has troughed, supported by a rise in the credit impulse.
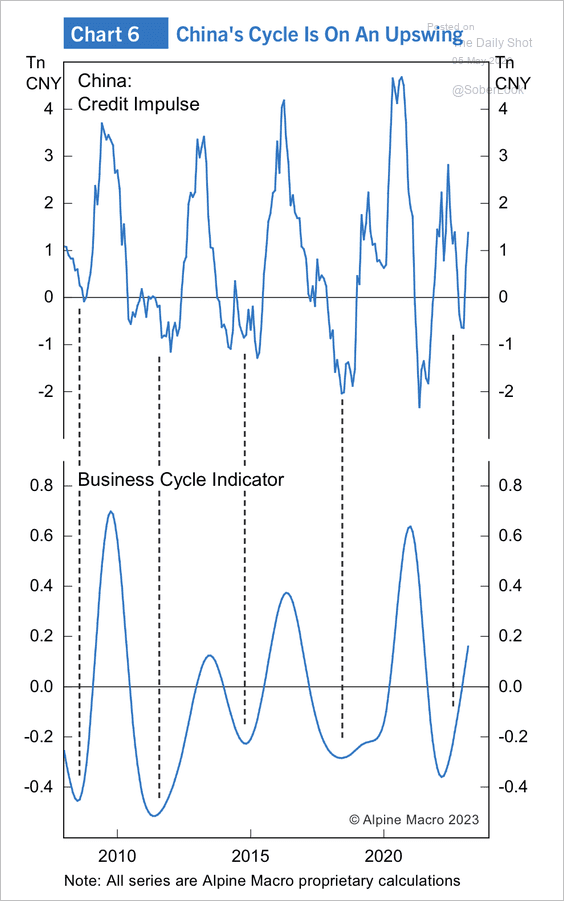 Source: Alpine Macro
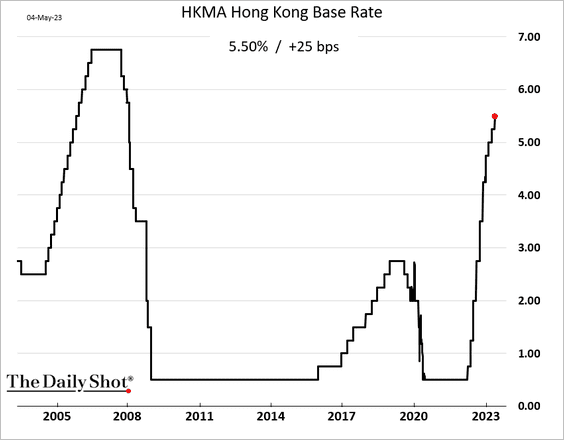
6. Hong Kong followed the Fed with a rate hike.
Back to Index
Emerging Markets
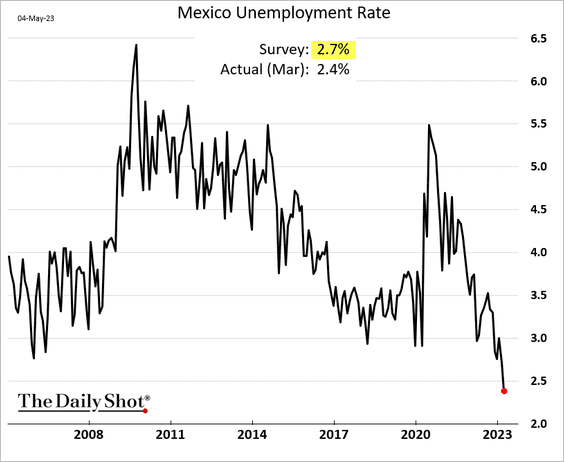
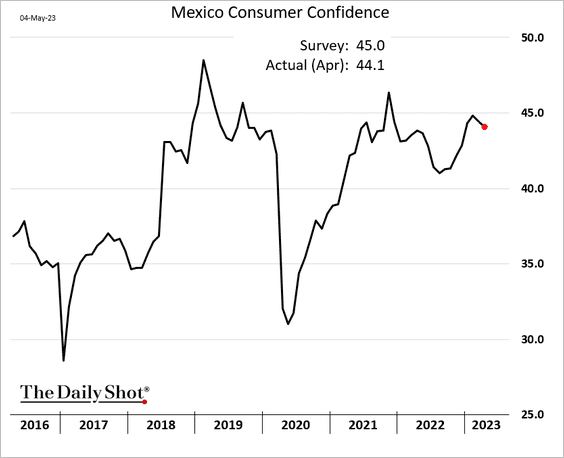
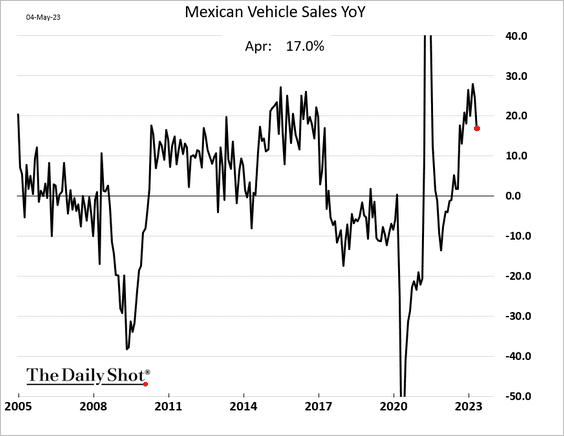
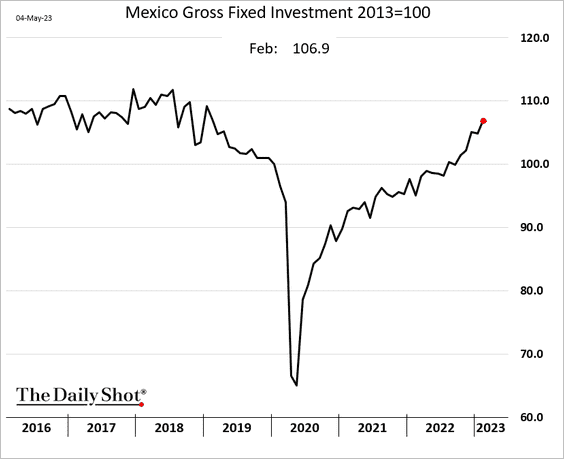
1. Let’s begin with Mexico.
• The unemployment rate hit a new low.
• Consumer confidence edged lower in April.
• Vehicle sales remain well above last year’s levels.
• Fixed investment continues to grow.
——————–
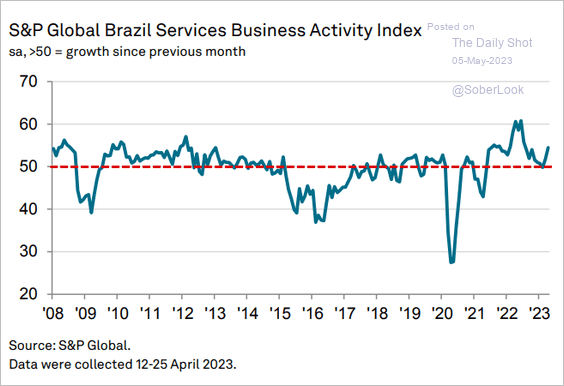
2. Brazil’s service sector growth rebounded last month.
 Source: S&P Global PMI
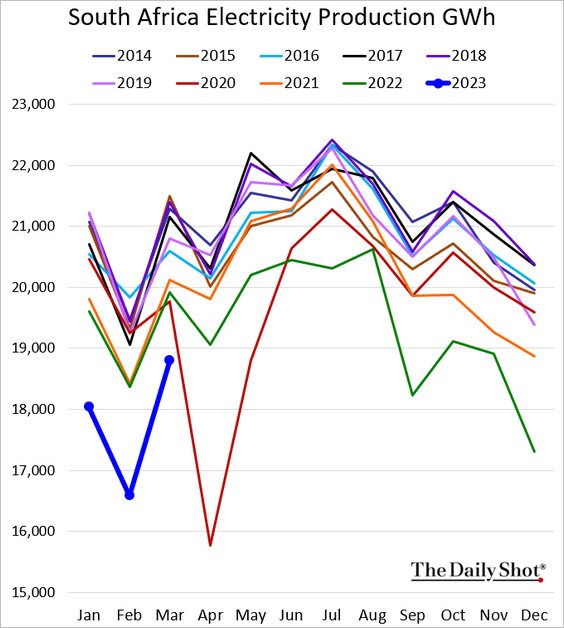
3. South Africa’s electricity production improved in March but remained at multi-year lows for that time of the year.
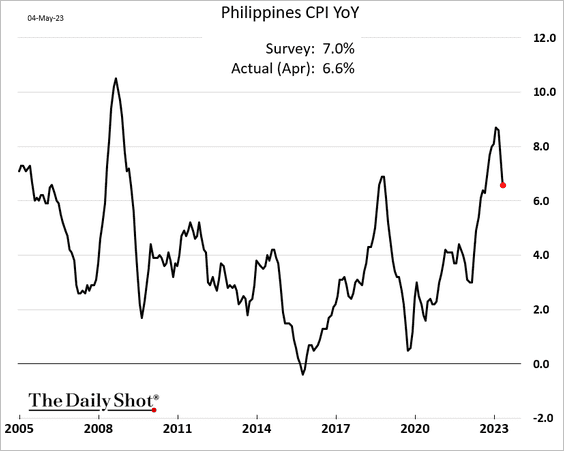
4. The Philippine CPI is moderating.
Back to Index
Cryptocurrency
1. It has been a mixed week for cryptos, with bitcoin roughly flat and XRP underperforming select crypto peers.
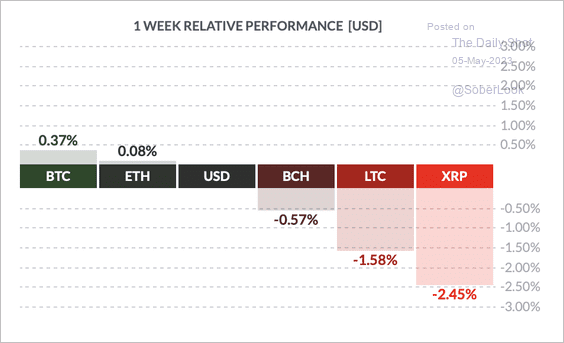 Source: FinViz
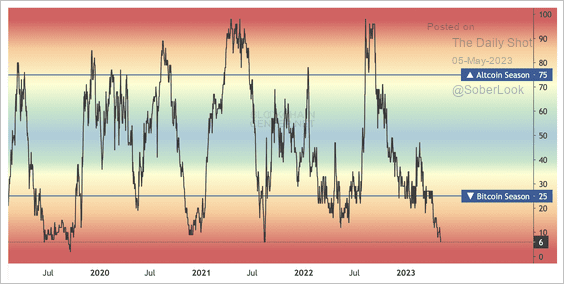
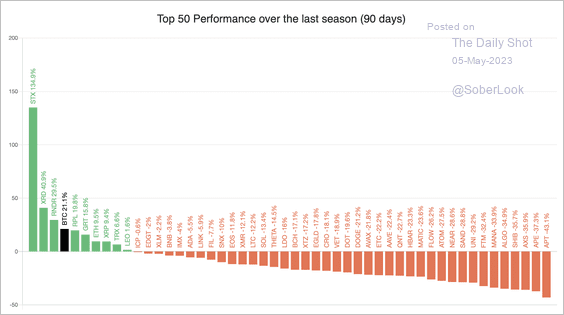
2. Only 6% of the top 50 altcoins have outperformed bitcoin over the past quarter. (2 charts)
 Source: Blockchain Center
 Source: Blockchain Center
3. Here is a look at BTC and ETH average intraday moves versus equity indices over the past quarter. The decline in stock volatility may have encouraged greater risk taking outside of traditional markets.
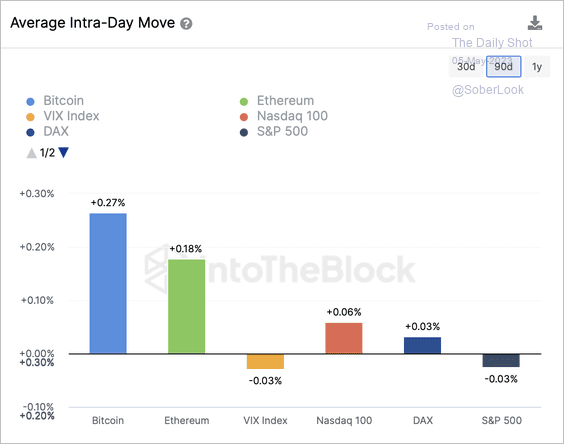 Source: IntoTheBlock
• Some crypto-related stocks saw larger intraday moves than BTC and ETH over the past quarter.
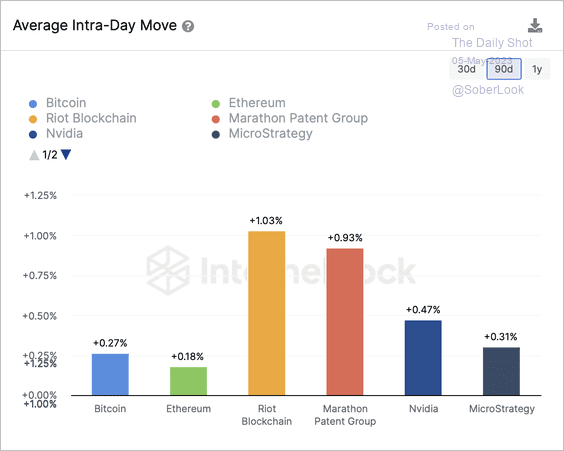 Source: IntoTheBlock
——————–
4. Daily transactions on the Bitcoin blockchain spiked following network upgrades. Developers have been transacting more bitcoin, utilizing block space to test or launch projects. This does not reflect consumer use of BTC for payments.
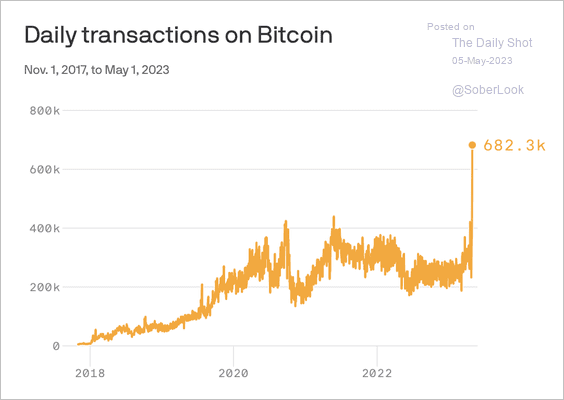 Source: @axios Read full article
Back to Index
Commodities
1. Speculators increased their net-long gold positions as the precious metal outperforms the S&P 500.
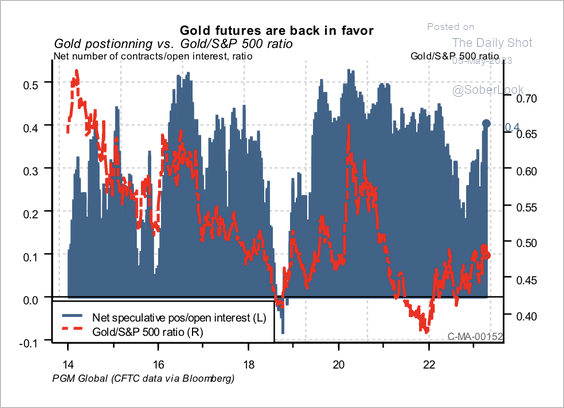 Source: PGM Global
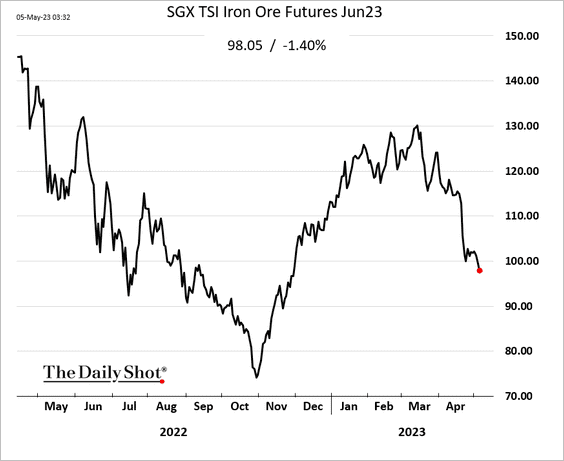
2. Iron ore has rolled over as China’s steel demand and output disappoints.
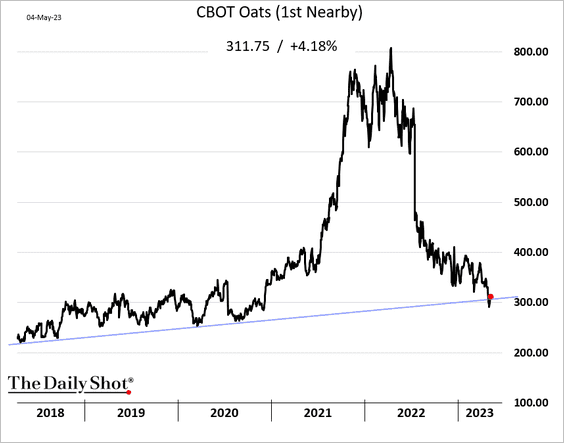
3. US oats futures jumped from the lows on Thursday. Have the prices bottomed?
Back to Index
Energy
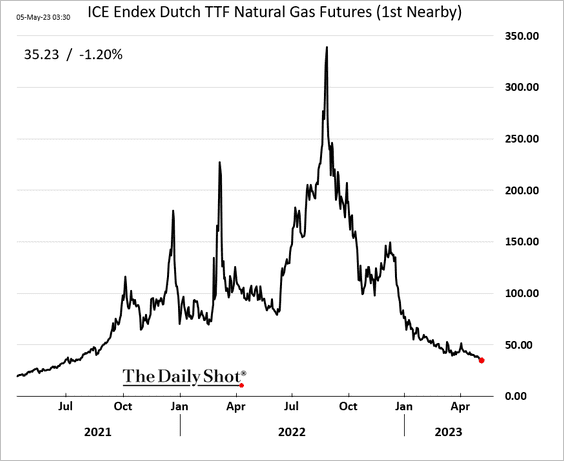
1. The remarkable decline in European natural gas prices continues.
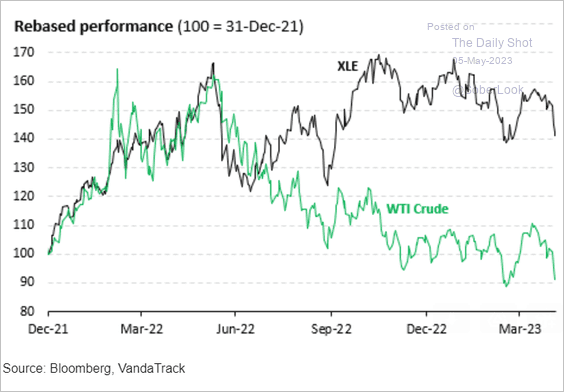
2. US energy shares have held up well relative to crude oil.
 Source: Vanda Research
Back to Index
Equities
1. Shares of regional banks continue to struggle, …
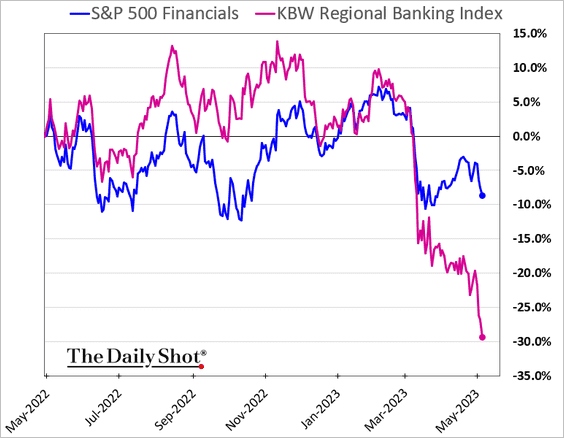
… massively underperforming large banks.
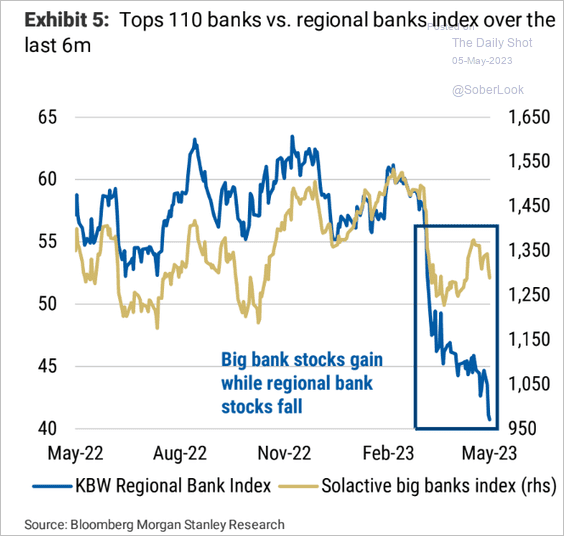 Source: Morgan Stanley Research
Some investors are betting on a short squeeze in regional banks (resulting in a price bounce).
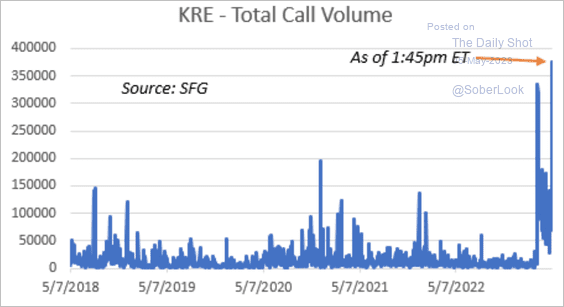 Source: Chris Murphy, Susquehanna International Group
——————–
2. What are the macro drivers of the S&P 500 year-to-date returns?
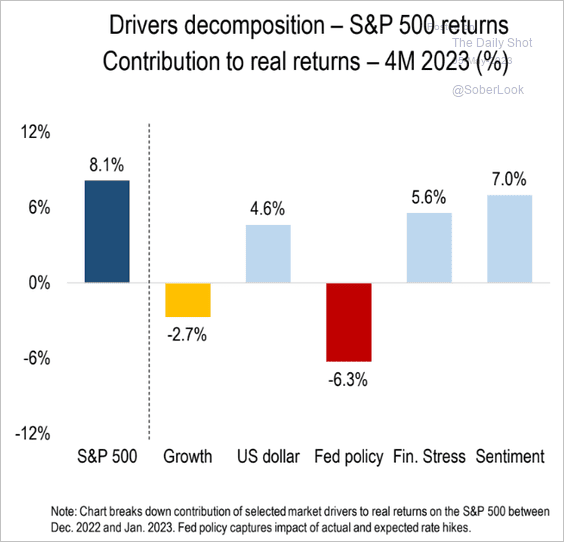 Source: Numera Analytics (@NumeraAnalytics)
3. The S&P 500 has been positively correlated with the Treasury yields, …
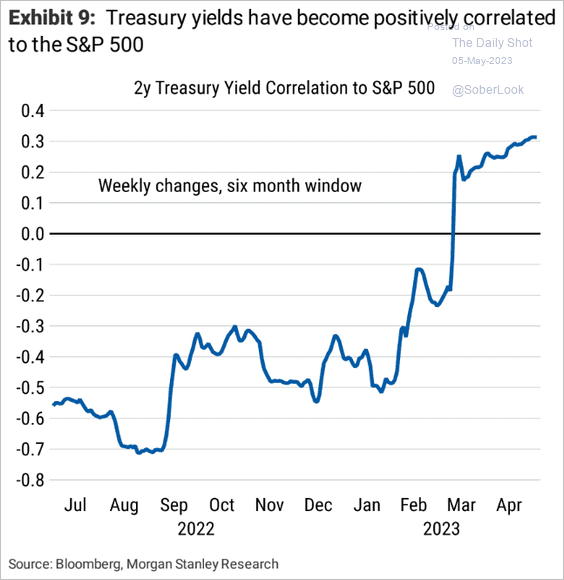 Source: Morgan Stanley Research
… and remain negatively correlated with the US dollar.
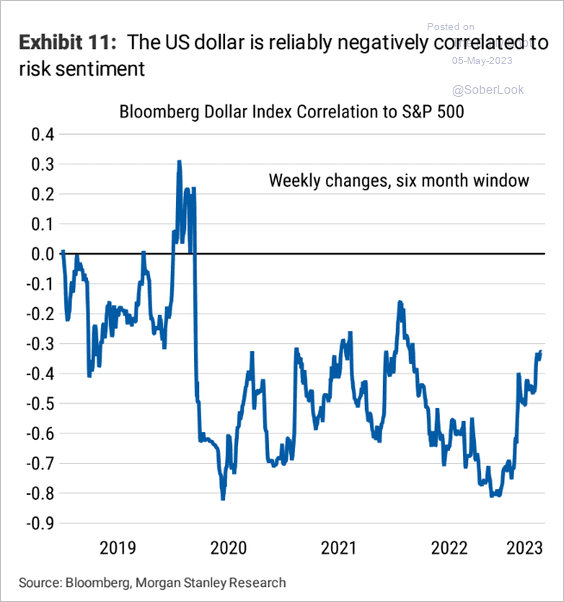 Source: Morgan Stanley Research
——————–
4. Tech-focused funds have not seen meaningful outflows since 2018.
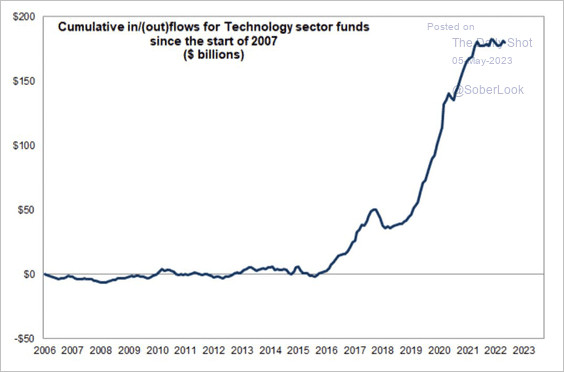 Source: Goldman Sachs; @Marlin_Capital
5. What’s wrong with this picture?
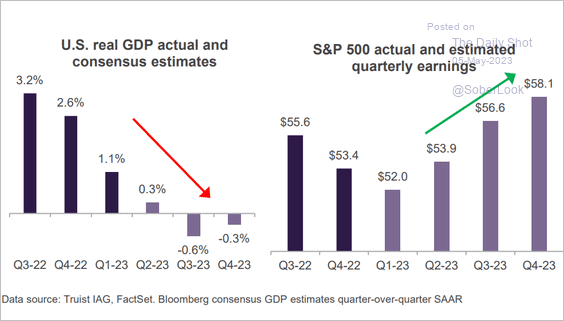 Source: Truist Advisory Services
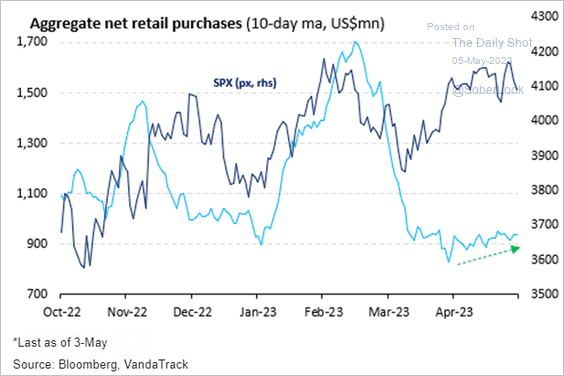
6. Retail purchases of stocks and ETFs are relatively low but have started to trend higher.
 Source: Vanda Research
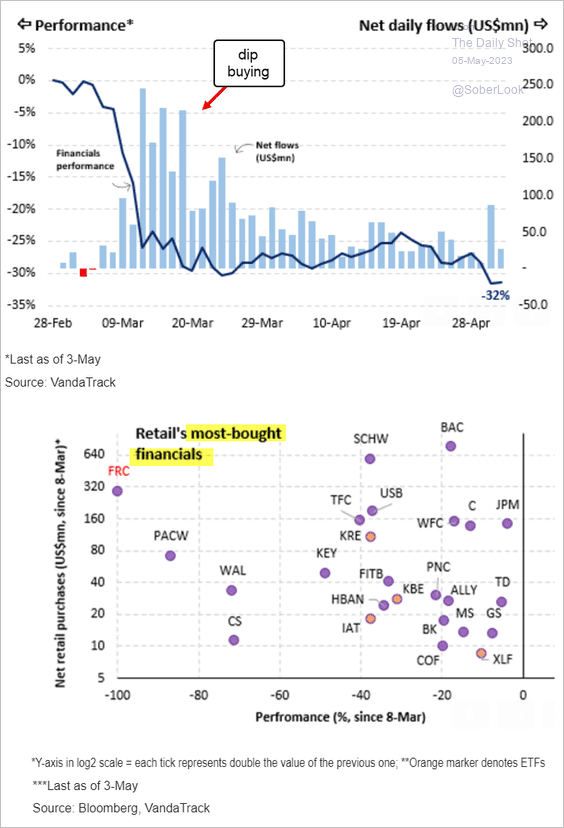
Retail investors have been getting burned on financials.
 Source: Vanda Research
——————–
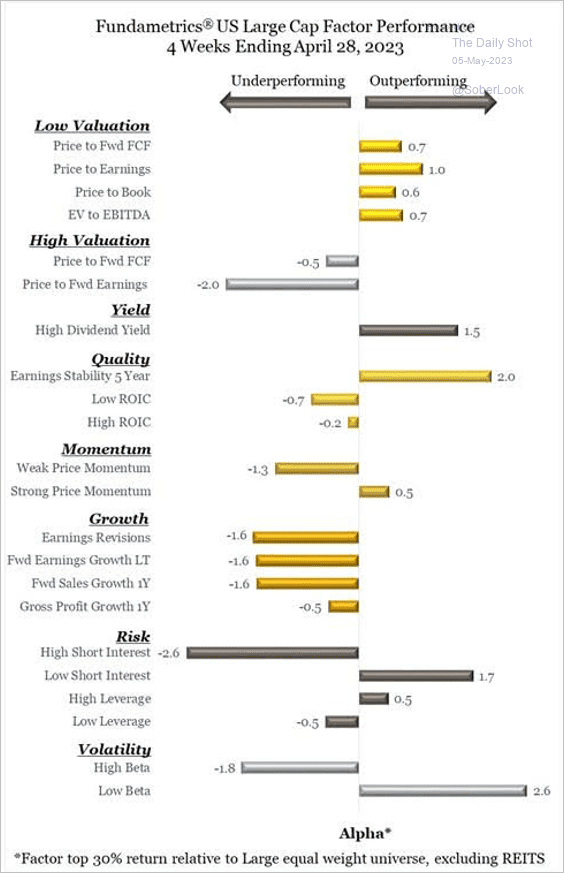
7. The chart below provides a comprehensive breakdown of factor performance in April.
 Source: CornerCap Institutional
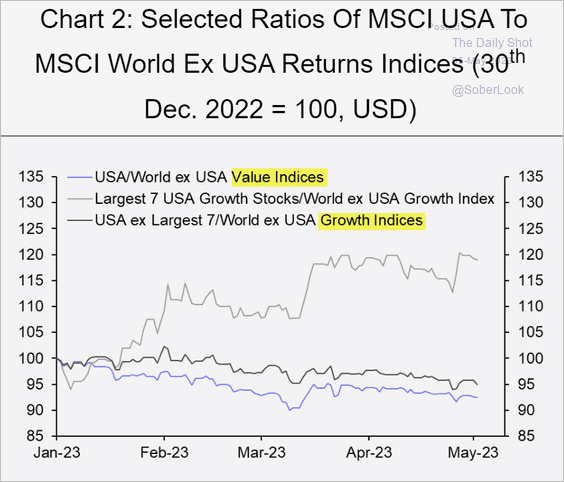
8. US equities’ outperformance vs. global peers is driven by the largest seven growth stocks. Without the mega-caps, both growth and value indices underperform international shares.
 Source: Capital Economics
:
Back to Index
Credit
1. The Fed’s official emergency funding balances for banks declined sharply this week, …
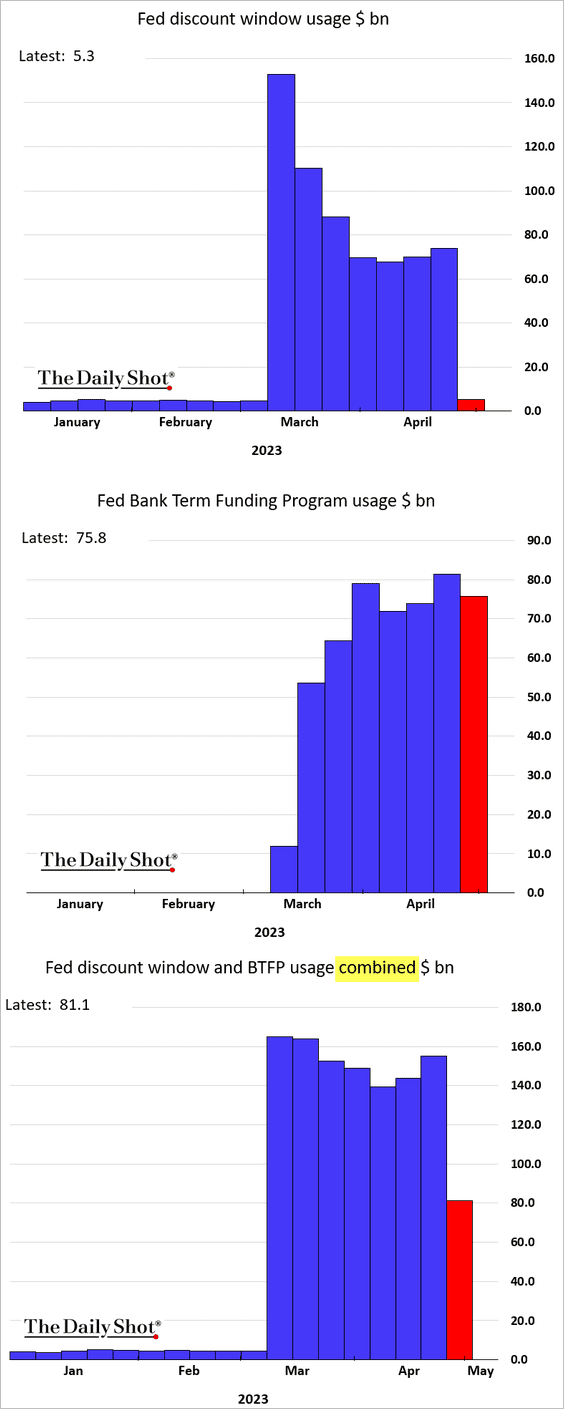
… as financing for First Republic Bank at the discount window and BTFP was shifted to “other credit extensions”
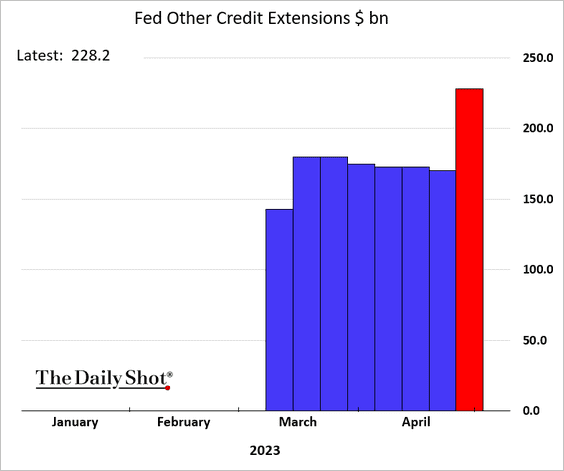
 Source: @catarinasaraiva, @markets Read full article
——————–
2. Americans are uneasy about their bank deposits.
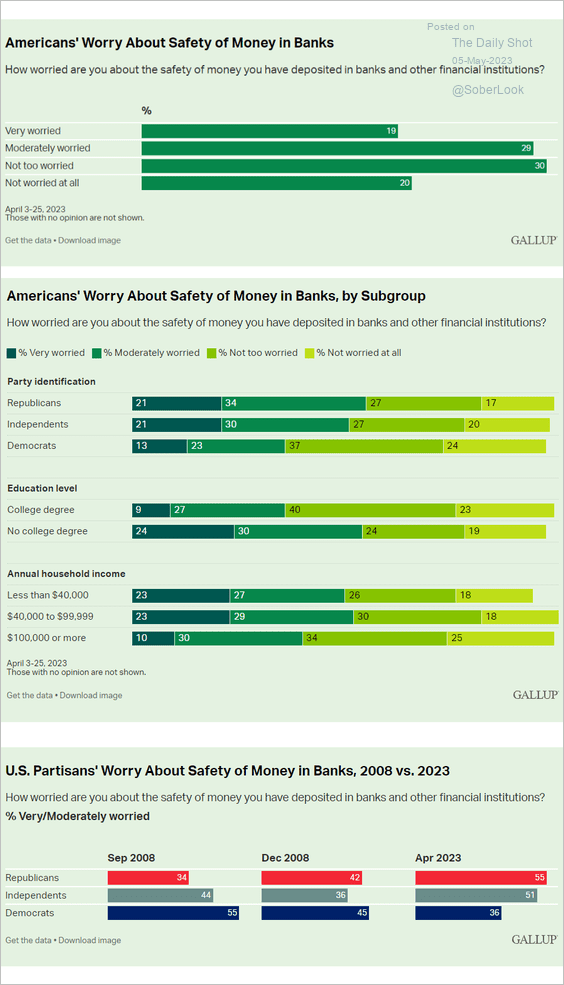 Source: Gallup Read full article
3. This chart shows net rating changes by sector in March.
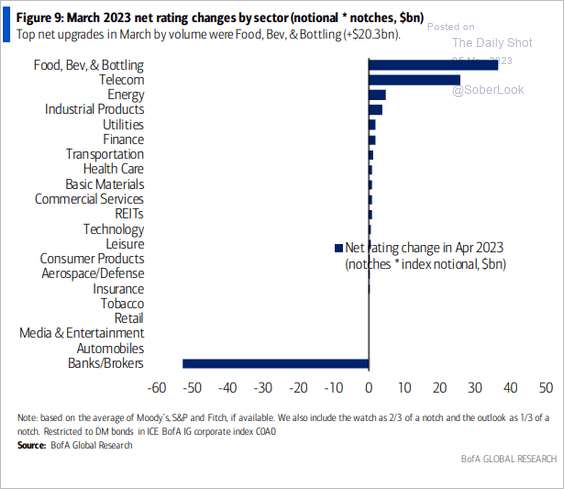 Source: BofA Global Research
4. Office properties and malls represent a relatively small component of non-residential structure investments.
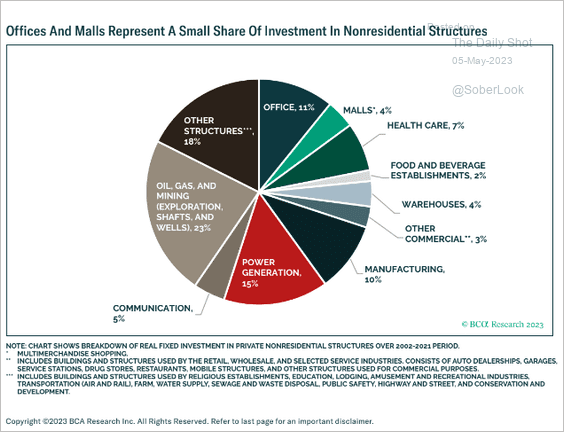 Source: BCA Research
Back to Index
Rates
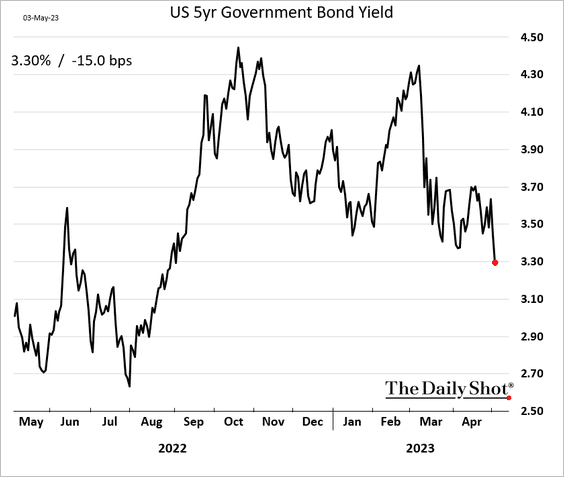
1. Treasuries continue to rally, especially intermediate maturities.
2. The 2-year Treasury yield is now well below the fed funds rate.
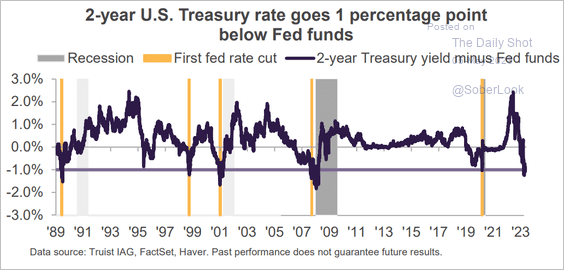 Source: Truist Advisory Services
3. The Fed and commercial banks are shedding duration, pushing it out into the market.
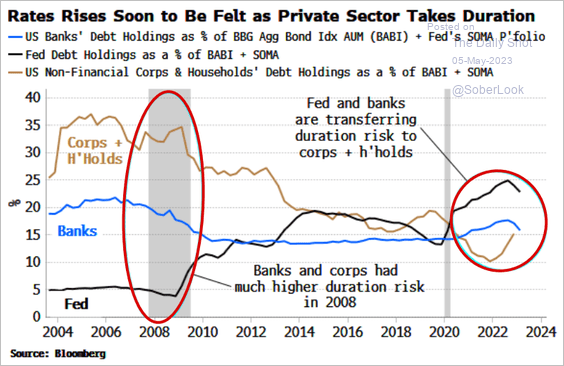 Source: Simon White, Bloomberg Markets Live Blog
Back to Index
Global Developments
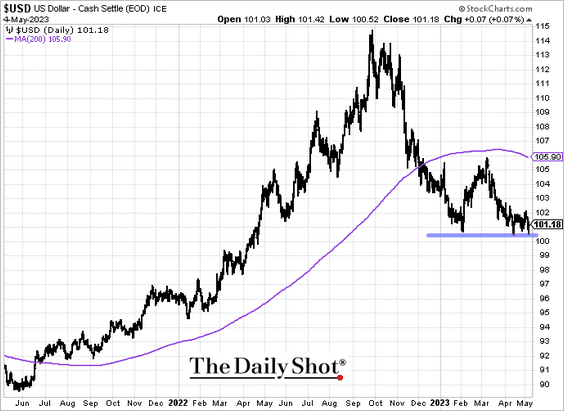
1. The dollar index (DXY) is testing support around its February lows, although upside remains capped at the 200-day moving average.
• The dollar remains overvalued relative to its purchasing power parity (PPP) exchange rate.
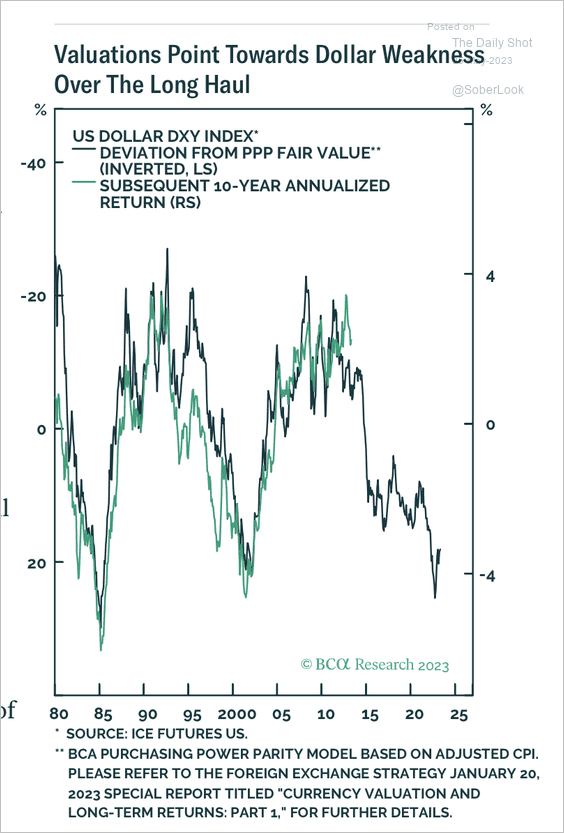 Source: BCA Research
• Economic weakness in the US relative to the rest of the world and narrower interest rate differentials could weigh on the dollar. (2 charts)
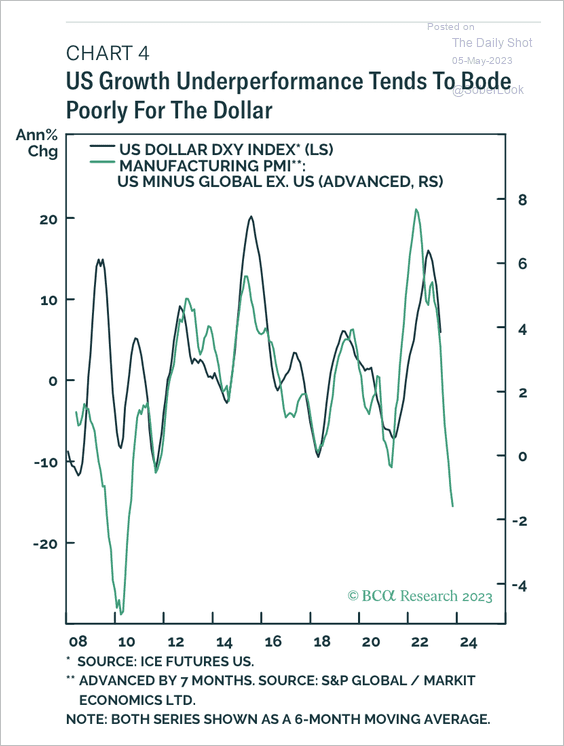 Source: BCA Research
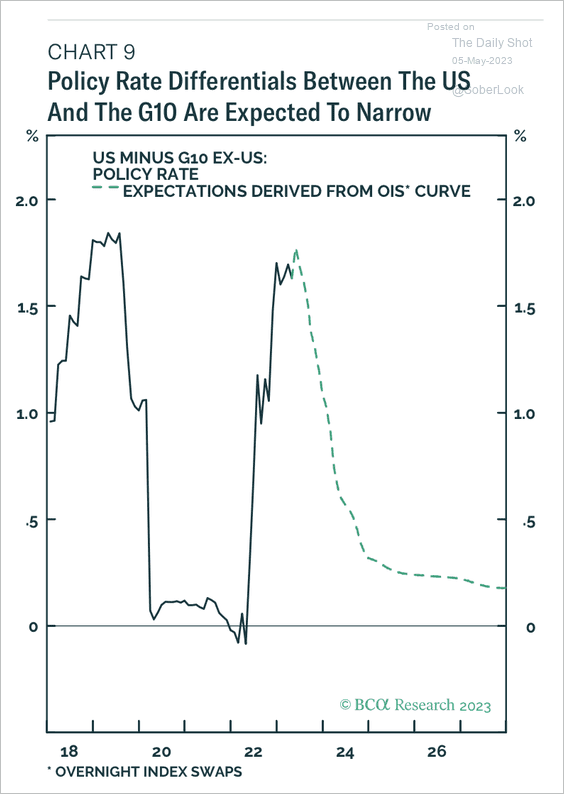 Source: BCA Research
——————–
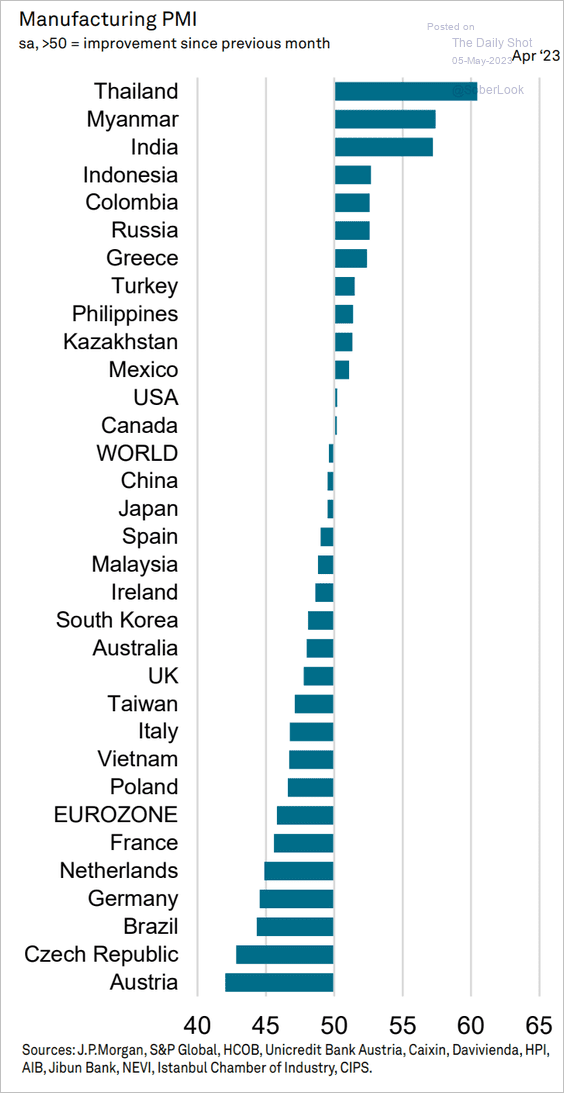
2. The global manufacturing PMI registered a small contraction in April.
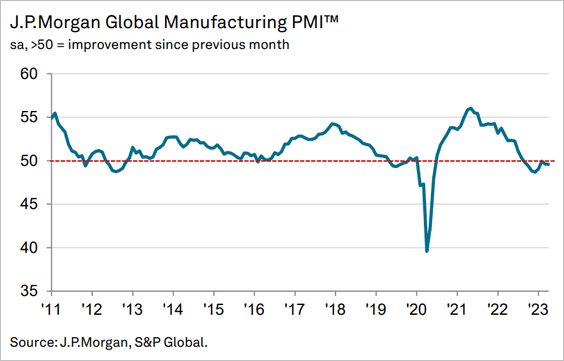
This chart shows the April manufacturing PMIs by country (the definition of PMI is available here).
 Source: S&P Global PMI
——————–
Food for Thought
1. US semiconductor projects:
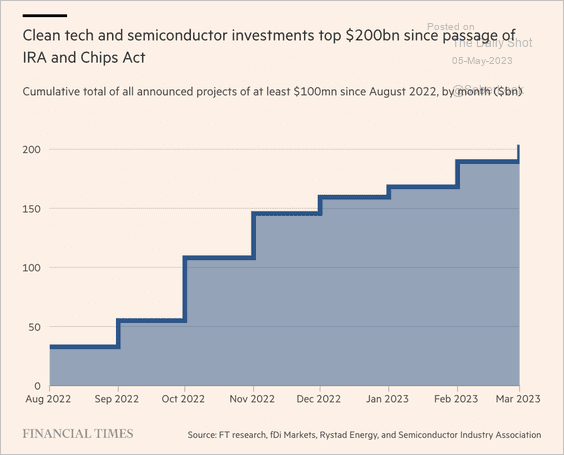 Source: @financialtimes Read full article
2. Objects in the low Earth orbit:
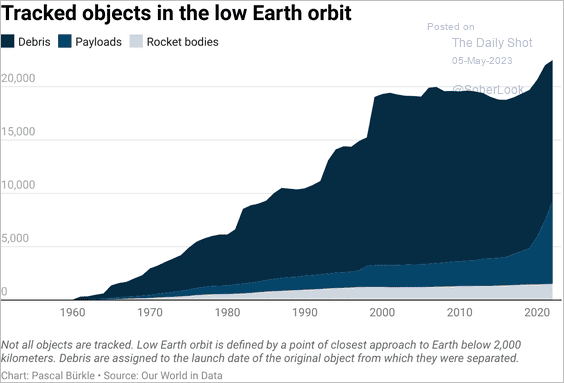 Source: @Datawrapper
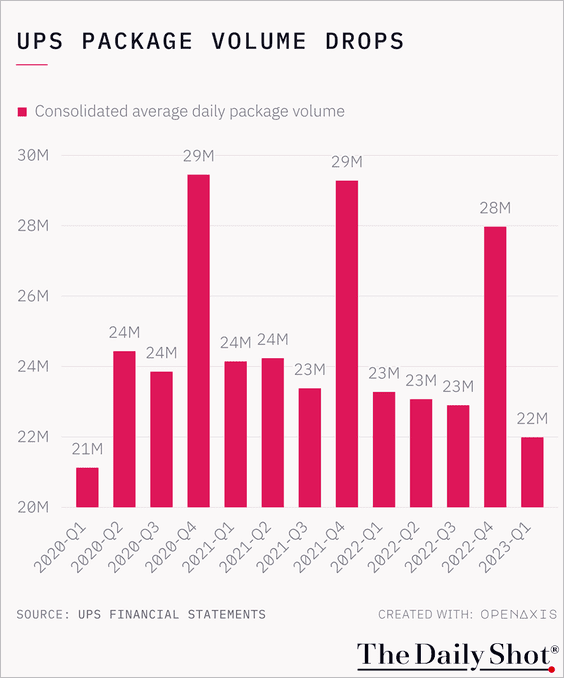
3. UPS package volume:
 Source: @TheDailyShot
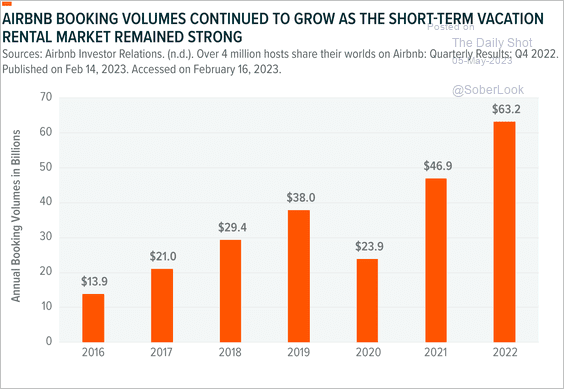
4. Airbnb booking volumes:
 Source: Global X ETFs Read full article
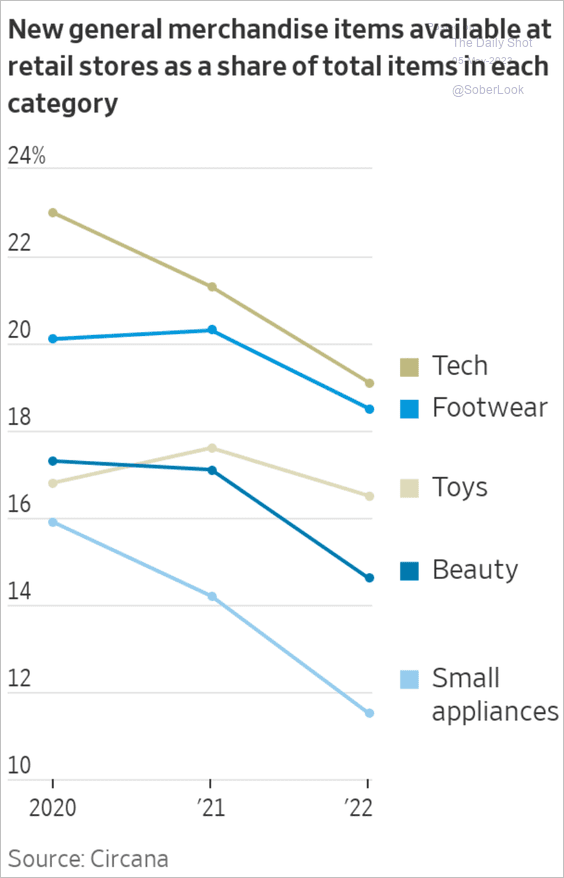
5. New products as a share of total retail items:
 Source: @WSJ Read full article
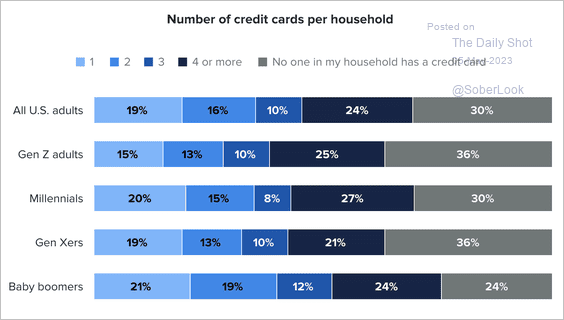
6. Number of credit cards per household:
 Source: Morning Consult Read full article
7. The happiest countries:
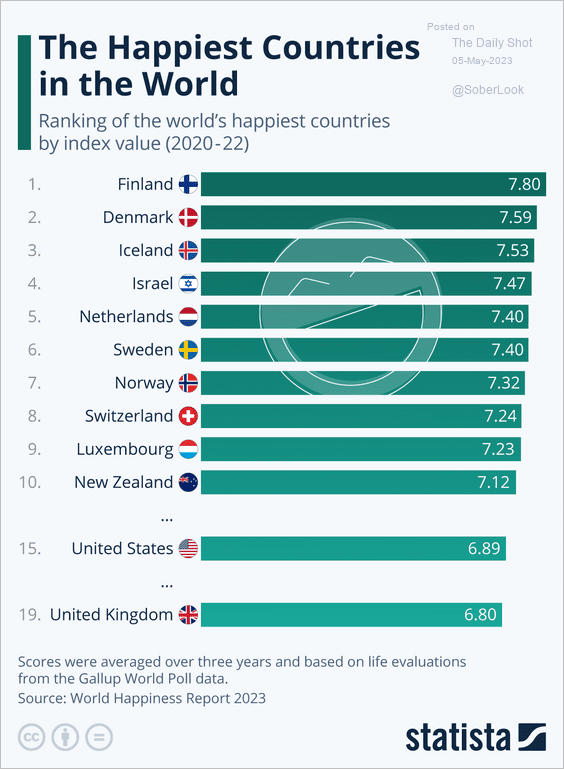 Source: Statista
8. The British line of succession:
 Source: Time Read full article
——————–
Have a great weekend!
Back to Index