
The Daily Shot: 24-May-23
• The United States
• Canada
• The United Kingdom
• The Eurozone
• Asia-Pacific
• China
• Emerging Markets
• Commodities
• Energy
• Equities
• Alternatives
• Credit
• Rates
• Global Developments
• Food for Thought
The United States
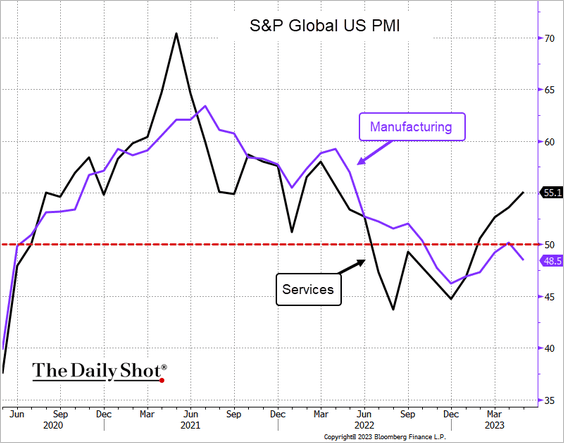
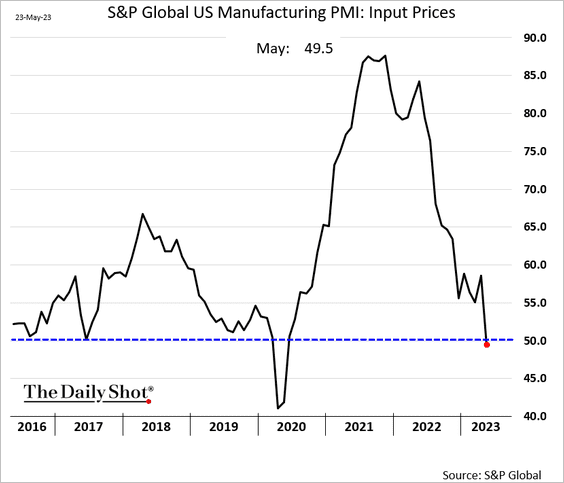
1. The May flash PMI report from S&P Global showed a contraction in US factory activity.
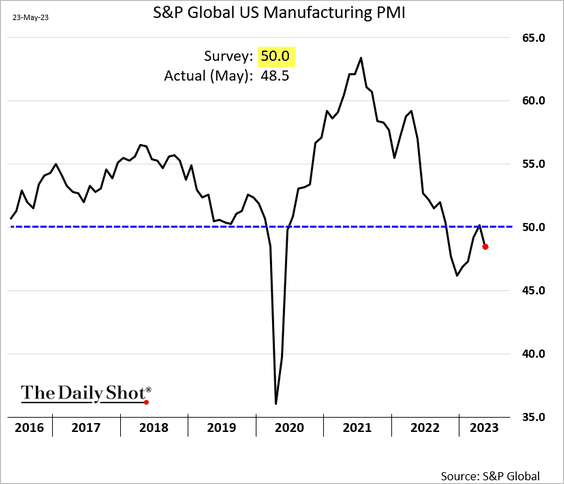
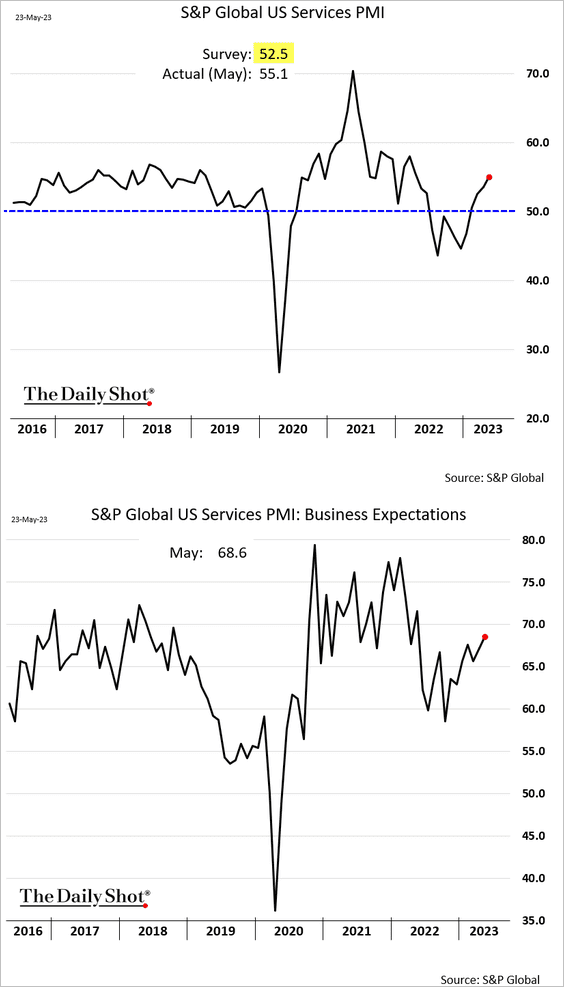
But service-sector growth strengthened.
This divergence is a global phenomenon, with the Eurozone, the UK, Japan, and Australia experiencing similar trends.
 Source: S&P Global PMI; @TheTerminal, Bloomberg Finance L.P.
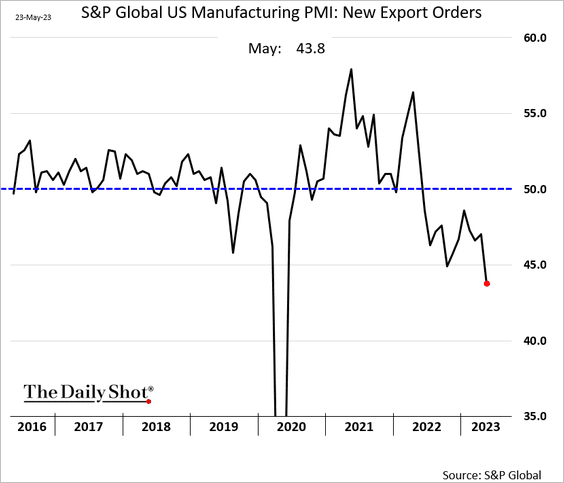
• The manufacturing export orders index is crashing.
• Factory input costs are now falling.
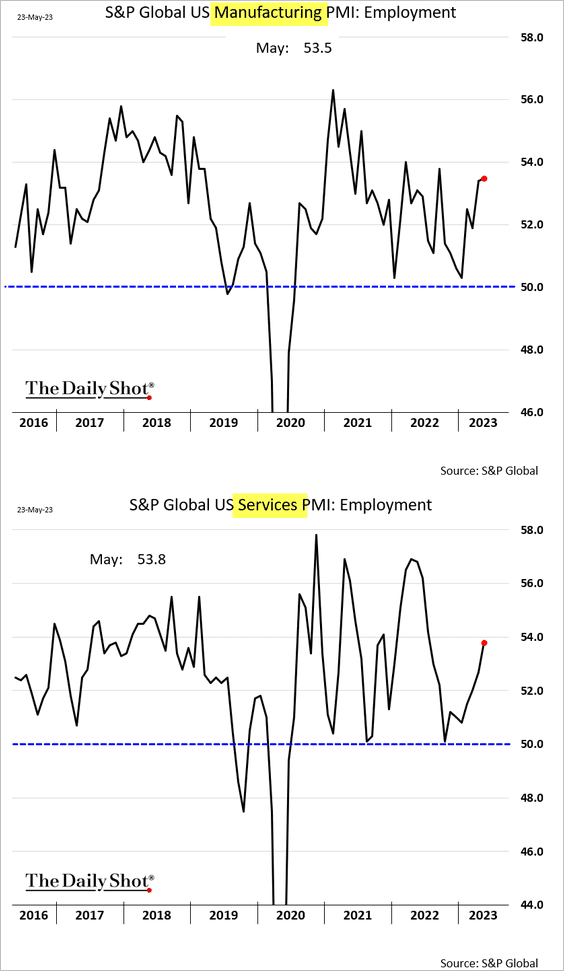
• Employment in both manufacturing and services remains robust.
——————–
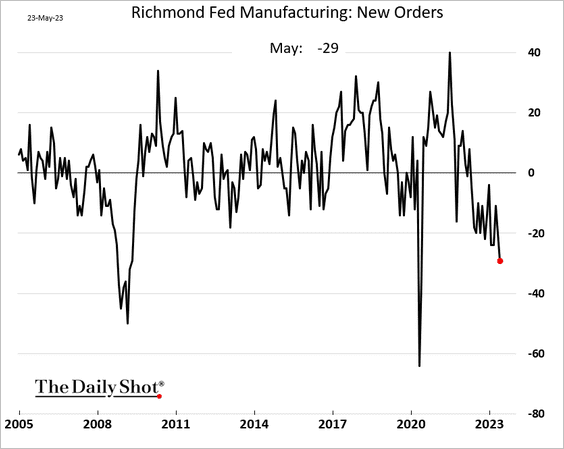
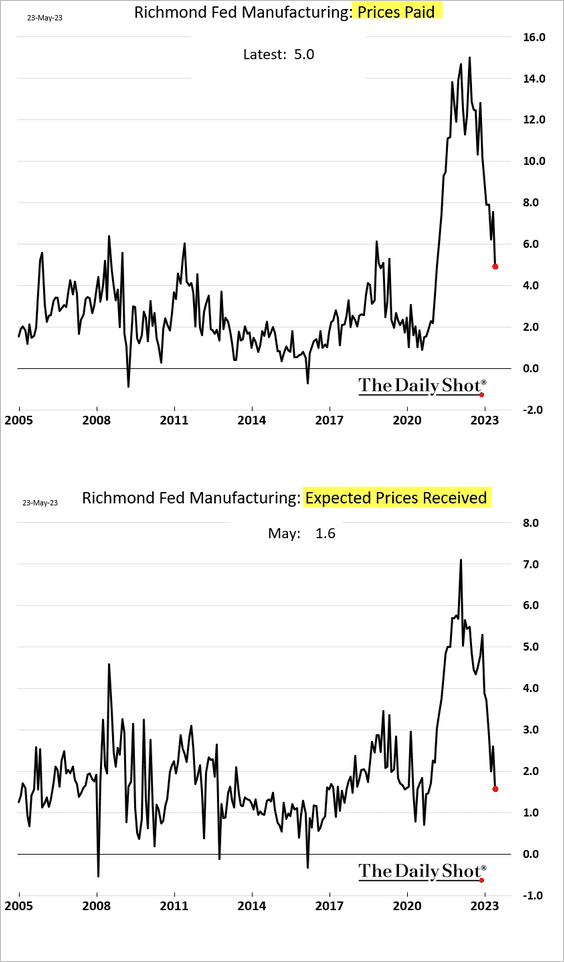
2. The Richmond Fed’s regional manufacturing index showed slowing activity, …
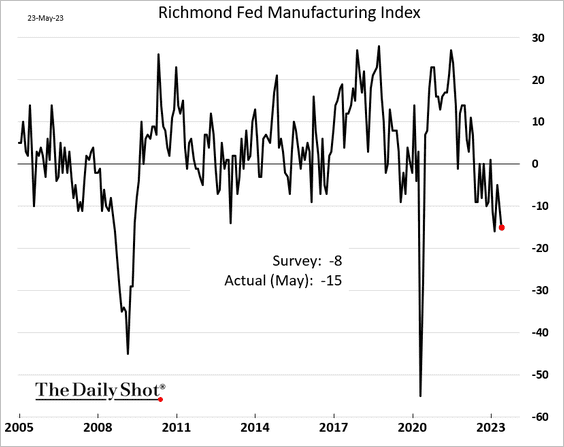
… as demand craters.
• Fewer companies are boosting wages.
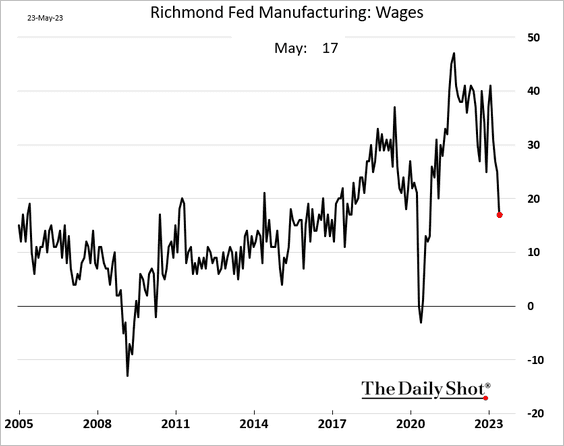
• Price pressures are easing.
——————–
3. New home sales were stronger than expected in April, rising 10.7% above 2022 levels.
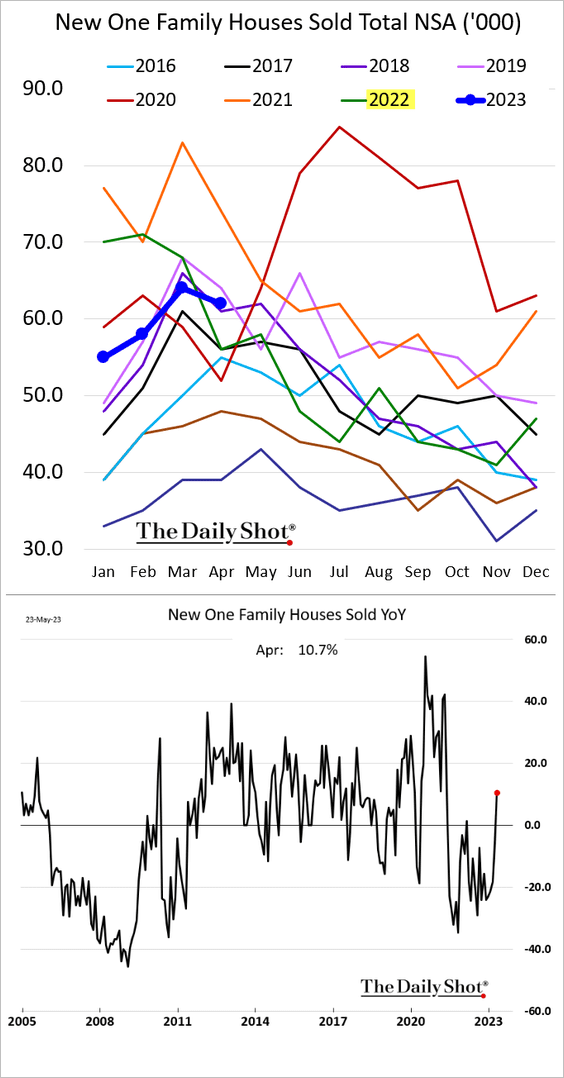
• Inventories of new homes dipped below last year’s levels.
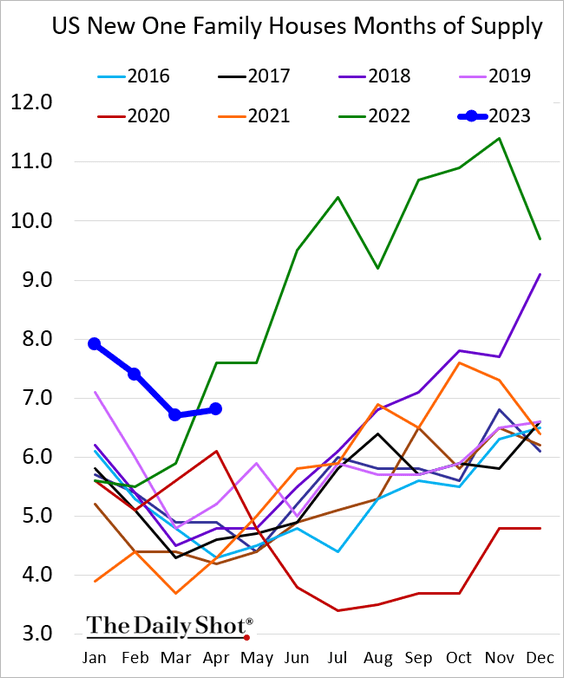
However, the market for new houses is not nearly as tight as with existing homes, …
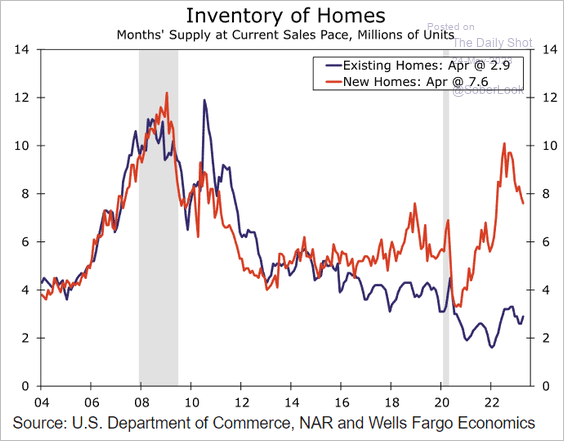 Source: Wells Fargo Securities
… contributing to sustained sales performance.
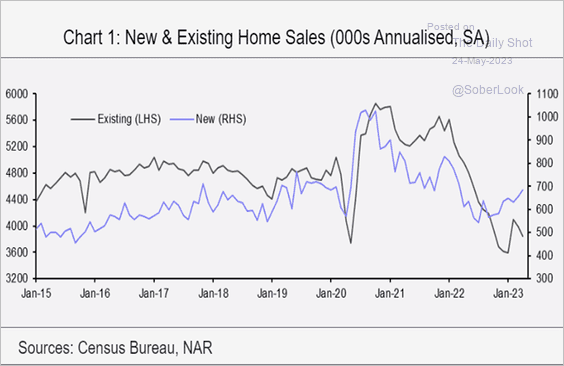 Source: Capital Economics
• The median new home price is down 8% year-over-year.

• This chart shows new home sales by stage of construction.
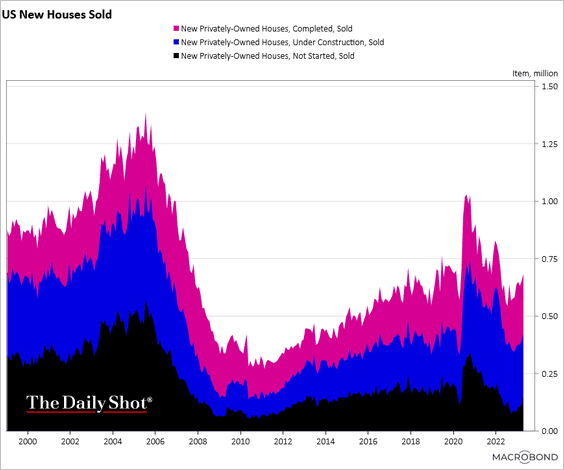 Source: Chart and data provided by Macrobond
——————–
4. Next, we have some updates on the debt ceiling situation.
• Here is Deutsche Bank’s forecast for the US Treasury’s cash levels. Early June looks problematic.
 Source: Deutsche Bank Research
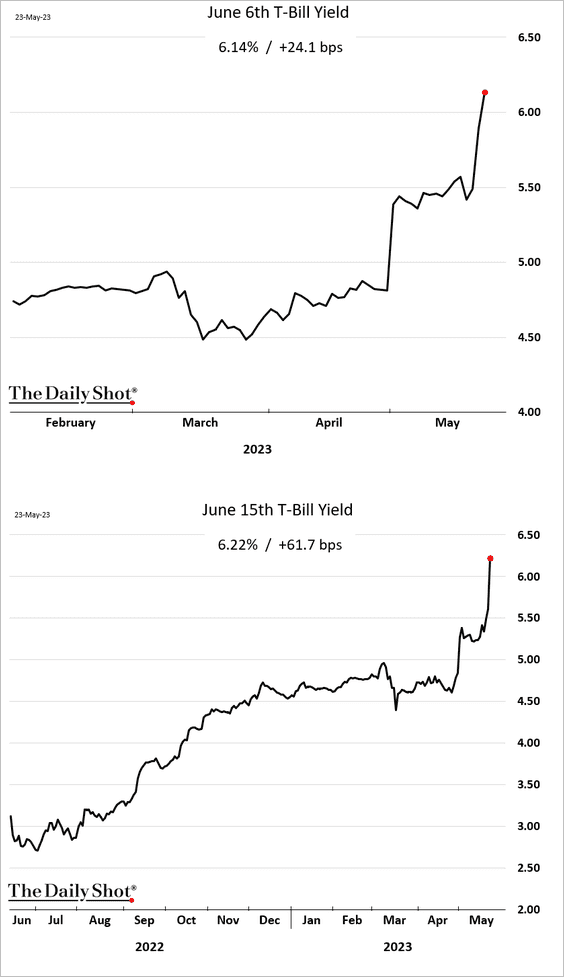
• Some T-bill yields exceeded 6% as the X-date approaches.
 Source: @purviso, @markets Read full article

• The T-bill market response has been faster and more severe than in previous debt ceiling episodes.
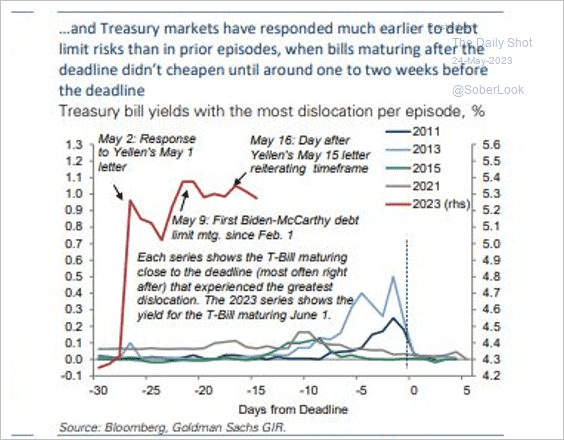 Source: Goldman Sachs
• The window of opportunity for reaching a deal is rapidly closing. Here is a look at the congressional calendar.
 Source: Deutsche Bank Research
Back to Index
Canada
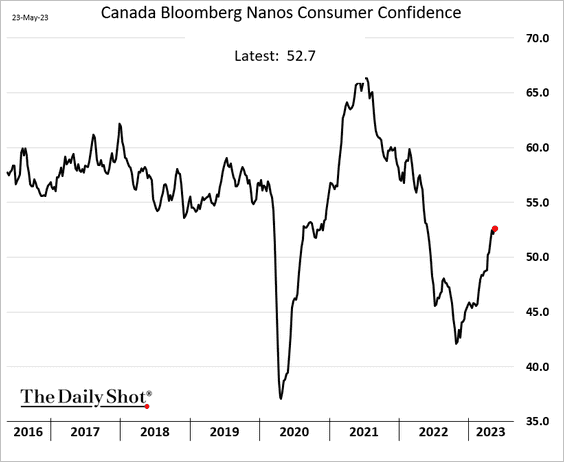
1. Consumer confidence continues to rebound.
2. Inflation is declining, but the housing market is regaining strength. The BoC’s tightening cycle could persist.
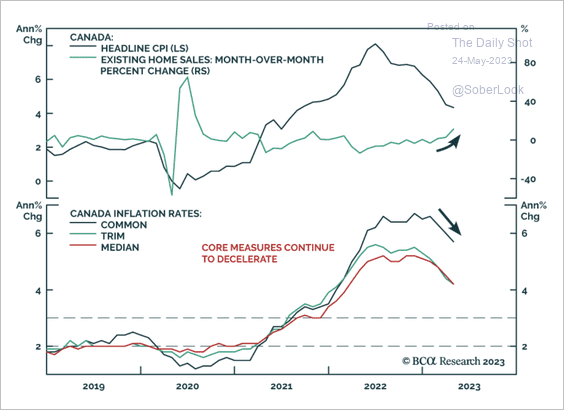 Source: BCA Research
3. Here is the Oxford Economics recession model for Canada.
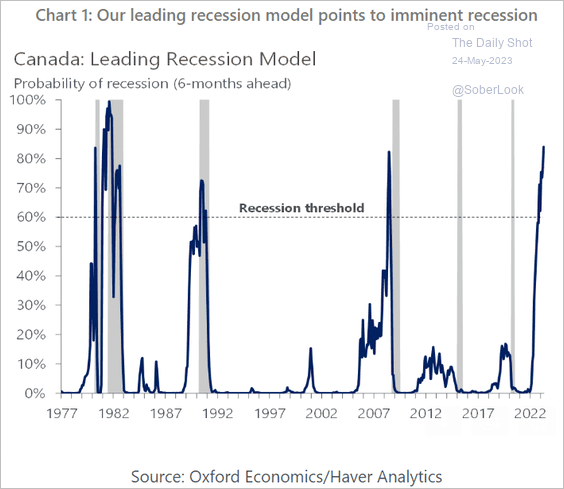 Source: Oxford Economics
Back to Index
The United Kingdom
1. Factory activity contracted at a faster pace this month.
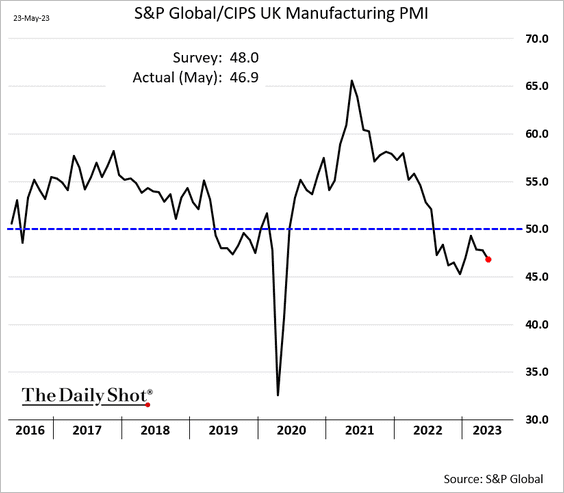
But services expansion remains robust, …
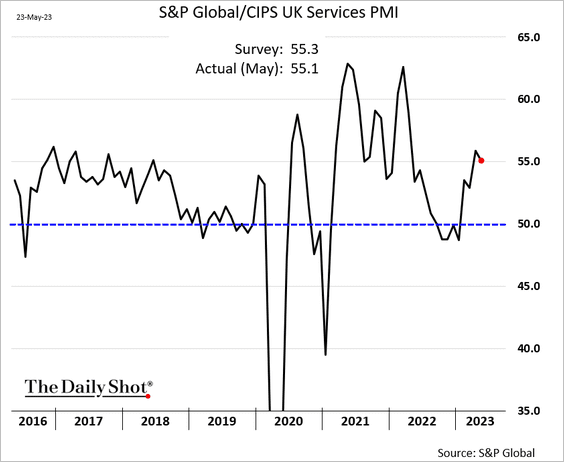
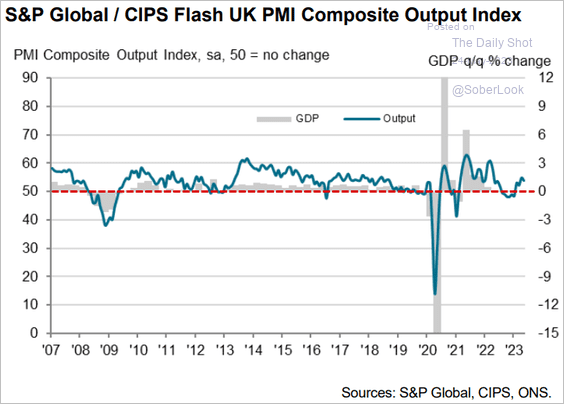
… sustaining the overall business growth.
 Source: S&P Global PMI
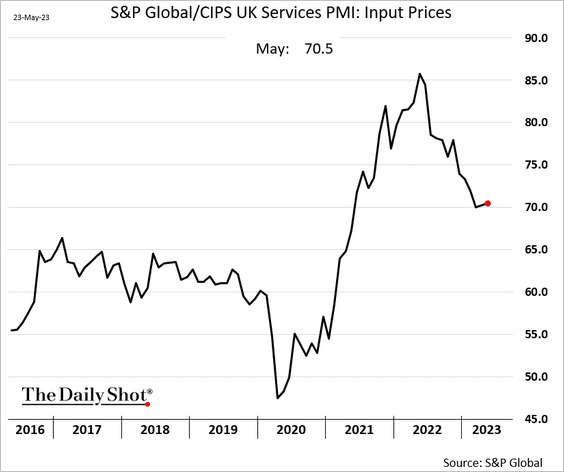
• Manufacturing input prices are now falling.
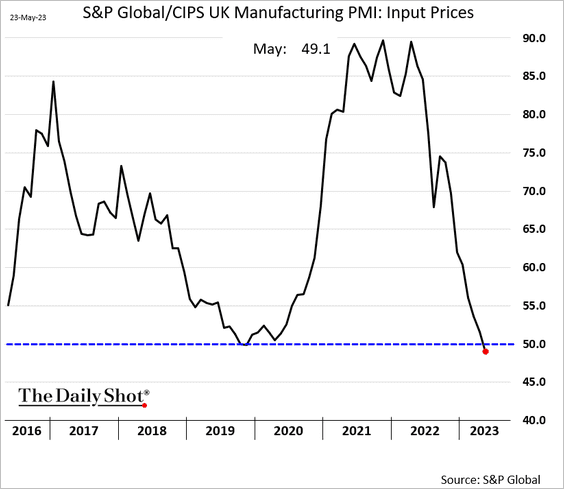
However, price pressures persist in services.
——————–
2. Fiscal borrowing was higher than expected in April.
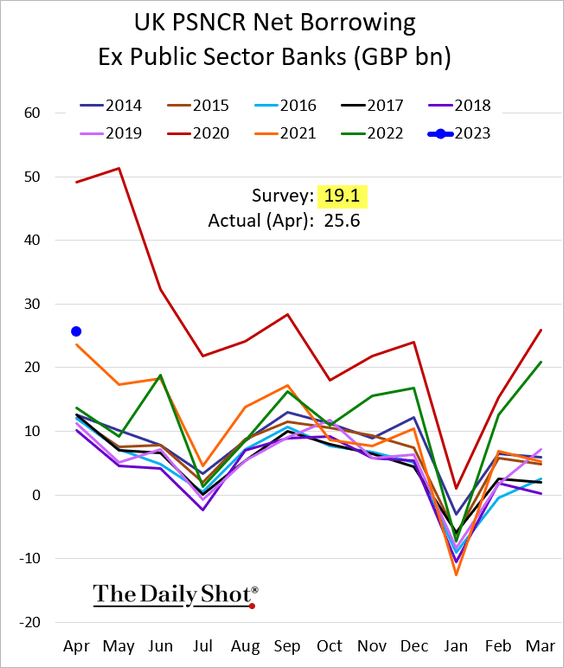
 Source: Reuters Read full article
——————–
3. Gilt yields continue to climb.

4. Britons are pessimistic about their disposable income.
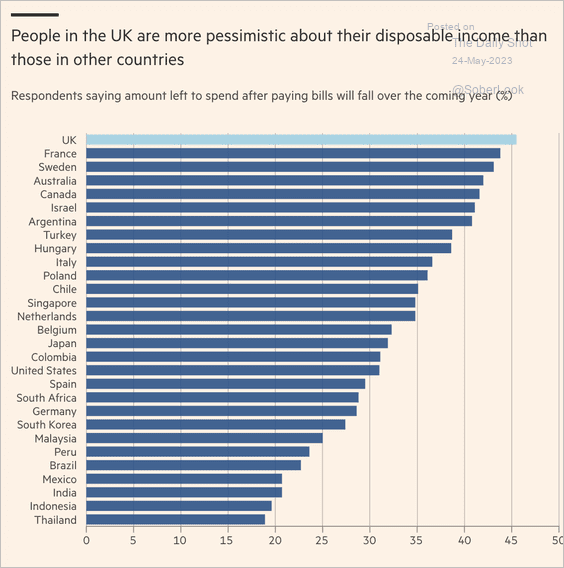 Source: @financialtimes Read full article
Back to Index
The Eurozone
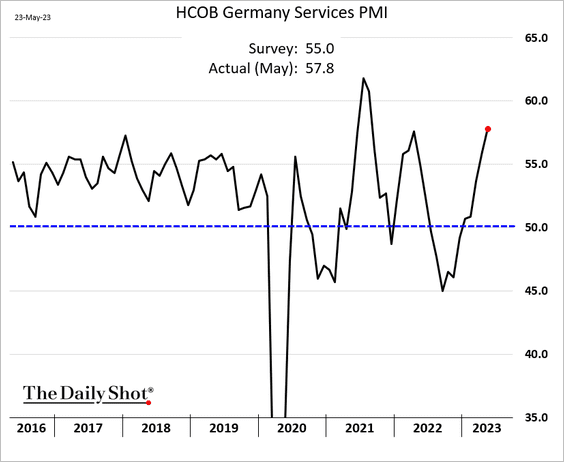
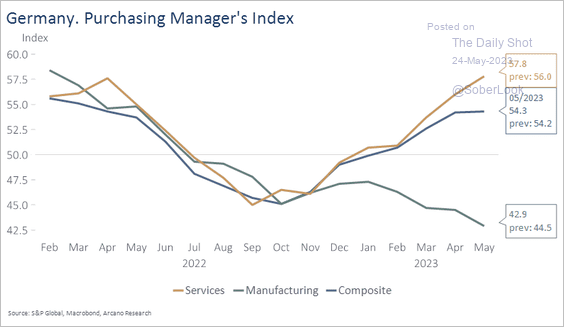
1. The overall business activity continued to grow this month, …
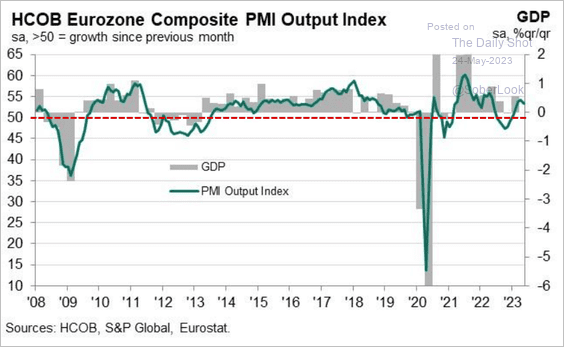 Source: S&P Global PMI
… signaling stronger GDP growth …
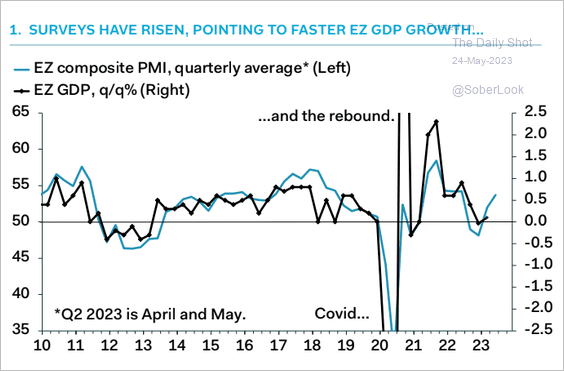 Source: Pantheon Macroeconomics
… held up by services.
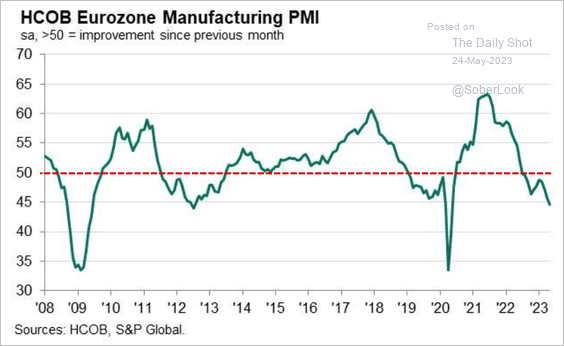
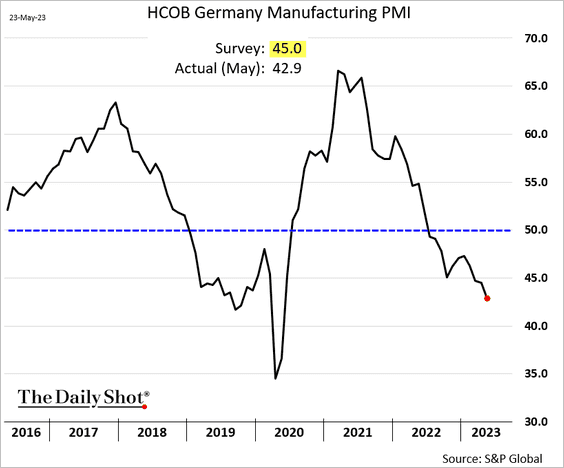
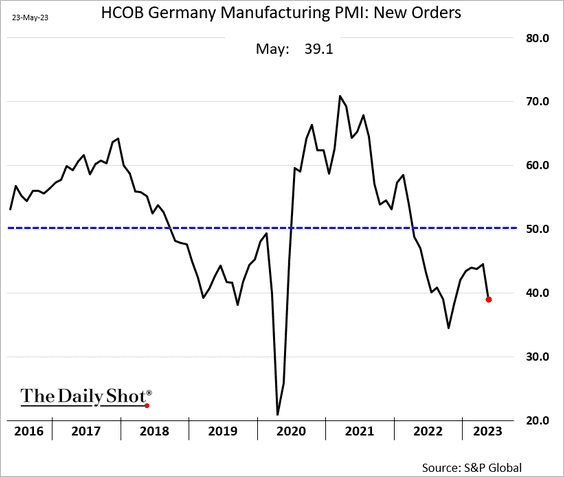
But the manufacturing sector moved deeper into contraction territory, …
 Source: S&P Global PMI
 Source: @CraigStirling, @economics Read full article
… as demand softened further.
• The manufacturing/services divergence persists (2 charts).
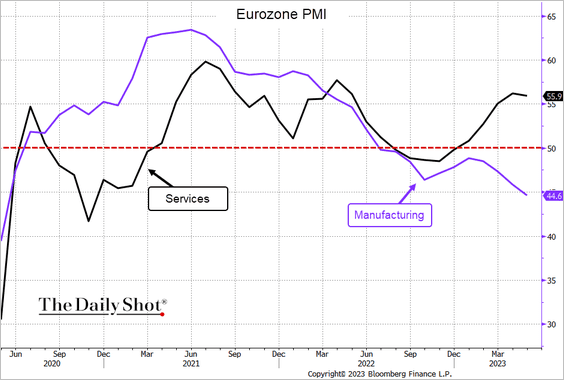 Source: S&P Global PMI; @TheTerminal, Bloomberg Finance L.P.
 Source: Arcano Economics
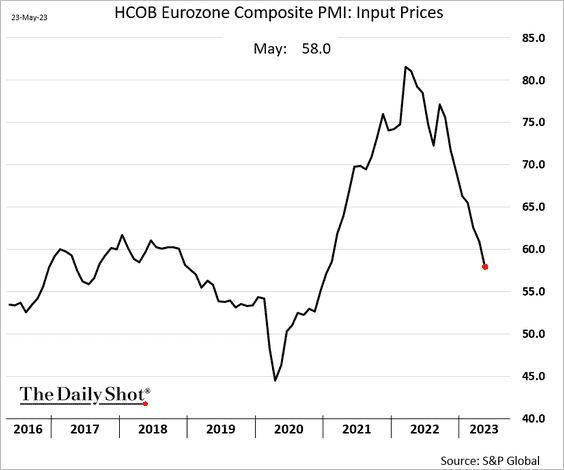
• Price pressures are easing.
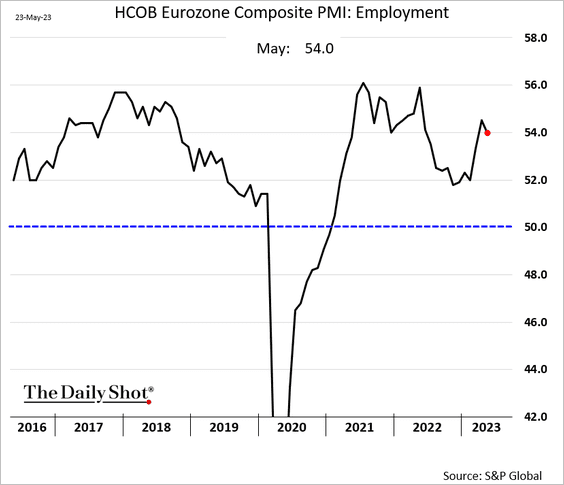
• Employment is holding up well.
——————–
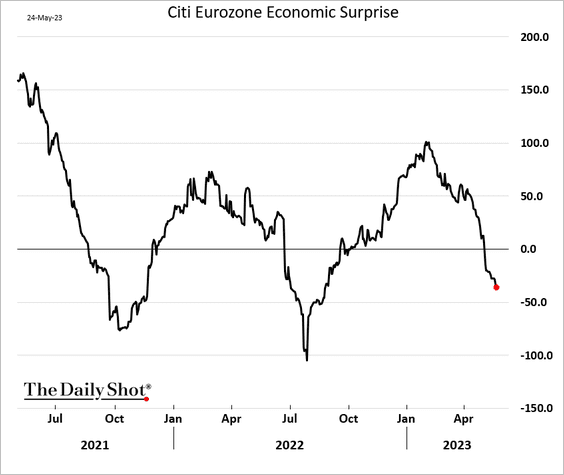
2. The Citi Economic Surprise Index continues to deteriorate.
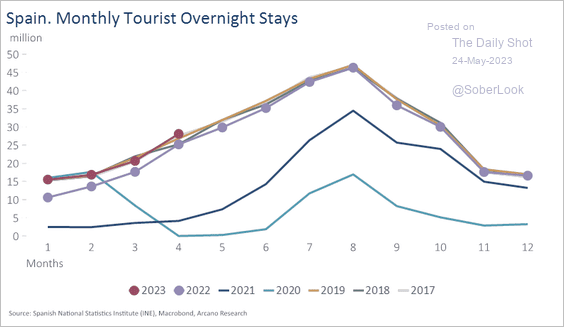
3. Spain’s tourism activity is now above pre-COVID levels.
 Source: Arcano Economics
Back to Index
Asia-Pacific
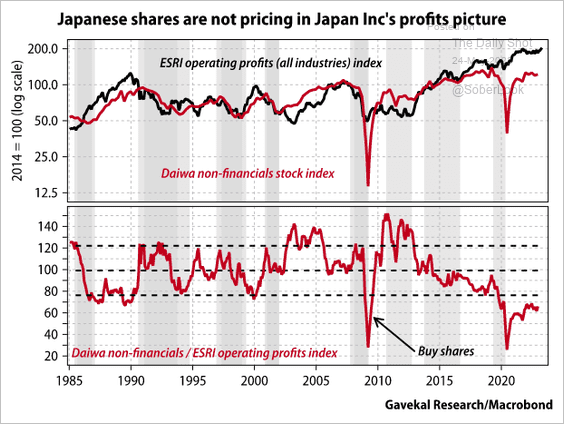
1. Japanese share prices have not kept up with climbing profits.
 Source: Gavekal Research
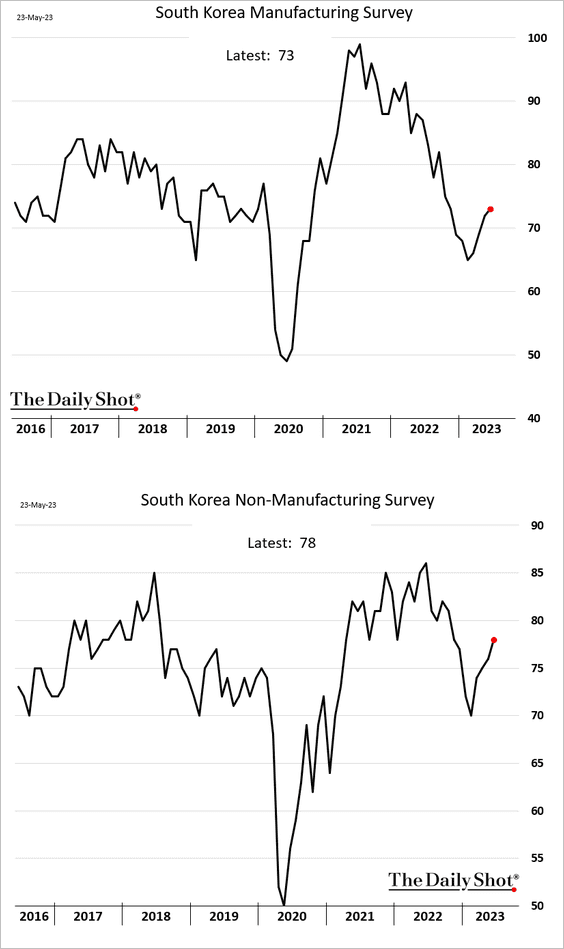
2. The Bank of Korea’s business surveys continue to show improvement.
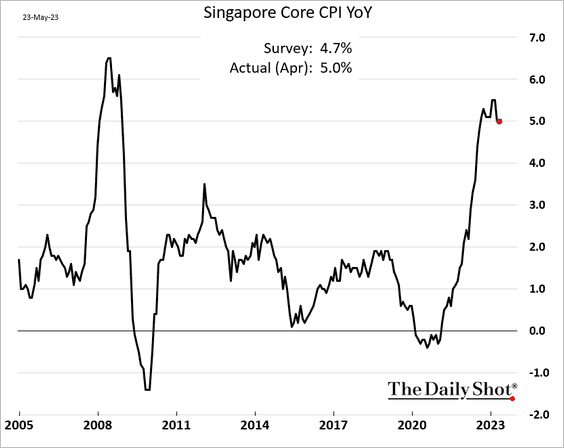
3. Singapore’s inflation surprised to the upside.
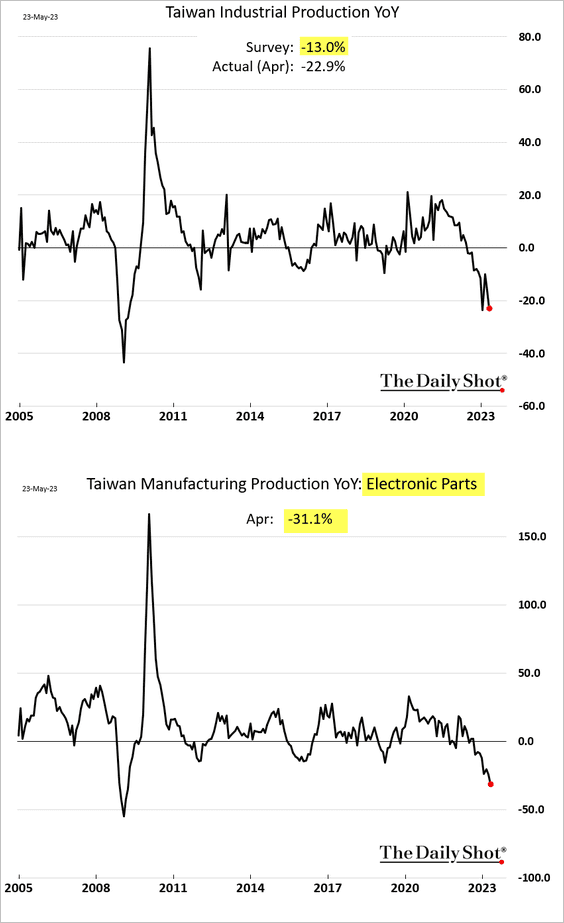
4. Taiwan’s industrial production is down sharply from a year ago, with semiconductor output declining by 31%.
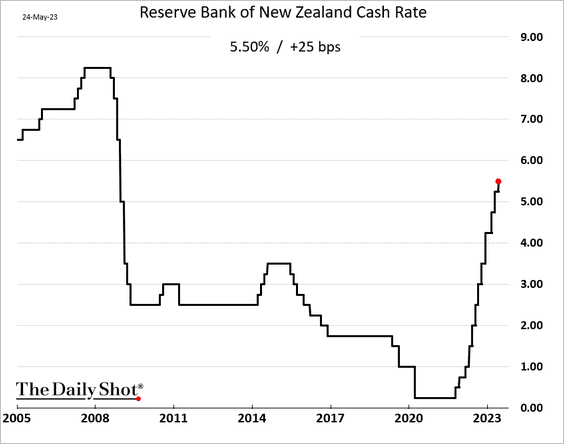
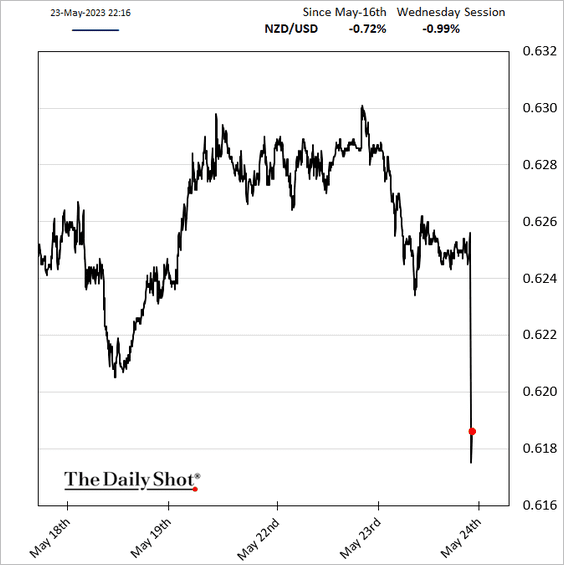
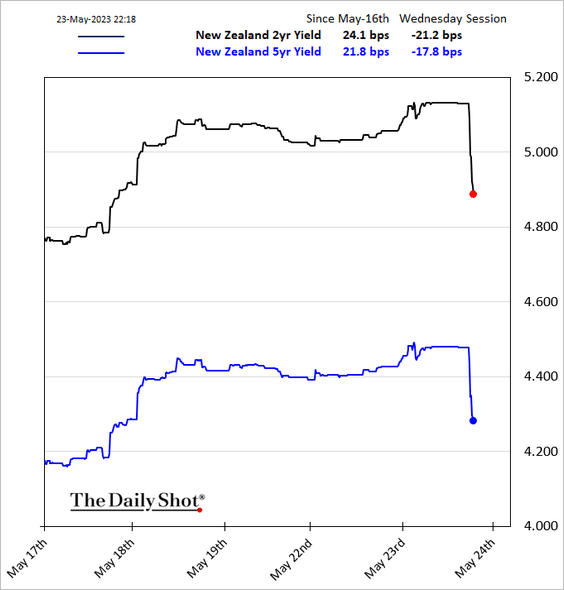
5. As anticipated, New Zealand’s central bank delivered a rate hike but announced that it has reached the end of its tightening cycle.
 Source: @tracywwithers, @markets Read full article
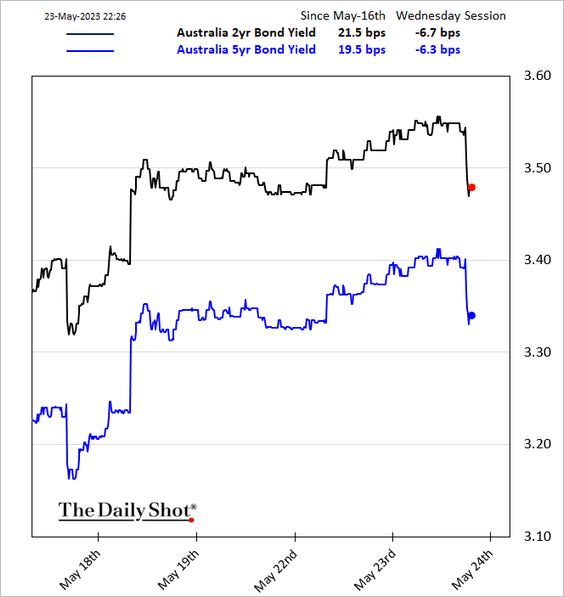
• The Kiwi dollar and bond yields tumbled.
Australian bond yields also declined in response to the RBNZ’s announcement.
Back to Index
China
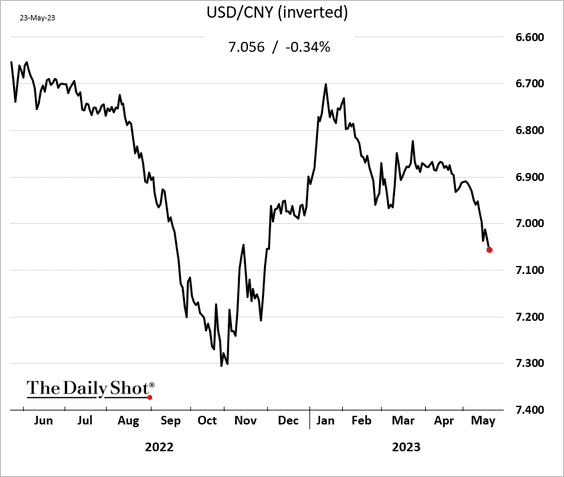
1. The renminbi continues to weaken despite warnings from Beijing.
2. Chinese equities are underperforming global counterparts, and falling industrial metal prices reflect disappointing momentum.
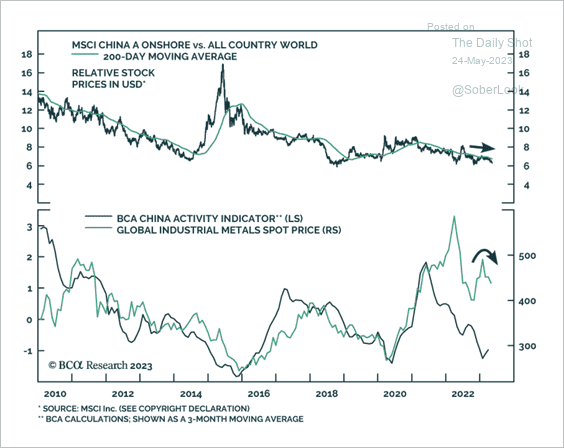 Source: BCA Research
3. Property sales growth is slowly recovering.
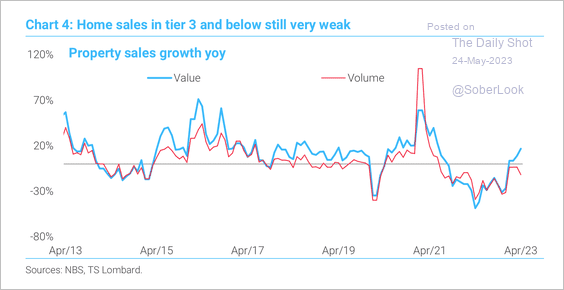 Source: TS Lombard
4. China doesn’t have enough white-collar jobs to accommodate the surge in college graduates.
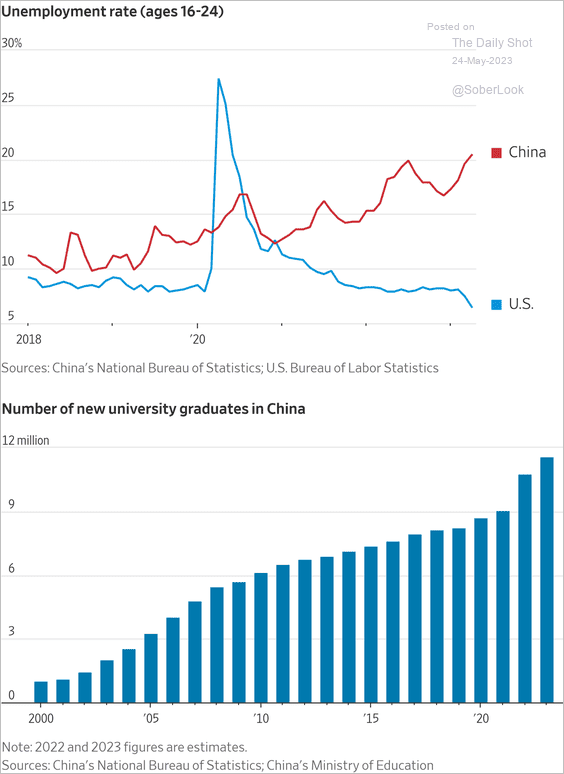 Source: @yifanxie, @WSJ Read full article
Back to Index
Emerging Markets
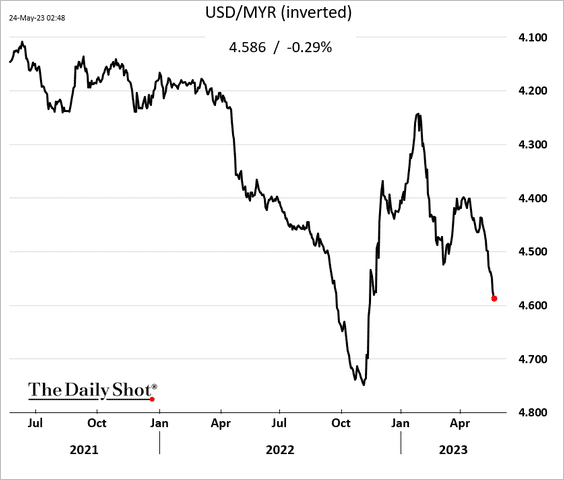
1. The Malaysian ringgit remains under pressure.
2. This chart shows government debt-to-GDP ratios for select economies.
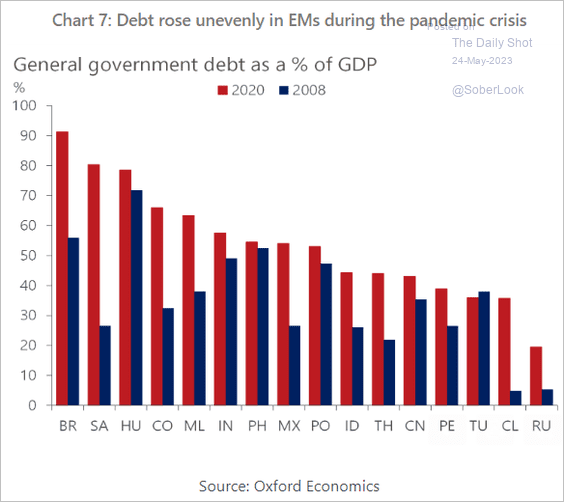 Source: Oxford Economics
Back to Index
Commodities
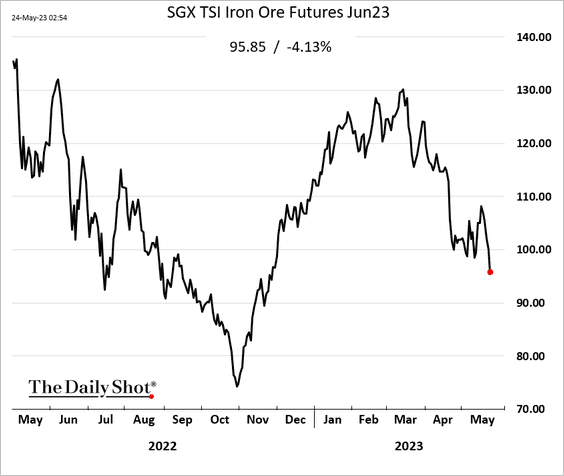
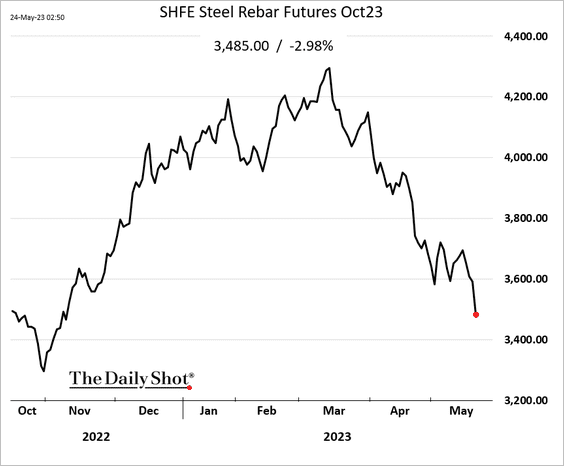
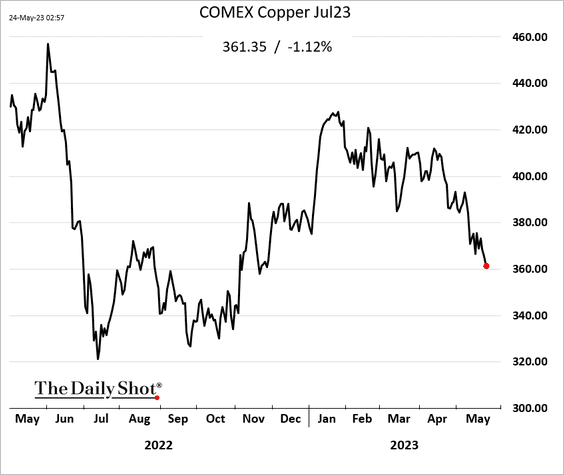
1. Industrial commodity prices continue to sink.
• Iron ore (Singapore):
• Steel rebar (Shanghai):
• Copper (New York):
• Bloomberg’s industrial metals index:

——————–
2. Investors increased their bullish bets on platinum futures while shying away from palladium.
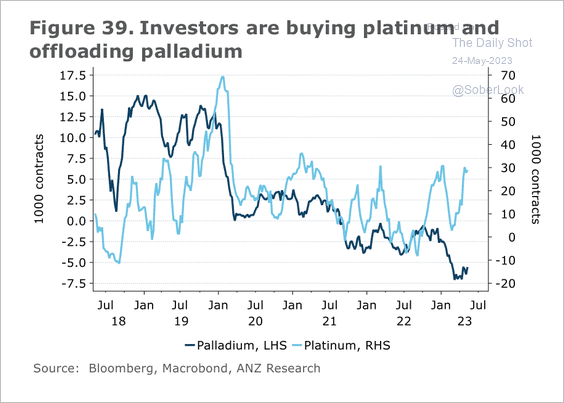 Source: @ANZ_Research
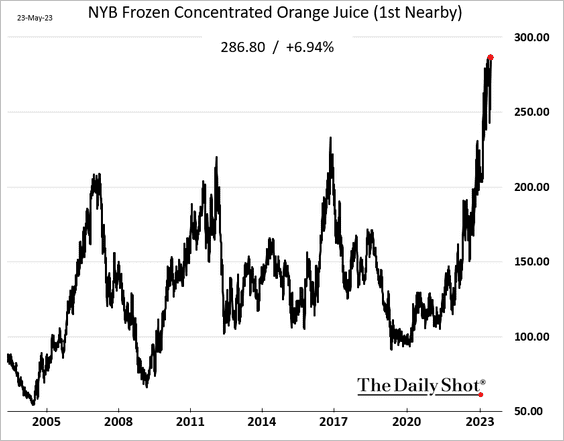
3. With cold storage frozen orange juice inventories approaching their lowest level in over 50 years, US orange juice futures hit a record high.
Back to Index
Energy
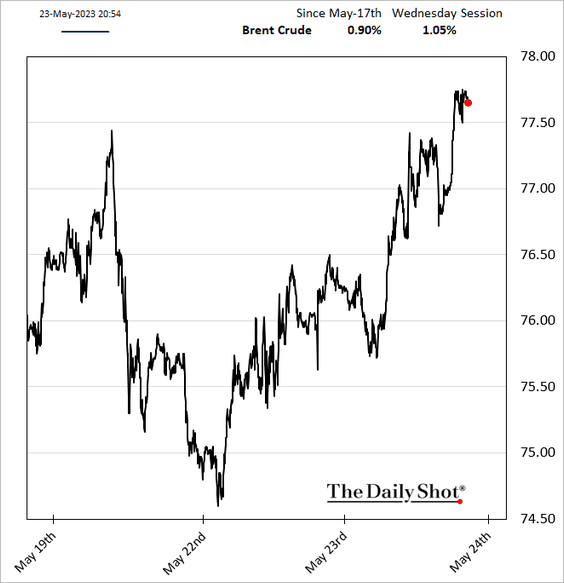
The Saudis are jawboning oil prices higher ahead of the OPEC+ meeting.
 Source: CNBC Read full article
Back to Index
Equities
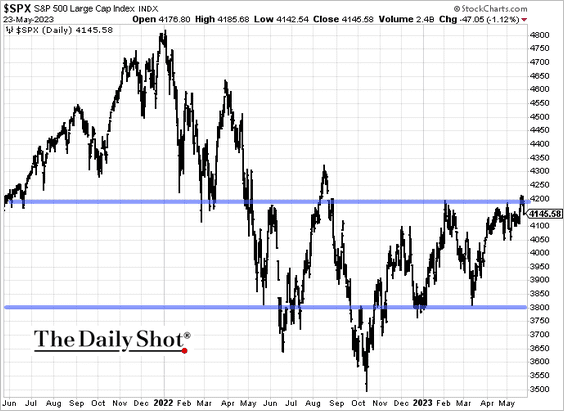
1. The S&P 500 resistance is holding amid debt ceiling concerns.
2. Fund flows do not support the recent gains.
 Source: Goldman Sachs; h/t @t1alpha
3. The 2023 earnings estimates have been robust for the top ten stocks but not the rest of the index.
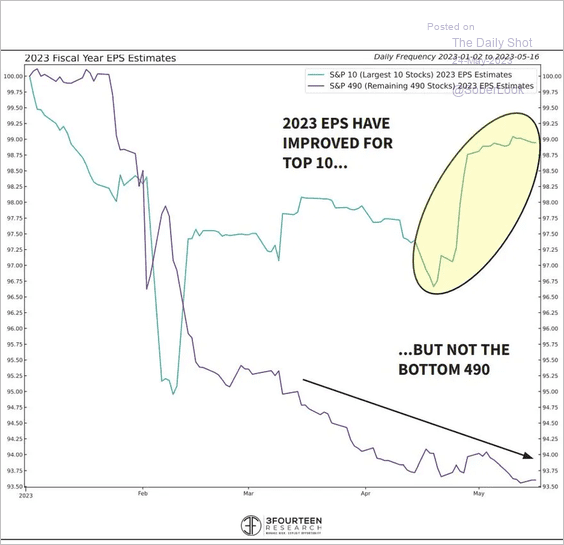 Source: @WarrenPies; h/t @dailychartbook
4. Systematic strategies have turned bullish on stocks, but discretionary investors remain cautious.
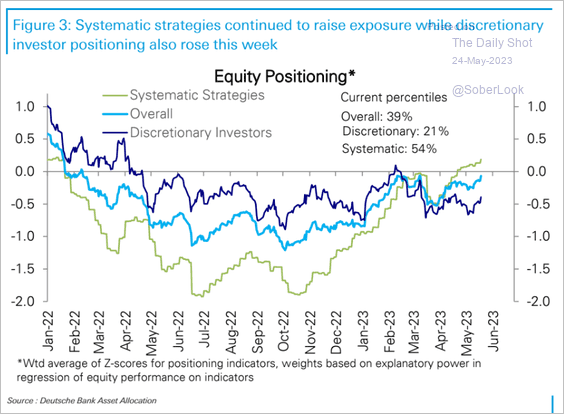 Source: Deutsche Bank Research
5. Open interest in ETF put options is at multi-year highs.
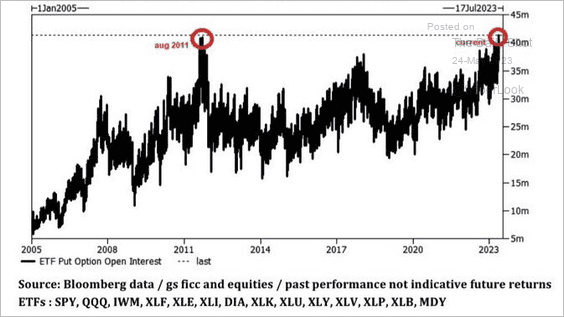 Source: @Marlin_Capital; h/t @dailychartbook
• The S&P 500 vol curve is highly inverted at the front end as traders anxiously await updates on the debt ceiling negotiations.
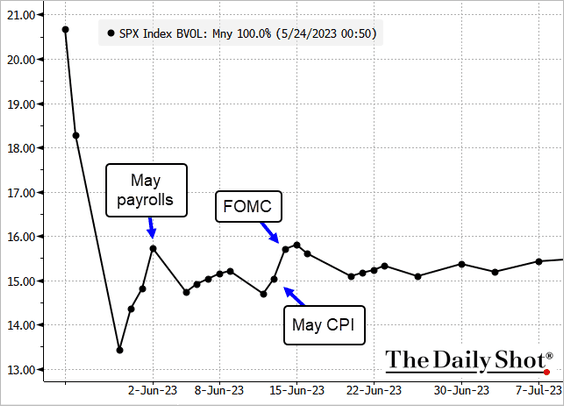 Source: @TheTerminal, Bloomberg Finance L.P.
——————–
6. Small-cap tech stocks are starting to improve relative to the S&P 500.
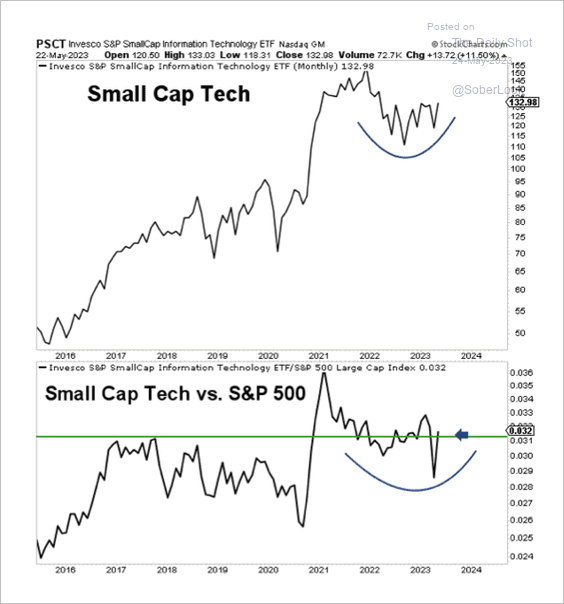 Source: Aazan Habib, Paradigm Capital
7. Next, we have some sector updates.
• Dividend actions by sector:
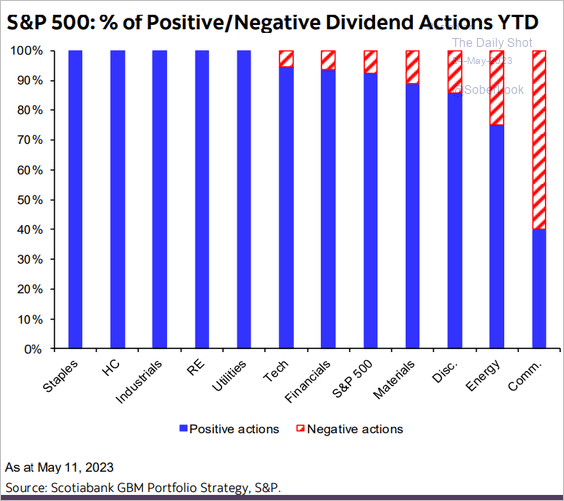 Source: Hugo Ste-Marie, Portfolio & Quantitative Strategy Global Equity Research, Scotia Capital
• Each sector’s top three members by net income:
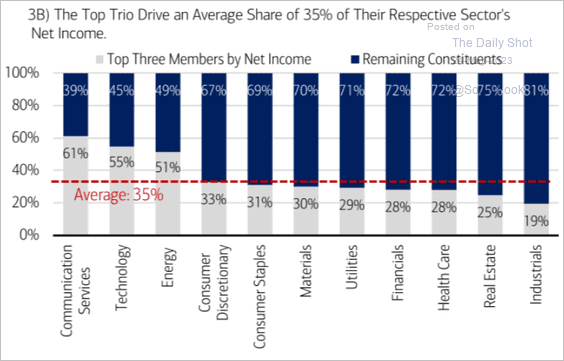 Source: Merrill Lynch
• Profit margin forward estimates by sector:
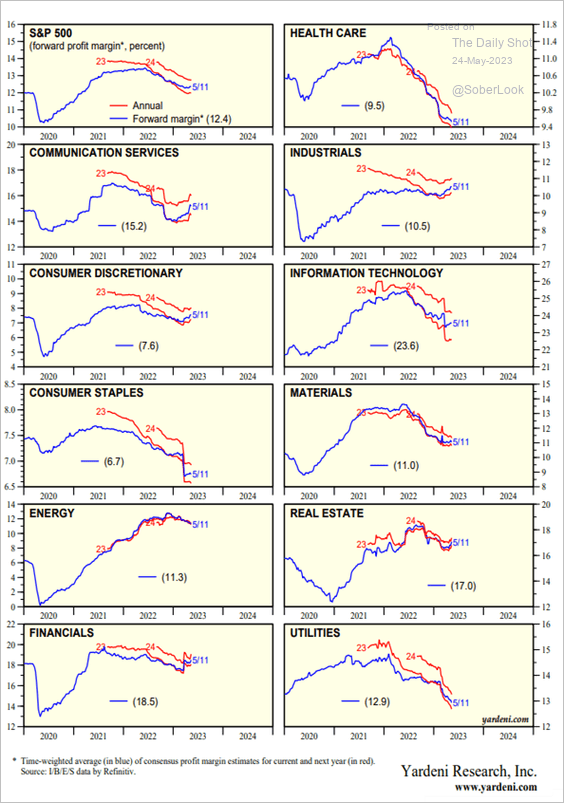 Source: Yardeni Research
• S&P 500 industrial stocks face headwinds from weaker global growth and a breakdown in the copper/gold ratio.
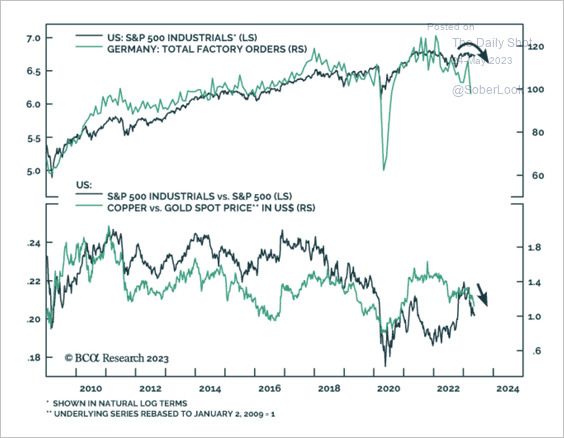 Source: BCA Research
Back to Index
Alternatives
1. This chart shows global VC investment trends by deal size.
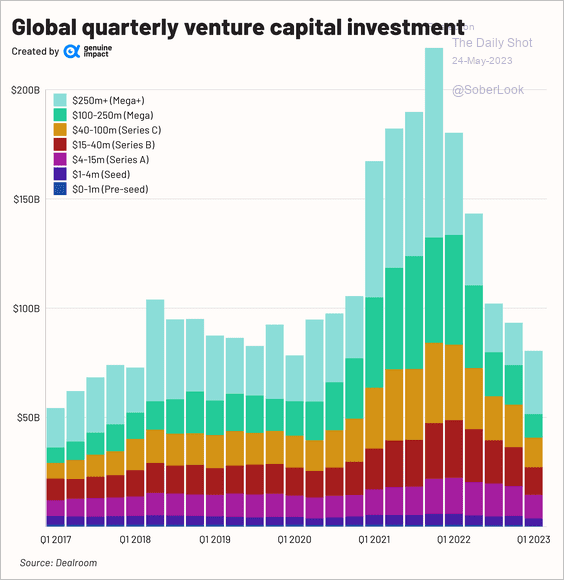 Source: @genuine_impact
2. Late-stage valuations in European venture capital have significantly declined.
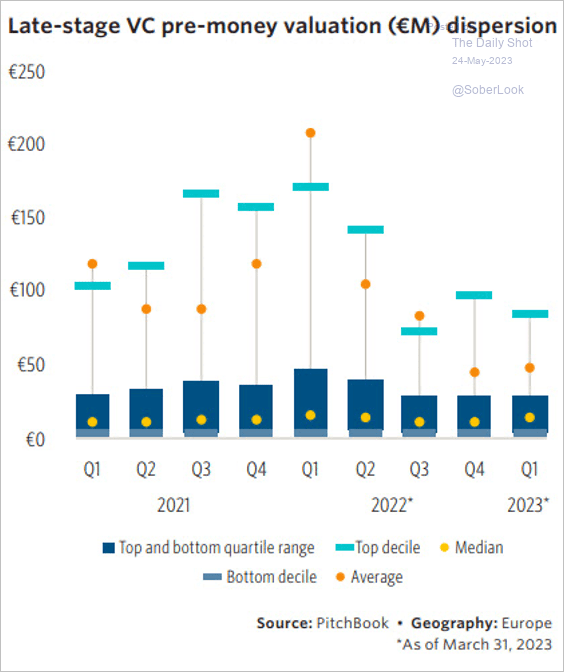 Source: PitchBook
Back to Index
Credit
1. Leveraged loan funds continue to see outflows.
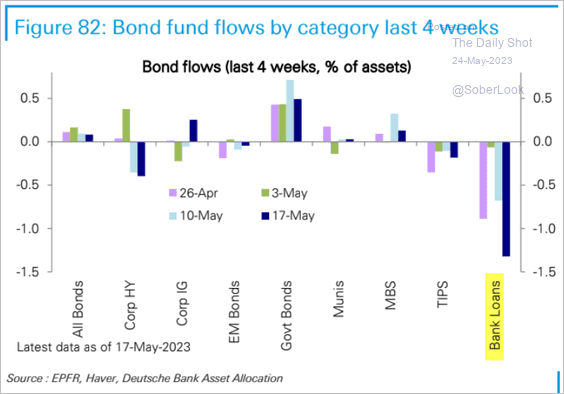 Source: Deutsche Bank Research
2. A lot of CLOs are out of their investment periods.
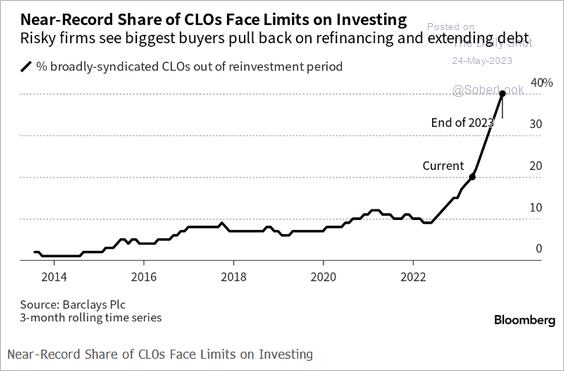 Source: Bloomberg Law Read full article
3. Only a small amount of fixed-rate debt is coming due next year in the riskiest ratings.
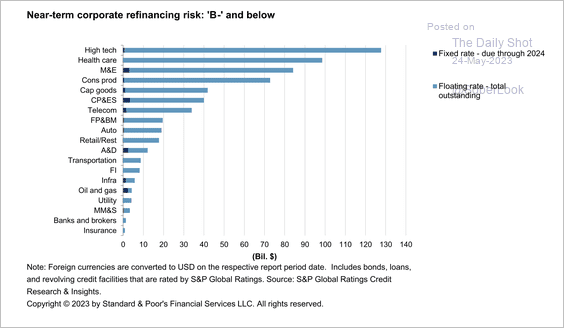 Source: S&P Global Ratings
4. Longer-dated IG corporates underperformed this month.
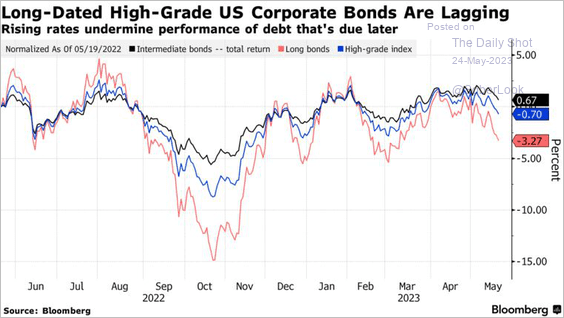 Source: @josyanajoshua, @markets Read full article
5. Here are the largest corporate bond deals.
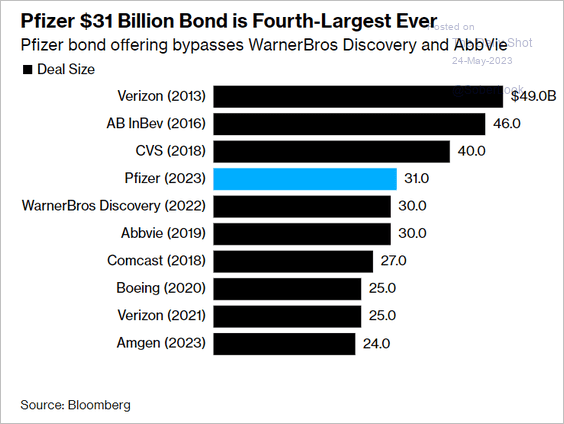 Source: @josyanajoshua, @markets Read full article
6. This chart shows US retail-sector bankruptcies.
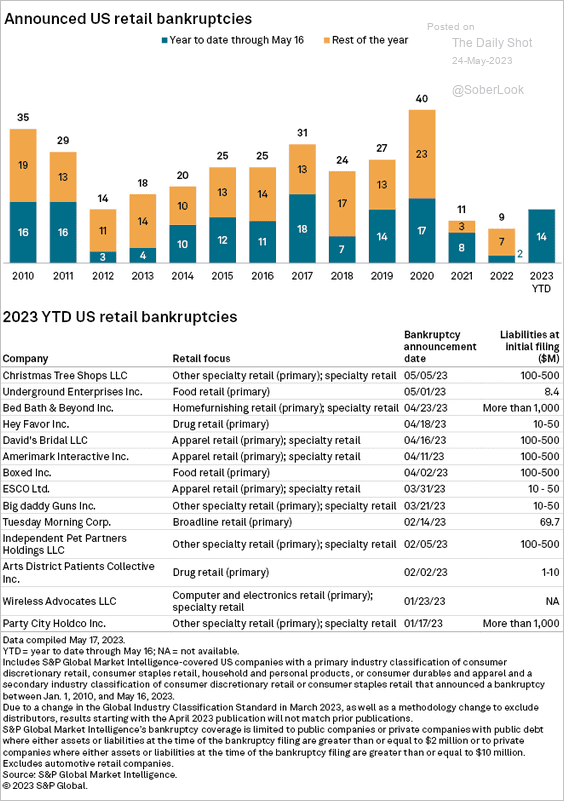 Source: S&P Global Market Intelligence
Back to Index
Rates
1. Industrial commodities are increasingly pricing a recession. Will Treasury yields follow?
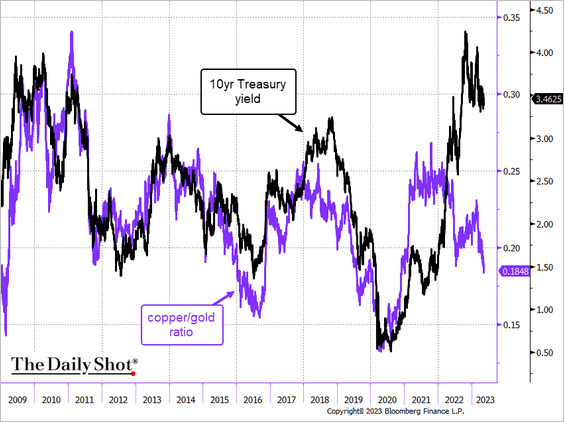 Source: @TheTerminal, Bloomberg Finance L.P.
2. This chart shows the balances in private repo markets versus the Fed’s RRP facility usage. An overview of “SLR relief” is available here.
 Source: Liberty Street Economics Read full article
Back to Index
Global Developments
1. The 60-40 portfolio is rebounding this year. The 25/25/25/25 portfolio is also performing well.
 Source: BofA Global Research
2. The amount of funding allocated to national statistical agencies varies significantly across countries.
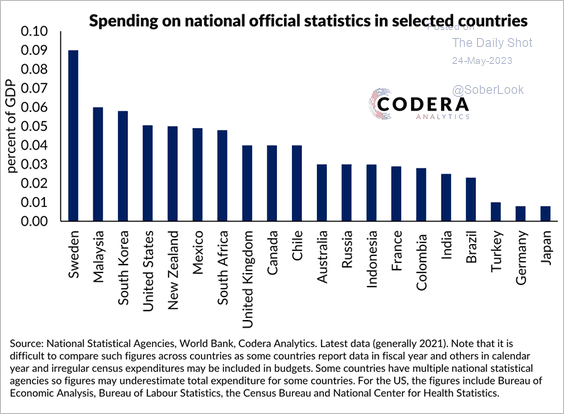 Source: Codera Analytics Read full article
3. This chart shows global vehicle production relative to pre-COVID levels.
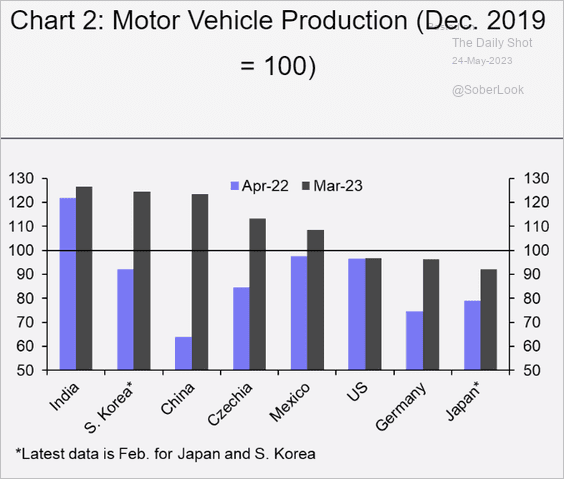 Source: Capital Economics
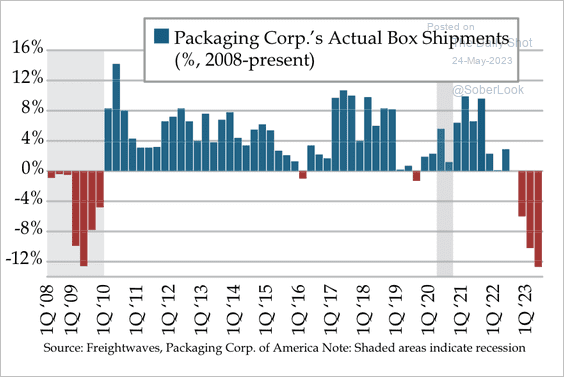
4. Industrial packaging is experiencing its first contraction since the financial crisis. (2 charts)
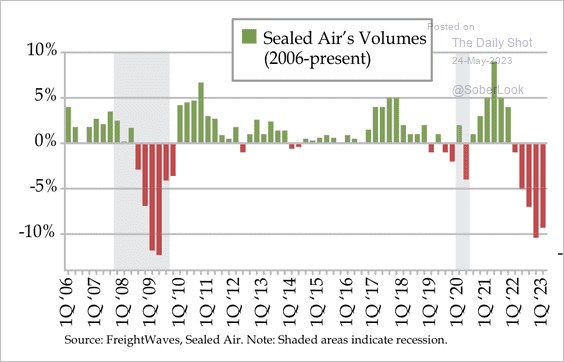 Source: Quill Intelligence
 Source: Quill Intelligence
——————–
Food for Thought
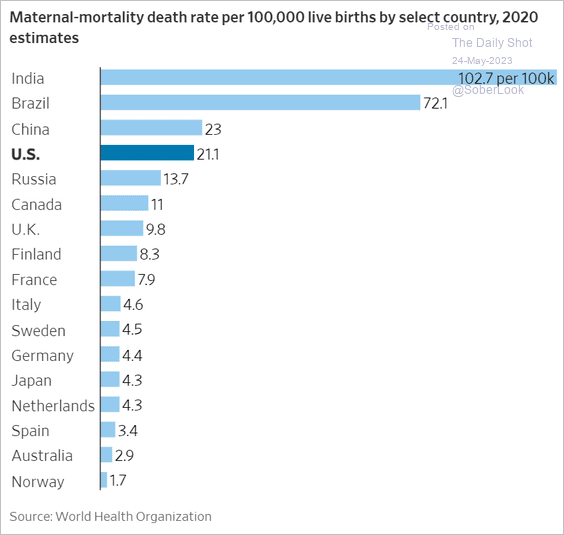
1. Maternal mortality rates (2 charts):
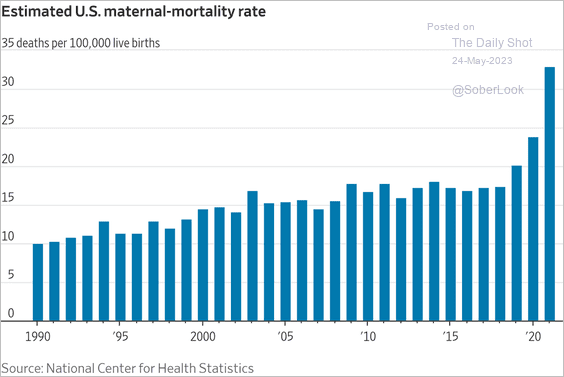 Source: @WSJ Read full article
 Source: @WSJ Read full article
——————–
2. It’s going to be a warm summer:
 Source: NOAA
3. Texas electricity generation by source:
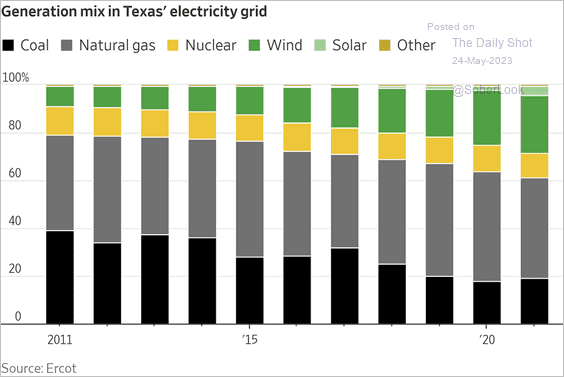 Source: @WSJ Read full article
4. Judicial appointments:
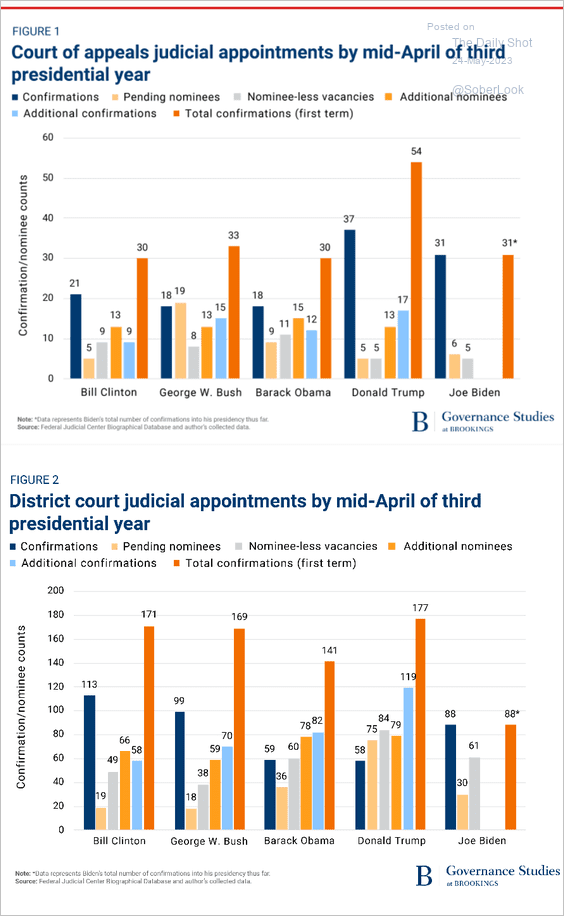 Source: Brookings Read full article
5. Polling methods over time:
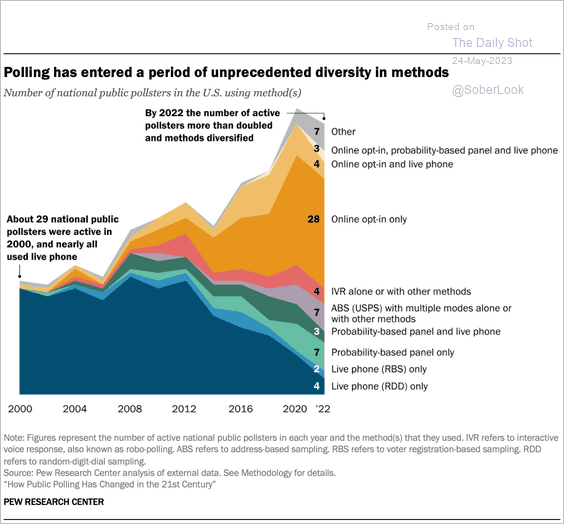 Source: Pew Research Center Read full article
6. Religious affiliations of US adults and Congress members:
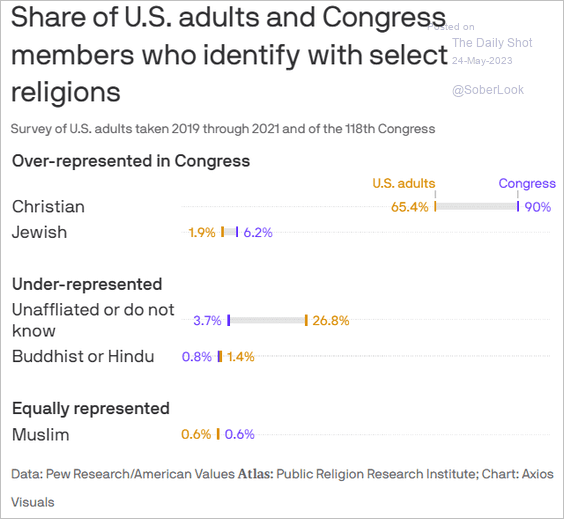 Source: @axios Read full article
7. US daily newspapers with the largest annual print circulation:
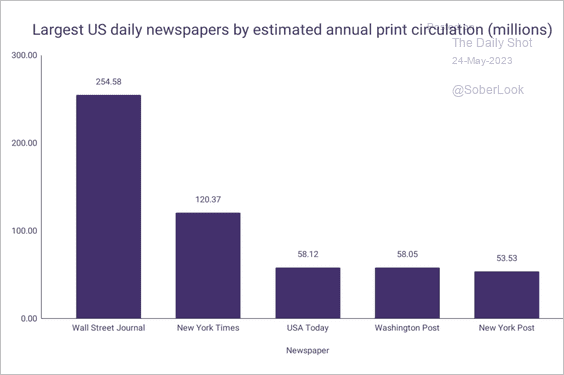 Source: WordsRated; h/t Walter Read full article
8. Extensive Russian fortifications along the frontline in occupied Ukraine:
 Source: Reuters Read full article
9. GDP per capita in India and China:
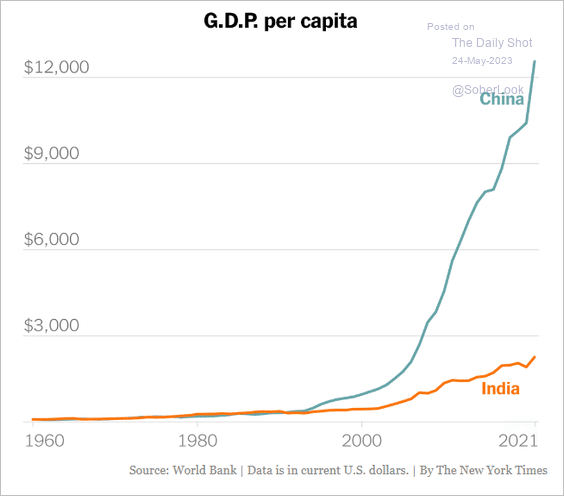 Source: The New York Times Read full article
• Literacy rates in India and China:
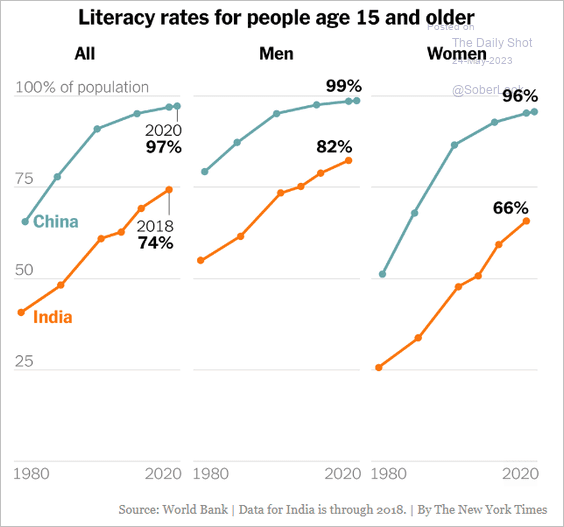 Source: The New York Times Read full article
——————–
10. The daily routines of famous creatives:
 Source: Visual Capitalist Read full article
——————–
Back to Index