
The Daily Shot: 01-Jun-23
• The United States
• Canada
• The Eurozone
• Europe
• Japan
• Asia-Pacific
• China
• Emerging Markets
• Commodities
• Equities
• Credit
• Rates
• Global Developments
• Food for Thought
The United States
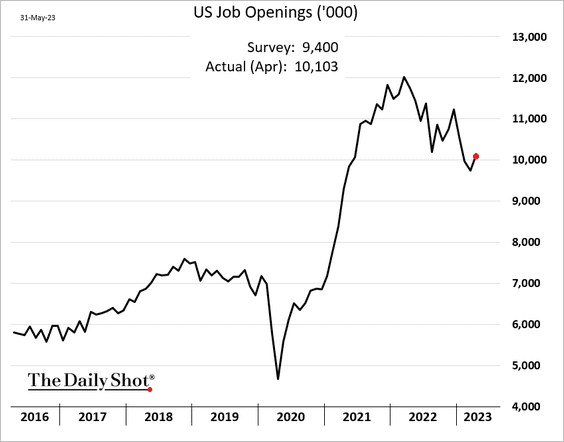
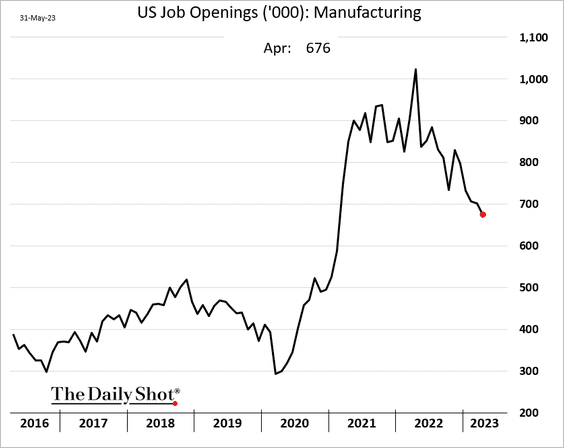
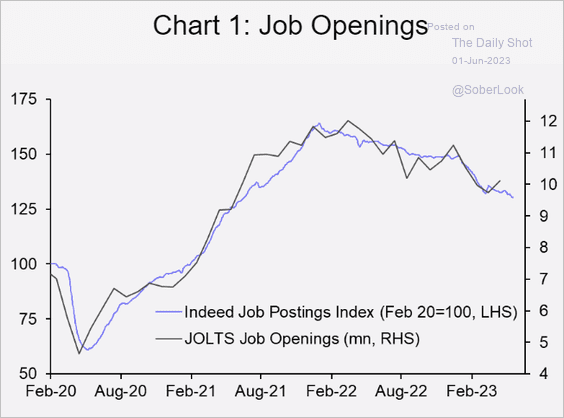
1. US job openings unexpectedly increased in April, climbing above ten million.
 Source: @WSJ Read full article
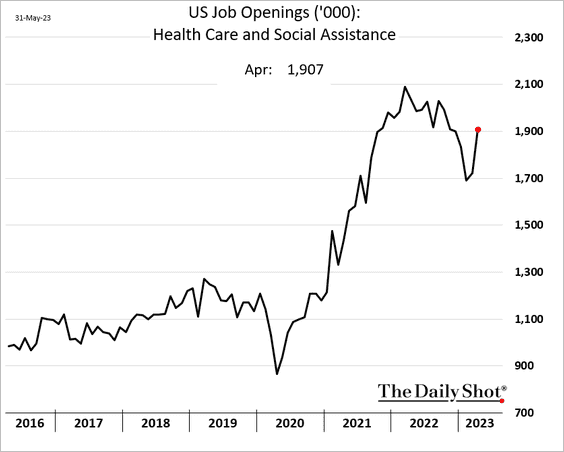
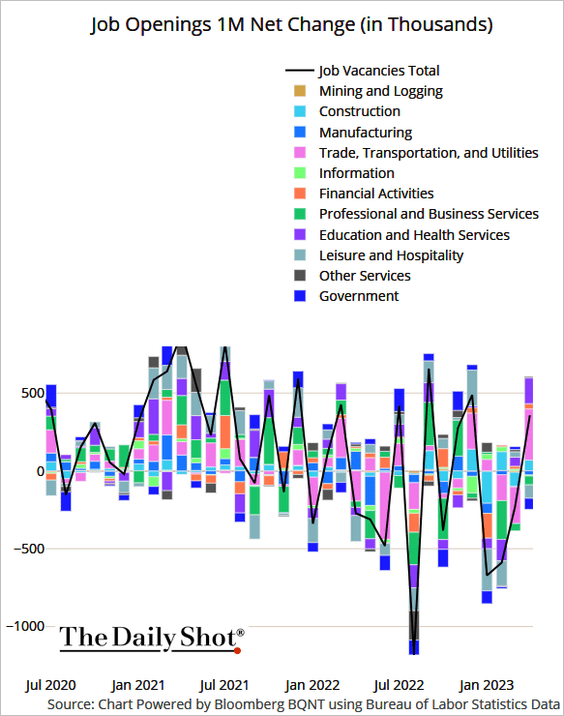
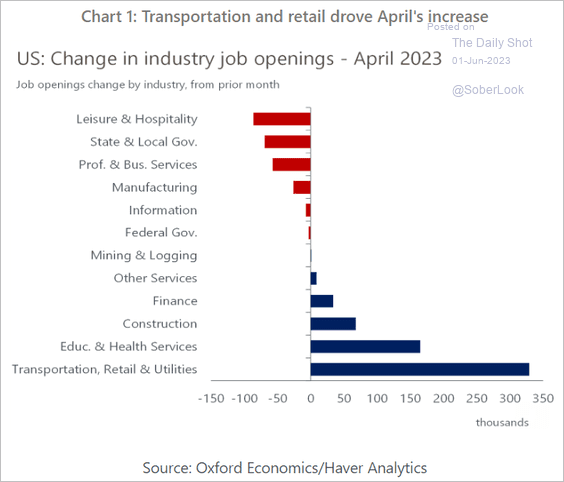
• Logistics (chart below) and healthcare (2nd chart) were the key drivers of the increase.
![]()
Business services, hotels/restaurants, and manufacturing saw declines.
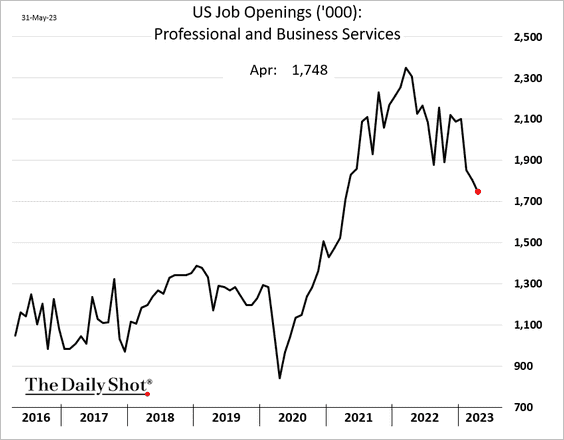
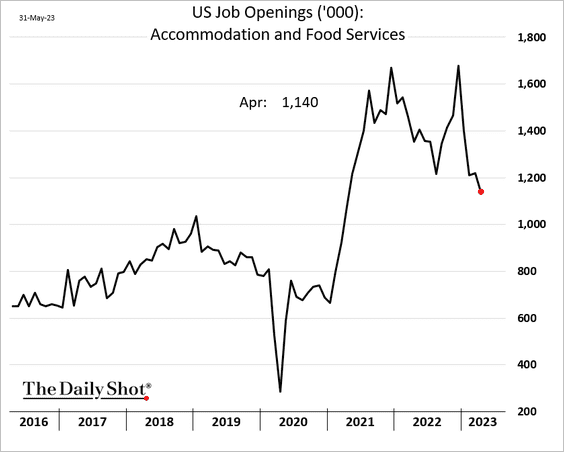
Here are the contributions (2 charts).
 Source: @TheTerminal, Bloomberg Finance L.P.
 Source: Oxford Economics
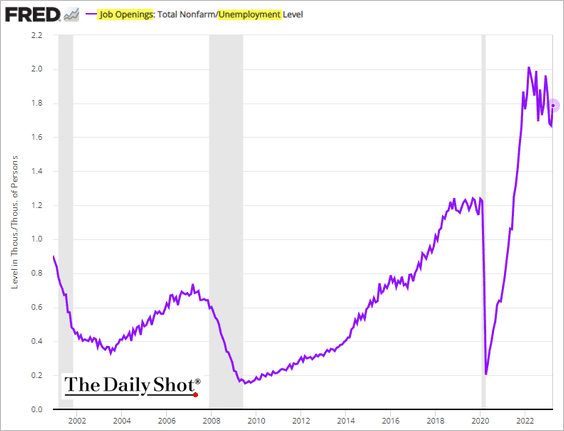
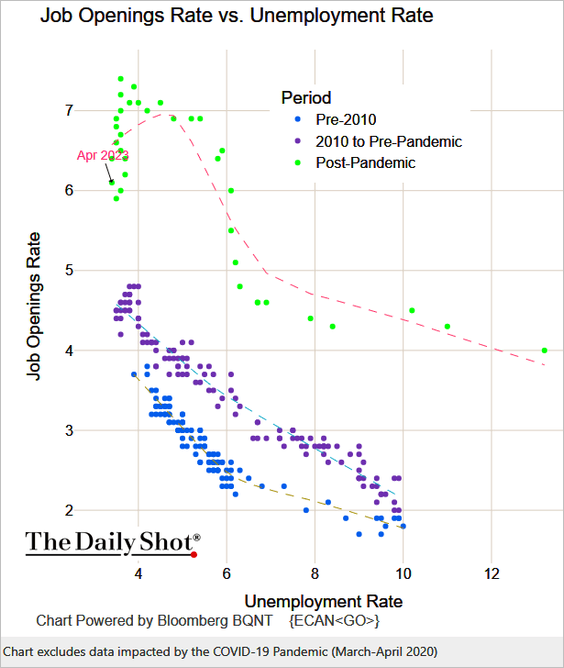
• The ratio of job openings to unemployment remains elevated (1.8 openings per unemployed American), an indication of persistent imbalances in the labor market.
• Here is the Beveridge Curve.
 Source: @TheTerminal, Bloomberg Finance L.P.
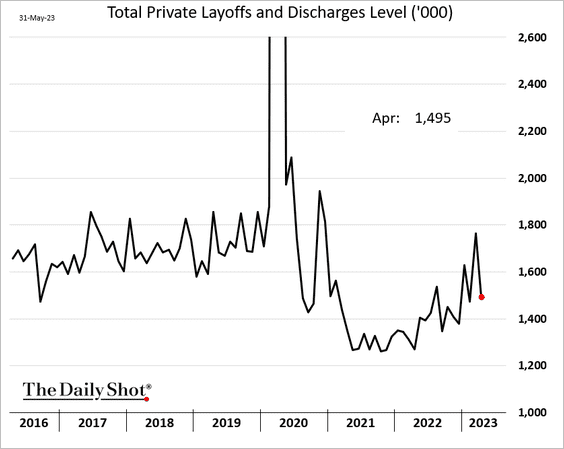
• Layoffs eased in April.
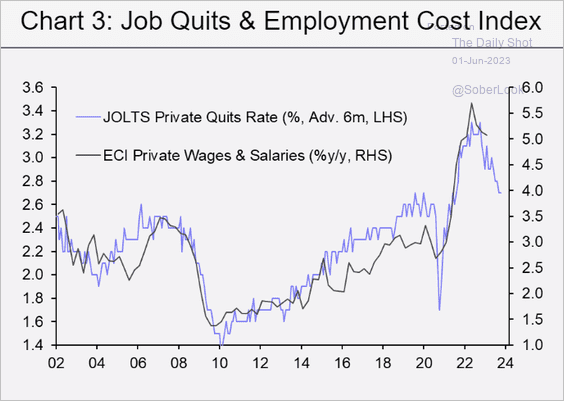
• Voluntary resignations (quits) declined again and are approaching pre-COVID levels. The trend suggests some loosening in the jobs market as the Great Resignation ends.
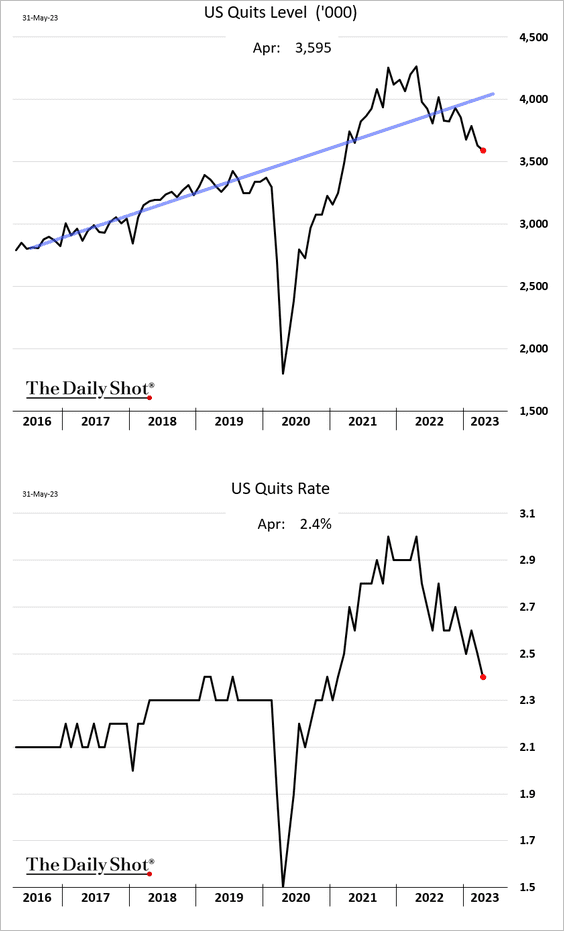
Falling quits rate signals deceleration in wage growth.
 Source: Capital Economics
• Postings on Indeed point to lower job openings ahead.
 Source: Capital Economics
——————–
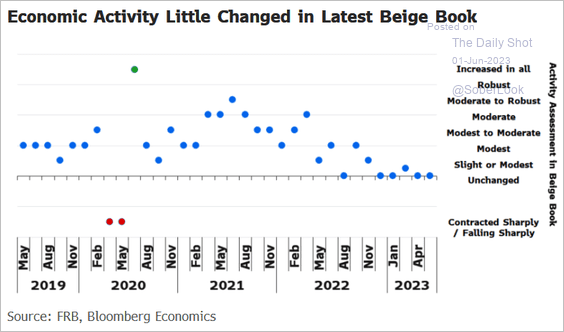
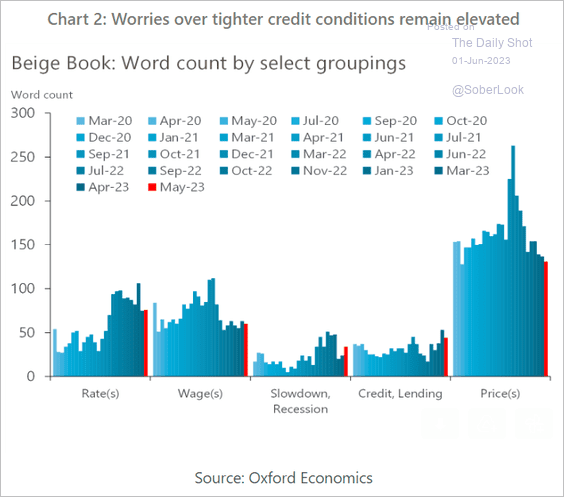
2. The Fed’s Beige Book sentiment was roughly unchanged from April, according to Bloomberg Economics.
 Source: @WingerEliza Read full article
Concerns about tighter credit persist.
 Source: Oxford Economics
——————–
3. The MNI Chicago PMI surprised to the downside, moving deeper into contraction territory.
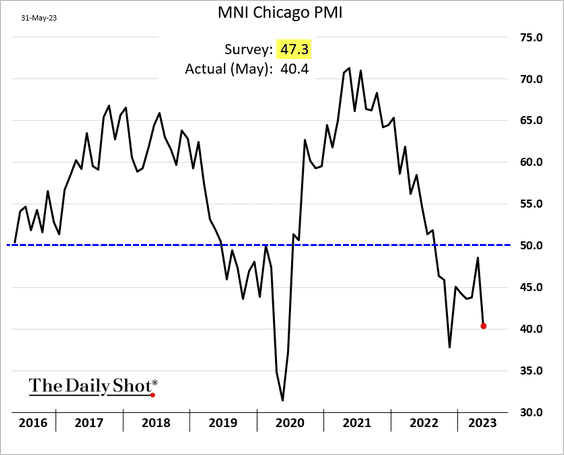
The index points to downside risks for manufacturing activity at the national level.
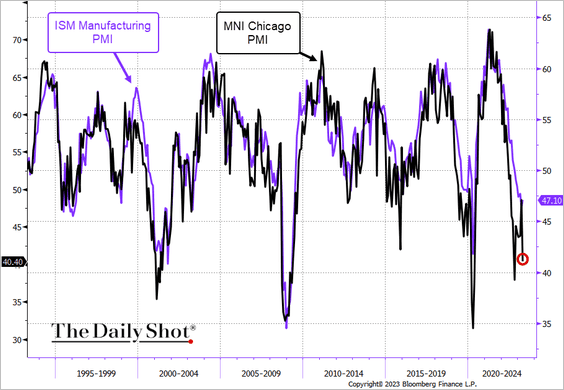 Source: @TheTerminal, Bloomberg Finance L.P.
——————–
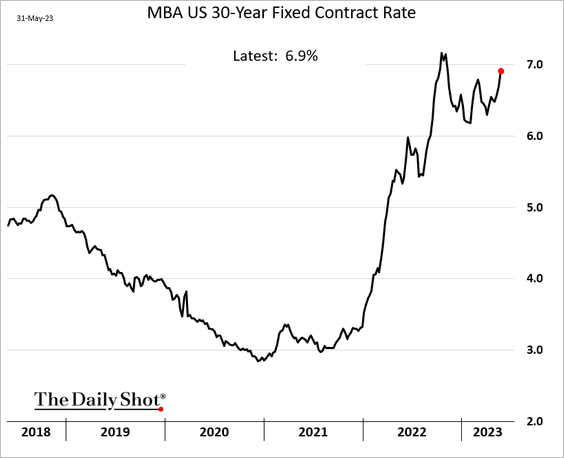
4. Mortgage applications remain at multi-year lows, …
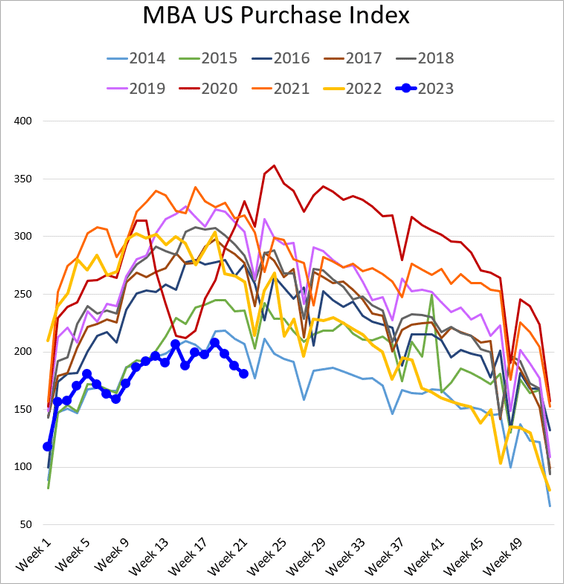
… as mortgage rates climb.
——————–
5. US trade in goods deficit widened in April.
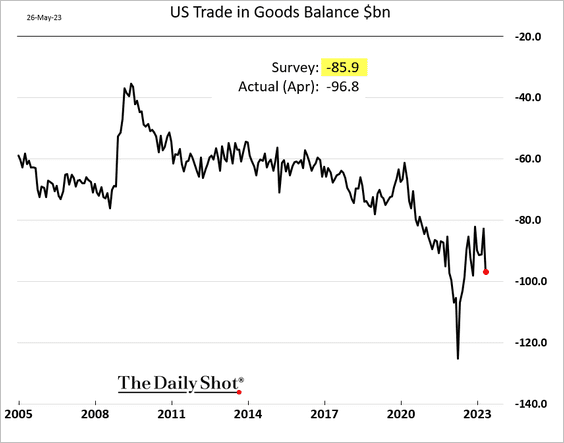
Exports declined.
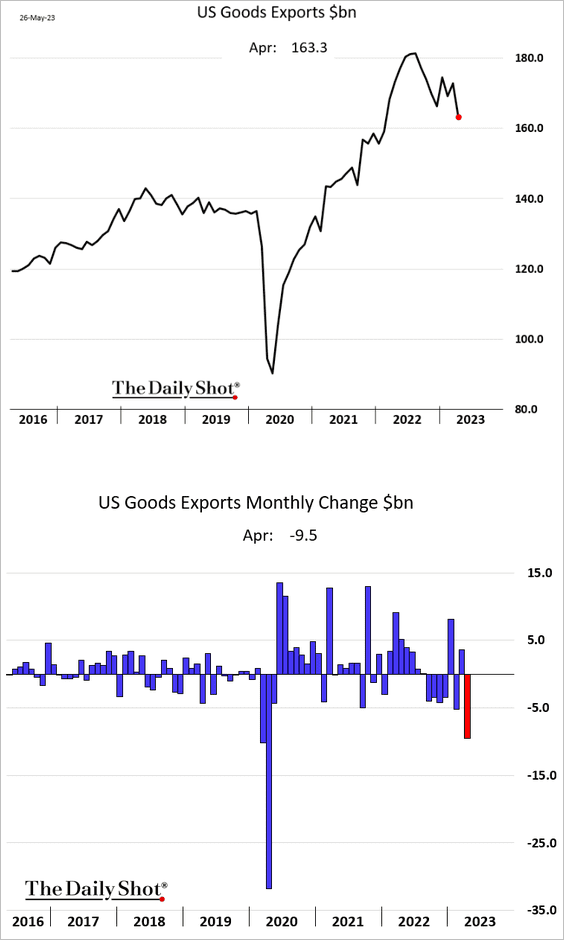
 Source: MarketWatch Read full article
——————–
6. Fed officials are hinting at a “pause” in June, with rate hikes continuing in July.
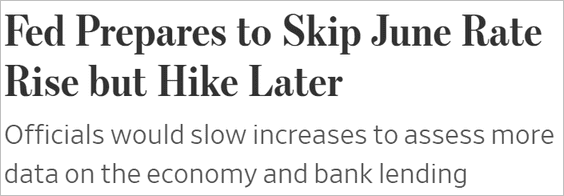 Source: @WSJ Read full article
Here are the changes in market expectations between Tuesday and Wednesday.
——————–
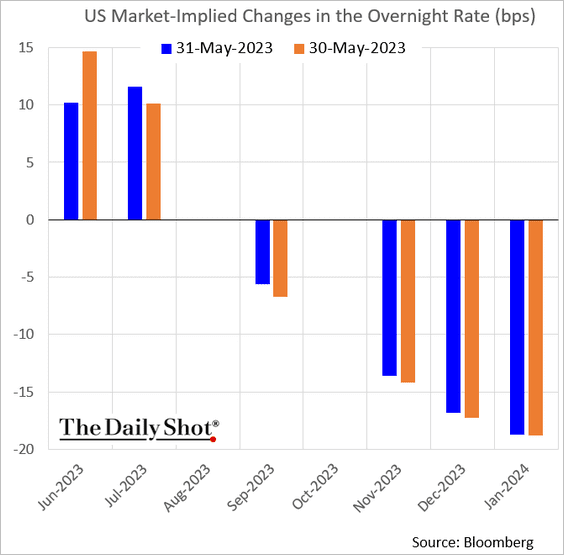
7. This chart shows recession probabilities priced by different asset classes.
 Source: JP Morgan Research; III Capital Management
8. Weak credit demand signals slowing CapEx ahead.
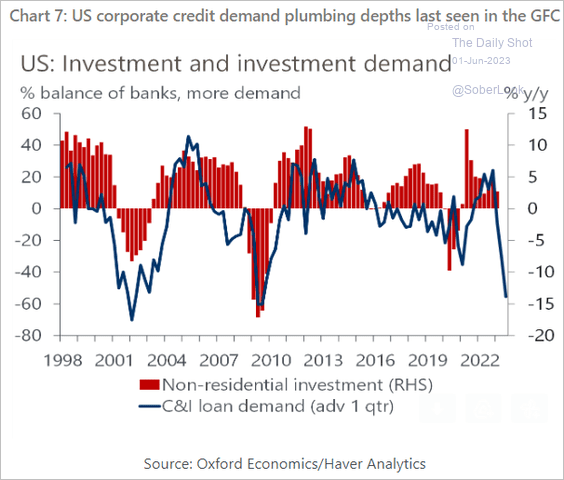 Source: Oxford Economics
9. The House passed the debt ceiling legislation.
 Source: @WSJ Read full article
How will the bill impact the budget deficit and economic growth?
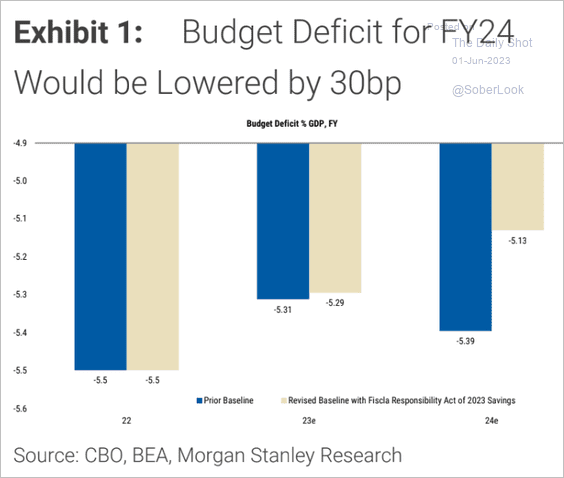 Source: Morgan Stanley Research
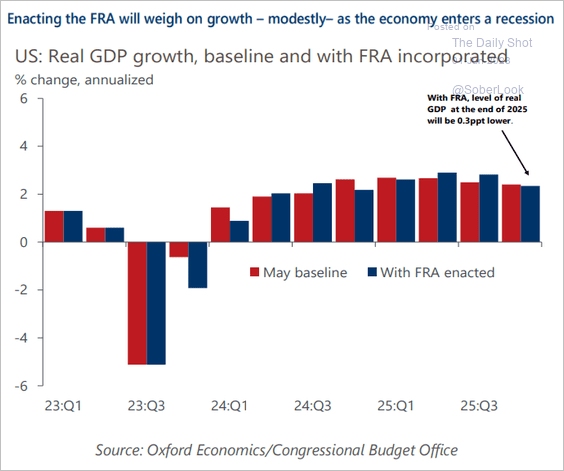 Source: Oxford Economics
Back to Index
Canada
1. The Q1 GDP growth topped expectations.
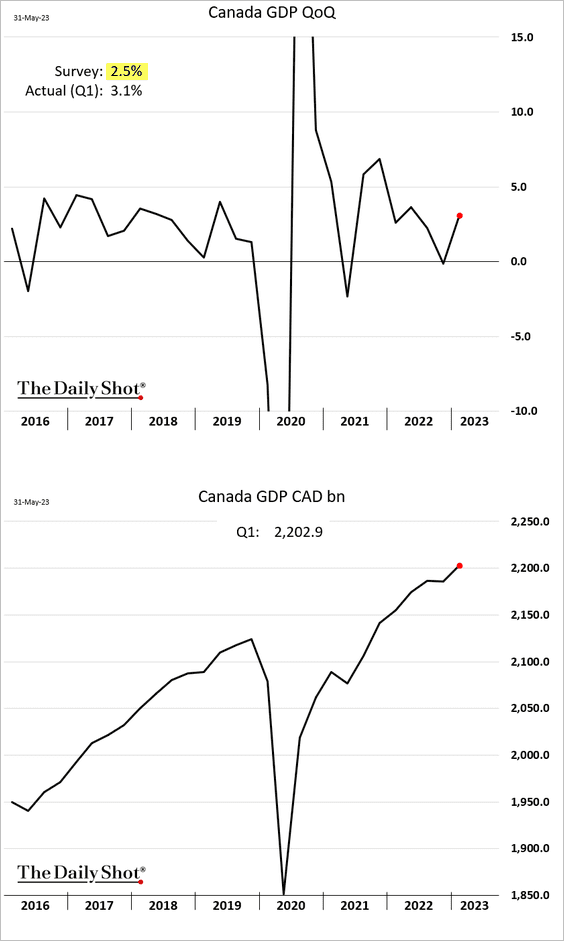
Here are the contributions.
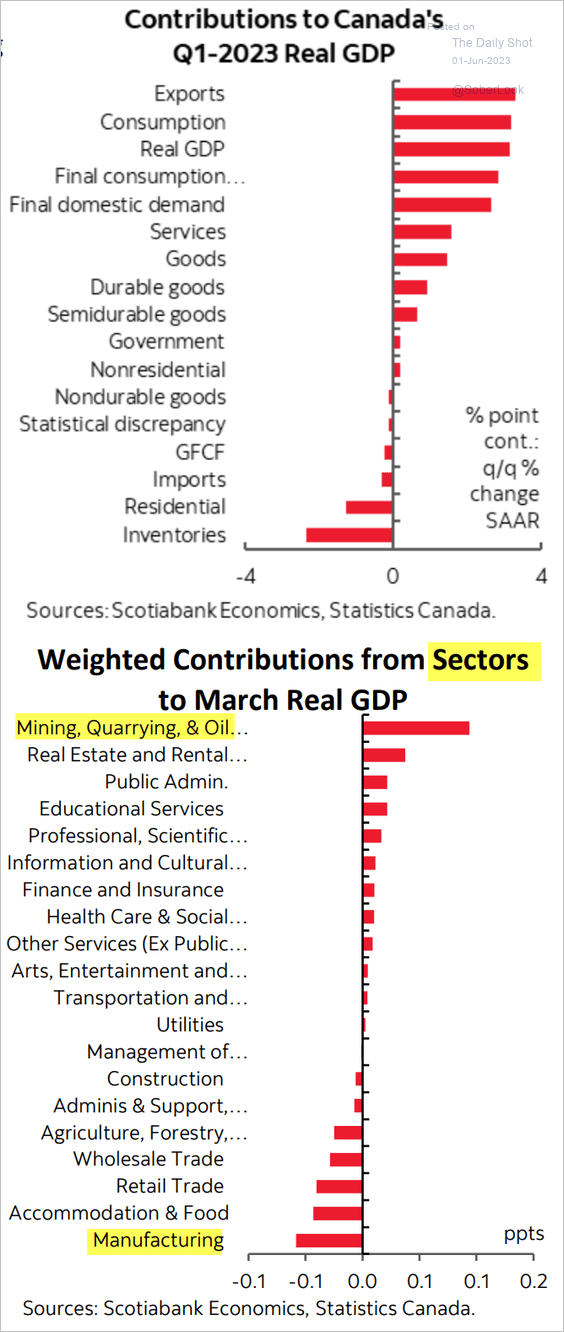 Source: Scotiabank Economics
Scotia Economics’ GDP tracker has the Q2 growth running at 0.9%.
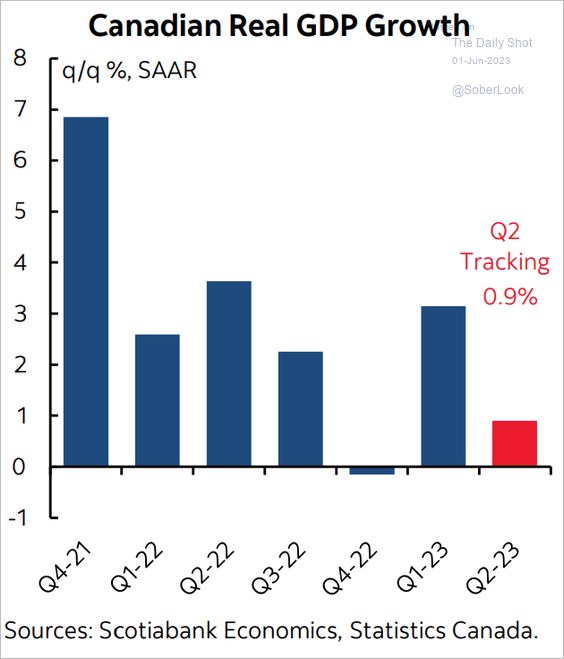 Source: Scotiabank Economics
——————–
2. A BoC rate hike is now fully priced in, …
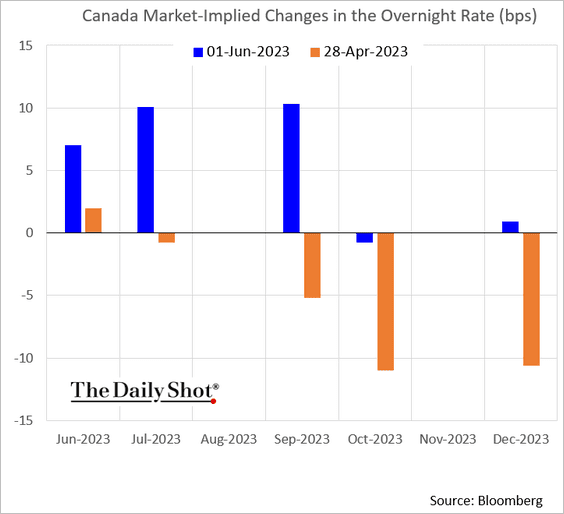
… as core inflation remains elevated.
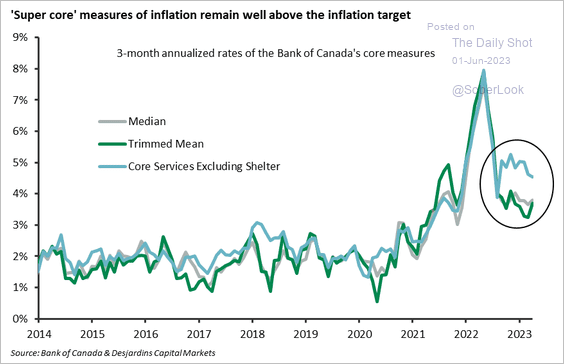 Source: Desjardins
——————–
3. Soaring immigration is spurring demand for housing.
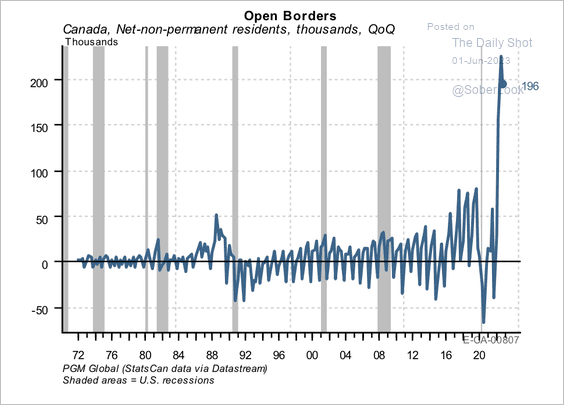 Source: PGM Global
4. Residential REITs could benefit from higher rental prices.
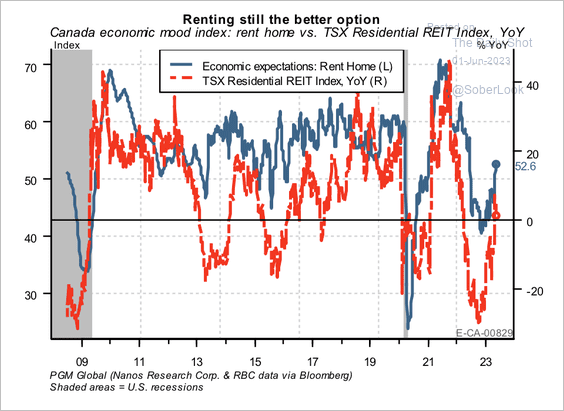 Source: PGM Global
Back to Index
The Eurozone
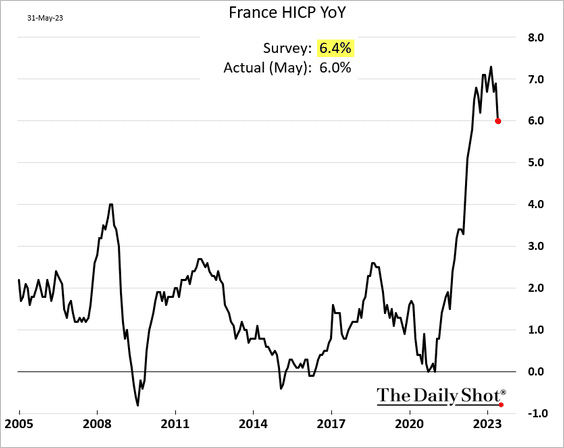
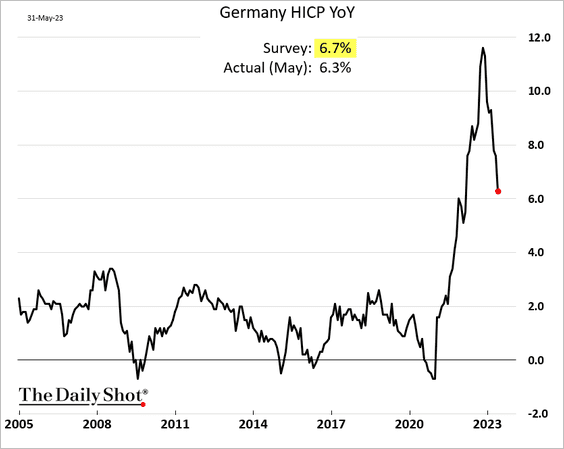
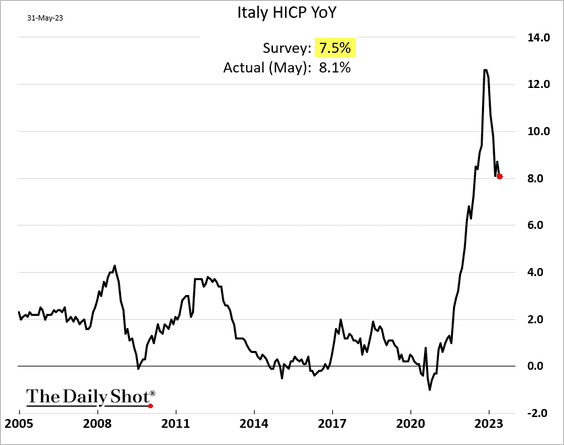
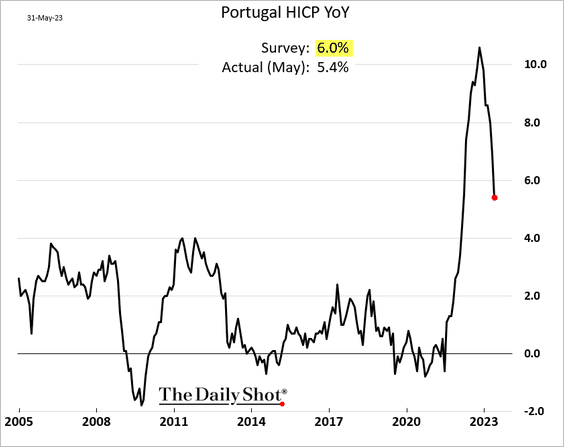
1. The May inflation figures were lower than expected, except for Italy.
• Spain: see the chart from yesterday.
• France:
• Germany:
• Italy:
• Portugal:
——————–
2. French household spending on goods declined in April.
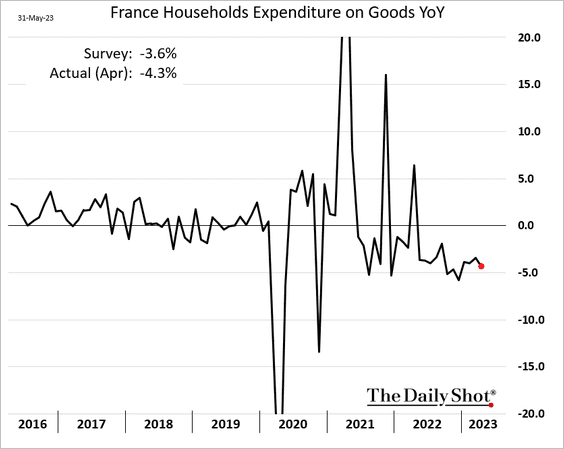
 Source: ING Read full article
——————–
3. Germany’s unemployment held steady in May.
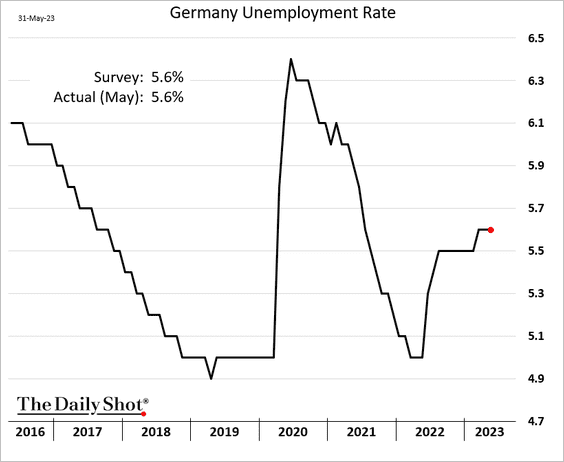
This chart shows Germany’s average hours per worker (over time).
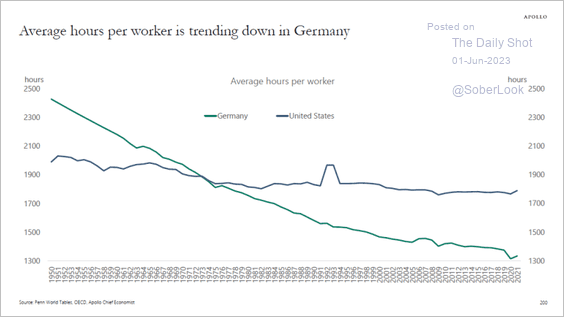 Source: Torsten Slok, Apollo
Back to Index
Europe
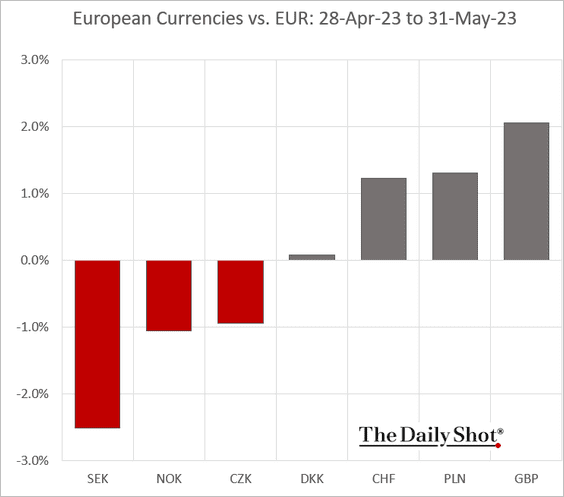
1. Let’s start with the May performance of select currencies against the euro.
2. European equity-market implied vol index (V2X) jumped this week, outpacing VIX.
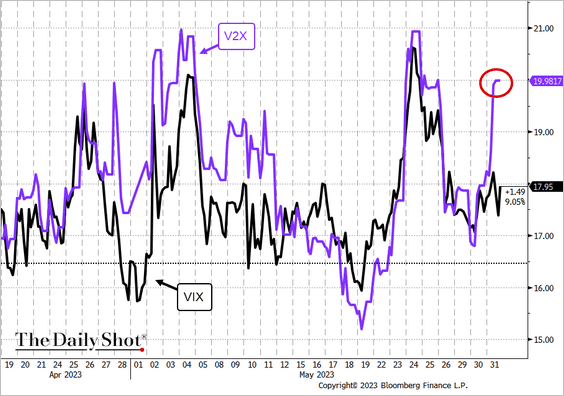 Source: @TheTerminal, Bloomberg Finance L.P.; h/t @themarketear
3. Large employers have been underperforming in the equity market.
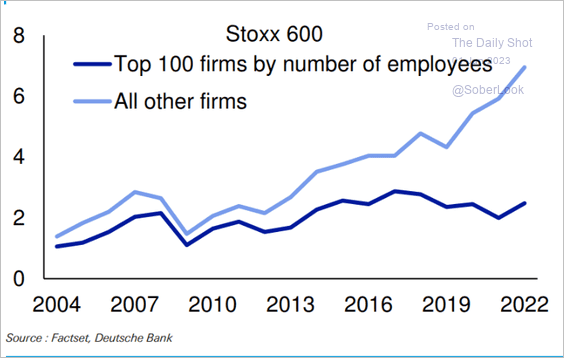 Source: Deutsche Bank Research
4. This chart shows the seasonality of tourism activity in the EU.
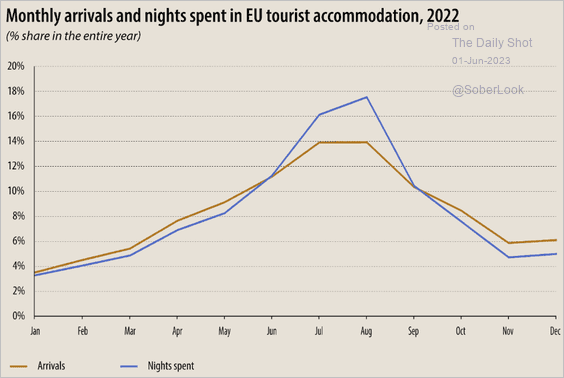 Source: Eurostat Read full article
Back to Index
Japan
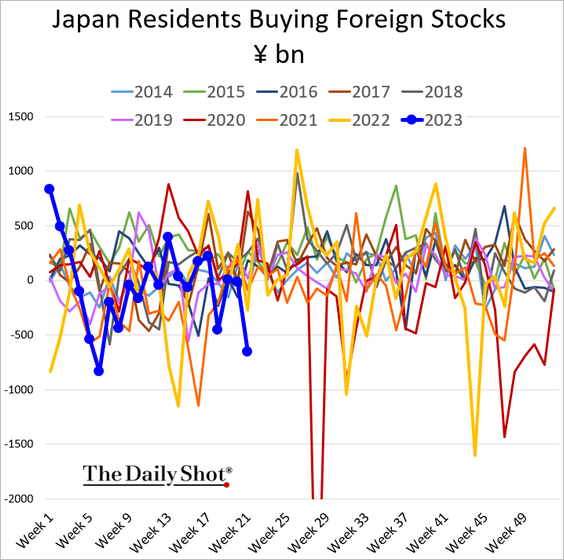
1. Japanese investors have been dumping foreign stocks as domestic shares surge.
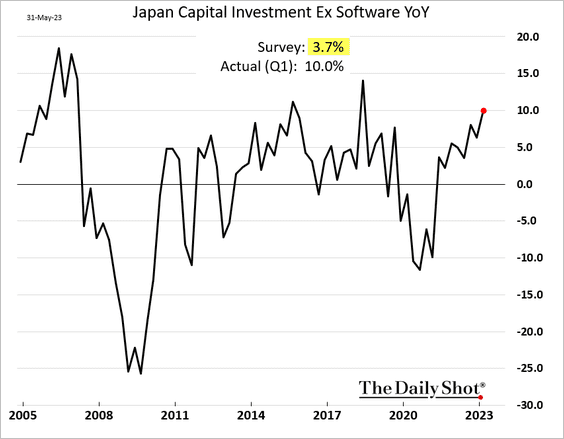
2. CapEx growth has been strong.
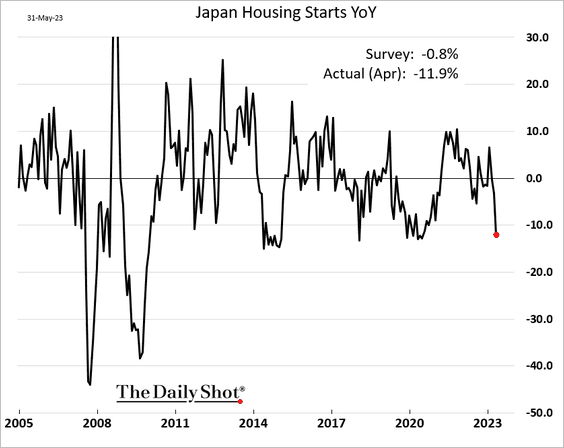
3. Housing starts deteriorated in April.
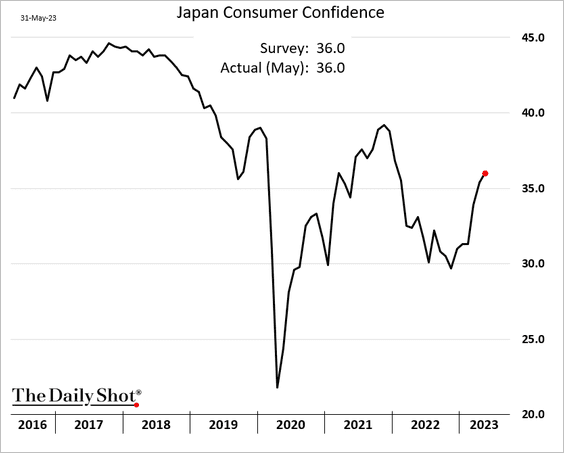
4. Consumer confidence edged higher in May.
Back to Index
Asia-Pacific
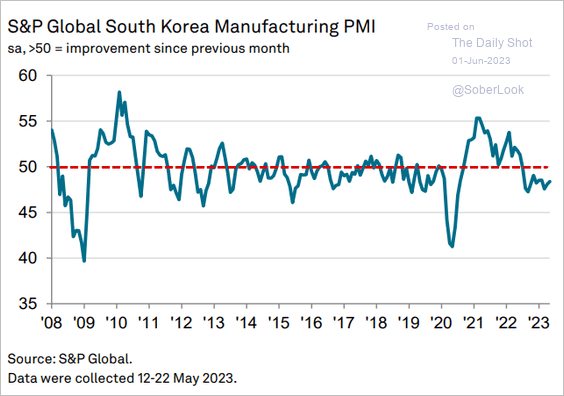
1. South Korea’s manufacturing activity remains in contraction territory.
 Source: S&P Global PMI
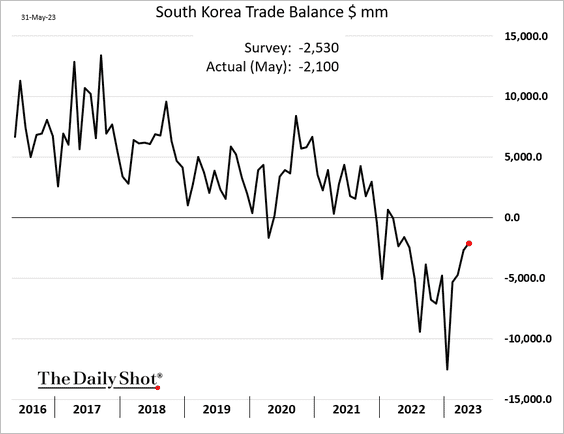
The nation’s trade deficit continues to narrow.
——————–
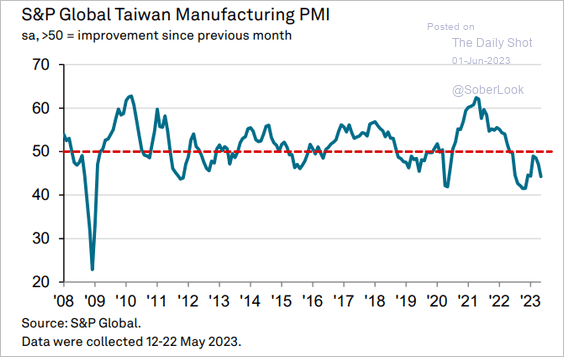
2. Taiwan’s manufacturing contraction accelerated last month.
 Source: S&P Global PMI
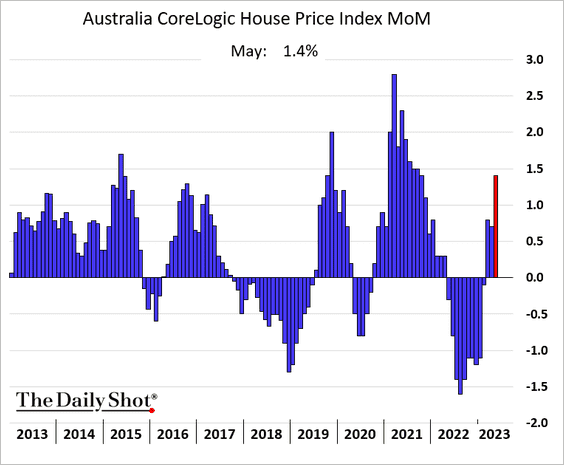
3. Australia’s home prices jumped in May.
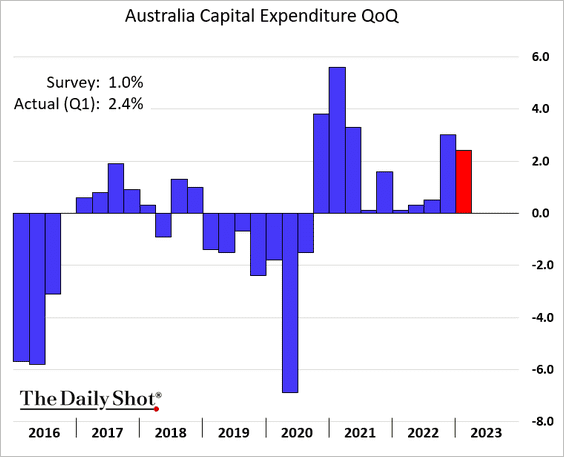
Separately, the country’s Q1 CapEx growth topped expectations.
Back to Index
China
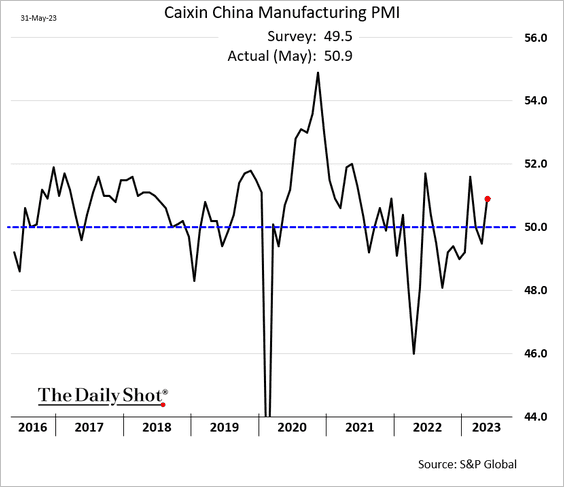
1. Unlike the official PMI, the manufacturing index from S&P Global showed factory activity growing in May.
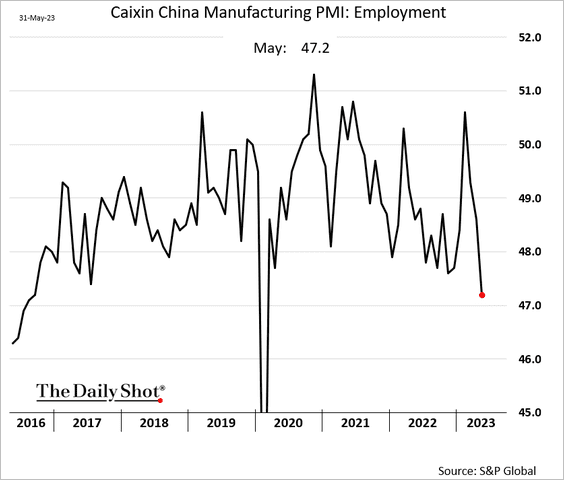
But factory employment is shrinking.
——————–
2. While property completions have rebounded, sales and starts remain weak.
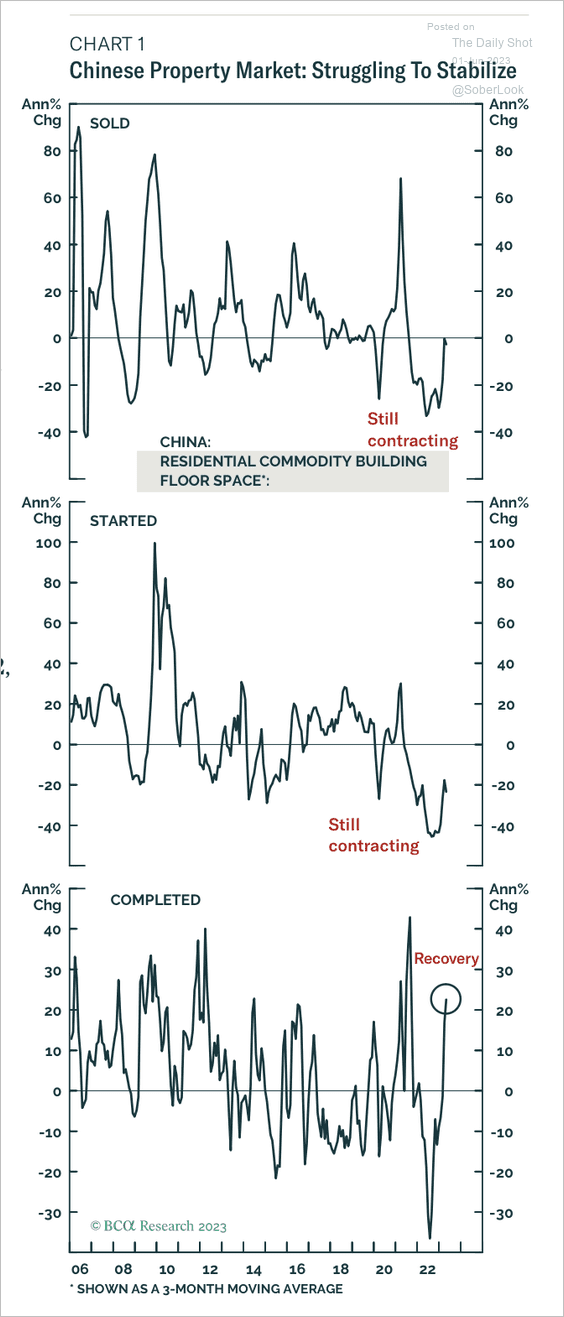 Source: BCA Research
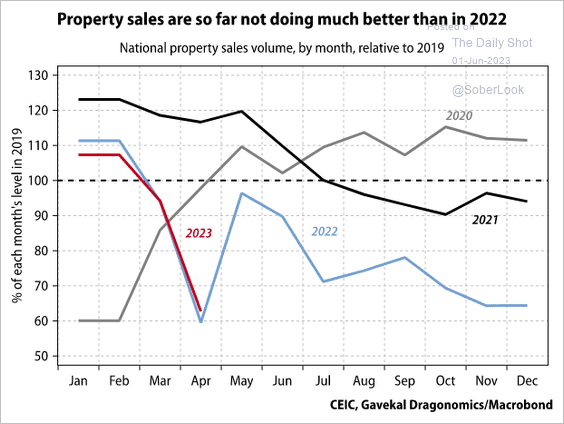 Source: Gavekal Research
——————–
3. China faces demographic headwinds in the decades ahead.
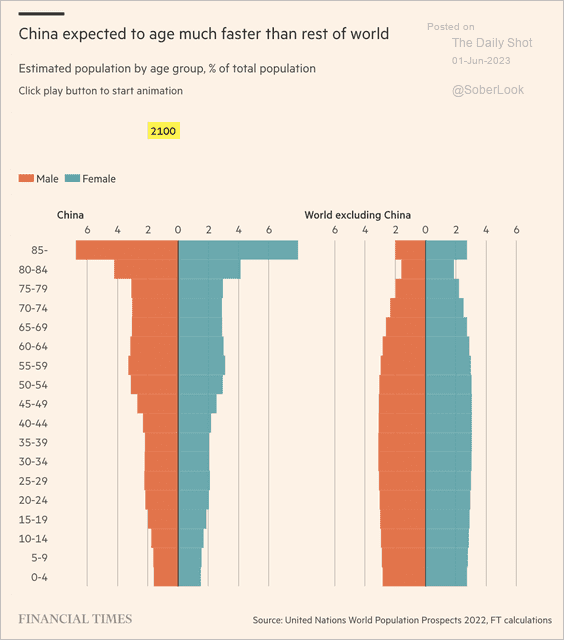 Source: @financialtimes Read full article
Back to Index
Emerging Markets
1. Let’s run through Asian manufacturing PMIs.
• India (remarkably strong growth):
 Source: S&P Global PMI
• Malaysia (contraction continues):
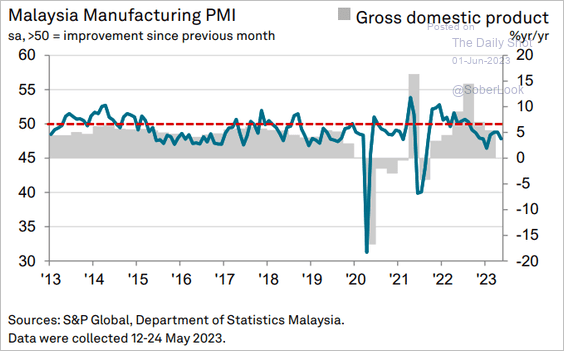 Source: S&P Global PMI
• The Philippines (faster growth in May):
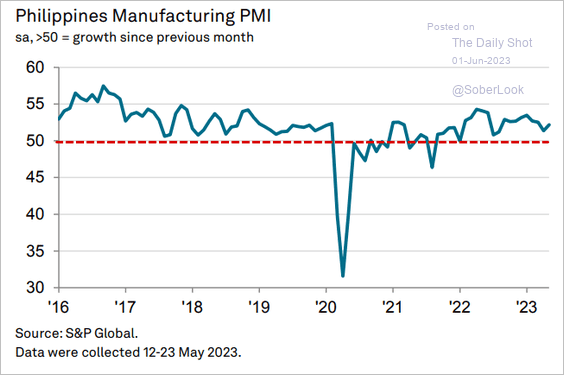 Source: S&P Global PMI
• Thailand (exceptionally strong growth):
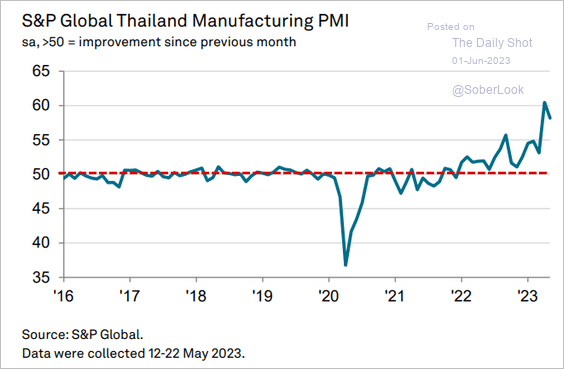 Source: S&P Global PMI
• Vietnam (contraction deepens):
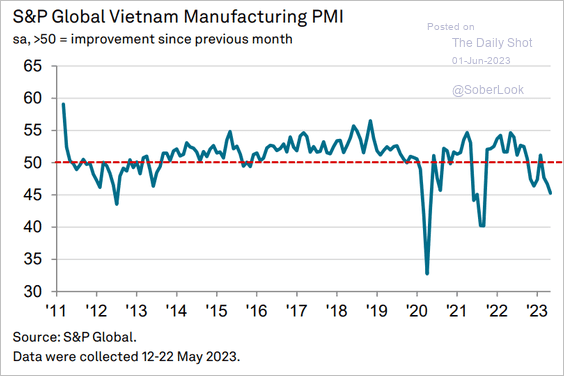 Source: S&P Global PMI
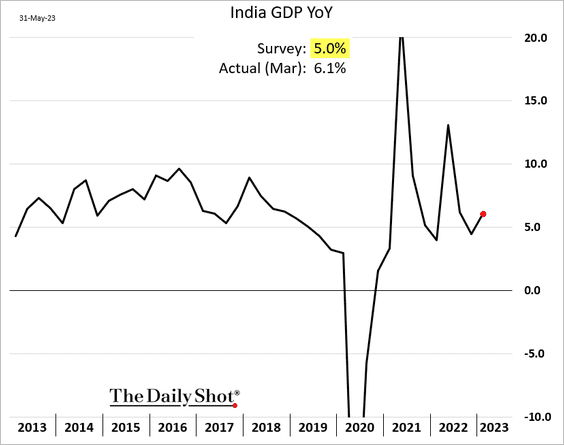
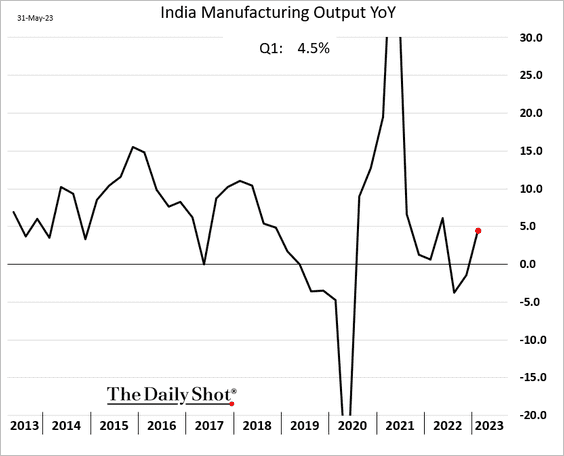
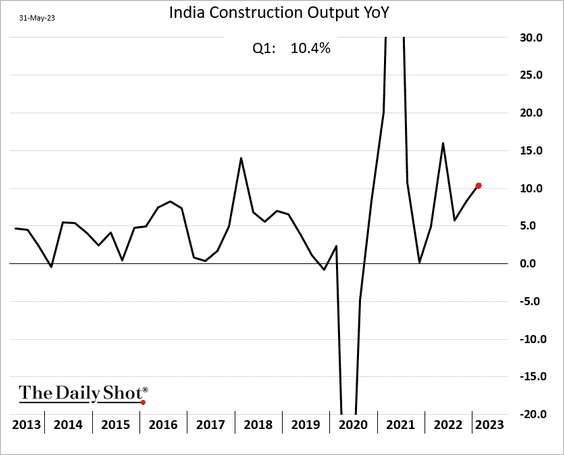
2. India’s GDP topped expectations.
 Source: Reuters Read full article
 Manufacturing and construction output strengthened.
——————–
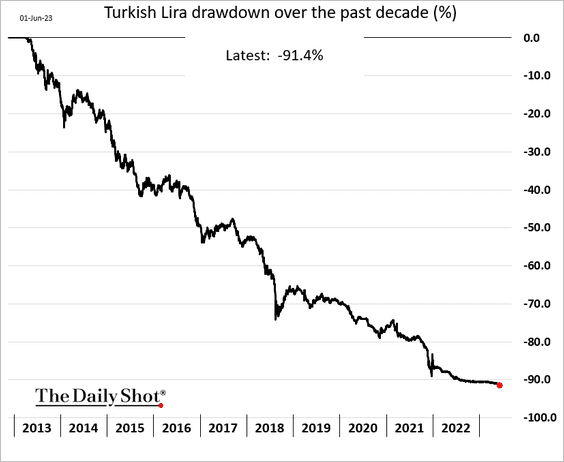
3. Here is the Turkish lira’s drawdown (vs. USD) over the past ten years.
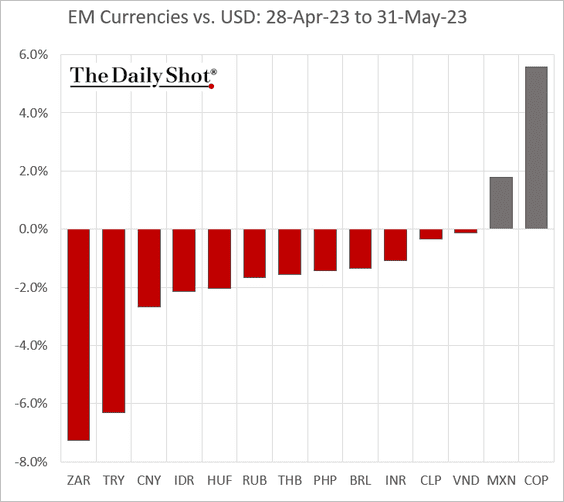
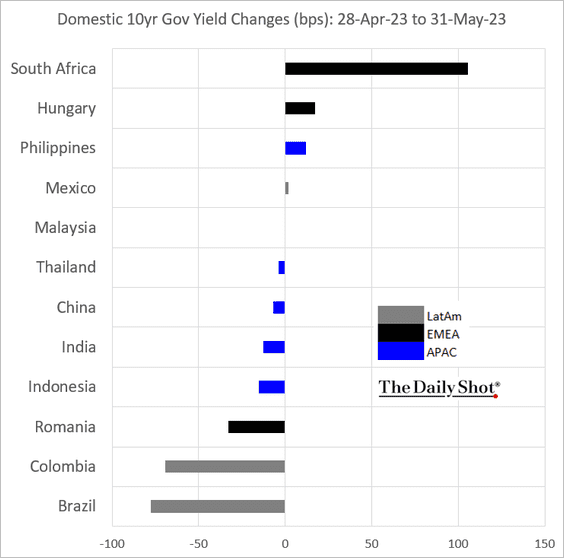
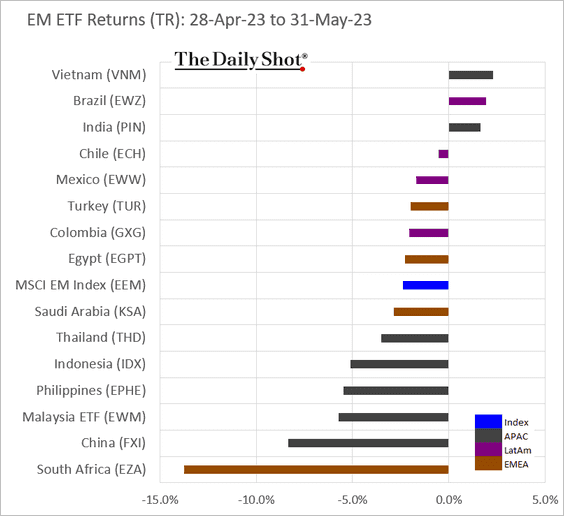
4. Next, we have some performance data for May.
• Currencies:
• Bond yields:
• Equity ETFs:
Back to Index
Commodities
1. This chart shows the contributions to global lithium production.
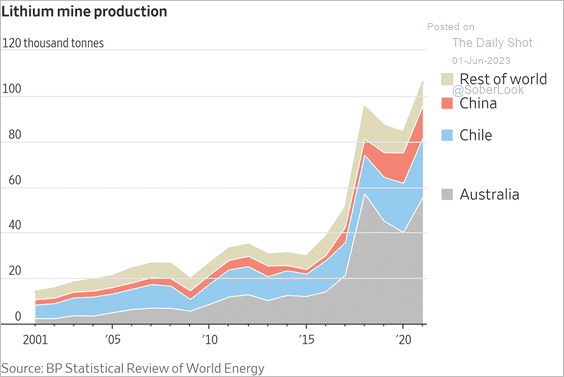 Source: @WSJ Read full article
2. Brent crude is at support.
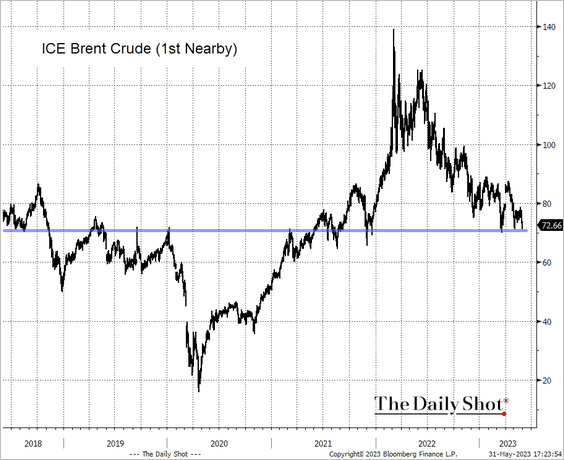 Source: @TheTerminal, Bloomberg Finance L.P.
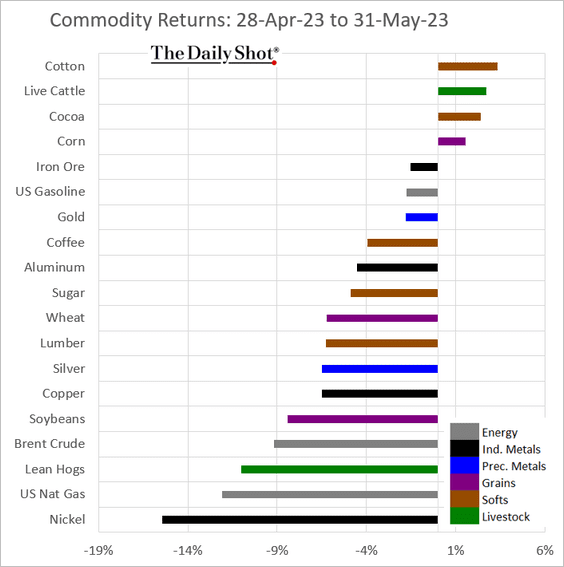
3. Here is last month’s performance across key commodity markets.
Back to Index
Equities
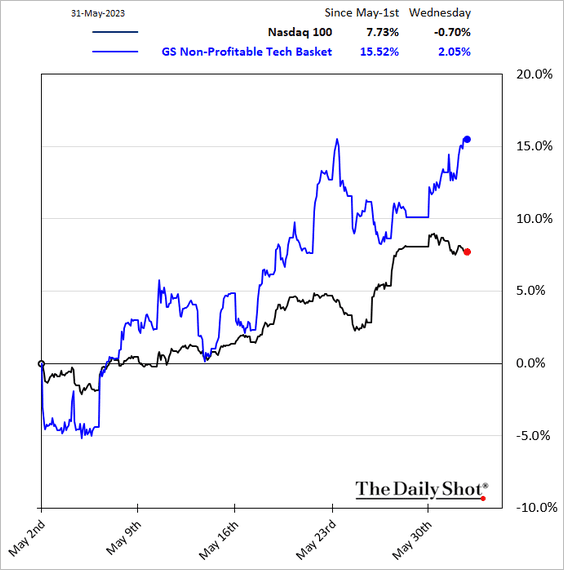
1. Speculative tech stocks are outperforming again.
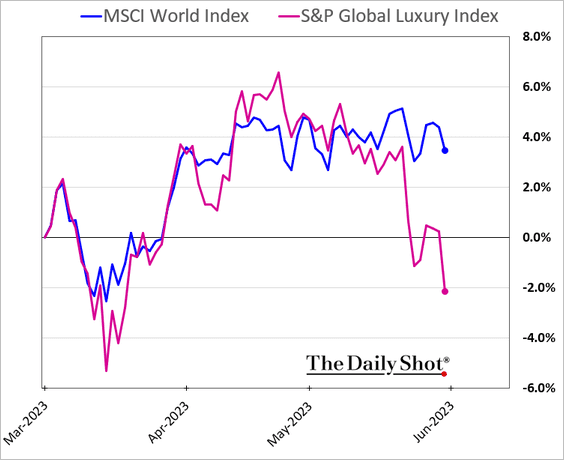
2. Luxury stocks are rolling over as China’s recovery disappoints.
3. How will equity factors perform in 2023?
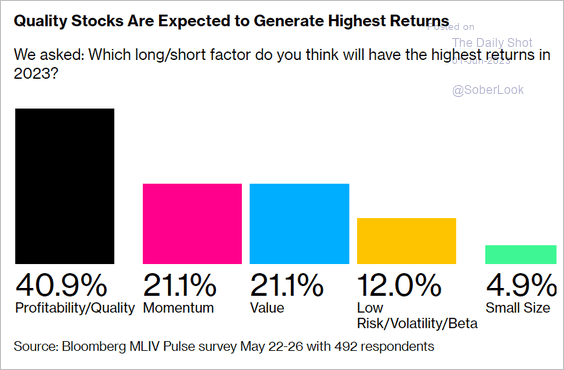 Source: @markets Read full article
4. There are no seasonal tailwinds in June.
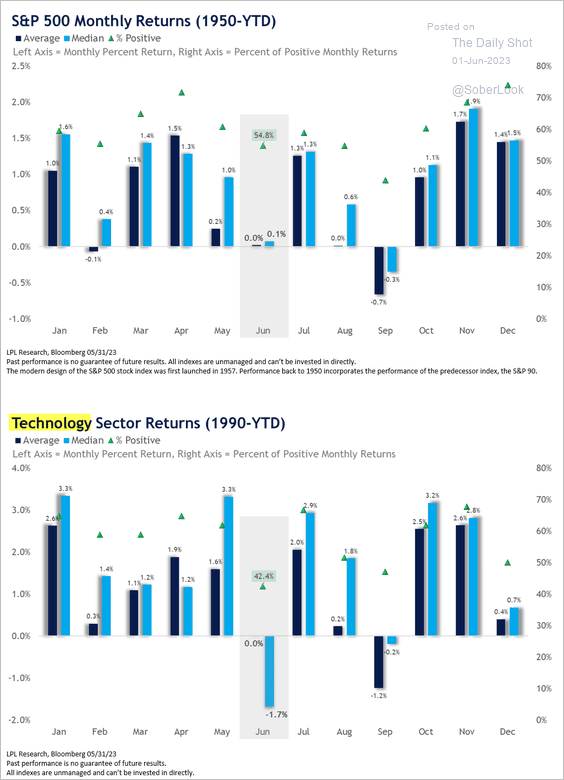 Source: LPL Research
5. Margins for the S&P 500 equal-weight index have been deteriorating.
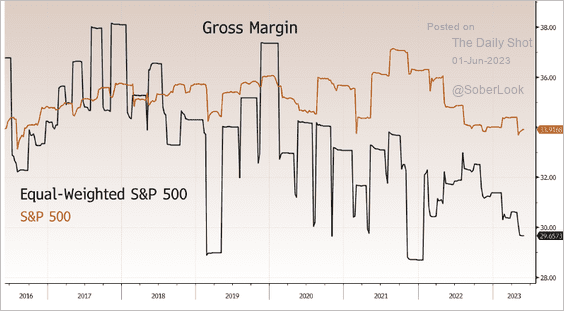 Source: Simon White, Bloomberg Markets Live Blog
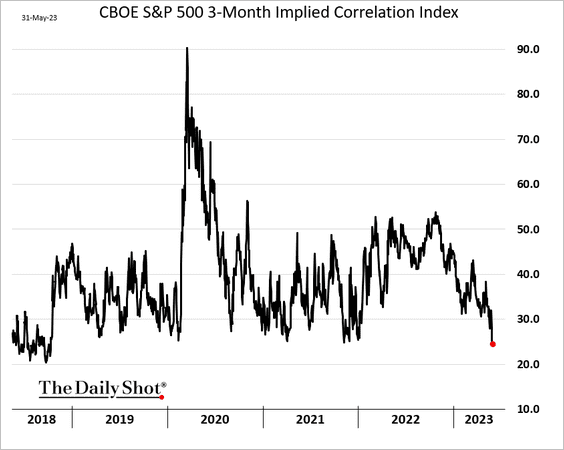
6. S&P 500 implied correlation has been sinking.
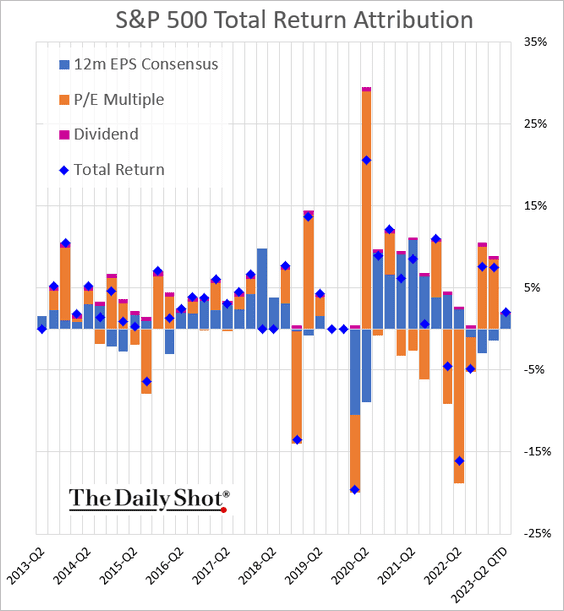
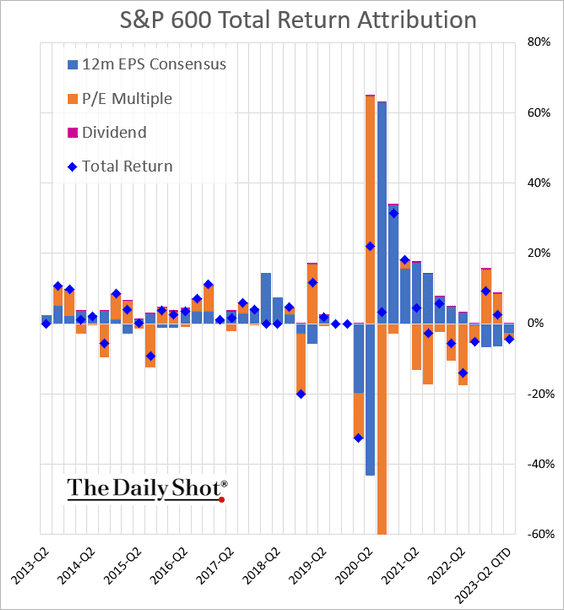
7. Next, let’s take a look at quarterly return attributions.
• S&P 500:
• S&P 600 (small caps):
——————–
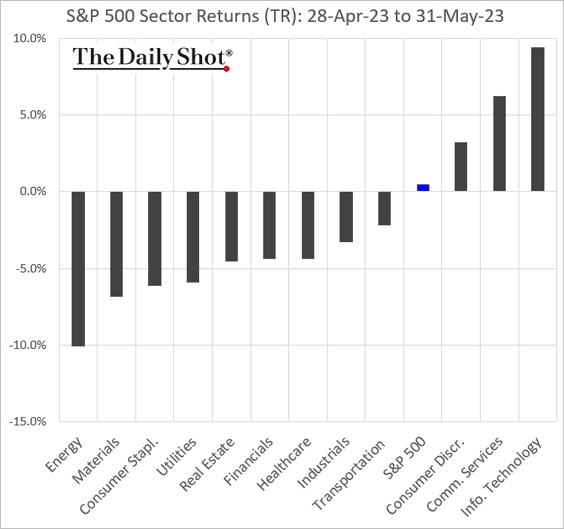
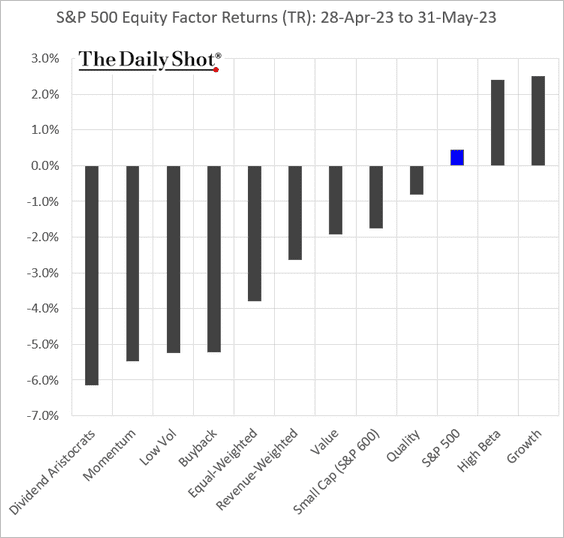
8. Finally, here is a look at performance data for May.
• Sectors:
• Equity factors:
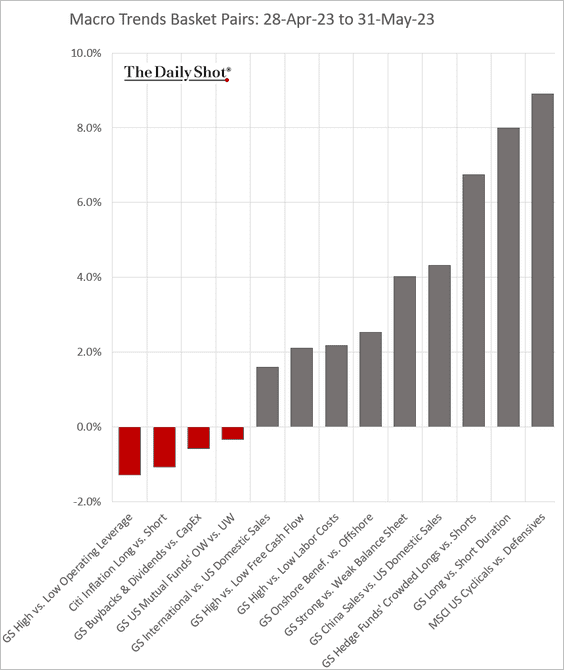
• Macro basket pairs’ relative performance:
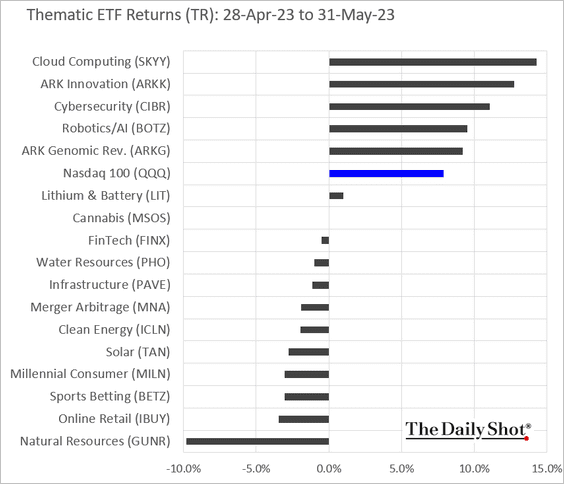
• Thematic ETFs:
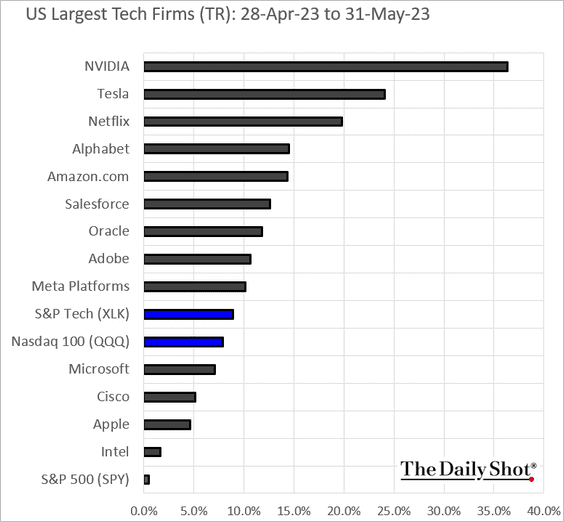
• Largest US tech firms:
Back to Index
Credit
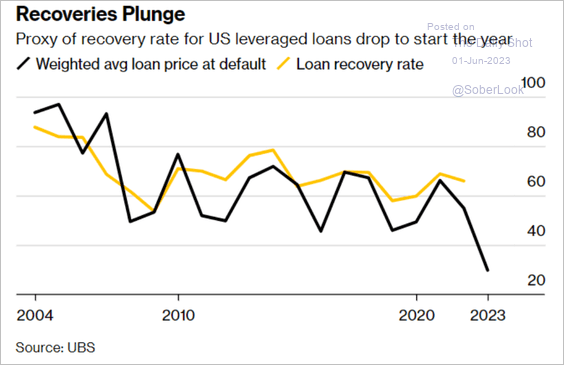
1. Deutsche Bank sees the leveraged loan default rate reaching the highest level since the GFC.
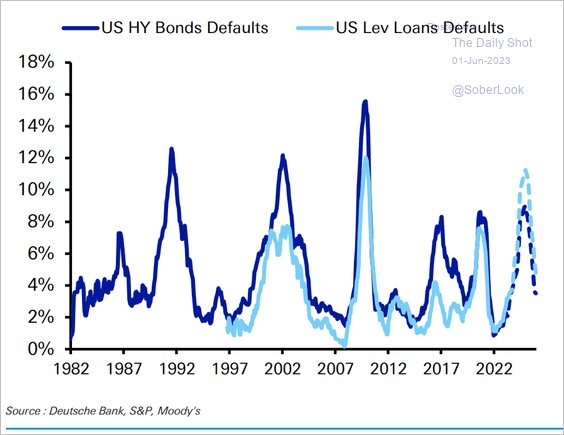 Source: Deutsche Bank Research
Leveraged loan recovery rates have been worsening.
 Source: UBS Research; Variant Perception
——————–
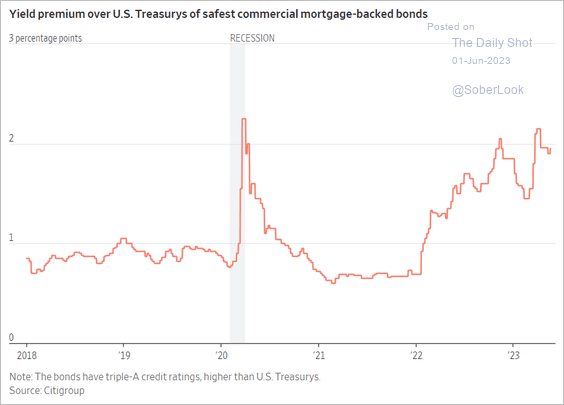
2. CMBS spreads remain elevated.
 Source: @WSJ Read full article
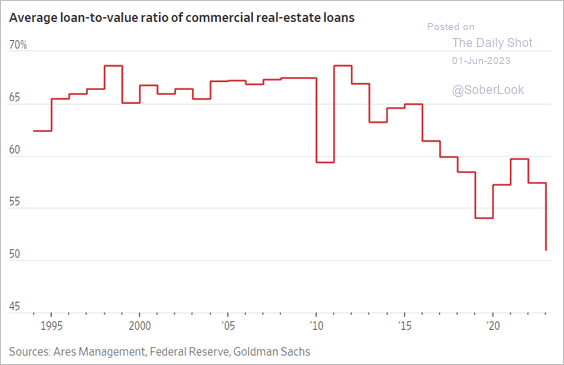
3. Banks have become much more cautious in extending credit backed by commercial real estate.
 Source: @WSJ Read full article
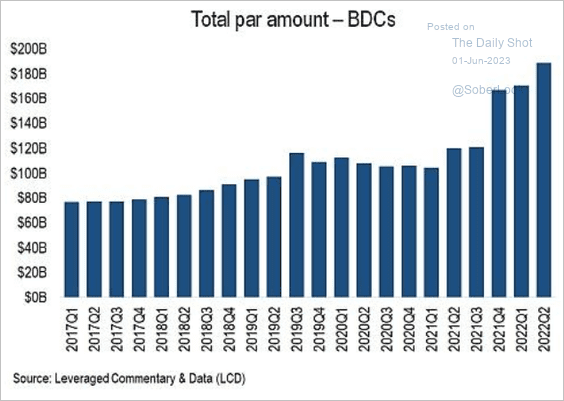
4. BDCs are becoming a key source of capital for private companies.
 Source: @lcdnews; Variant Perception
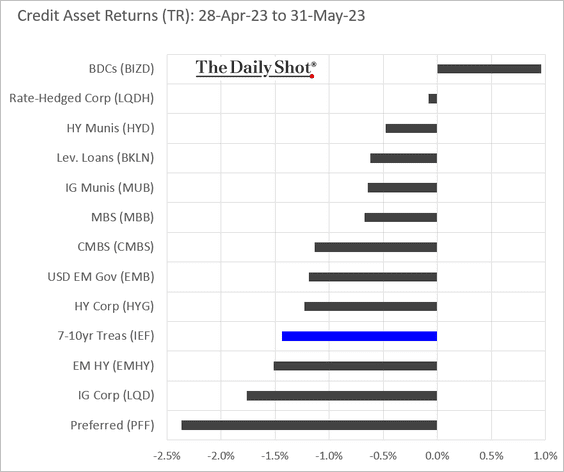
5. Next, we have some performance data for May.
Back to Index
Rates
1. Once the debt ceiling is lifted, rebuilding the US Treasury’s account at the Fed will drain liquidity from the banking system.
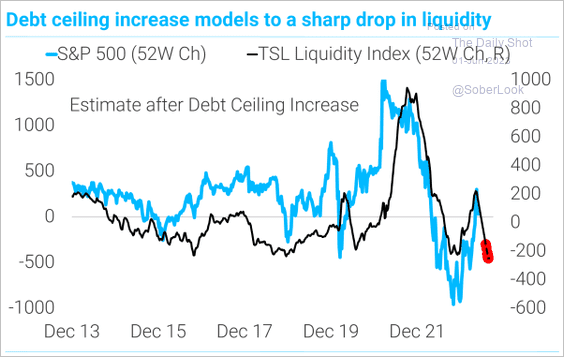 Source: TS Lombard
2. Households have been buying Treasuries.
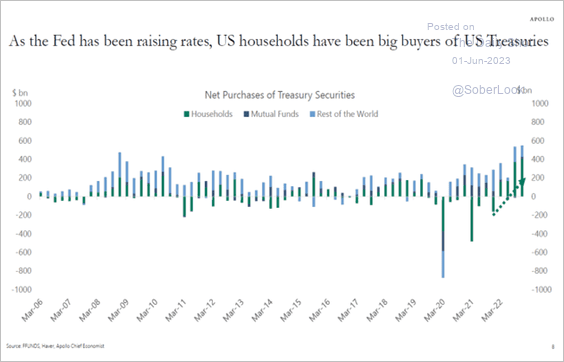 Source: Torsten Slok, Apollo
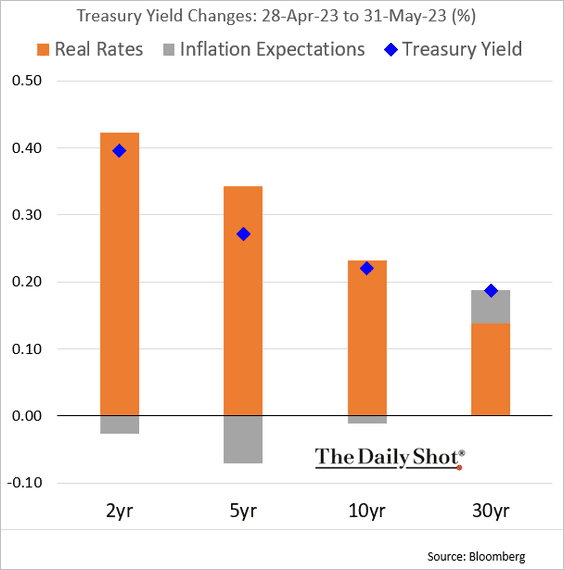
3. Here is the attribution of Treasury yield changes in May.
Back to Index
Global Developments
1. This chart shows the countries running a trade surplus with China.
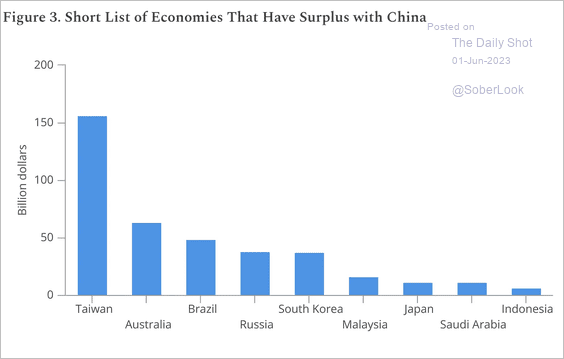 Source: MacroPolo Read full article
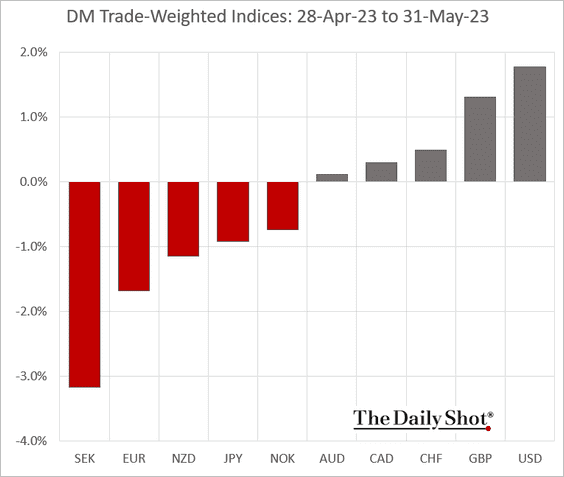
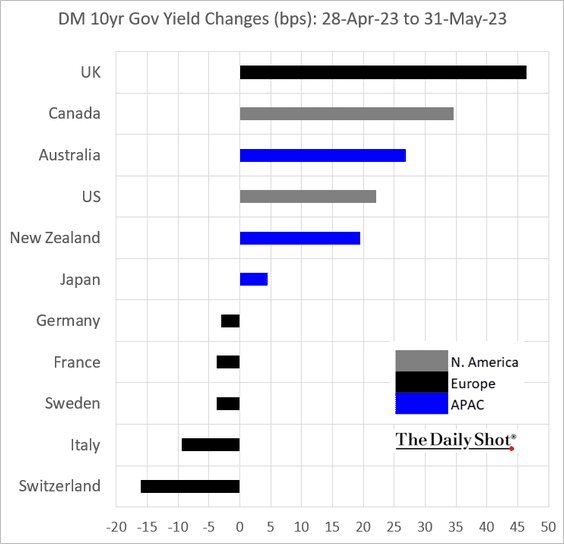
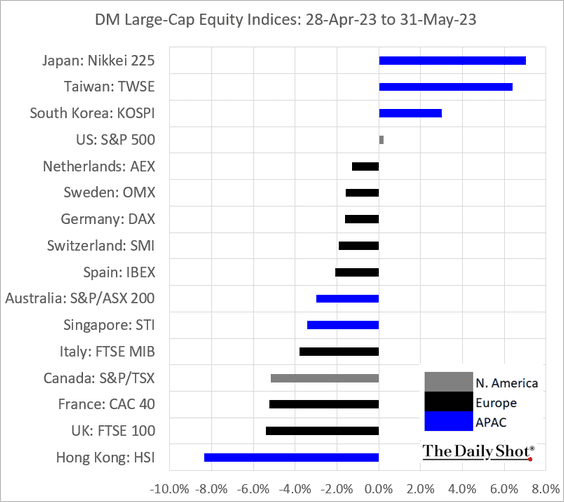
2. Next, we have some DM performance data for May.
• Trade-weighted currency indices:
• Bond yields:
• Large-cap equity indices:
——————–
Food for Thought
1. The use of ChatGPT in the US and Europe:
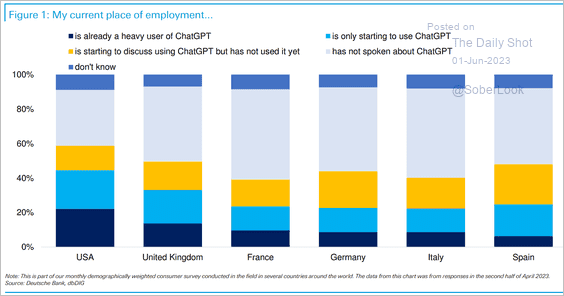 Source: Deutsche Bank Research
2. Occupational injuries:
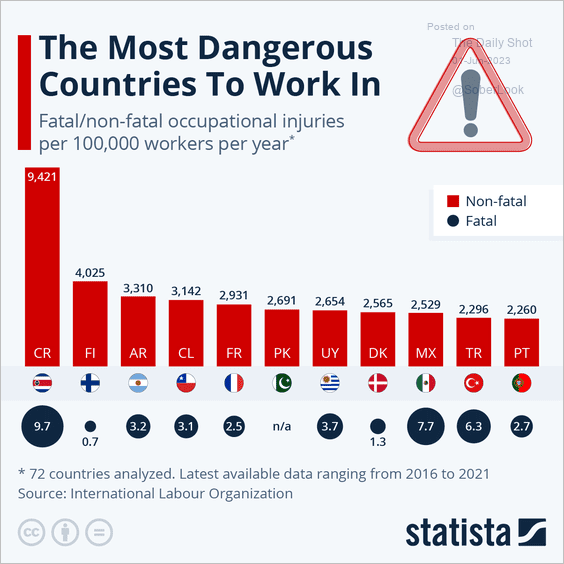 Source: Statista
3. The minimum wage in select states:
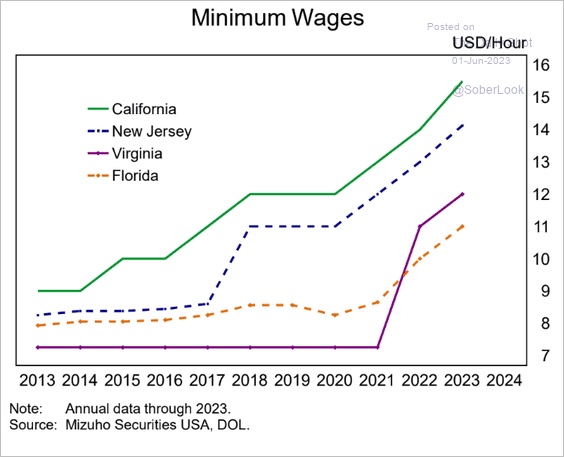 Source: Mizuho Securities USA
4. S&P 500 female CEOs:
 Source: @chartrdaily
5. Subsidies for EV and battery facilities:
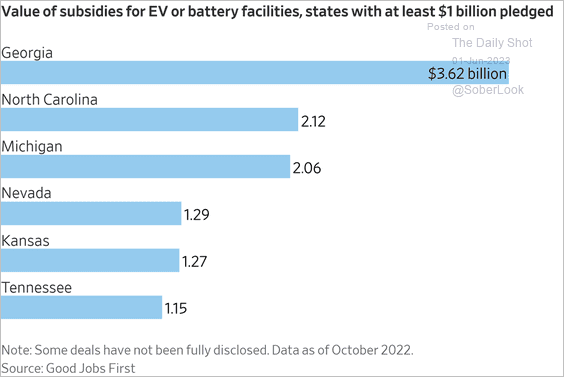 Source: @WSJ Read full article
6. Public support for legal abortion:
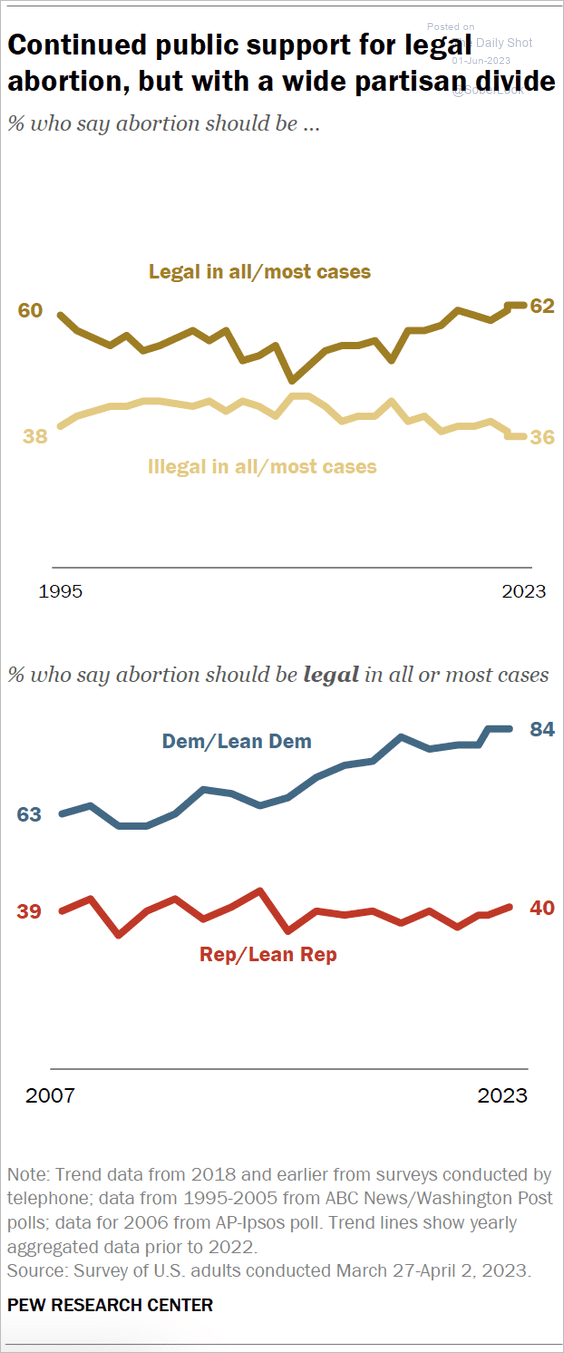 Source: Pew Research Center Read full article
7. How Americans view guns:
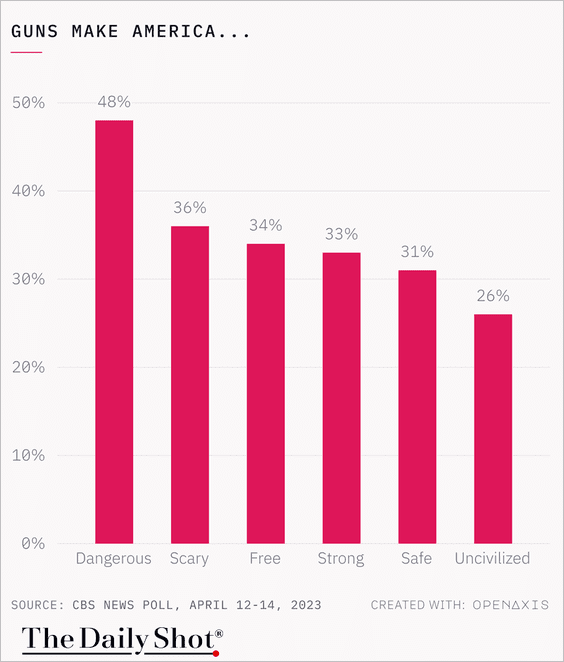 Source: @TheDailyShot
8. Losing access to parents’ Netflix account:
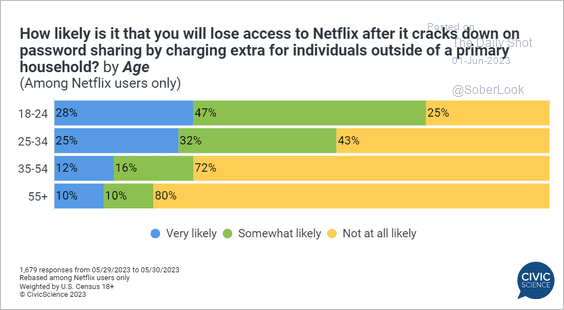 Source: @CivicScience Read full article
——————–
Back to Index