
The Daily Shot: 08-Jun-23
• The United States
• Canada
• The United Kingdom
• The Eurozone
• Europe
• Asia-Pacific
• China
• Emerging Markets
• Energy
• Equities
• Credit
• Global Developments
• Food for Thought
The United States
1. Mortgage applications were at multi-year lows last week, …
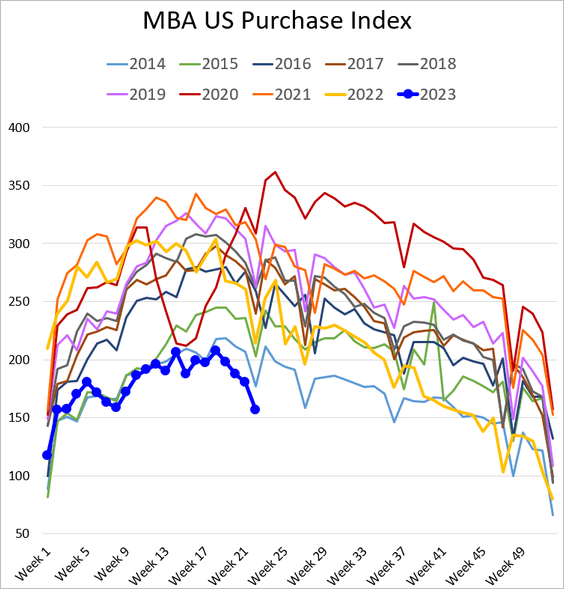
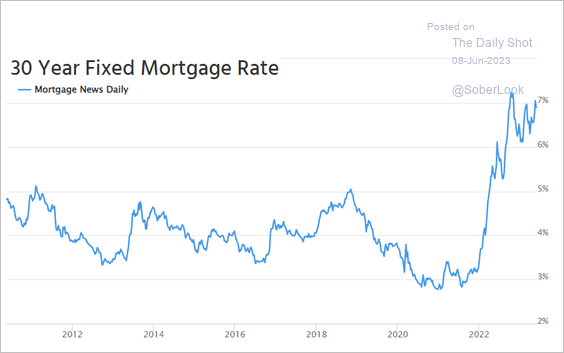
… as mortgage rates hover near 7%.
 Source: Mortgage News Daily
This chart shows the number of rate locks.
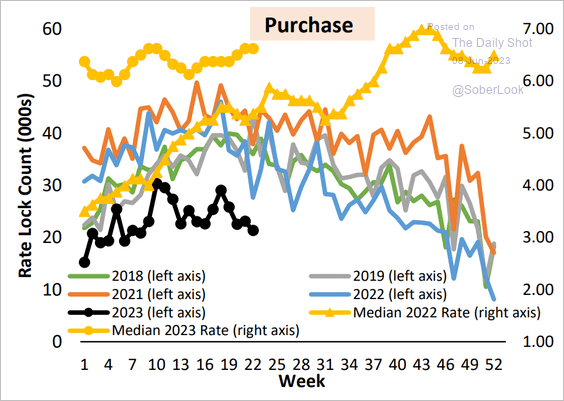 Source: AEI Housing Center
——————–
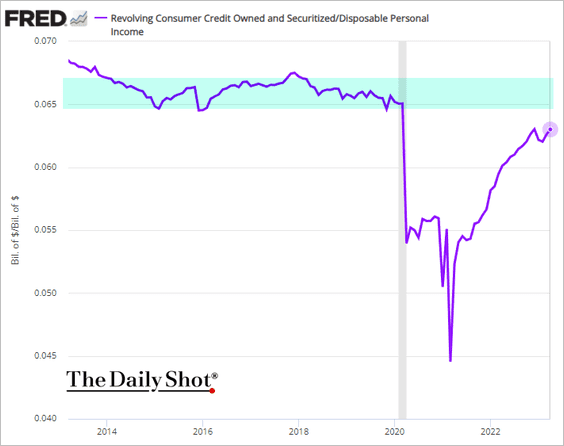
2. Consumer credit growth remained robust in April.
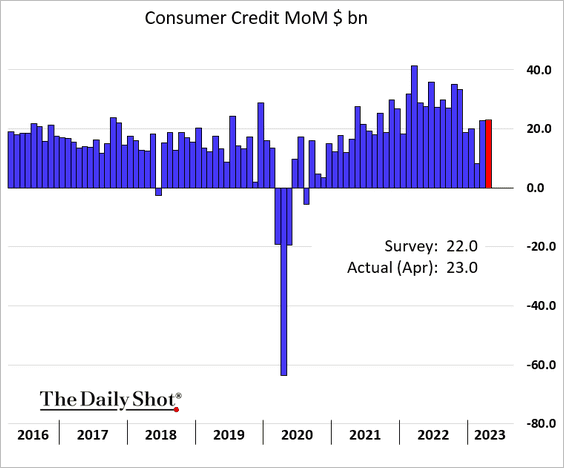
 Source: MarketWatch Read full article
• Credit card balances held below pre-COVID levels as a share of disposable income.
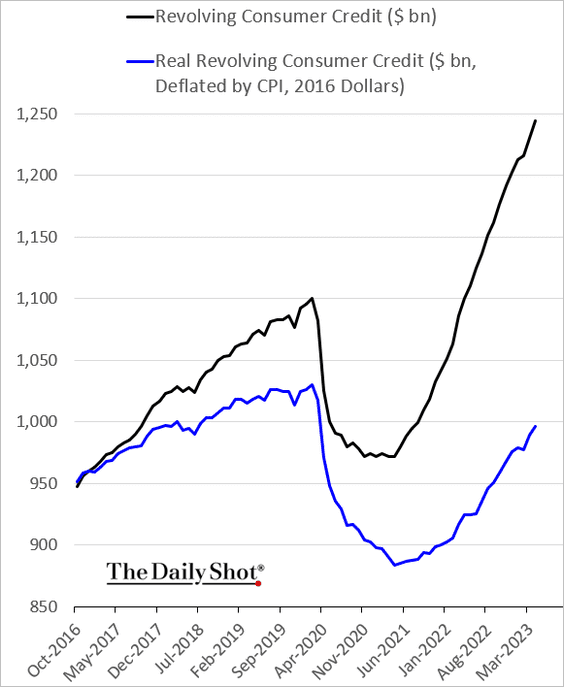
• This chart shows nominal and real credit card balances.
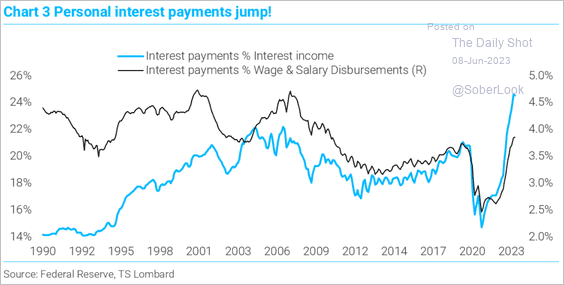
• Household interest payments have been climbing, …
 Source: TS Lombard
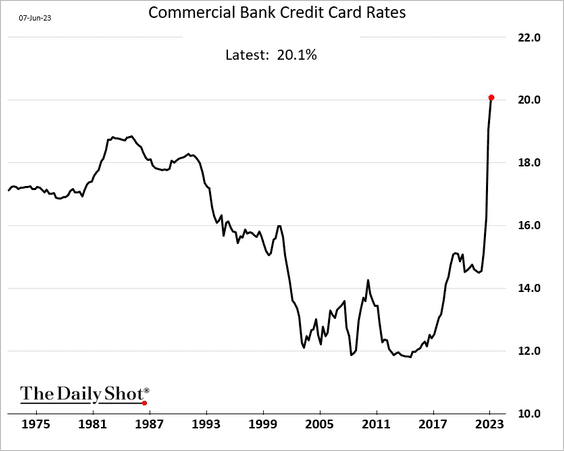
… amid record-high credit card interest rates.
——————–
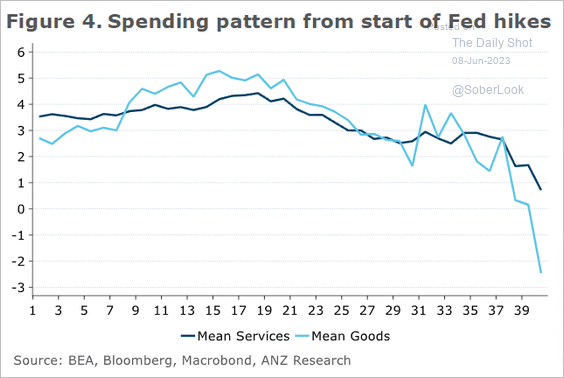
3. It takes some time for the Federal Reserve’s rate hikes to significantly impact consumer spending.
ANZ Research: – … monetary policy works with a lag and the FOMC needs to be patient. Figure 4 traces the mean of year-on-year real PCE expenditure on goods and services in months following the first Fed rate rise. We use the average of tightening cycles dating back to 1967, excluding the current cycle. On average annual growth in spending tends to peak 15 to 18 months after the Fed starts raising rates and slows sustainably over the following 15 months …
 Source: @ANZ_Research
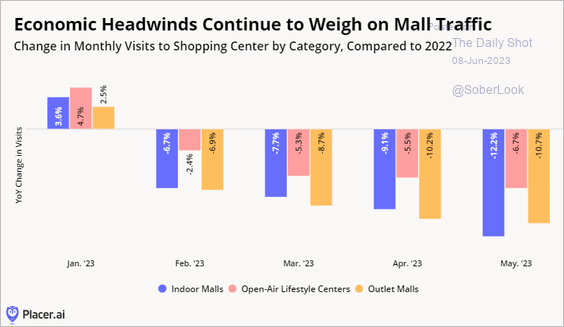
• Mall visits are down meaningfully relative to last year.
 Source: Placer.ai
——————–
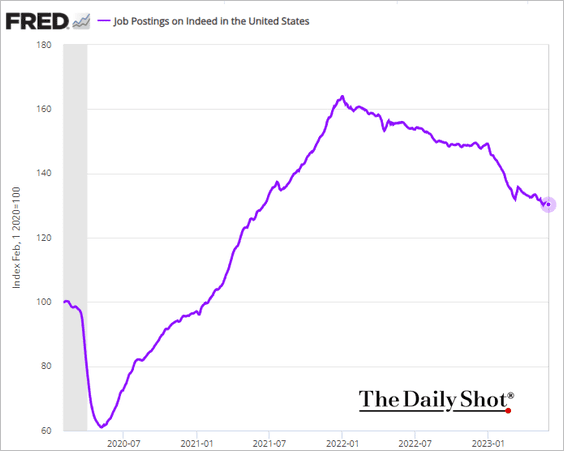
4. Job postings on Indeed keep trending lower.
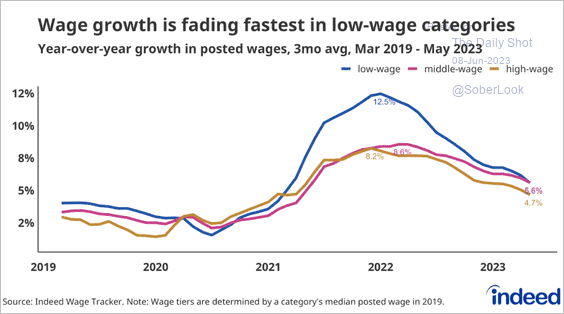
Gains in posted wages continue to moderate.
 Source: Indeed
——————–
5. Here is Morgan Stanley’s cycle indicator.
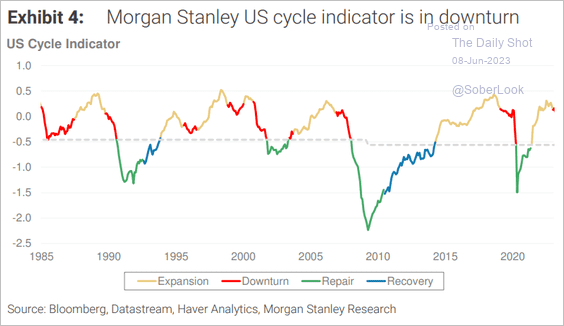 Source: Morgan Stanley Research
6. Manufacturing confidence has been deteriorating. Here is the sentiment index from the National Association of Manufacturers.
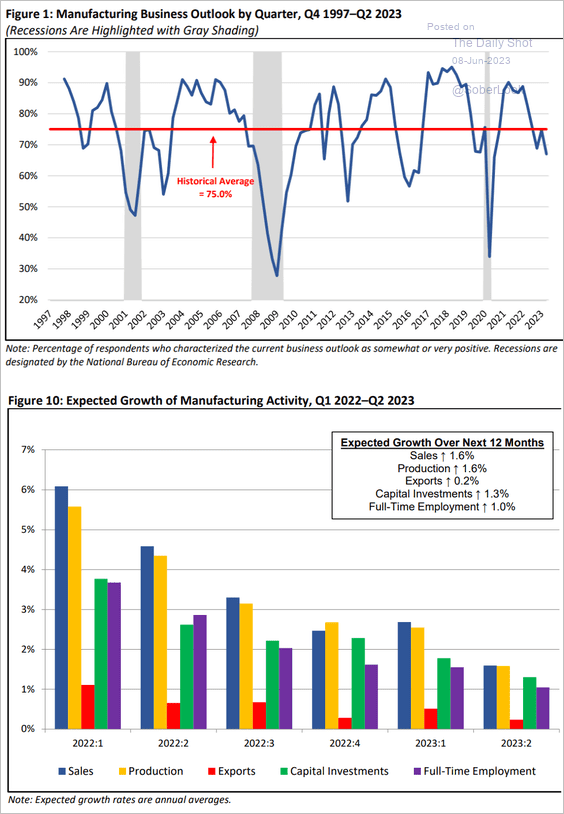 Source: NAM
 Source: @axios Read full article
——————–
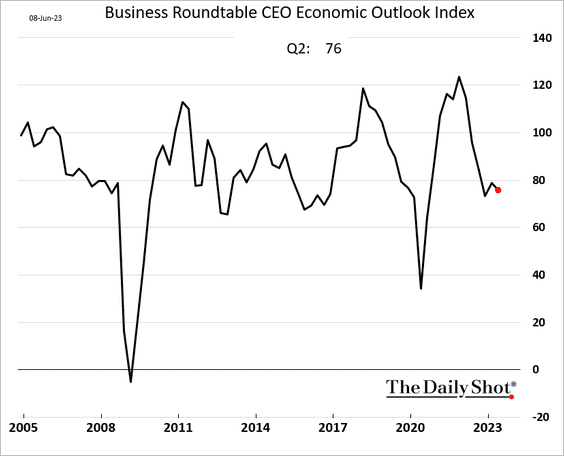
7. CEO sentiment edged lower in Q2.
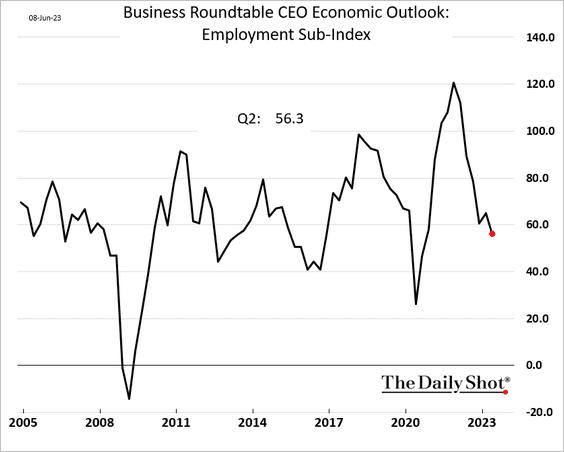
CEOs are becoming less inclined to hire.
——————–
8. The trade deficit widened sharply in April.
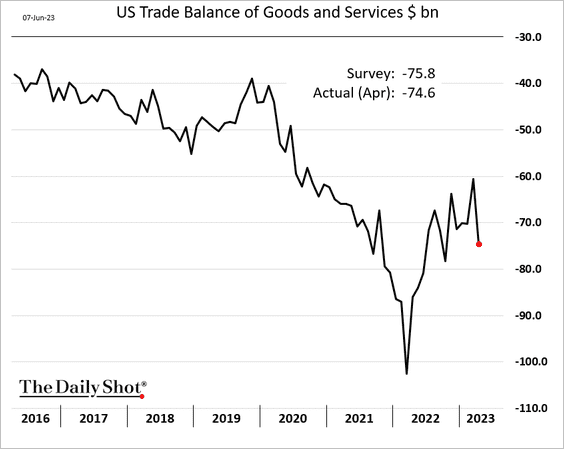
 Source: Reuters Read full article
Back to Index
Canada
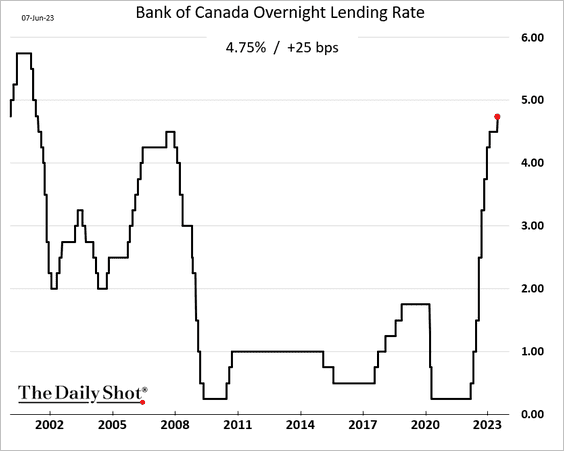
1. The BoC surprised the markets with a rate hike, …
 Source: Reuters Read full article
… amid sticky inflation and rebounding housing market.
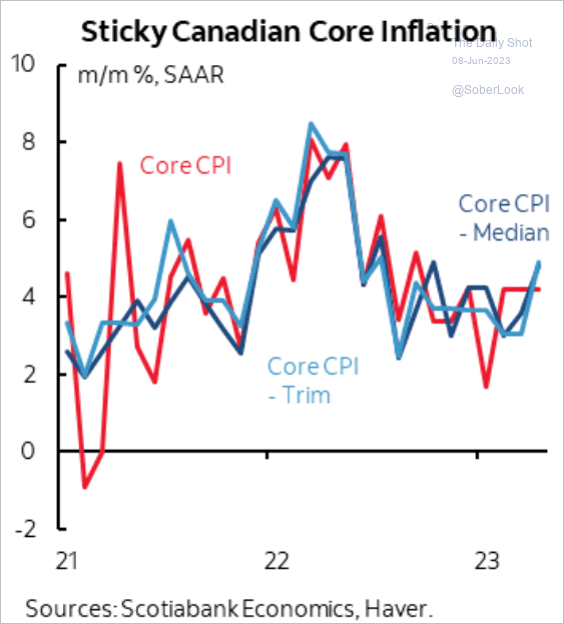 Source: Scotiabank Economics
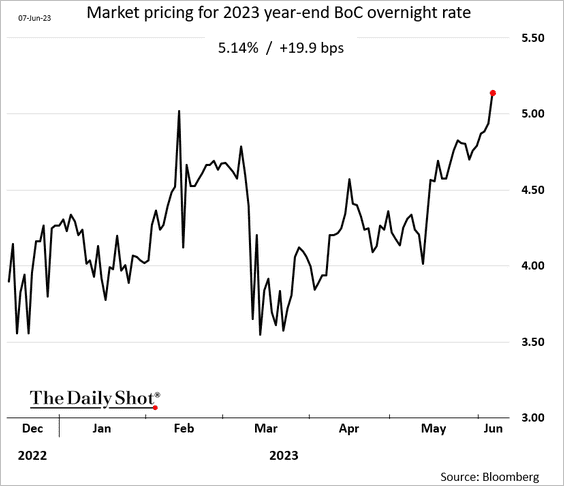
More rate increases are now priced in.
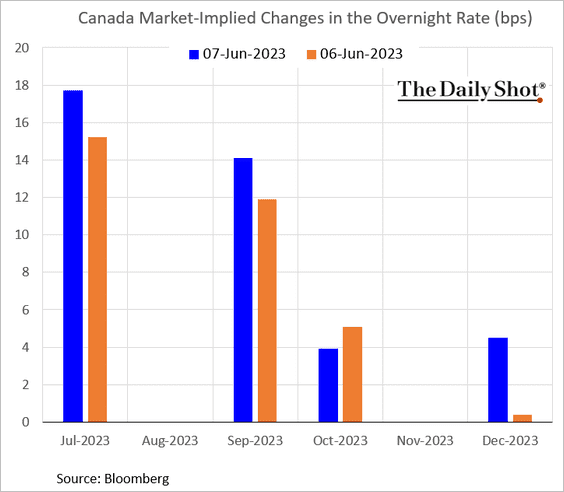
The market sees the overnight rate hitting 5.14% by the end of the year.
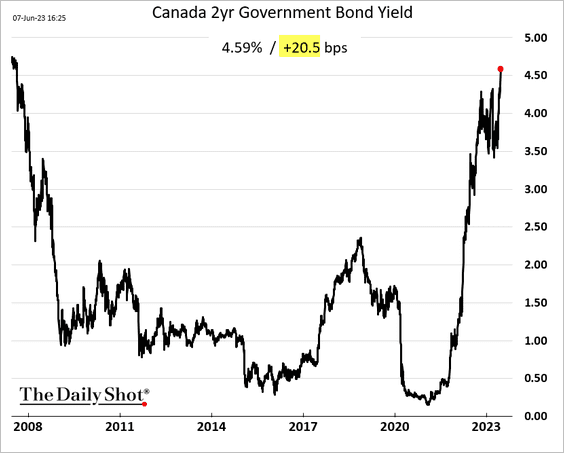
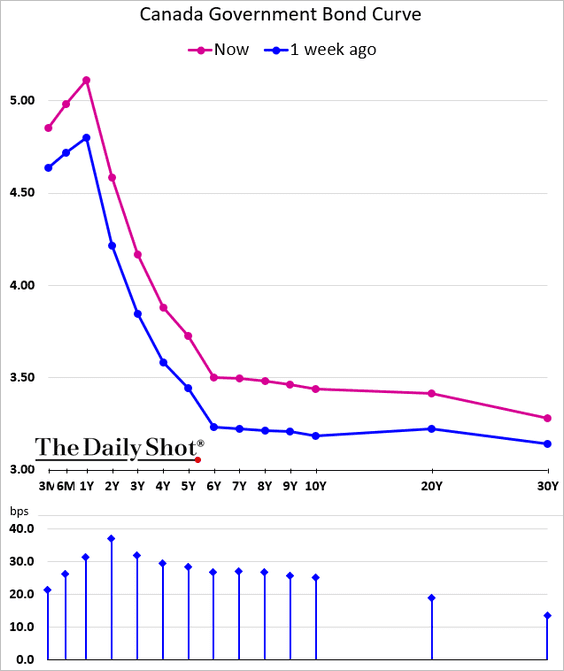
2. Bond yields surged.
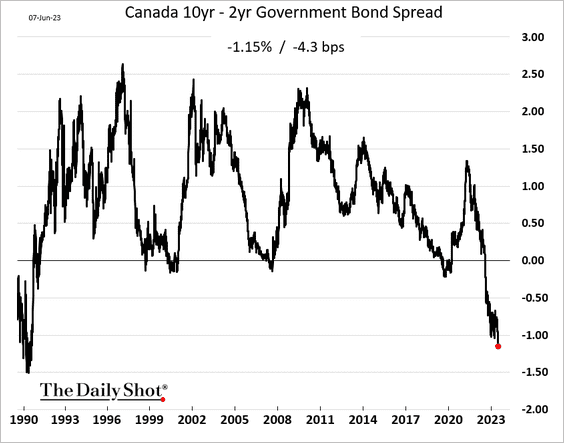
The yield curve is now most inverted since the early 1990s.
——————–
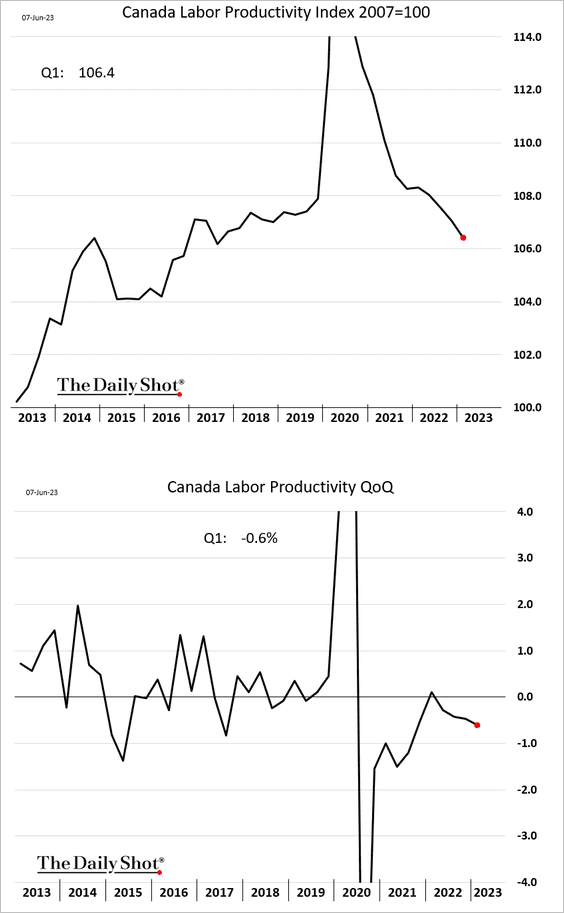
3. Labor productivity continues to weaken.
Back to Index
The United Kingdom
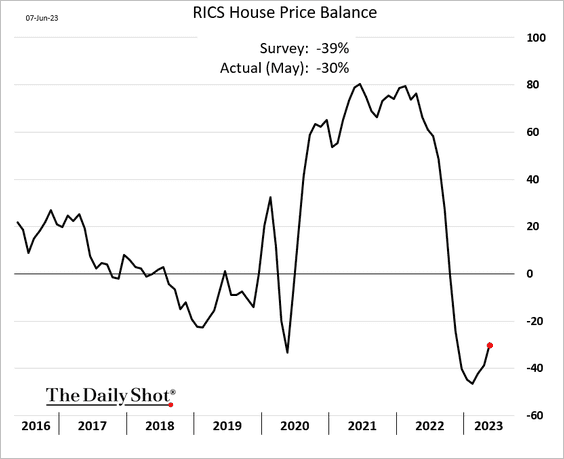
1. The housing market is starting to stabilize.
 Source: Reuters Read full article
——————–
2. UK rates are expected to peak much later than other advanced economies.
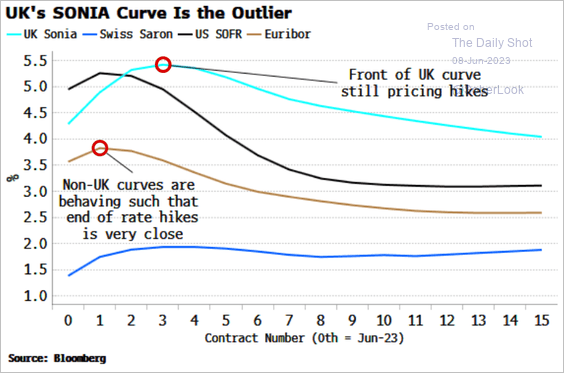 Source: Simon White, Bloomberg Markets Live Blog
Back to Index
The Eurozone
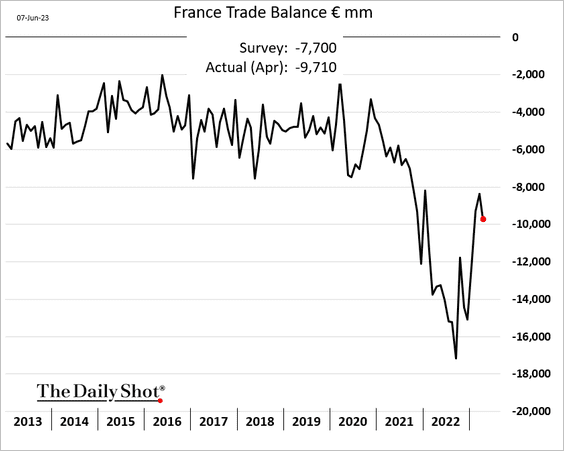
1. French trade deficit widened in April.
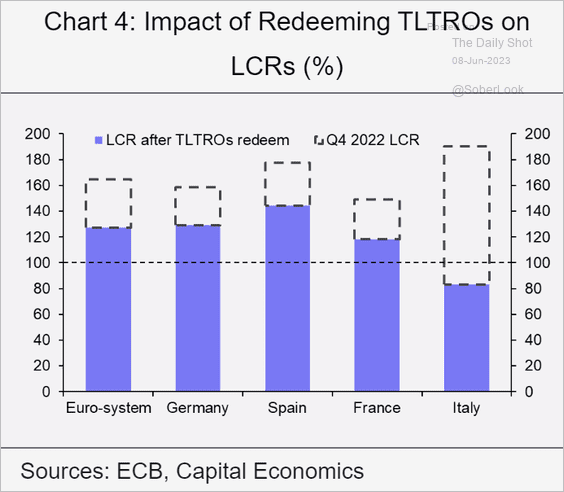
2. Bank liquidity, as measured by the Liquidity Coverage Ratio (LCR), is expected to decline sharply over the next eighteen months as approximately €1 trillion of TLTROs are set to be redeemed, according to Capital Economics.
 Source: Capital Economics
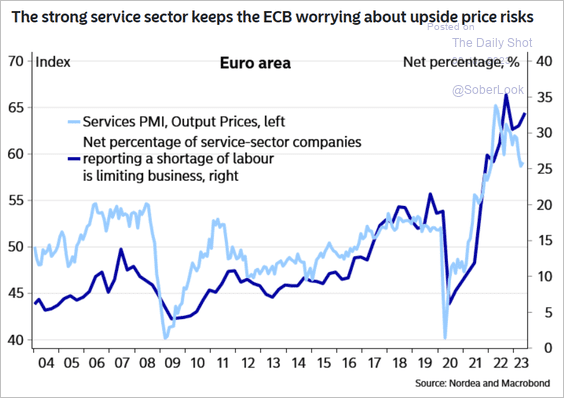
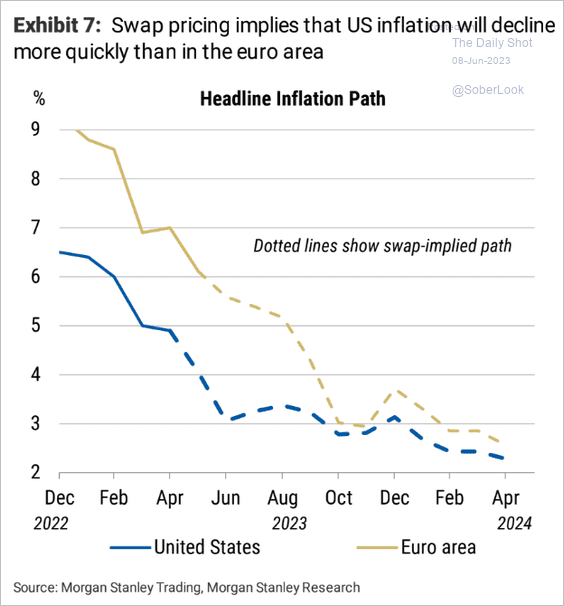
3. The ECB is worried about service sector strength pushing prices higher.
 Source: Nordea Markets
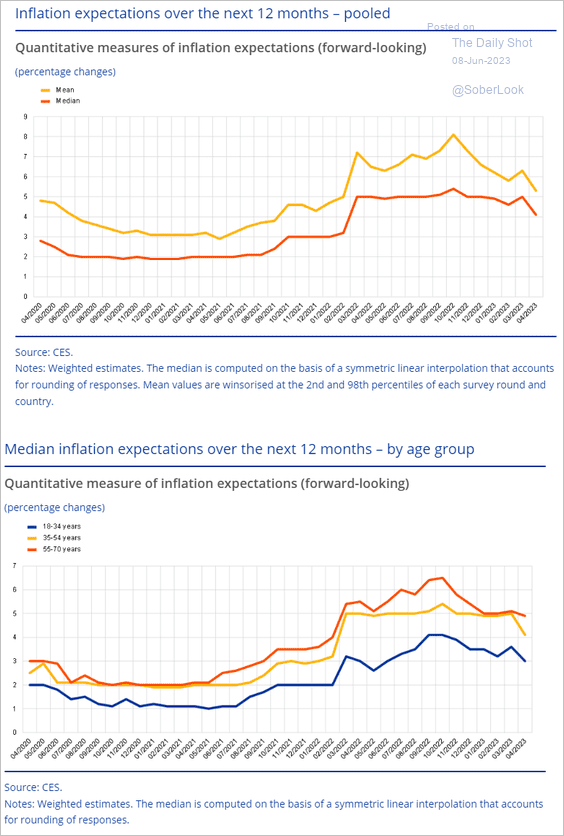
4. Consumer inflation expectations dropped in April.
 Source: ECB
This chart shows inflation trajectories projected by inflation swaps.
 Source: Morgan Stanley Research
Back to Index
Europe
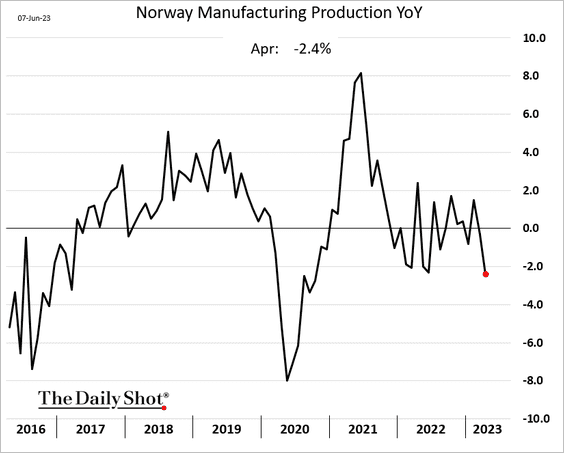
1. Norway’s manufacturing output declined in April.
The Norwegian krone is cheap relative to the euro.
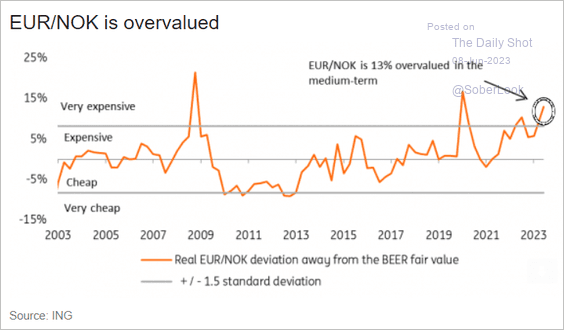 Source: ING
——————–
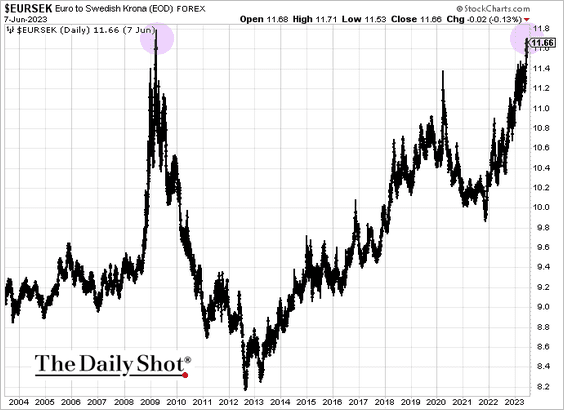
2. The Swedish krona is nearing the GFC lows.
3. Next, we have some data on motorization in the EU.
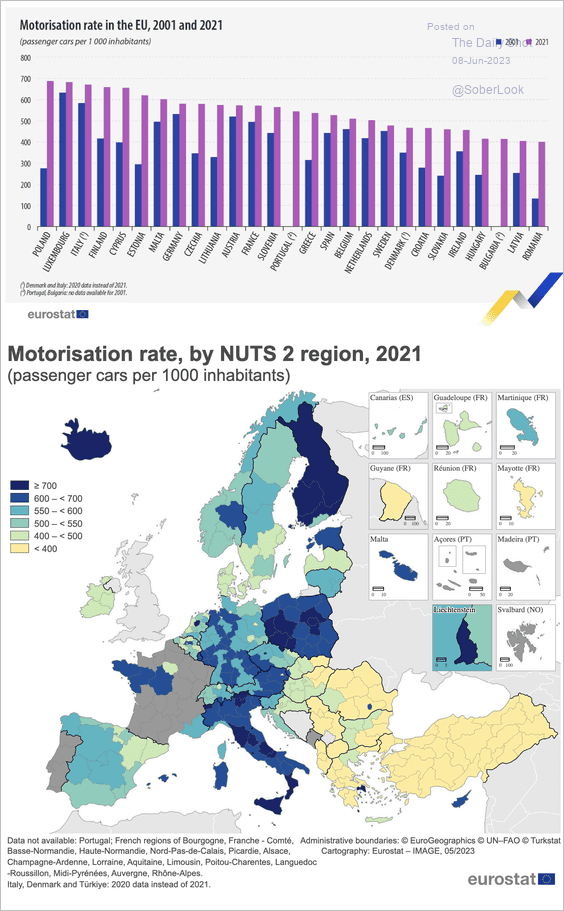 Source: Eurostat Read full article
Back to Index
Asia-Pacific
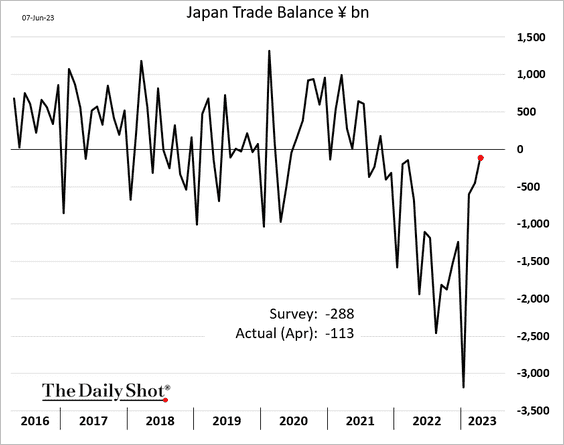
1. Japan has almost closed its trade gap.
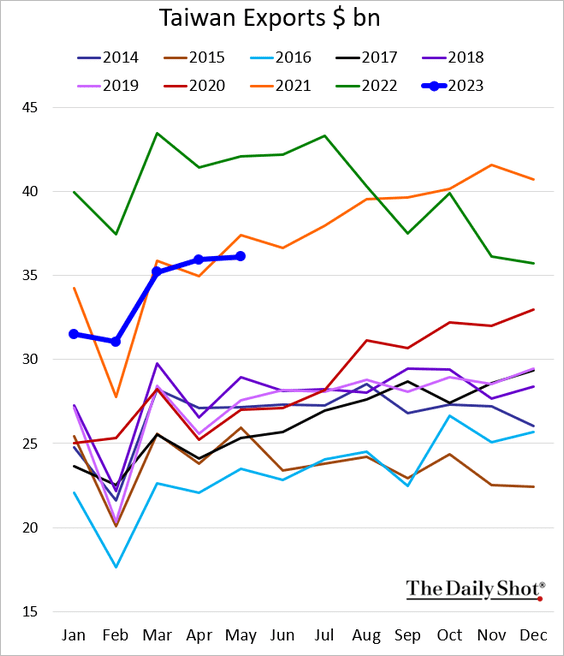
2. Taiwan’s exports are below 2021 levels.
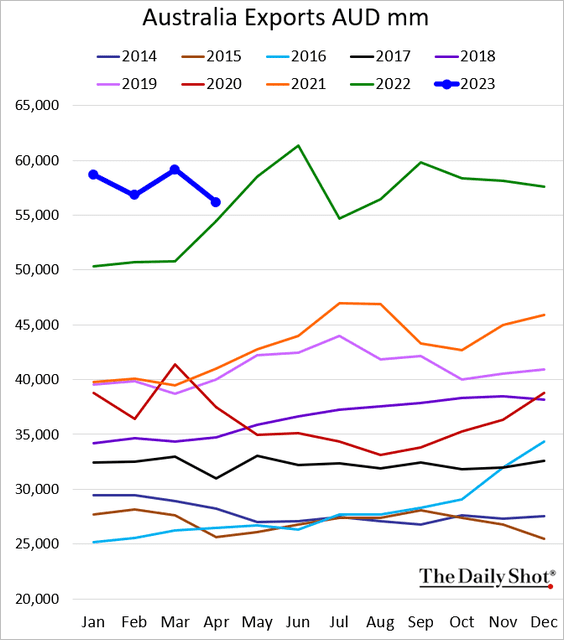
3. Australia’s trade surplus declined in April, …
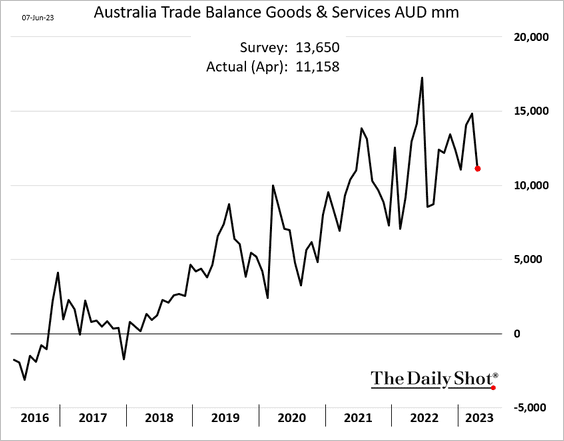
… as exports slowed.
Back to Index
China
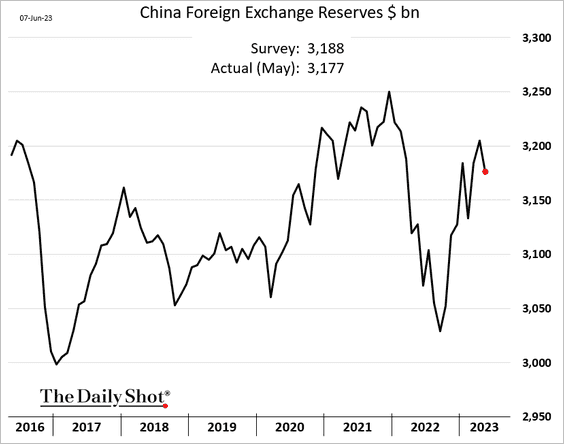
1. FX reserves declined last month.
2. Credit growth is improving.
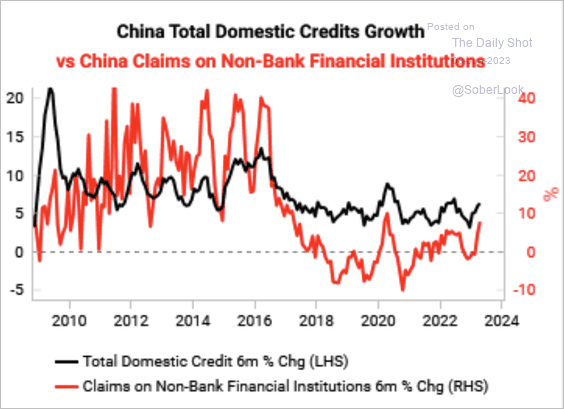 Source: Variant Perception
3. This chart shows China’s top trading partners by trade balance.
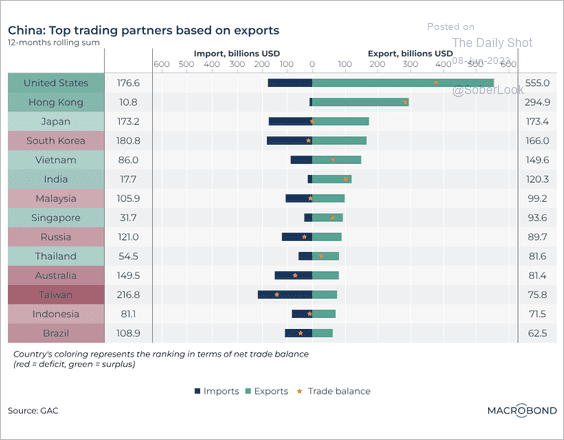 Source: Macrobond
Back to Index
Emerging Markets
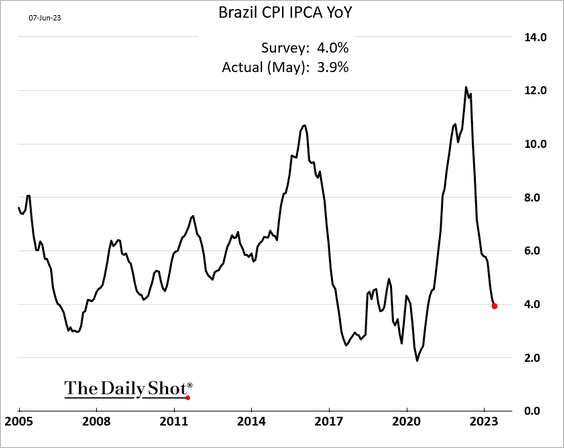
1. Let’s begin with Brazil.
• Inflation continues to moderate.
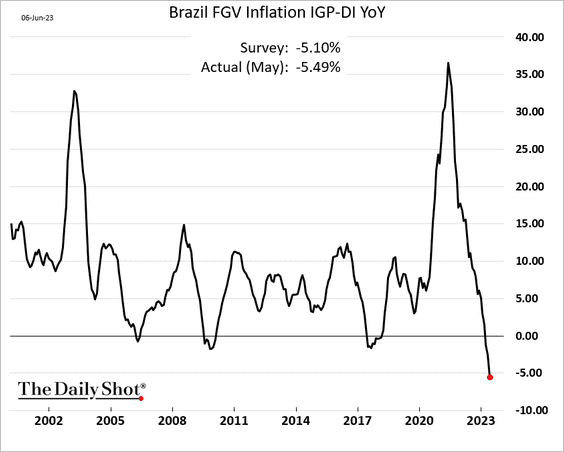
Brazil’s broad inflation index declined by most on record (going back to the 1940s). This measure includes consumer, wholesale, and construction prices.
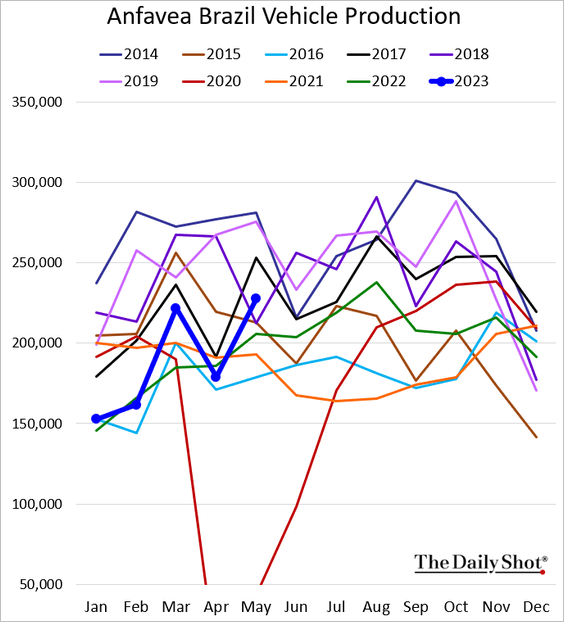
• Vehicle production is rebounding.
——————–
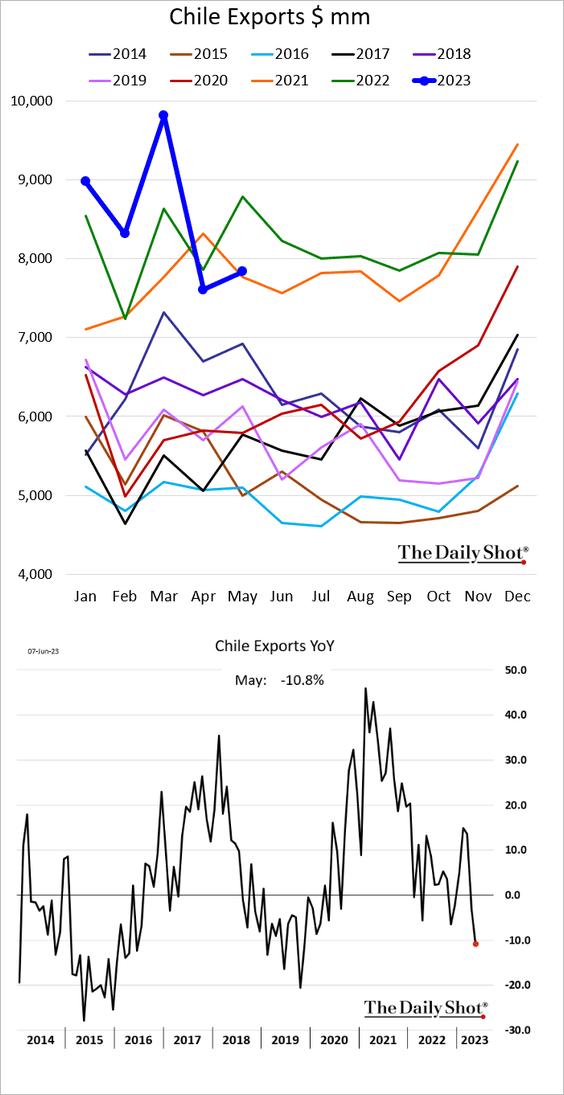
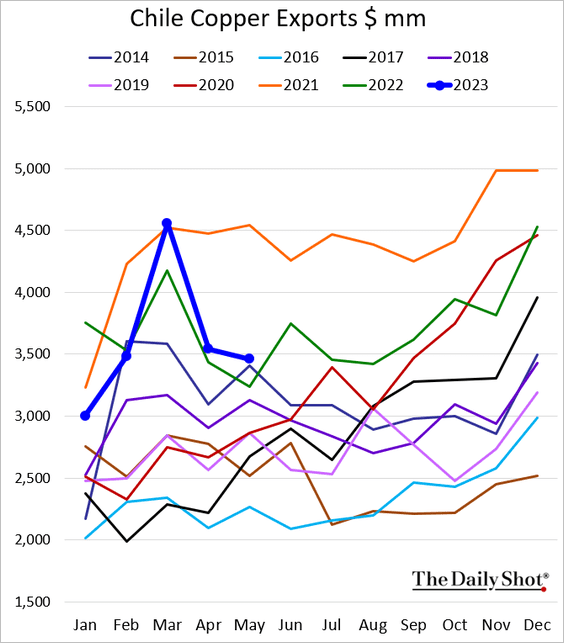
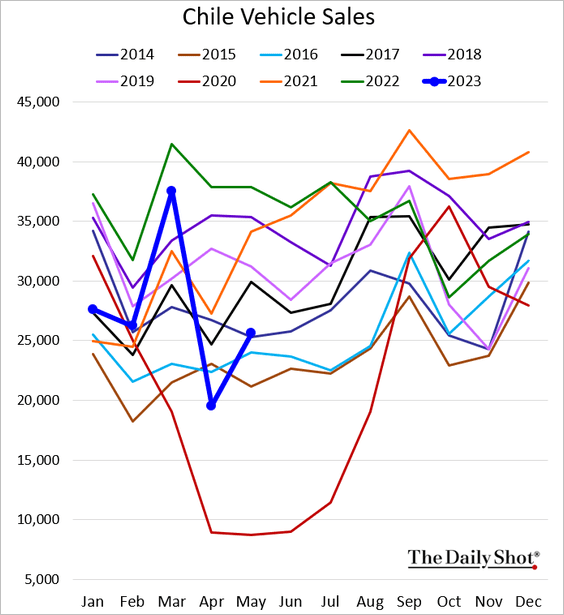
2. Next, we have some updates on Chile.
• Exports:
• Copper exports:
• Vehicle sales:
• Core inflation:
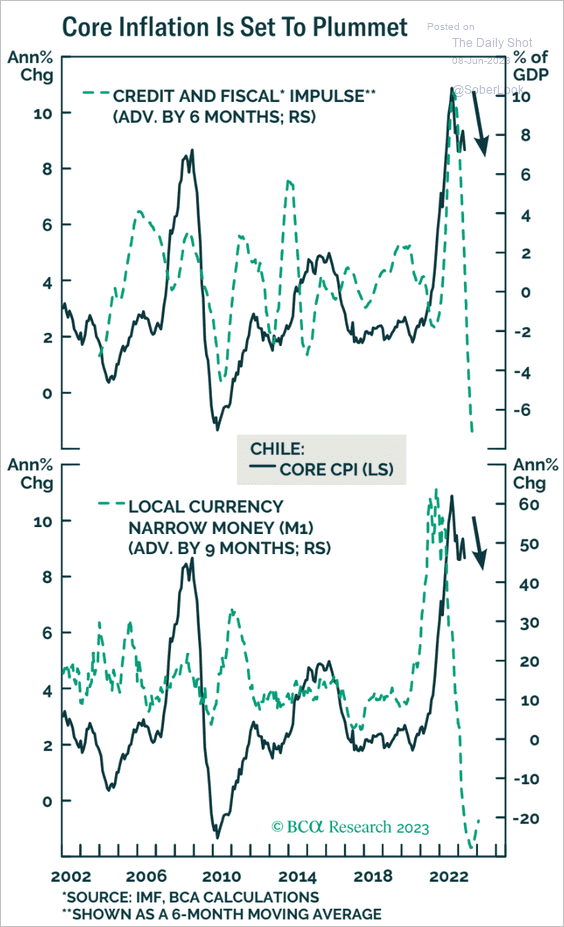 Source: BCA Research
——————–
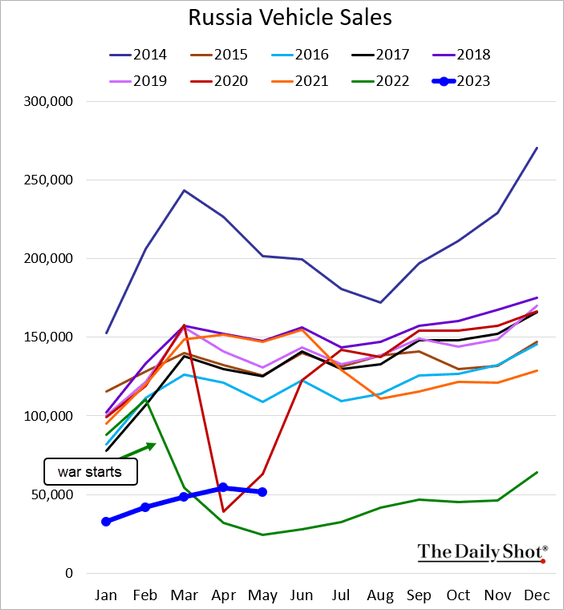
3. Russian vehicle sales remain depressed.
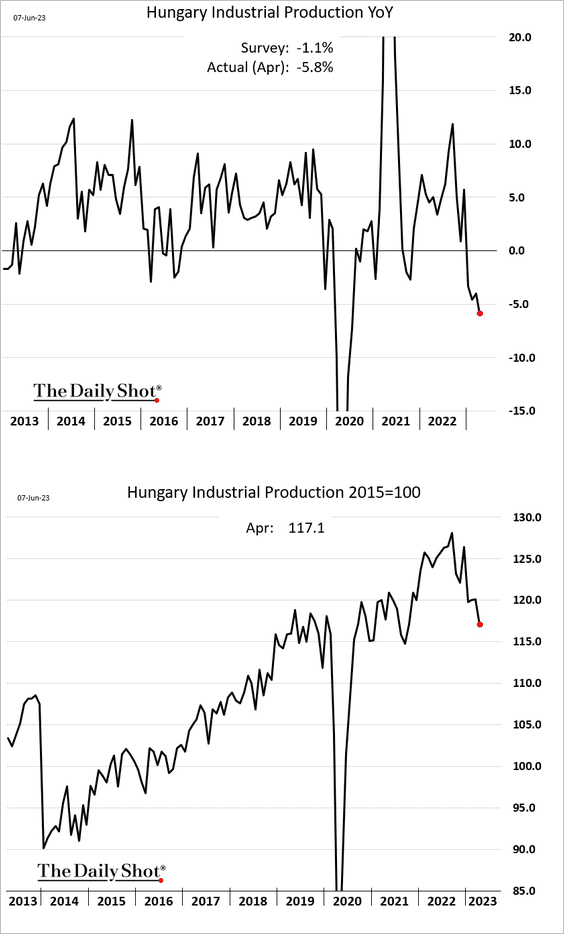
4. Hungarian industrial production has been rolling over.
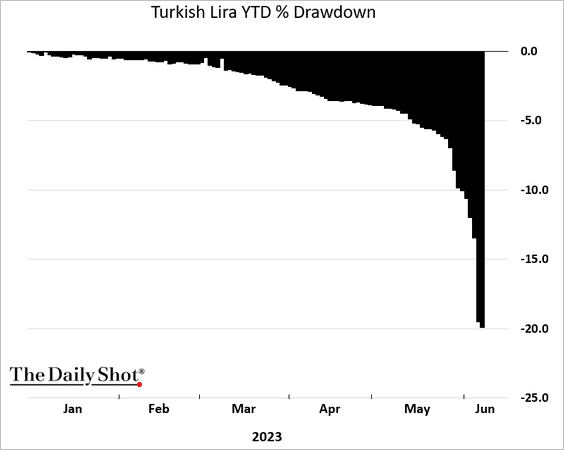
5. The Turkish lira is now down 20% year-to-date.
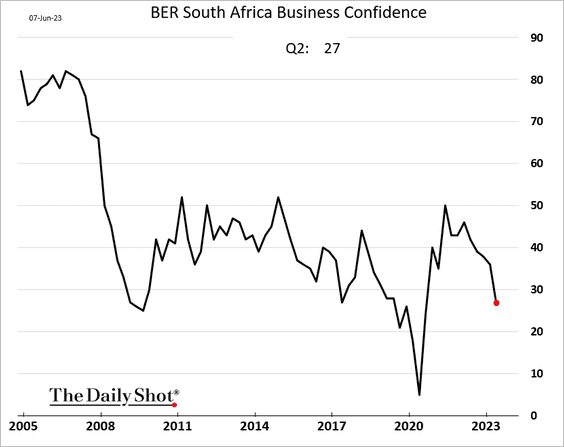
6. South Africa’s business sentiment deteriorated this quarter.
This chart shows South Africa’s private investment as a share of GDP.
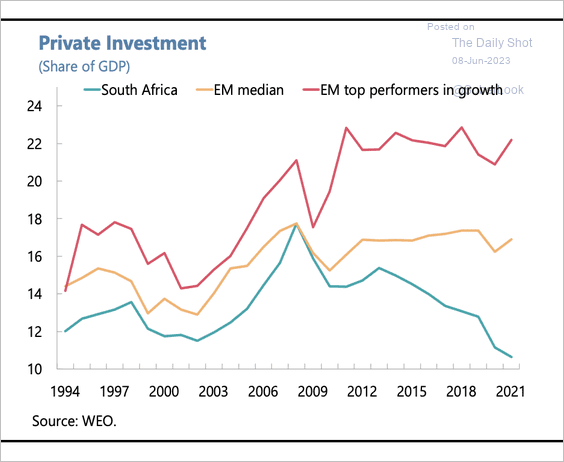 Source: IMF Read full article
——————–
7. Capital Economics sees EM rate cuts accelerating into next year.
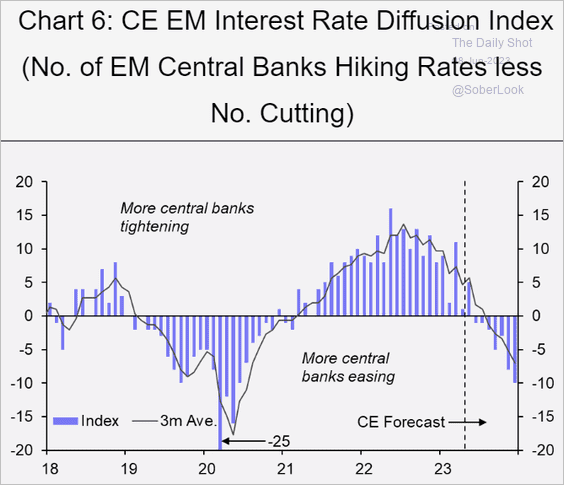 Source: Capital Economics
Back to Index
Energy
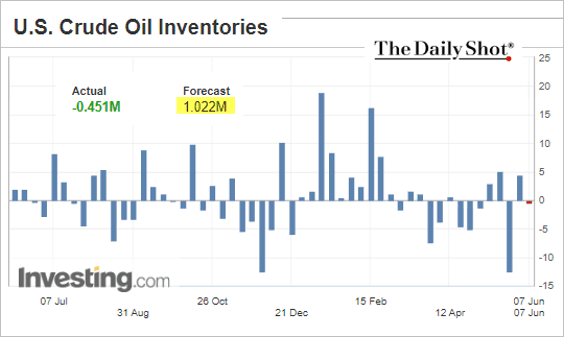
1. US oil inventories unexpectedly declined last week.
 Source: Reuters Read full article
——————–
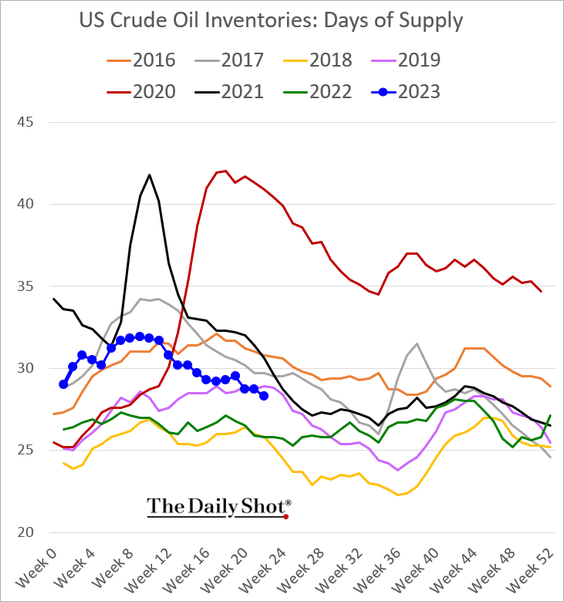
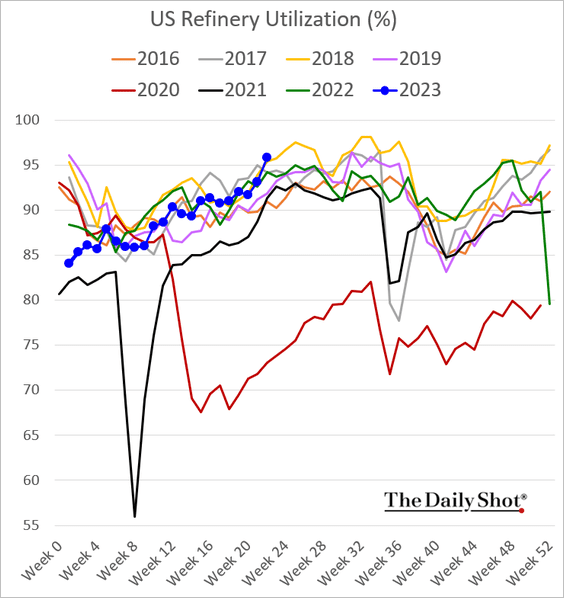
2. Refinery inputs have been rising.
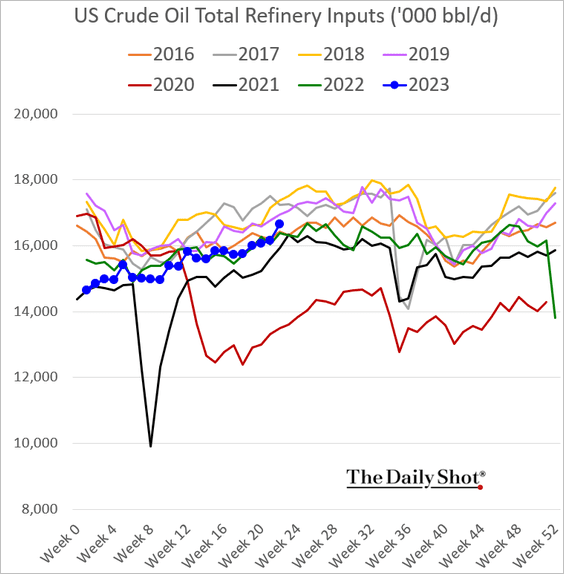
Refinery utilization hit a multi-year high for this time of the year.
——————–
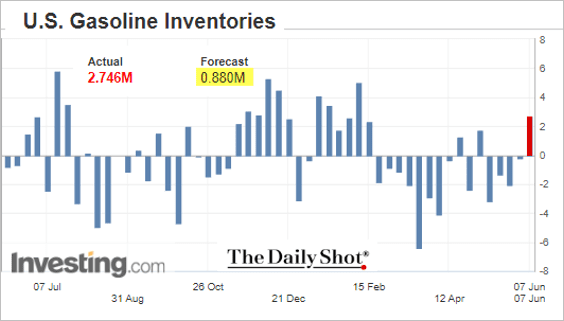
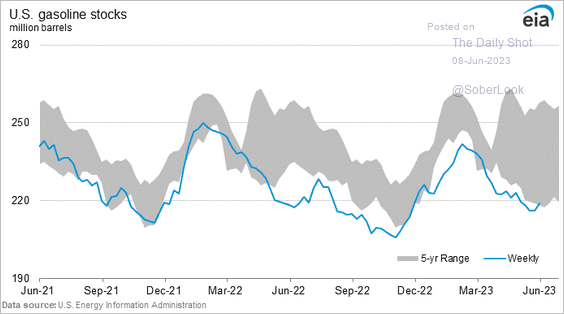
3. Gasoline inventories jumped.
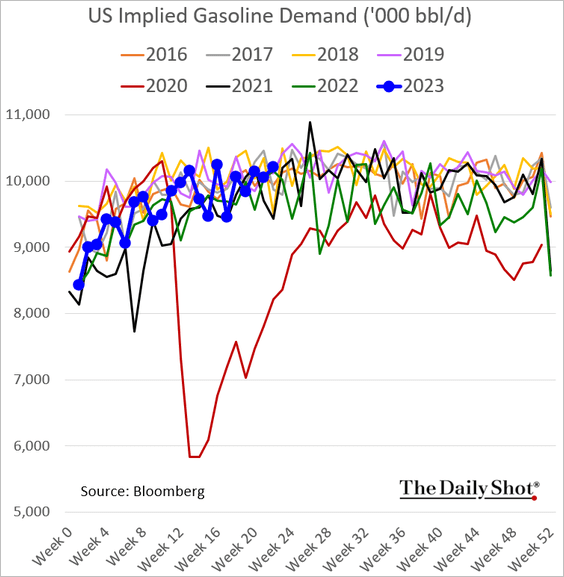
• Gasoline demand has been robust.
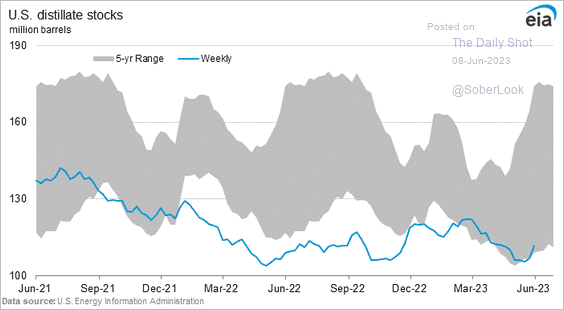
4. Distillates inventories also increased.
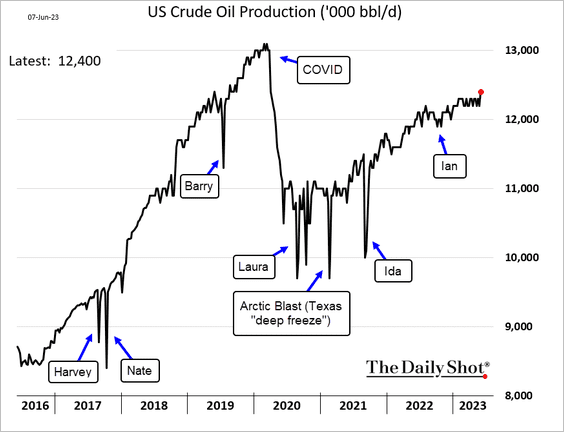
5. US oil production hit the highest level since early 2020.
——————–
6. Asian LNG prices have declined this year.
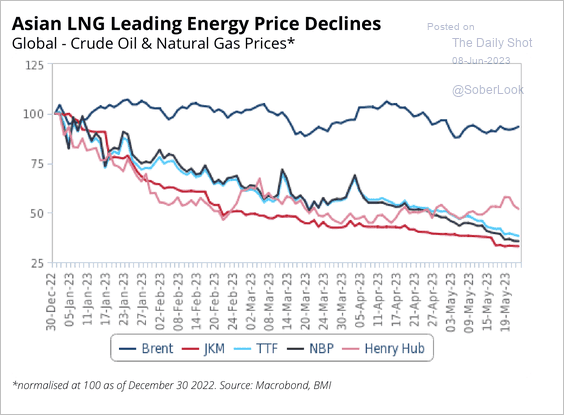 Source: Fitch Solutions Macro Research
Back to Index
Equities
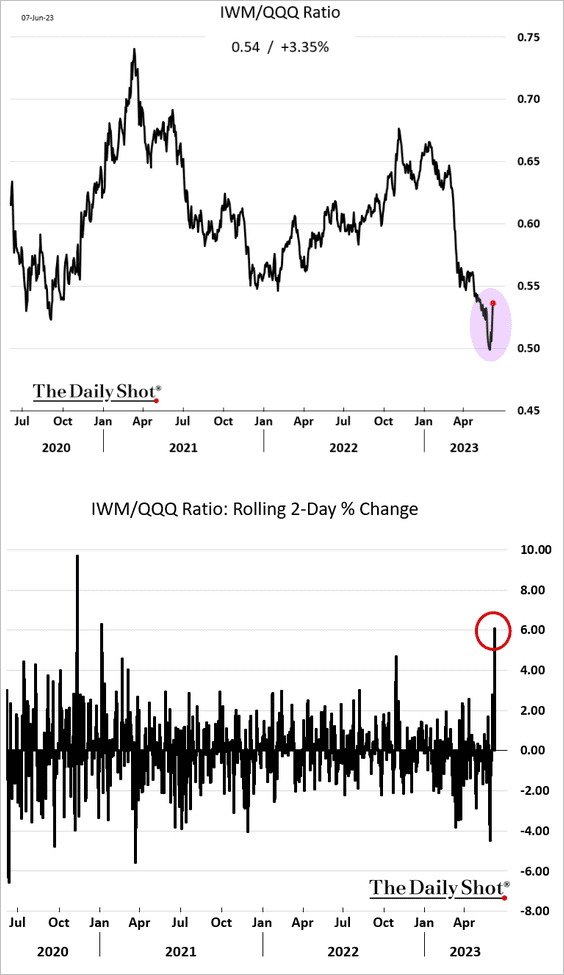
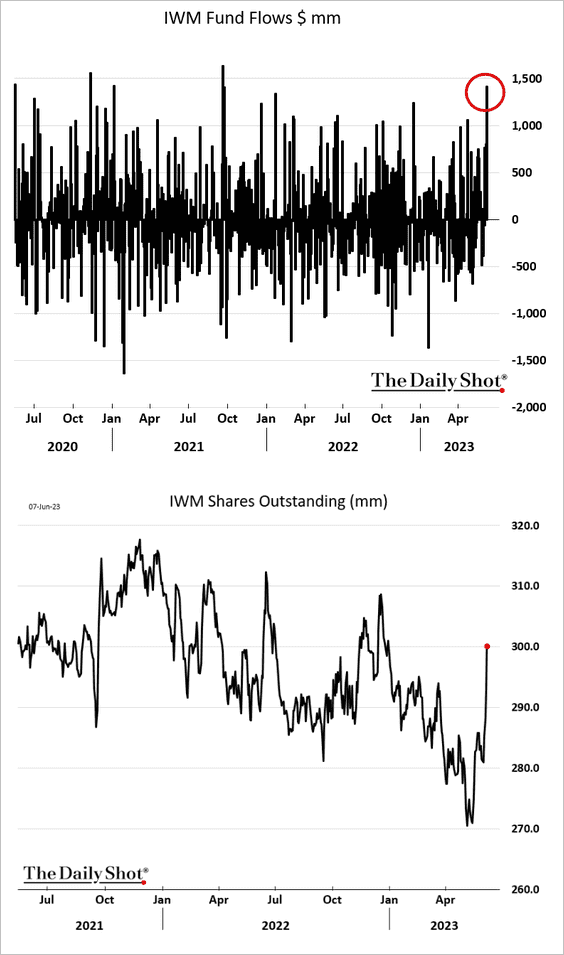
1. Small caps (IWM) have sharply outperformed the Nasdaq 100 (QQQ) over the past couple of days.
• IWM fund inflows surged this week.
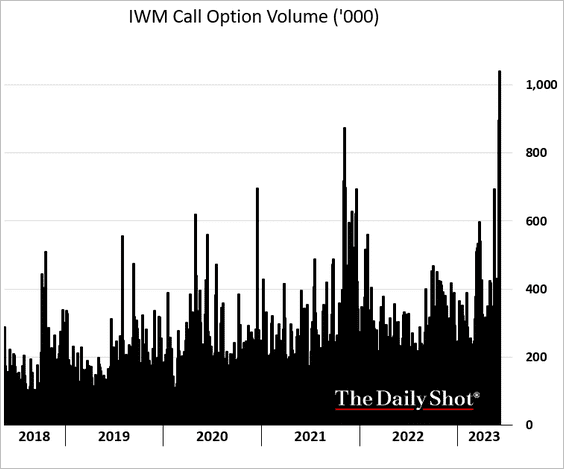
• This chart shows the IWM call option volume.
——————–
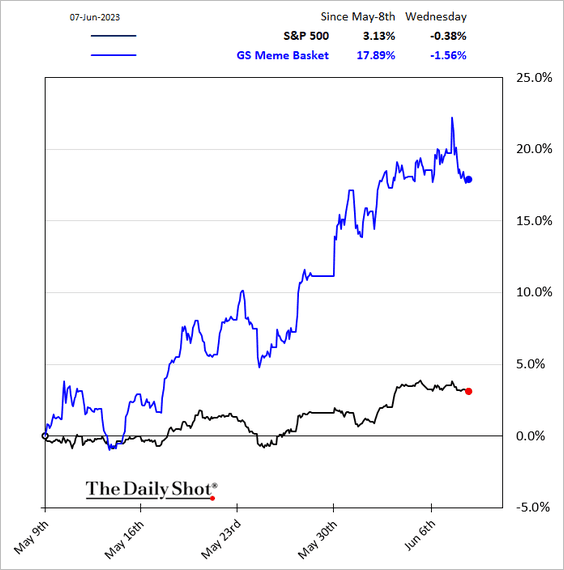
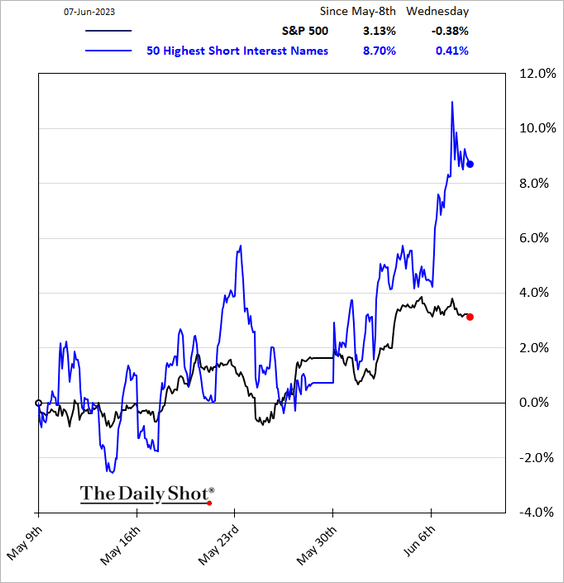
2. Speculative stocks have been rallying.
• Meme stocks:
• Most-shorted equities:
——————–
3. The S&P 500 reported earnings are too high relative to economy-wide profits.
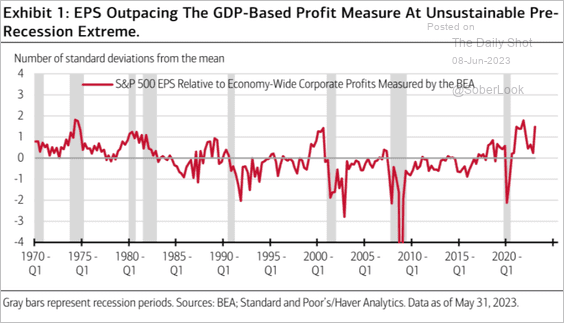 Source: Merrill Lynch
4. Some market segments still trade at below-average valuations.
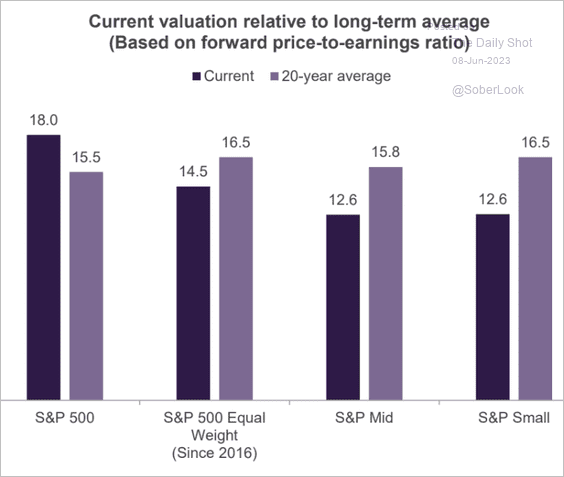 Source: Truist Advisory Services
5. Goldman’s equity sentiment indicator is in bullish territory.
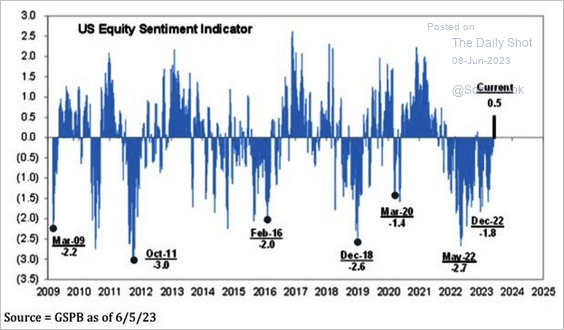 Source: Goldman Sachs; @Marlin_Capital
6. This graphic shows the ten largest US tech stocks in 2000, 2010, 2020, and 2023.
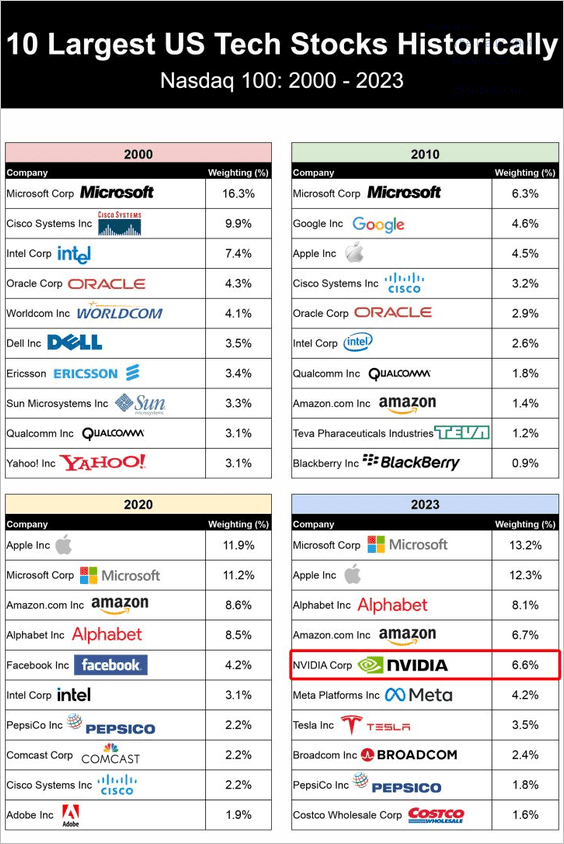 Source: Ken Shih
Back to Index
Credit
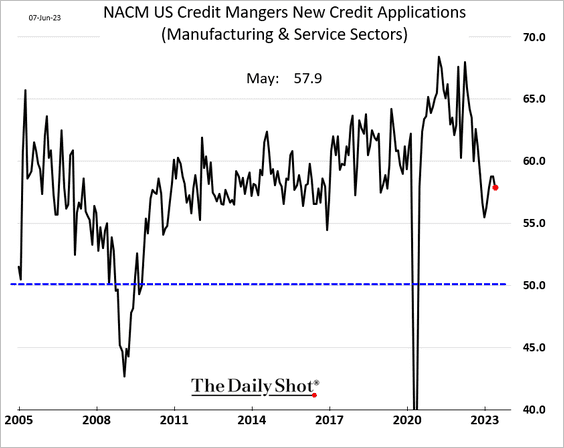
1. New credit applications are still growing but at a slower pace.
2. This chart shows rating distributions for US and EUR high-yield markets over time.
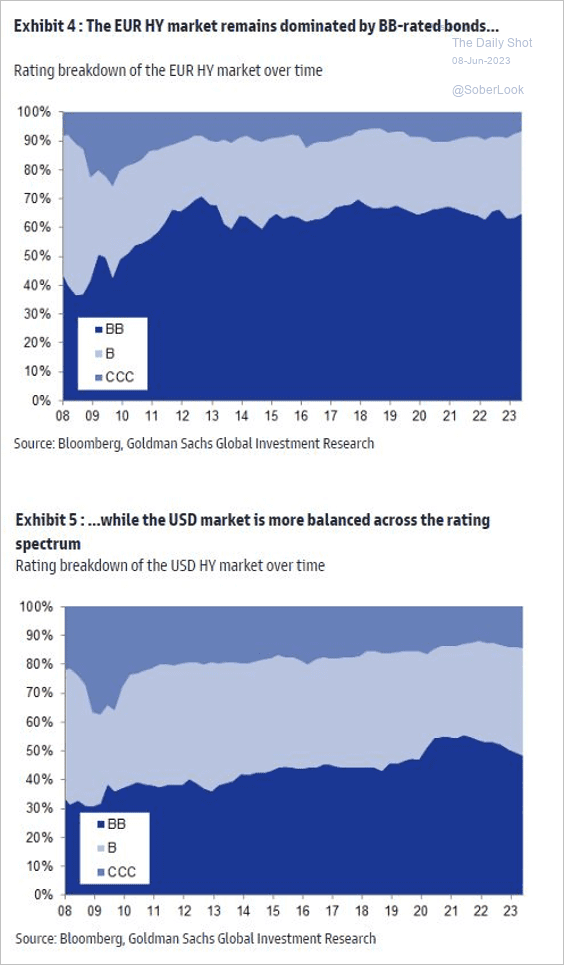 Source: Goldman Sachs
3. Where will US HY defaults and spreads peak over the next 24 months?
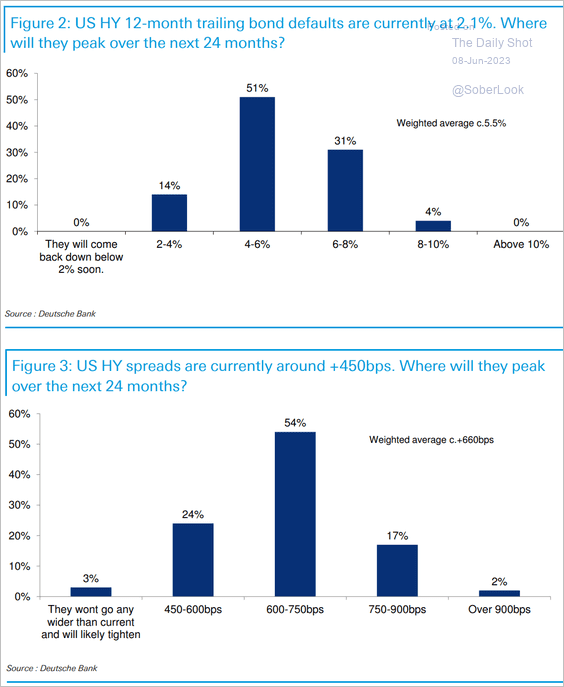 Source: Deutsche Bank Research
Back to Index
Global Developments
1. Here is a look at contributions to inflation across G7 economies.
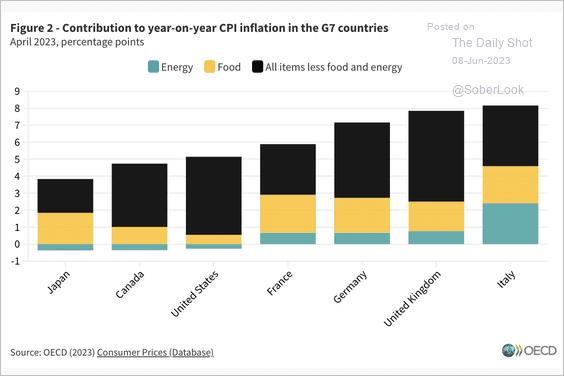 Source: OECD Read full article
2. Luxury watch prices resumed their declines in May.
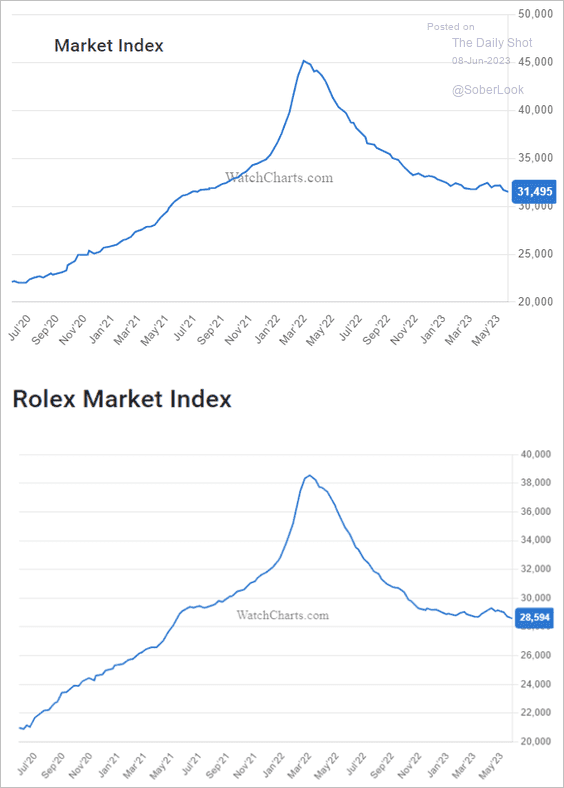 Source: WatchEnthusiasts
——————–
Food for Thought
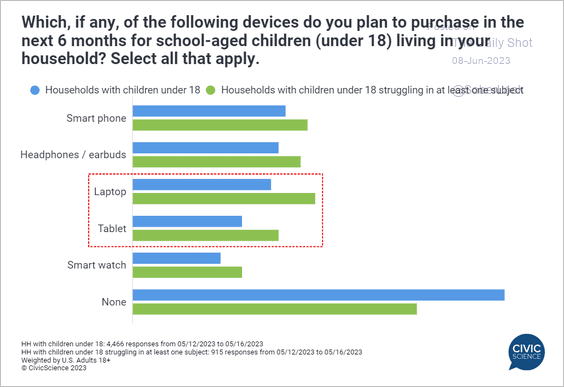
1. Back-to-school shopping:
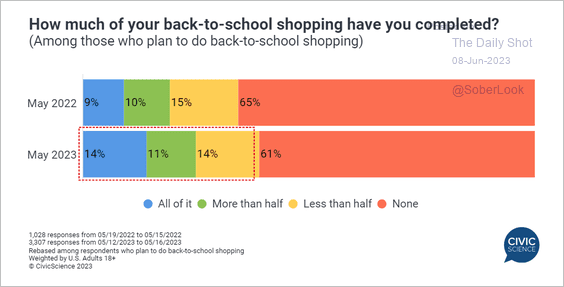 Source: @CivicScience Read full article
 Source: @CivicScience Read full article
——————–
2. Apple’s share of smartphone market shipments, revenues, and operating profit:
 Source: Statista
3. Influencer marketing:
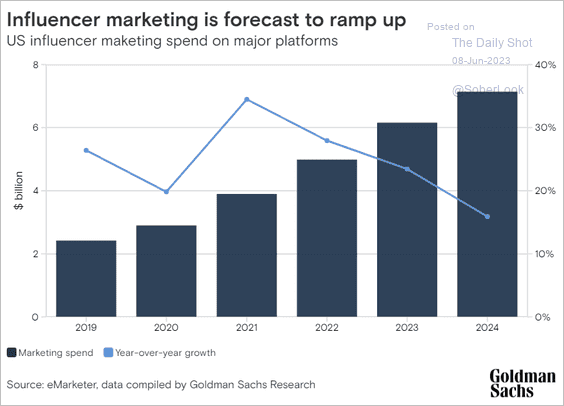 Source: Goldman Sachs
4. Tesla’s profit margin:
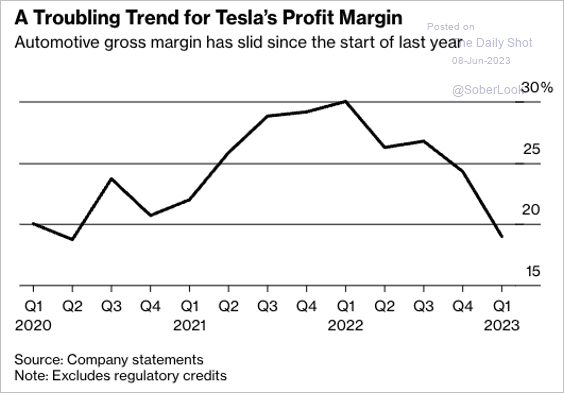 Source: @crtrud, @BW Read full article
5. County-level population changes:
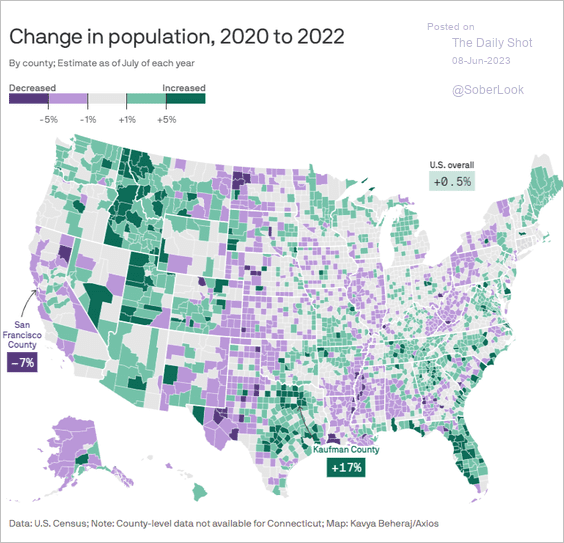 Source: @axios Read full article
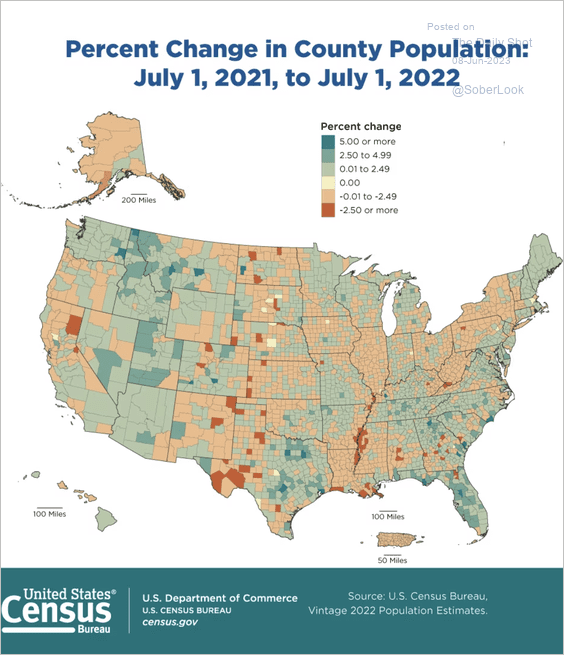 Source: The Census Bureau
——————–
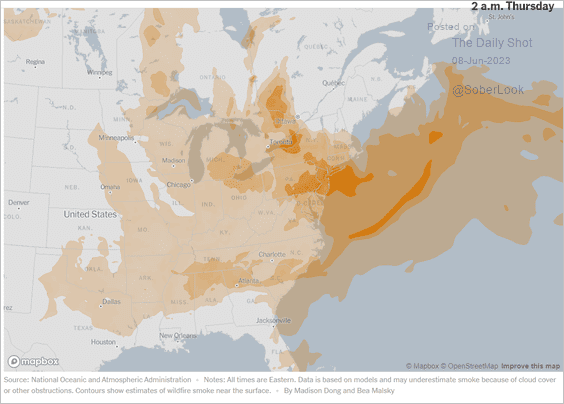
6. US East Coast hit by Canadian wildfire smoke:
 Source: CBS News Read full article
 Source: @Earth_Updates
 Source: The New York Times Read full article
——————–
7. Confirmed and potential 2024 presidential candidates:
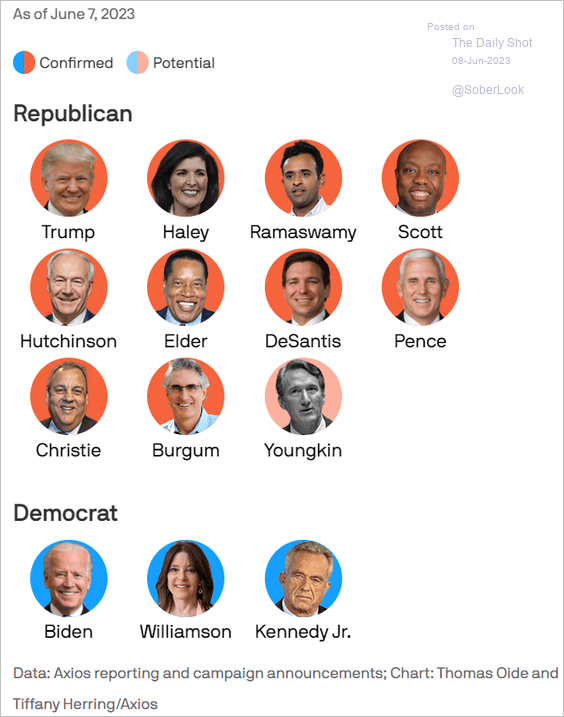 Source: @axios Read full article
8. Beehives on EU farms:
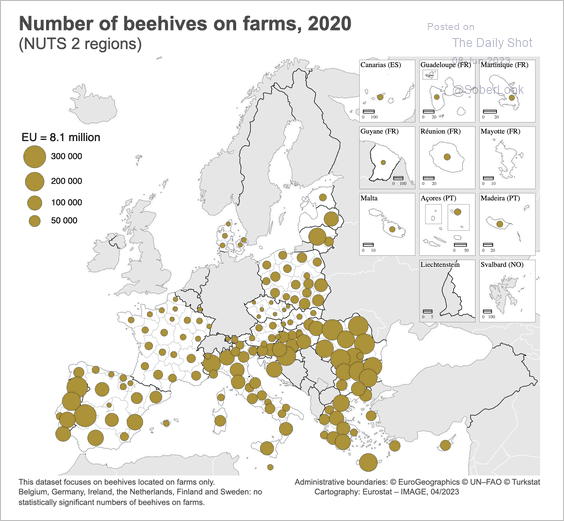 Source: Eurostat Read full article
——————–
Back to Index