
The Daily Shot: 11-May-20
• The United States
• Canada
• The United Kingdom
• The Eurozone
• Europe
• Asia – Pacific
• Emerging Markets
• Cryptocurrency
• Commodities
• Equities
• Credit
• Rates
• Global Developments
• Food for Thought
The United States
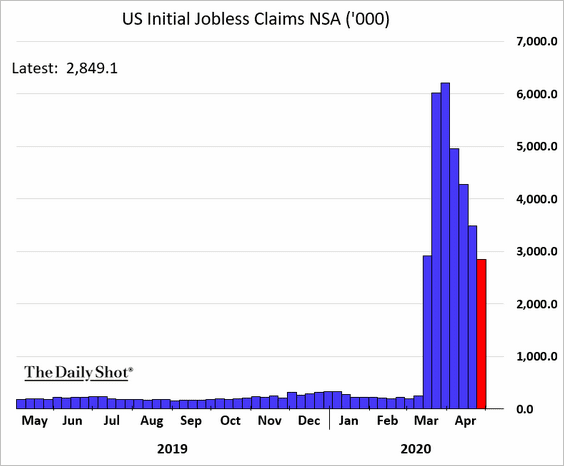
1. Let’s begin with the labor market.
• Nearly three million Americans filed for unemployment last week.
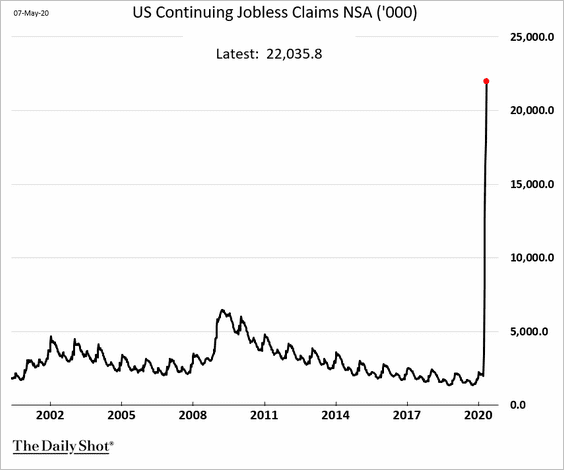
The total number of Americans receiving unemployment benefits climbed to 22 million (and that figure doesn’t include the 3 million above).
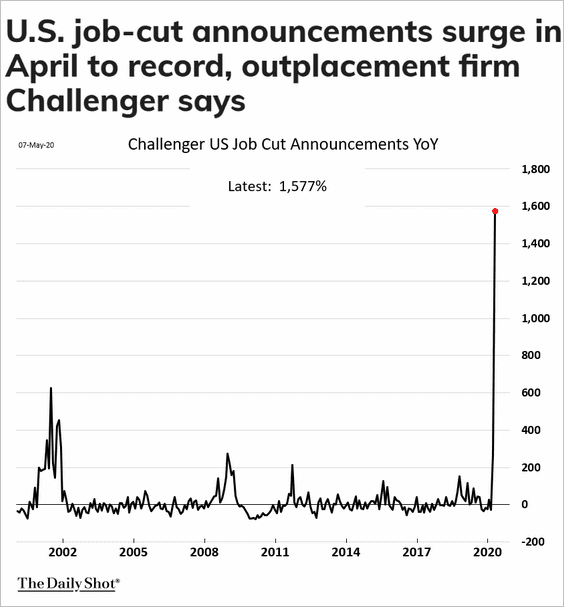
• Announced layoffs hit a new record.
 Source: MarketWatch Read full article
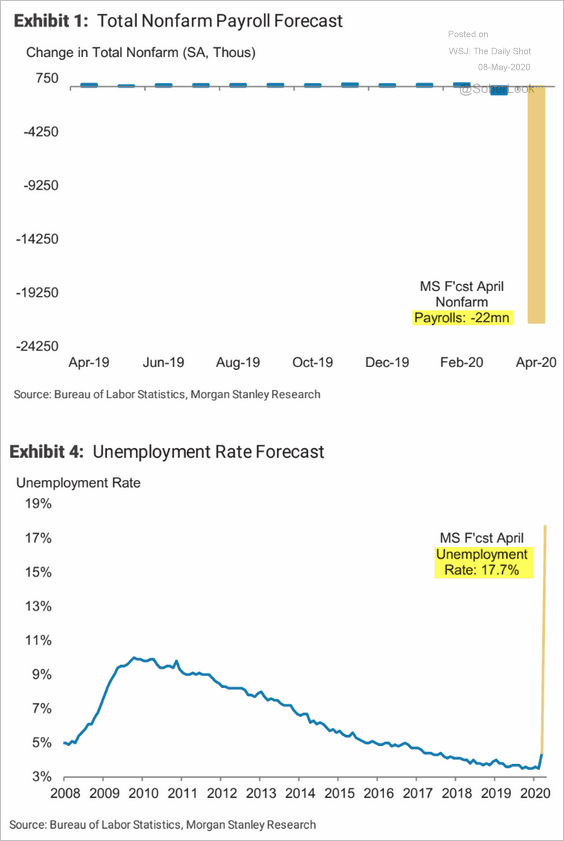
• Below is Morgan Stanley’s estimate for the April nonfarm payrolls and the unemployment rate.
 Source: Morgan Stanley Research
• This chart shows new job postings on Indeed.
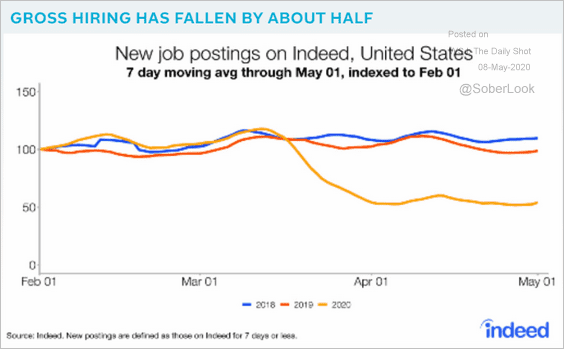 Source: Pantheon Macroeconomics
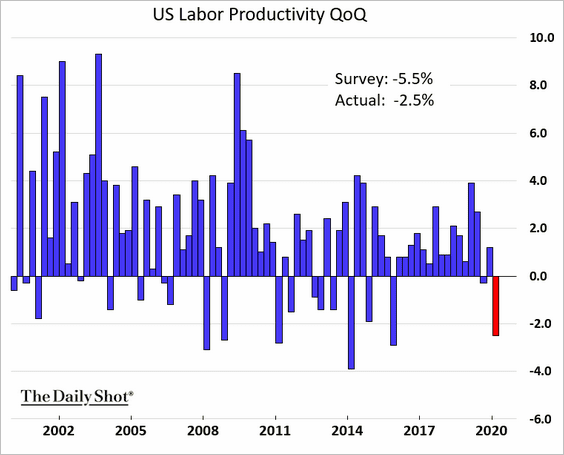
• Labor productivity declined in the first quarter, although not as much as economists expected. Productivity gains will remain soft going forward due to rising labor slack and collapsing investment.
——————–
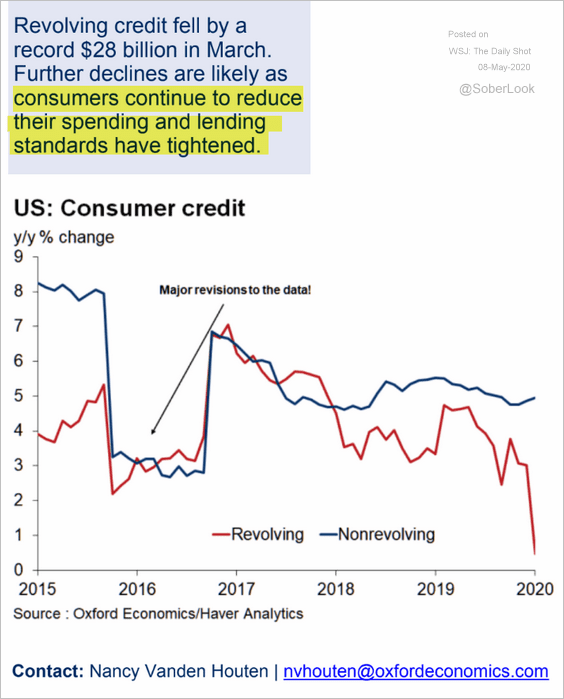
2. Now let’s look at consumer credit.
• Consumer credit declined sharply in March, …
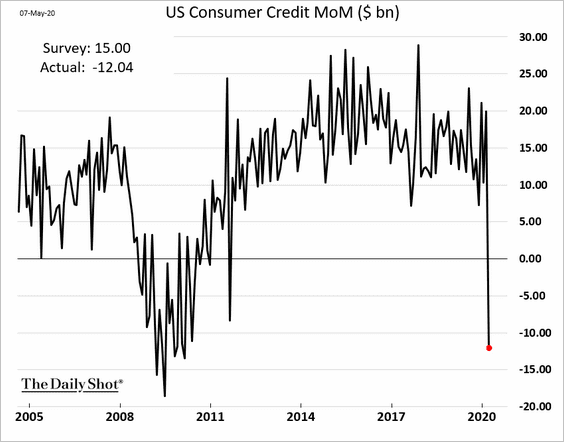
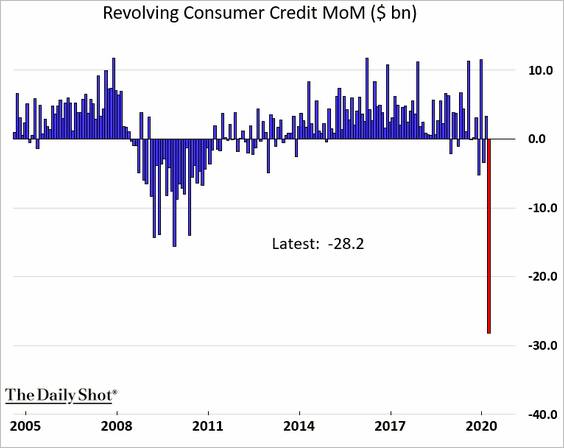
… driven by revolving credit (mostly credit cards).
Below are the year-over-year changes.
 Source: Oxford Economics
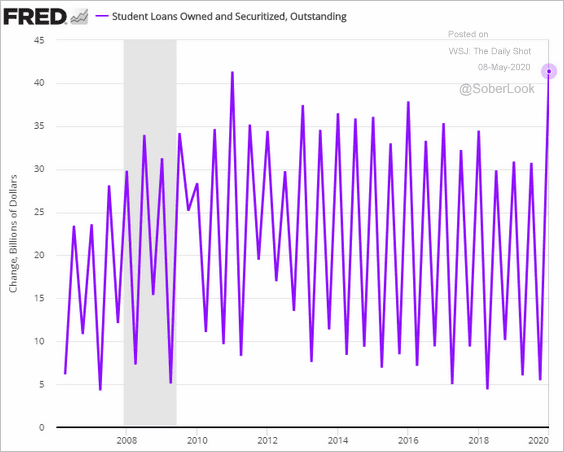
• Student loan balances rose sharply in the first quarter (the fluctuations are due to borrowing at the beginning of each semester).
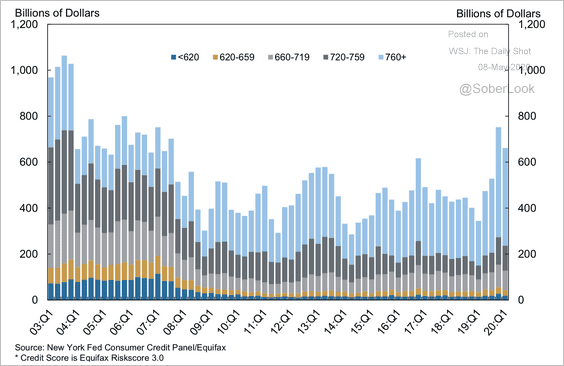
• Here are mortgage originations by credit score.
 Source: New York Fed
——————–
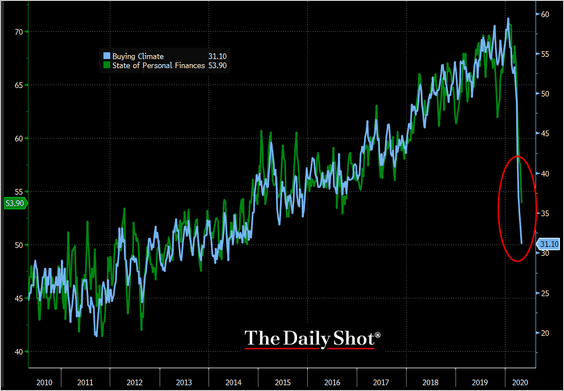
3. Bloomberg’s consumer sentiment index continues to worsen (contradicting some other measures which show stabilization).
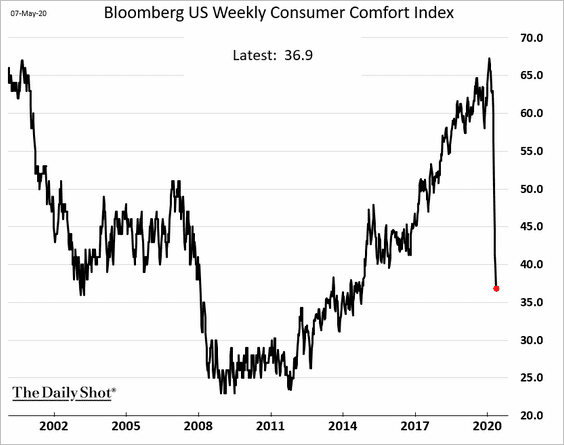
The buying climate deterioration has been more severe than personal finances, as consumers retreat and the savings rate climbs.
 Source: @TheTerminal
——————–
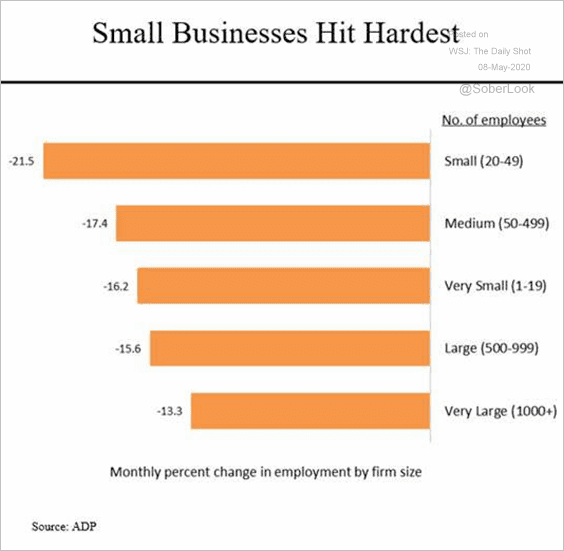
4. Next, are some updates on small business.
• The ADP private payrolls report job losses:
 Source: @SteveRattner
• Share of businesses impacted:
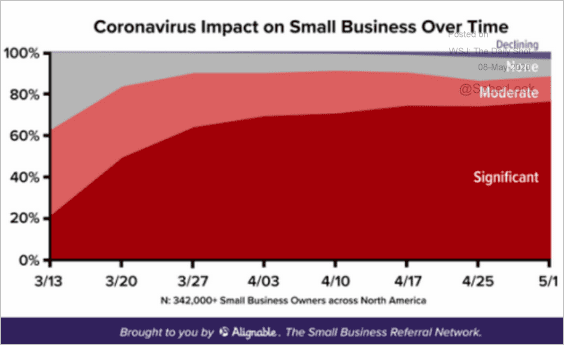 Source: Alignable
• Small business cash reserves:
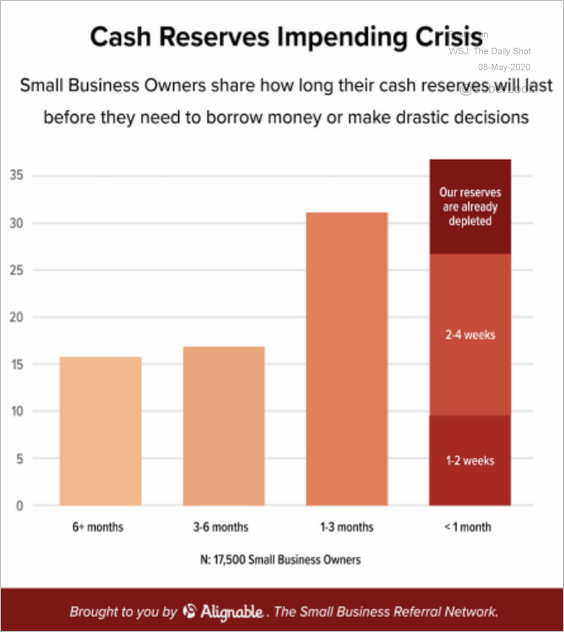 Source: Alignable
• Small business views on reopening:
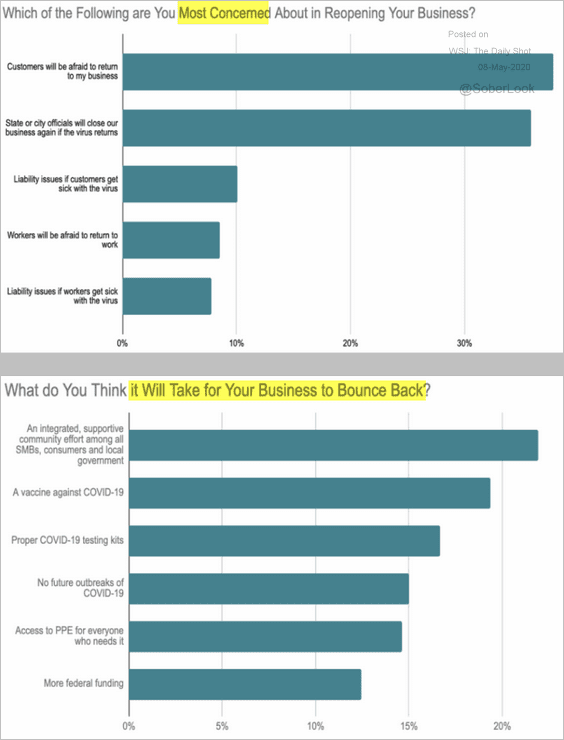 Source: Alignable
• Status of loan applications:
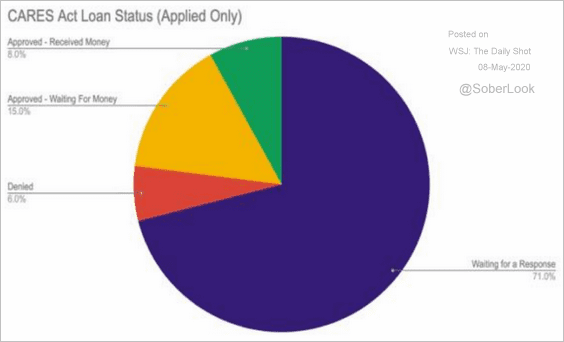 Source: Alignable
• PPP loans by sector:
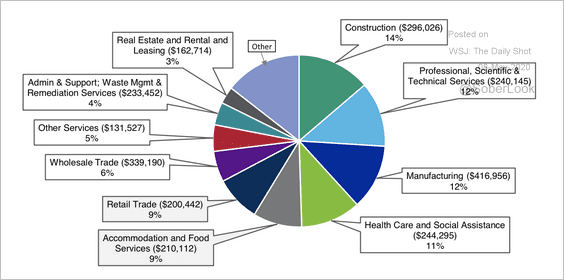 Source: Moody’s Investors Service
• PPP loans received by public companies:
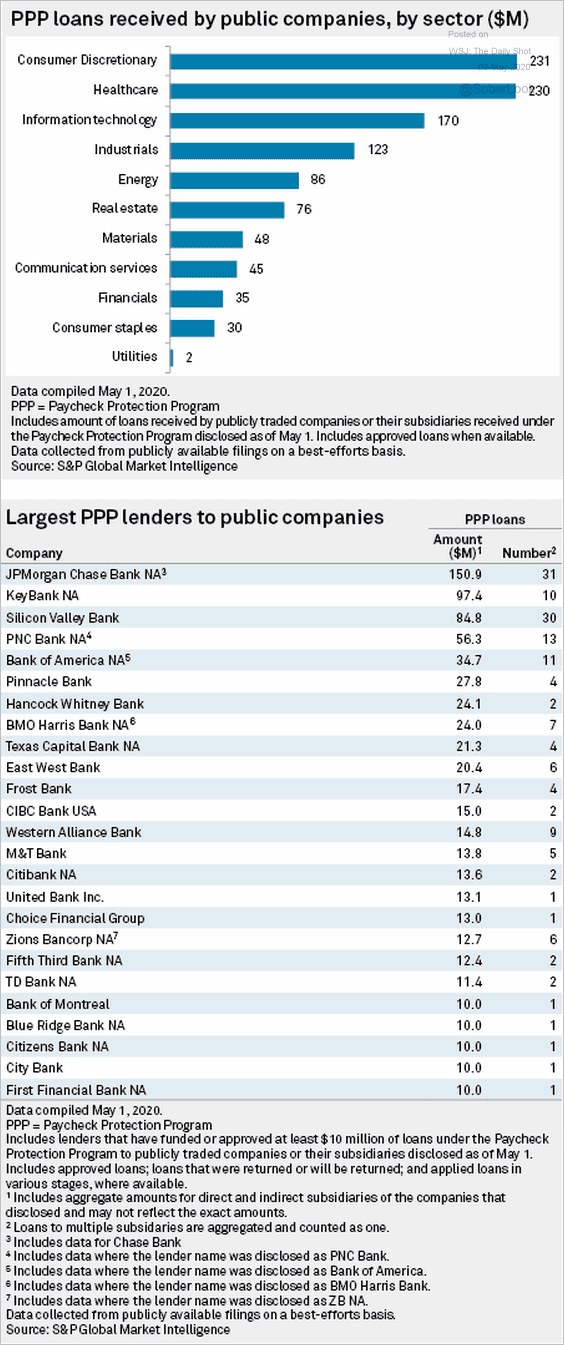 Source: S&P Global Market Intelligence
——————–
5. Restaurant spending was collapsing before the restrictions went into effect.
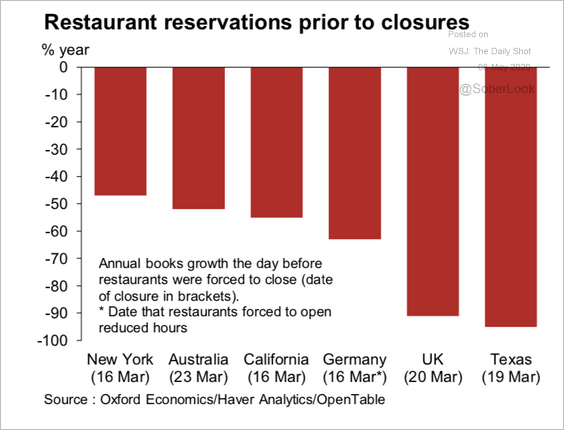 Source: Oxford Economics
Spending at restaurants is showing tepid signs of recovery.
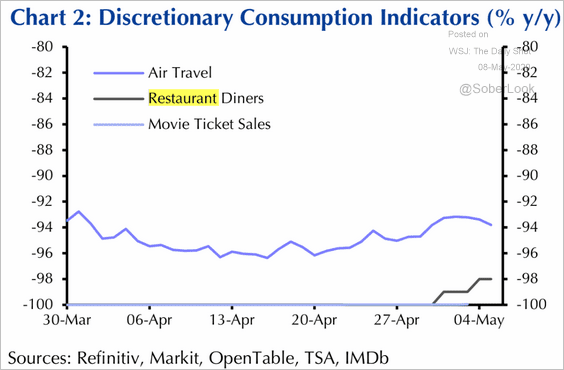 Source: Capital Economics
——————–
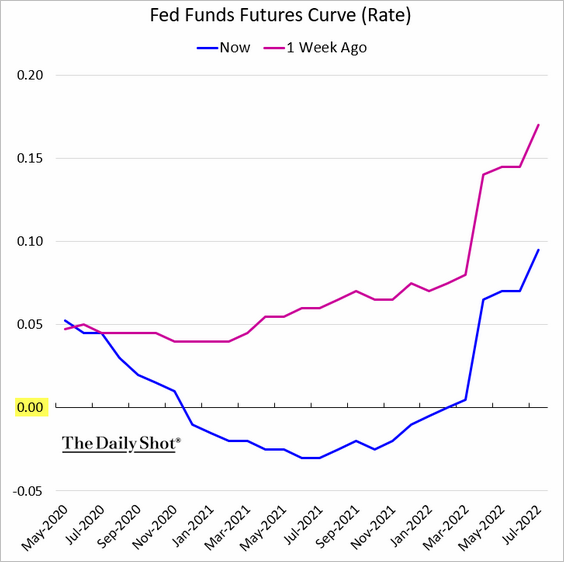
6. Traders are now betting that the Fed will take rates into negative territory next year.
• Futures-based trajectory of the fed funds rate:
• Market-based expectations of the fed funds rate by the end of 2020:
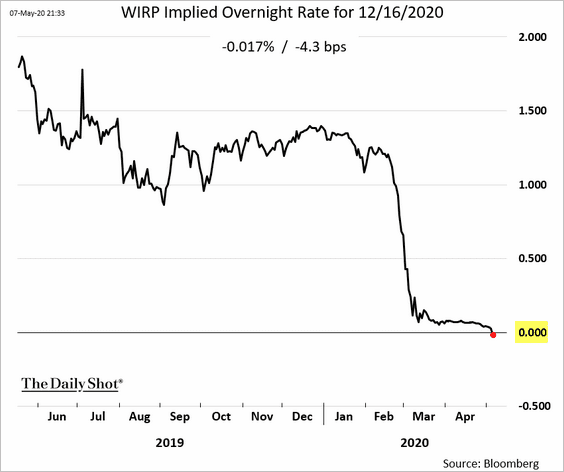 Source: @TheTerminal
• Market-based probability of negative rates in one year:
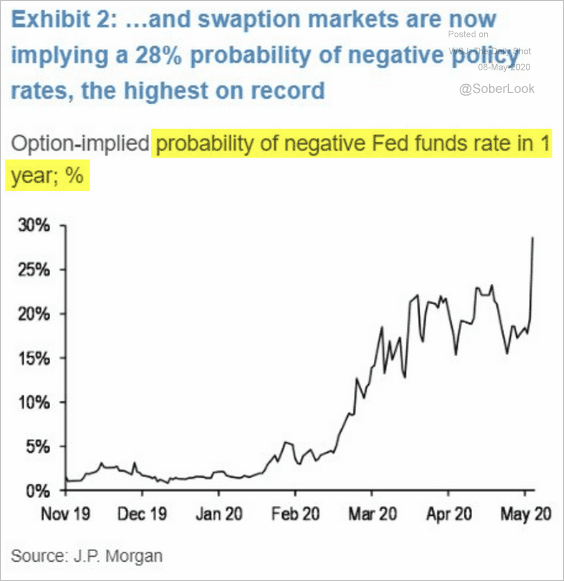 Source: JP Morgan, @tracyalloway, @EddBolingbroke, @whosalexharris Read full article
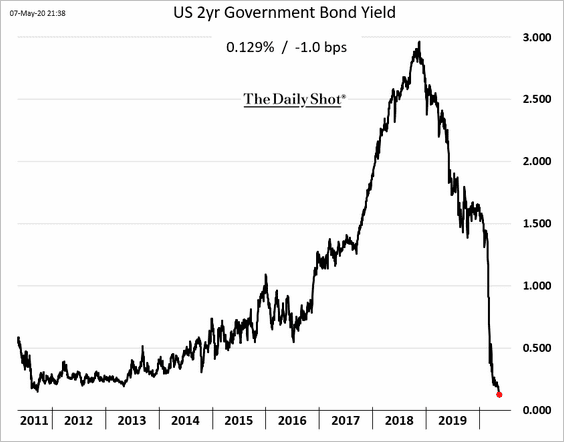
As a result, the 2yr Treasury yield hit a record low.
——————–
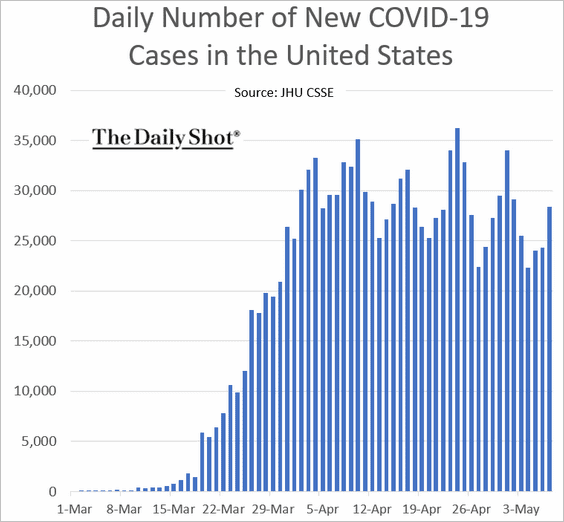
7. Finally, we have some updates on the epidemic.
• The number of new cases each day:
• Excluding New York:
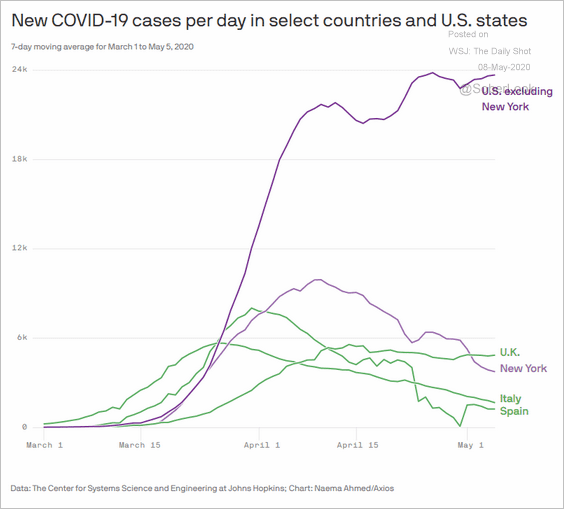 Source: @axios Read full article
• Daily testing:
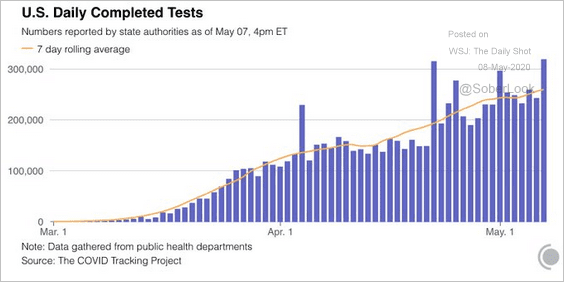 Source: @COVID19Tracking
Canada
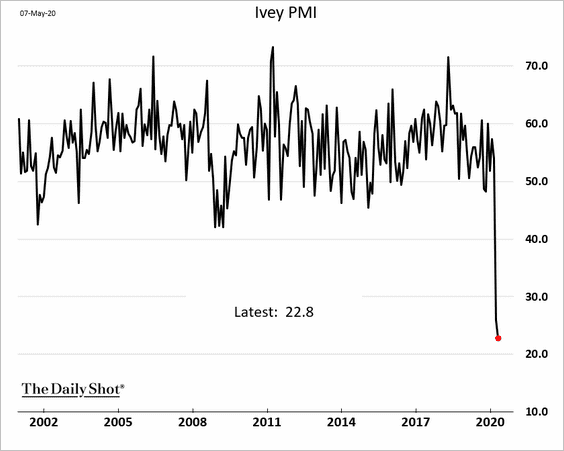
1. The Ivey PMI, which measures business activity, hit a record low (see story).
2. Trade has deteriorated.
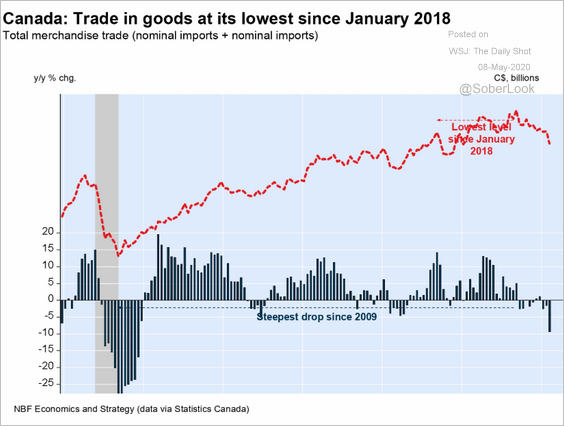 Source: Economics and Strategy Group, National Bank of Canada
 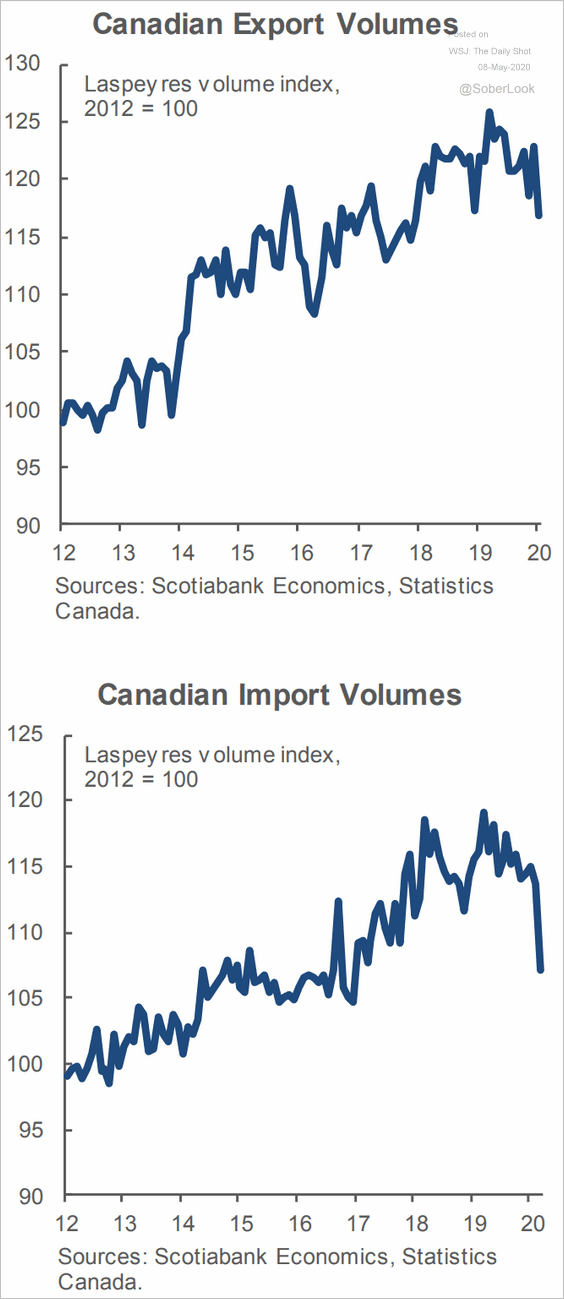 Source: Scotiabank Economics
——————–
3. Business investment has been declining over the past decade, while residential investment has risen to all-time highs.
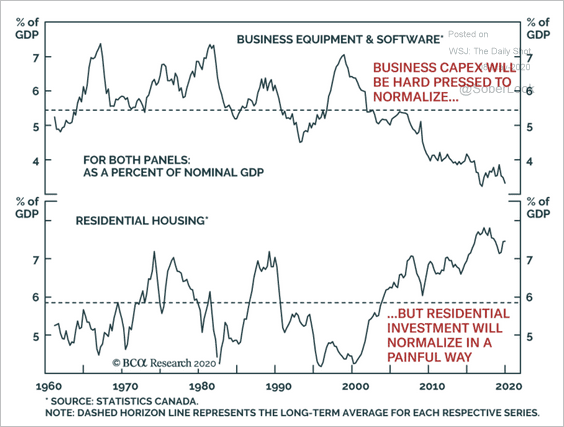 Source: BCA Research
The United Kingdom
1. The Bank of England is forecasting the worst yearly decline in the GDP in centuries.
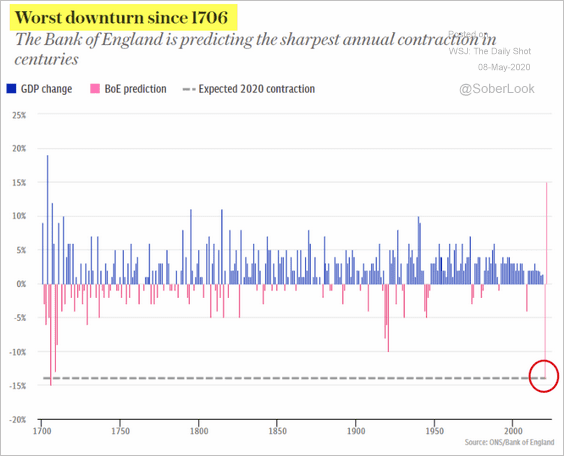 Source: The Telegraph Read full article
Below is the quarterly estimate.
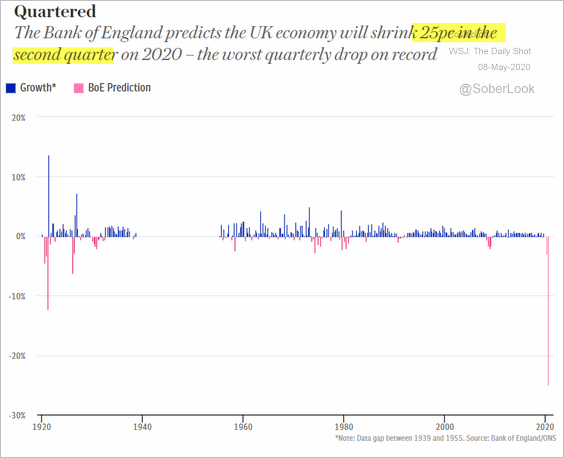 Source: The Telegraph Read full article
——————–
2. Here is a forecast for inflation from Pantheon Macroeconomics.
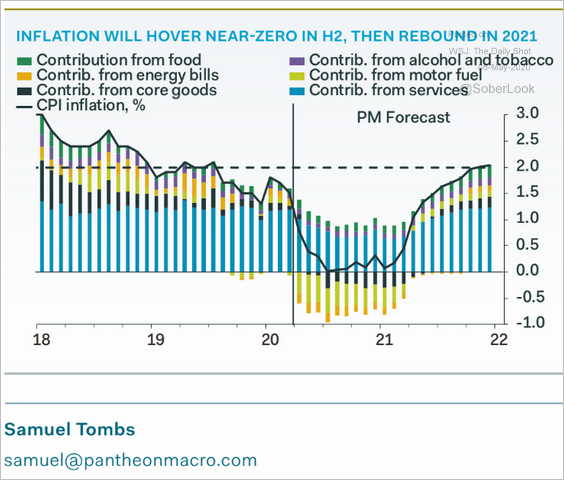 Source: Pantheon Macroeconomics
The Eurozone
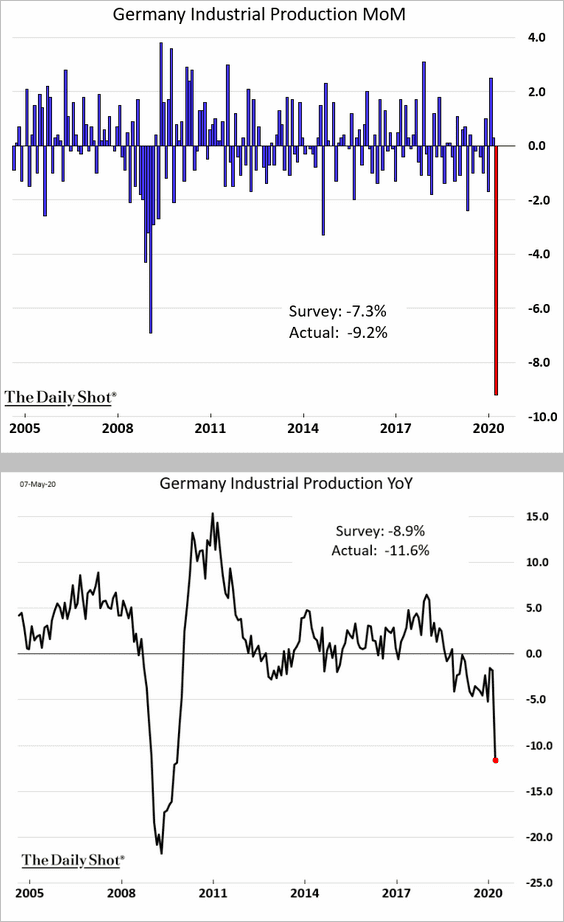
1. Let’s begin with Germany.
• Industrial production plummetted in March.
– Month-over-month and year-over-year (second chart):
– The contributions to industrial production:
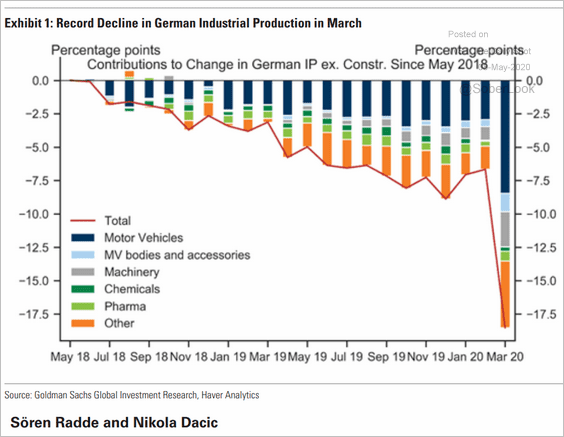 Source: Goldman Sachs
– The industrial production index vs. construction output:
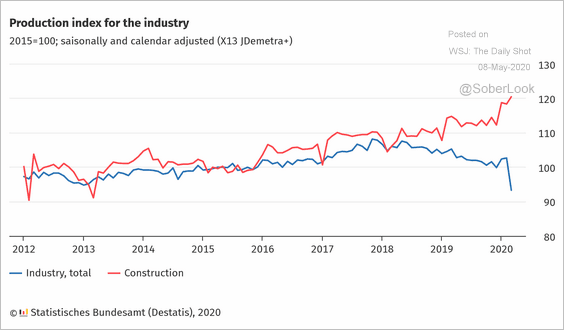 Source: Statistisches Bundesamt
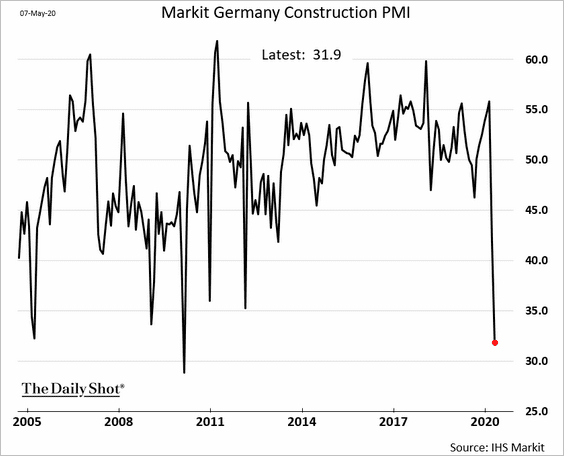
• In April, however, construction activity slowed sharply.
• The rate of coronavirus-related deaths in Germany has been lower than in other countries.
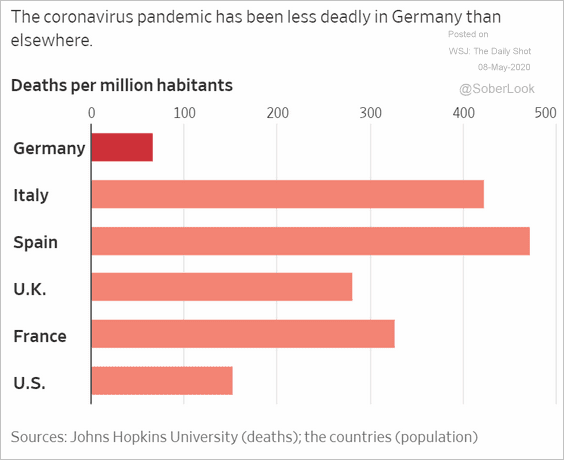 Source: @WSJ Read full article
——————–
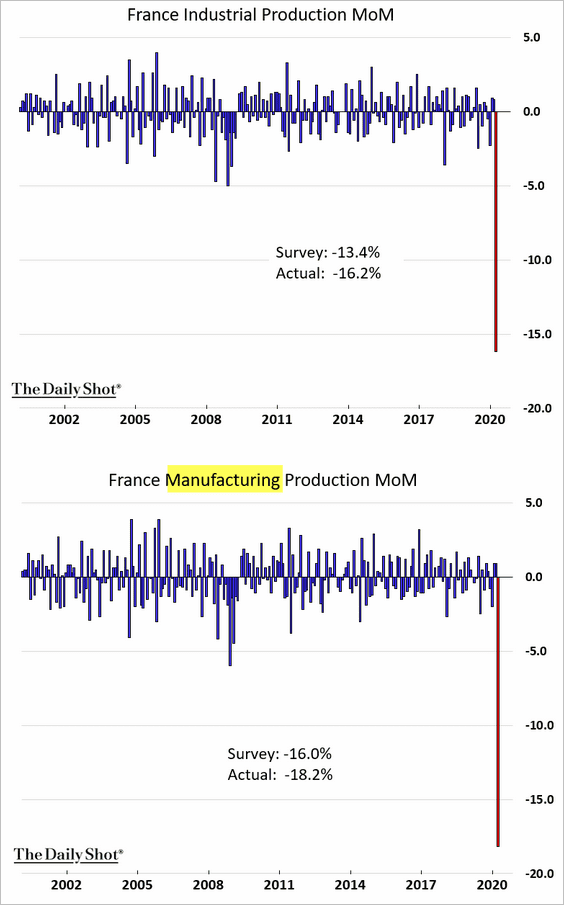
2. Here are the monthly changes in French industrial production.
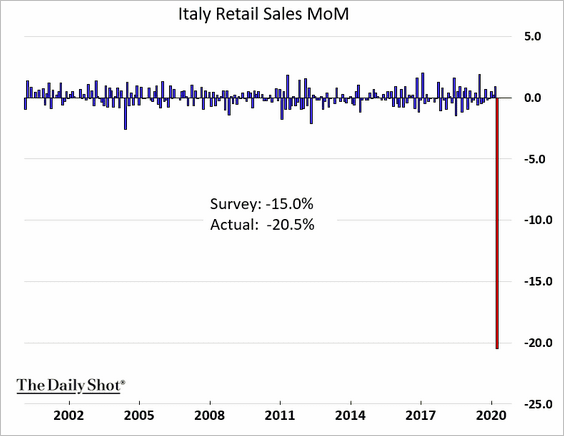
3. And this chart shows the changes in Italian retail sales.
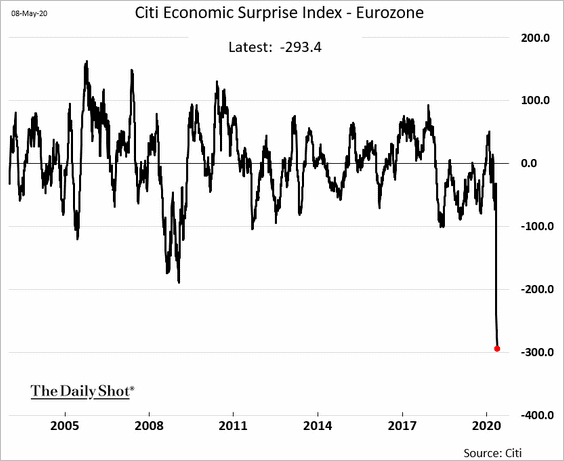
4. The Citi Economic Surprise Index hit another record low.
5. Eurozone companies have been able to tap a great deal of liquidity in this crisis (in contrast to what we saw after 2008).
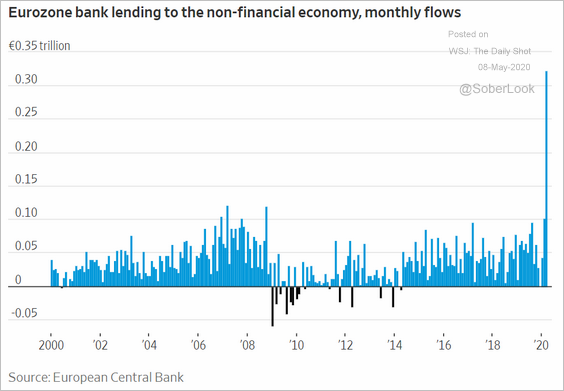 Source: @WSJ Read full article
Europe
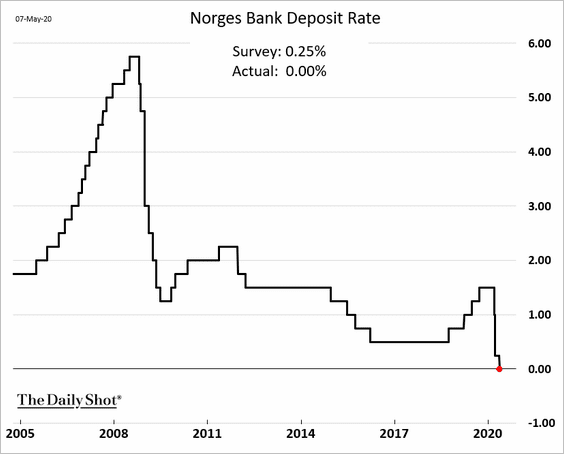
1. A couple of central banks surprised with aggressive rate cuts.
• Norway (taking rates to zero):
• The Czech Republic:
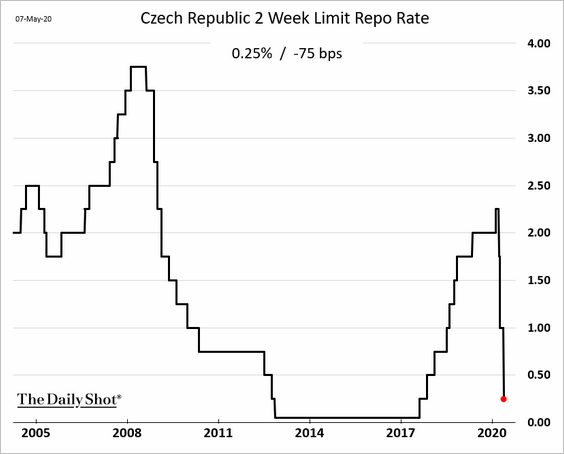
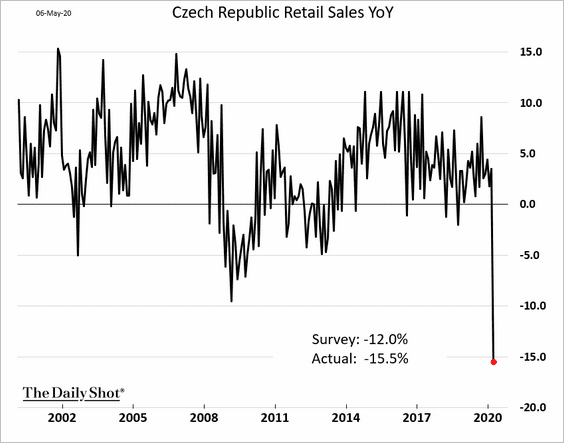
The Czech central bank is responding to severe economic deterioration. Here are the year-over-year changes in retail sales (through March).
——————–
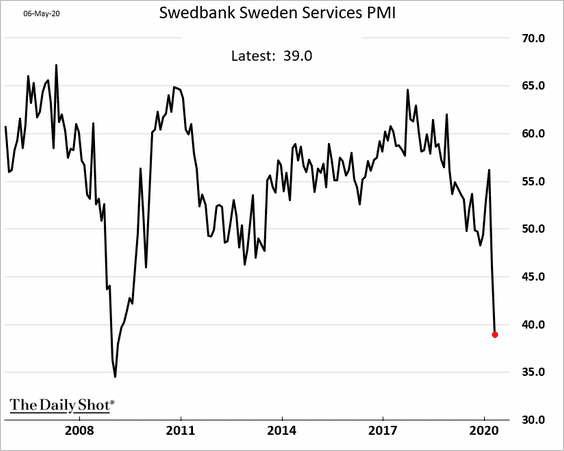
2. This chart shows Sweden’s services business activity (PMI).
Asia – Pacific
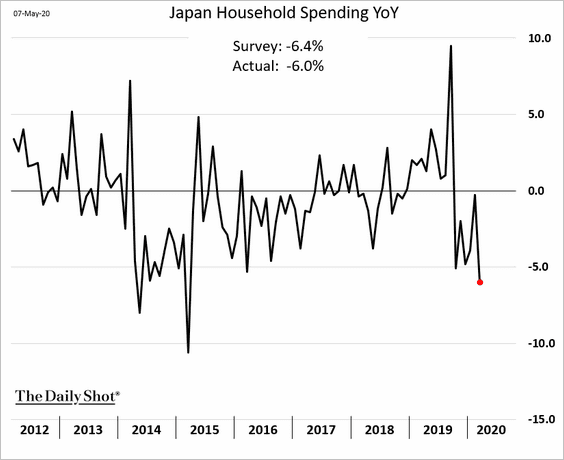
1. Japan’s household spending weakened further in March.
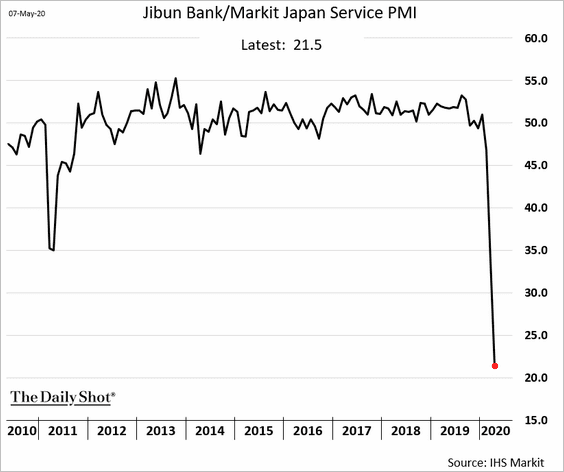
Here is the updated service-sector PMI through April.
——————–
2. Next, we have some scenarios for Australia’s economy from RBA.
• The GDP:
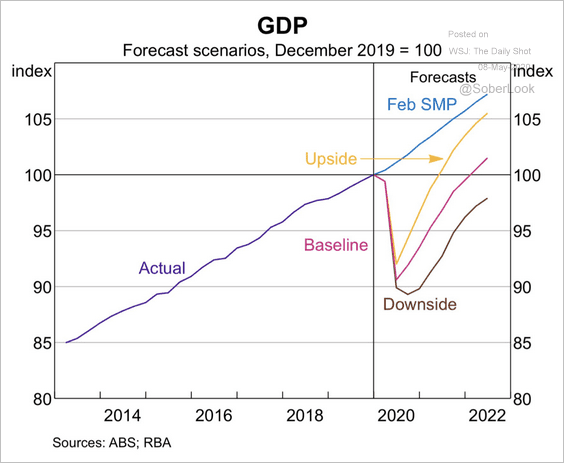 Source: Reserve Bank of Australia
• Unemployment:
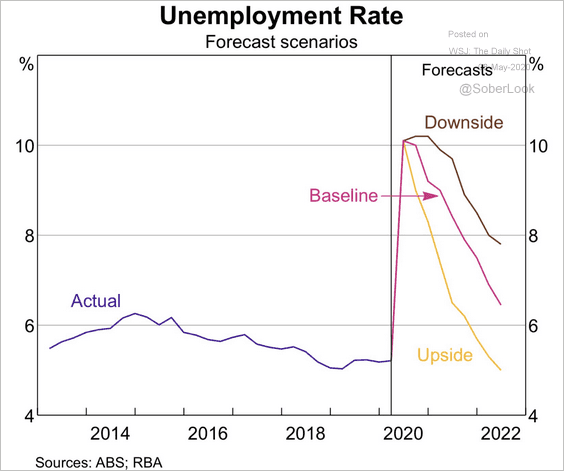 Source: Reserve Bank of Australia
Emerging Markets
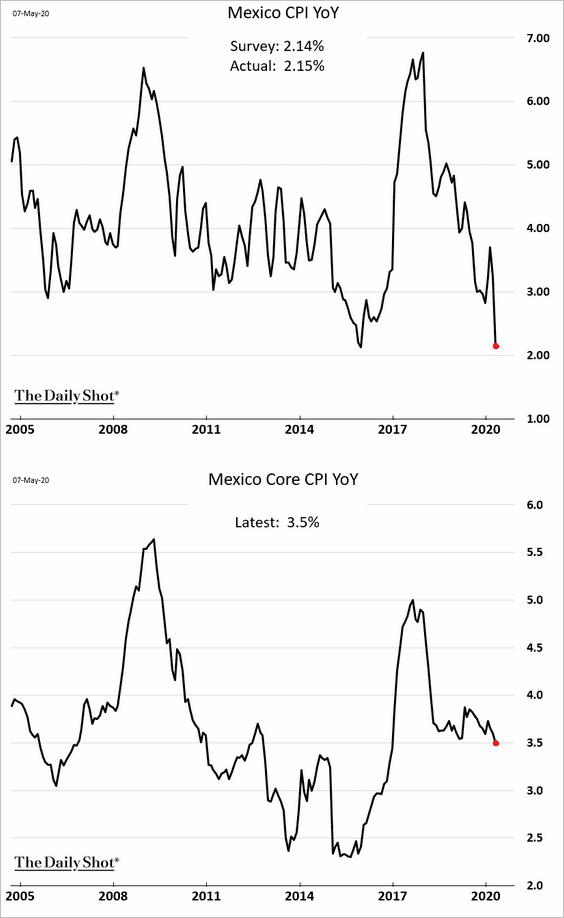
1. Mexico’s inflation has been moving lower despite the peso’s weakness.
2. Mexican and Brazilian bond yields have diverged.
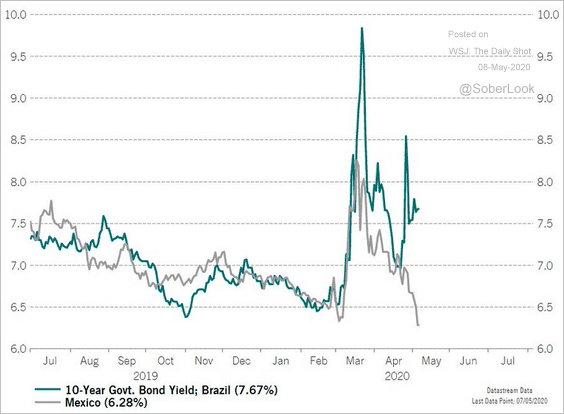 Source: @RichardDias_CFA
3. Latin American equities are at support.
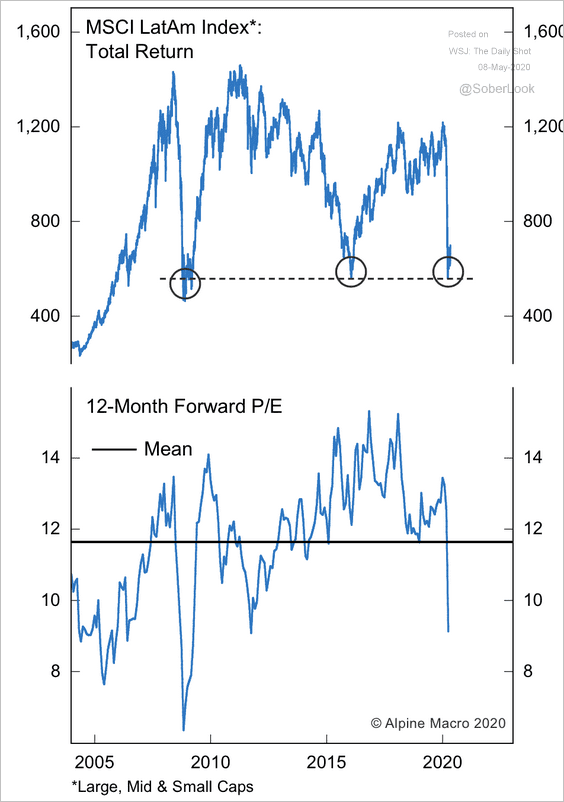 Source: Alpine Macro
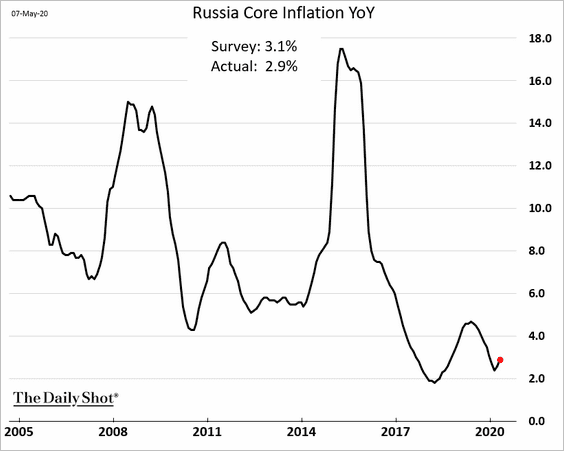
4. Russia’s CPI ticked higher, but that won’t derail additional central bank easing.
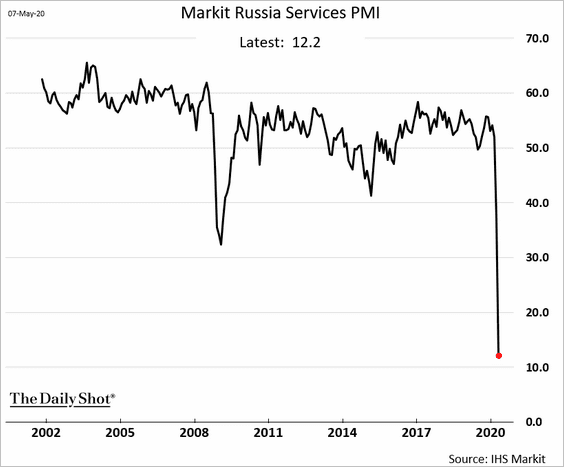
Here is an indicator of Russia’s service-sector activity.
——————–
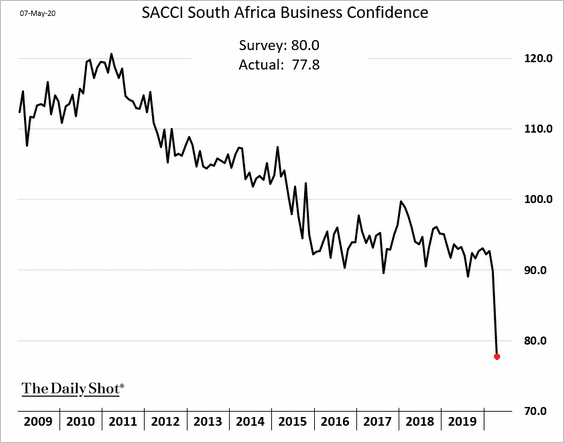
5. Below is South Africa’s business confidence.
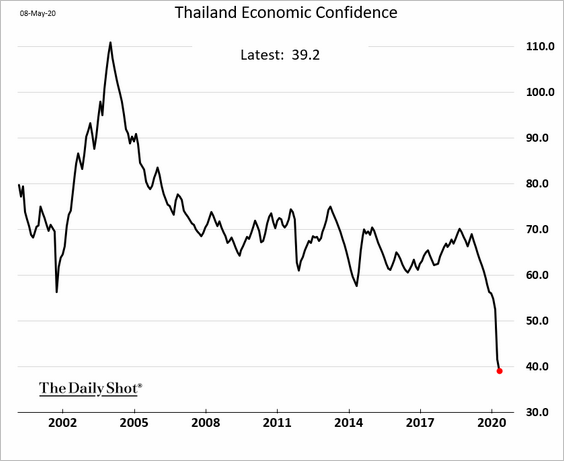
6. And this chart shows Thailand’s consumer confidence.
7. Hungarian industrial production tumbled in March.
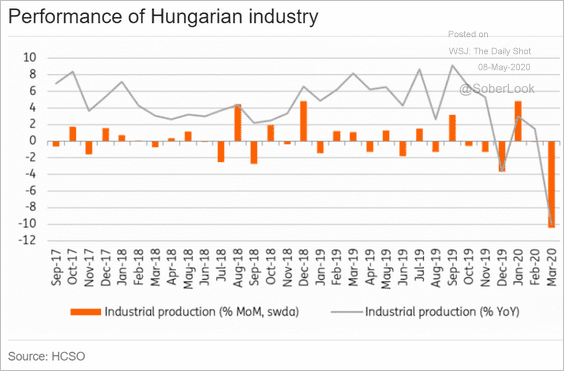 Source: ING
8. Here is how much of their F/X reserves these countries spent to defend their currencies.
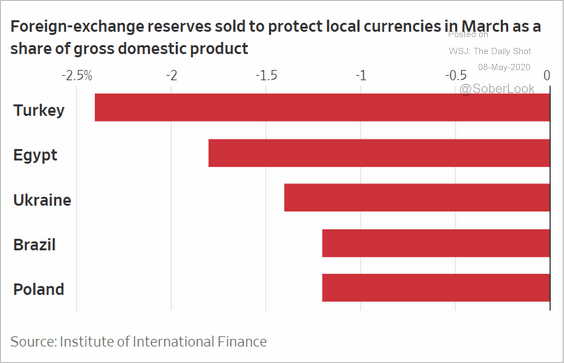 Source: @WSJ Read full article
9. This chart shows where markets may be mispricing sovereign debt risk, according to Oxford Economics estimates.
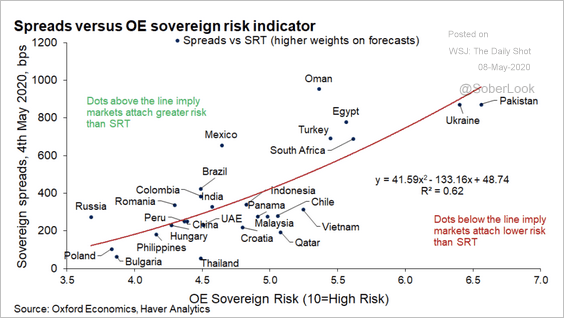 Source: Oxford Economics
10. EM equities are more optimistic about growth than other asset classes.
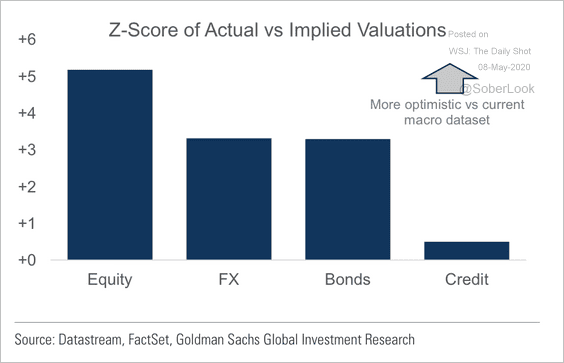 Source: Goldman Sachs
EM assets are priced for 1.2% growth, well above measures of economic activity, according to Goldman.
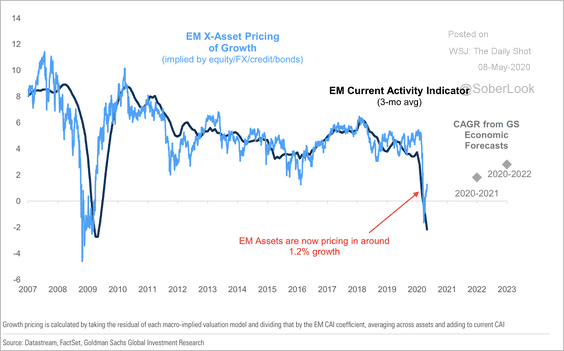 Source: Goldman Sachs
Cryptocurrency
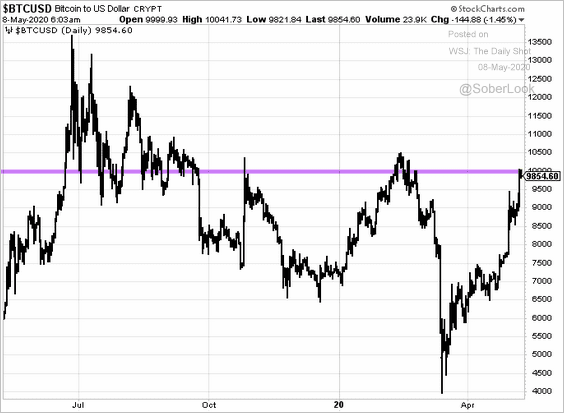
Bitcoin is testing resistance at $10k, as it continues to rally with equities.
Commodities
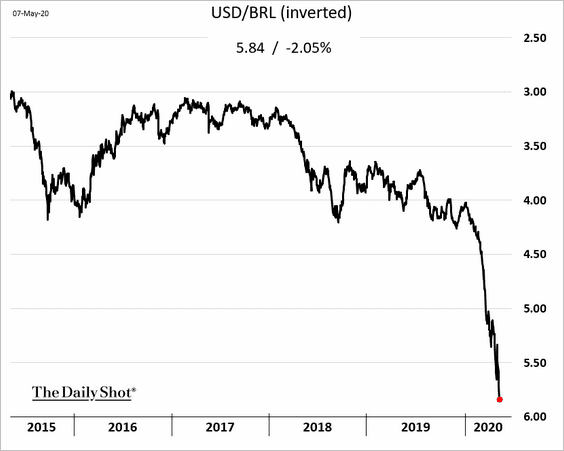
1. The massive ongoing devaluation in the Brazilian real is bad news for US soybean farmers.
2. This chart shows US meat production.
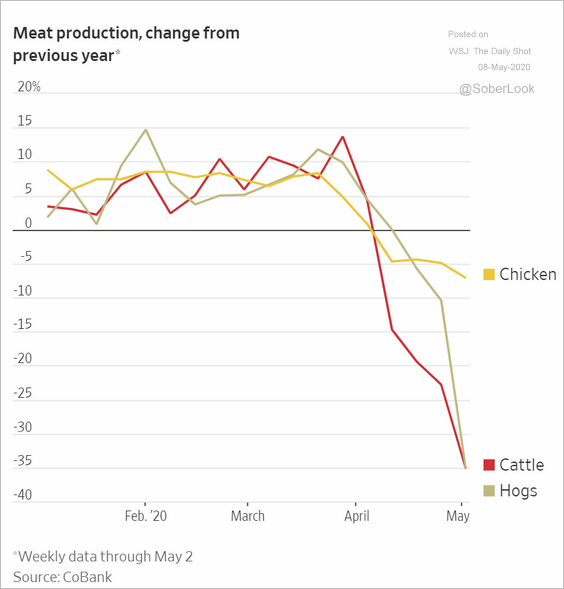 Source: @WSJ Read full article
3. Global food prices declined last month.
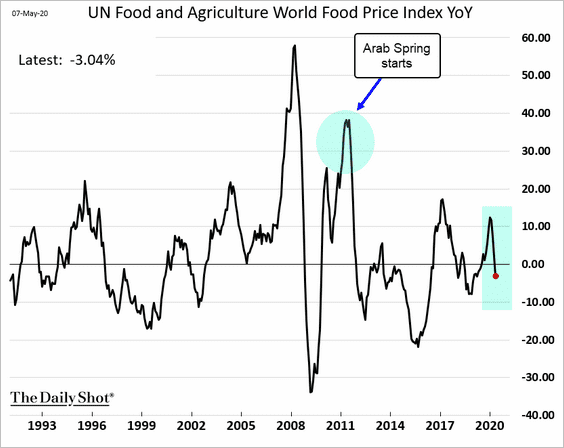 Source: Further reading
4. Next, we have some updates on precious metals.
• Gold ETF holdings:
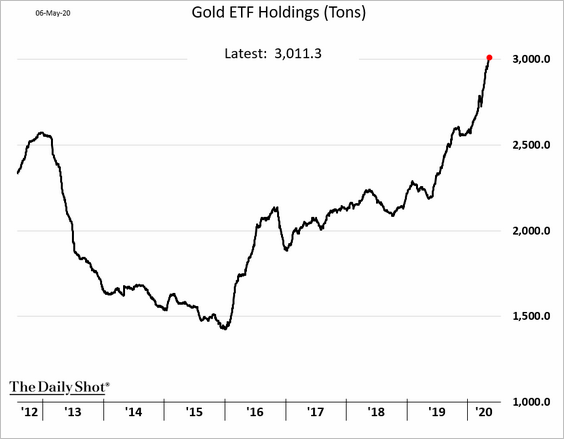 Source: Ranjeetha Pakiam
• Gold miners relative valuation:
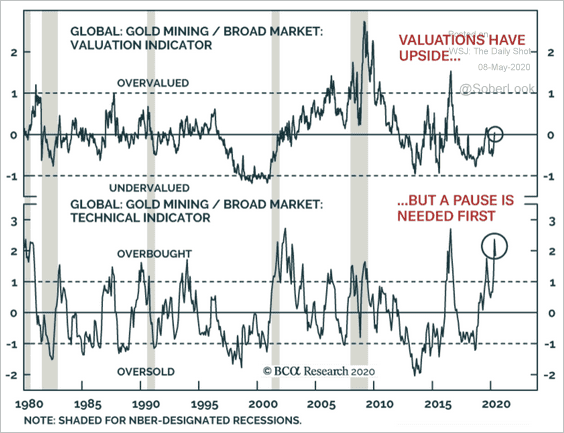 Source: BCA Research
• US imports of gold:
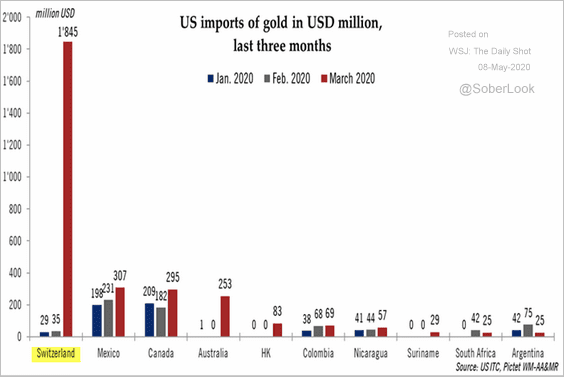 Source: @Tcosterg
• Silver futures vs. physical silver price:
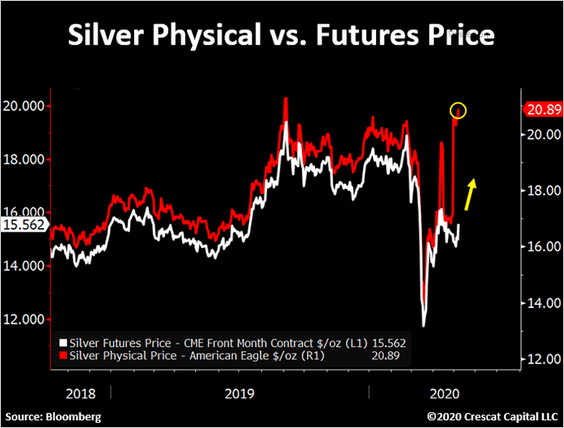 Source: @TaviCosta
——————–
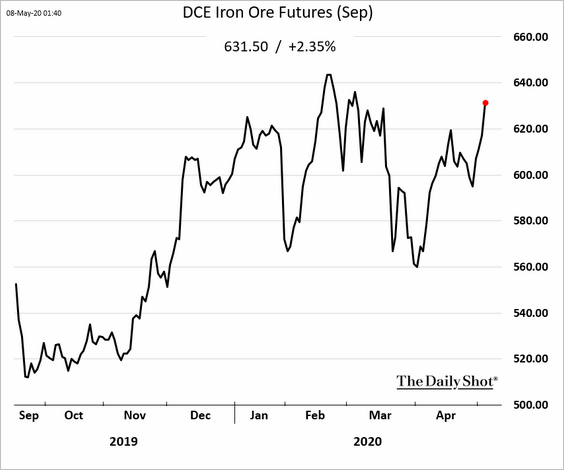
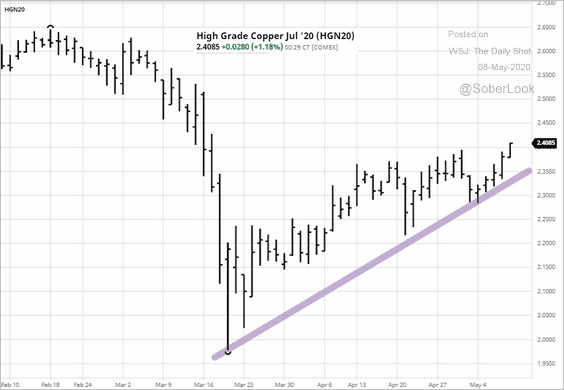
5. Industrial commodities are rebounding.
• Iron ore:
• Copper:
——————–
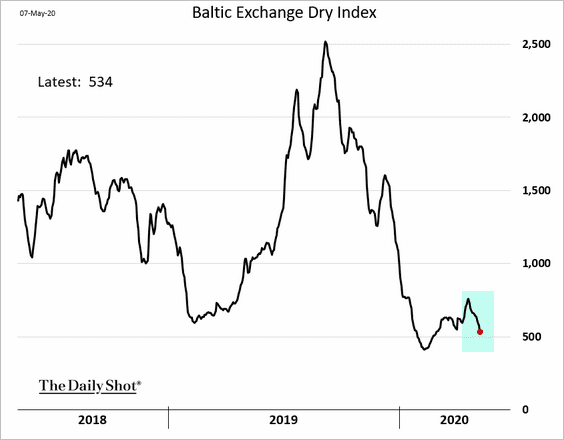
6. Dry bulk shipping prices are rolling over.
Equities
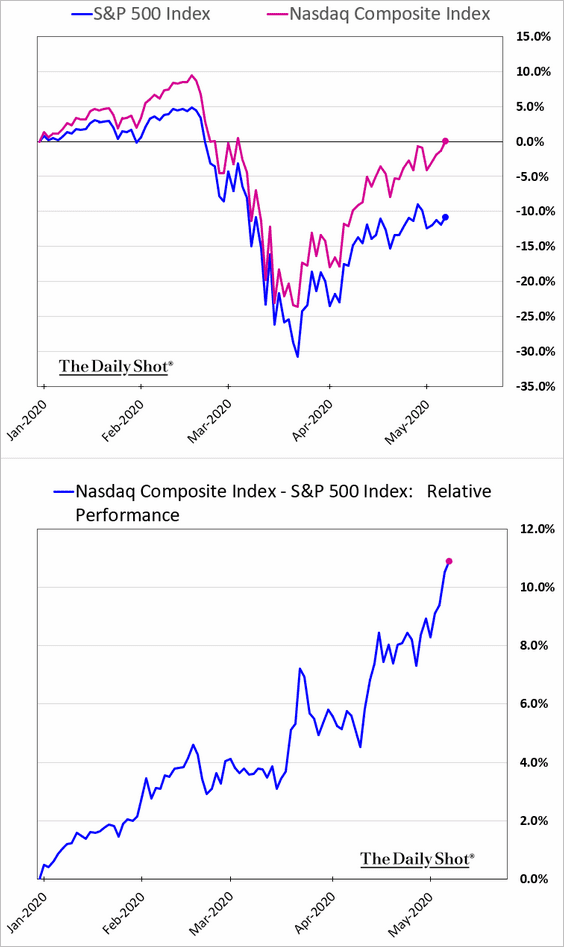
1. The Nasdaq Composite Index is now up on the year.
2. This chart shows the S&P 500 forward P/E ratio with and without the tech mega-caps.
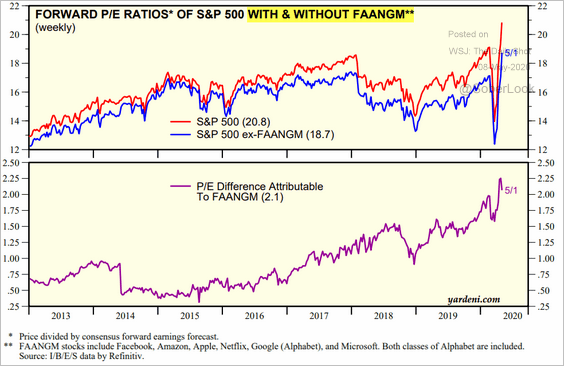 Source: Yardeni Research
3. Share buybacks are running well behind the trend from recent years.
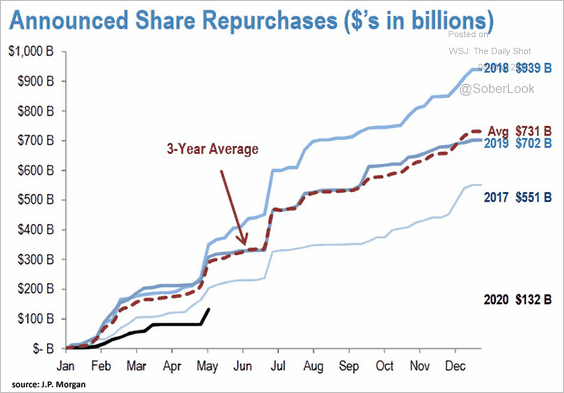 Source: JP Morgan, @ISABELNET_SA
4. Correlations among S&P 500 sector ETFs have been declining for several weeks, partly attributed to the relentless outperformance of big tech, according to Cantor Fitzgerald.
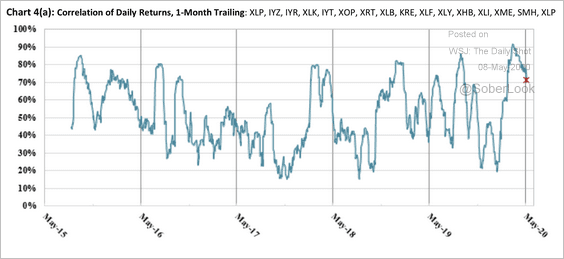 Source: Cantor Fitzgerald Market Strategy Team
5. What is the sensitivity of different equity styles/factors to the declines in the S&P 500?
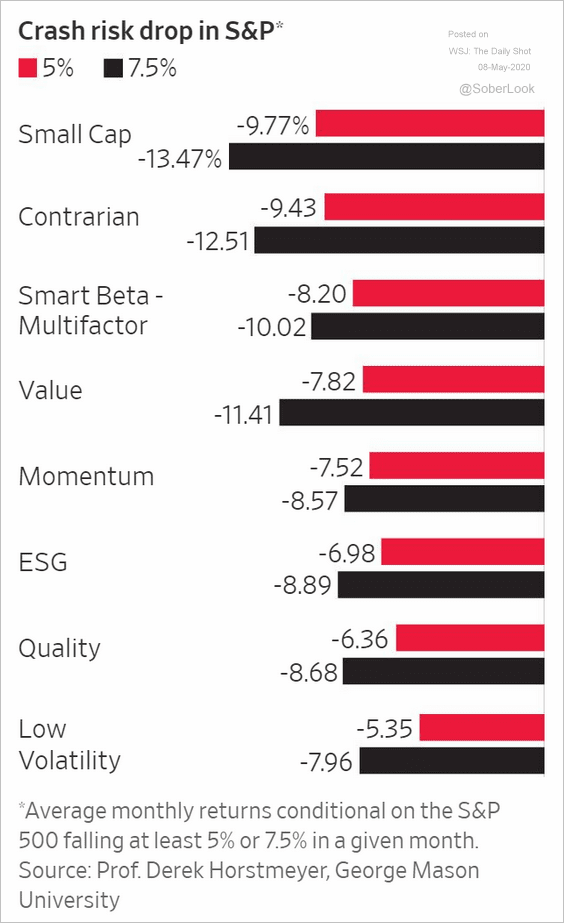 Source: @WSJ Read full article
6. ETFs that buy downside protection and finance it by selling some upside have been gaining assets in recent months.
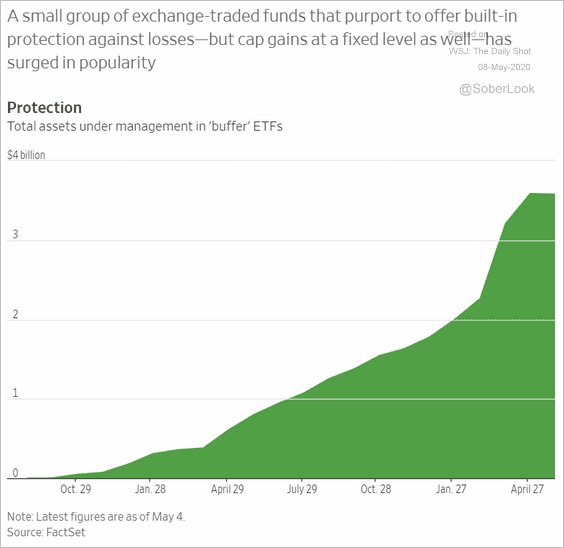 Source: @WSJ Read full article
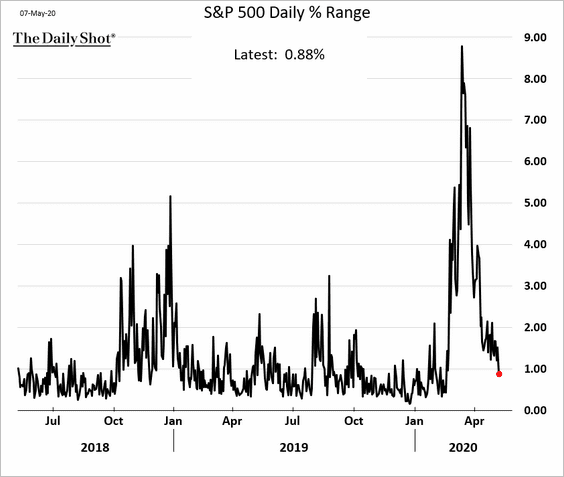
7. The S&P 500 intraday volatility is approaching pre-selloff levels.
Credit
1. The number of companies with the lowest credit ratings has spiked.
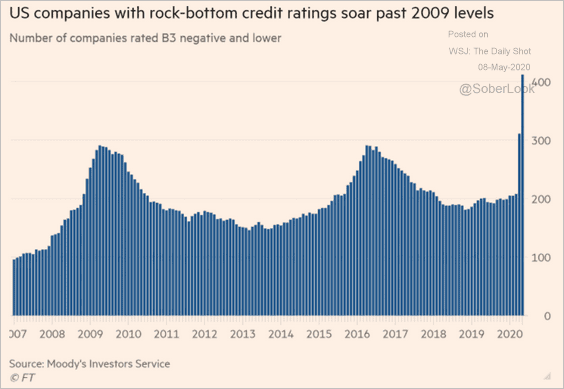 Source: @financialtimes, @trevornoren Read full article
• Here is the amount of CCC-rated leveraged loans outstanding.
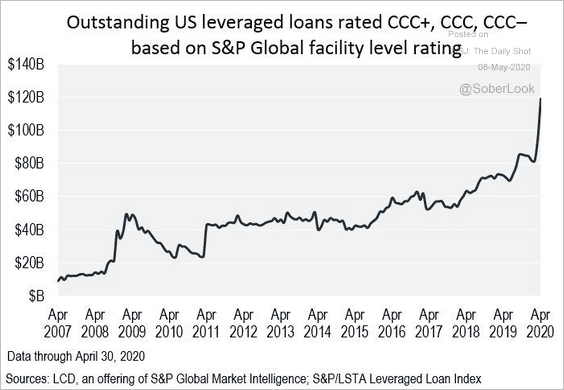 Source: @lcdnews
• And this chart shows distressed debt by sector.
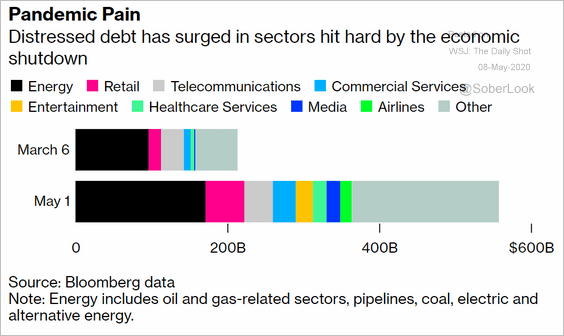 Source: @markets Read full article
• For now, there hasn’t been a spike in bankruptcies, but it’s coming.
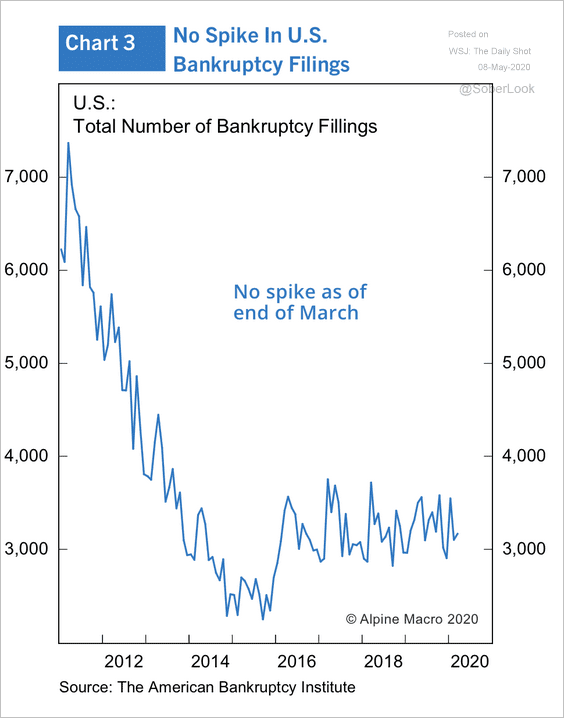 Source: Alpine Macro
——————–
2. United Airlines is having trouble raising debt capital. Existing bonds are tumbling.
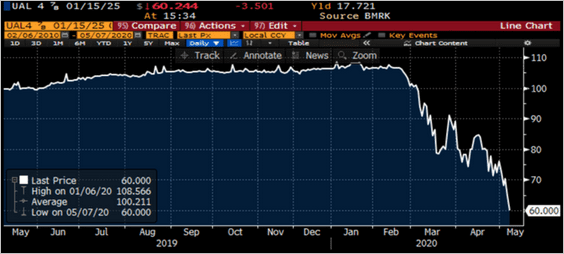 Source: @lisaabramowicz1 Read full article
3. European high-yield debt issuance has been slow.
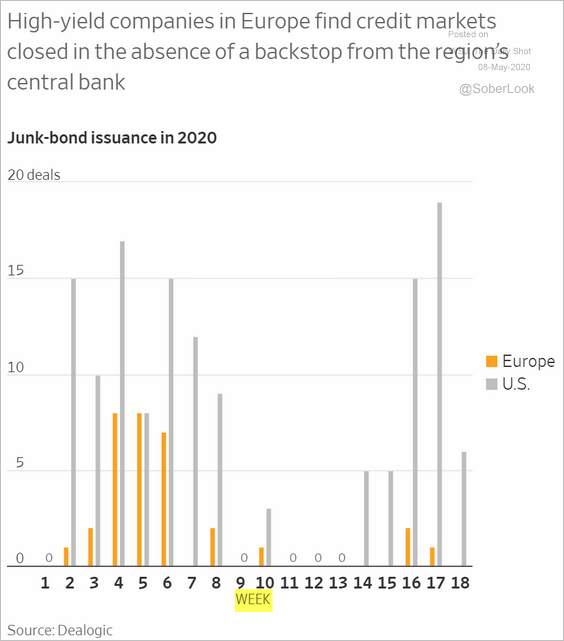 Source: @WSJ Read full article
4. Equity and credit volatility declined substantially after the Fed announced its primary and secondary market corporate credit facilities (PMCCF and SMCCF).
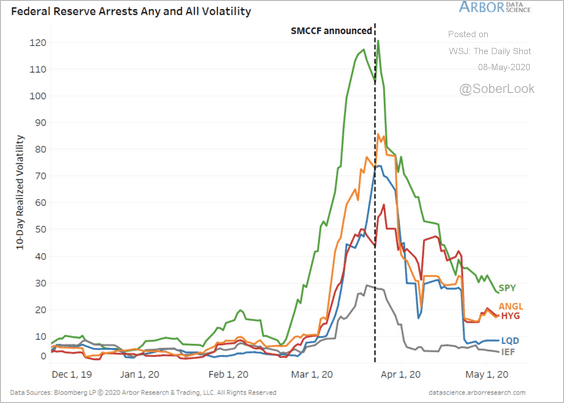 Source: BCA Research
5. Investment-grade debt funds continue to see inflows.
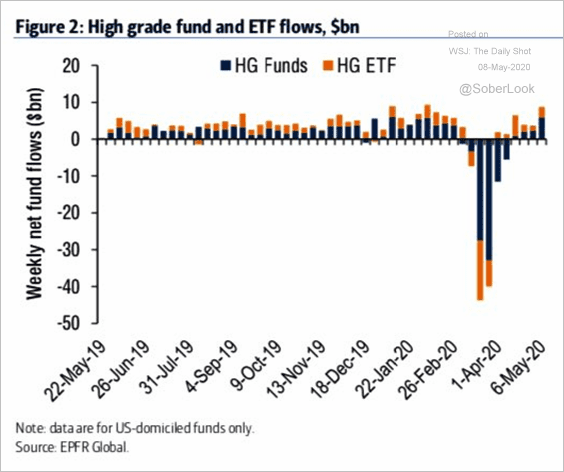 Source: BofA Merrill Lynch Global Research, @WallStJesus
6. Covenant quality keeps deteriorating.
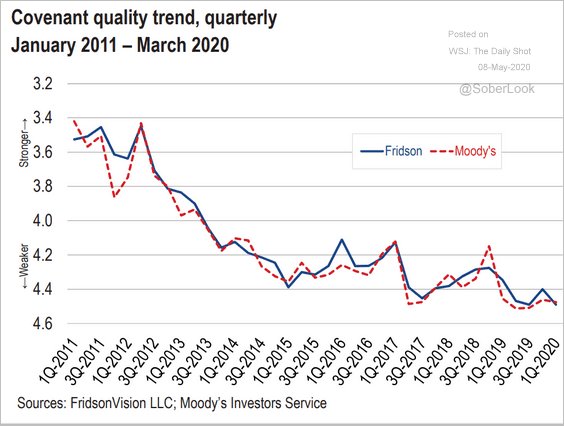 Source: LCD, S&P Global Market Intelligence
7. A number of states could see budget shortfalls of over 10%.
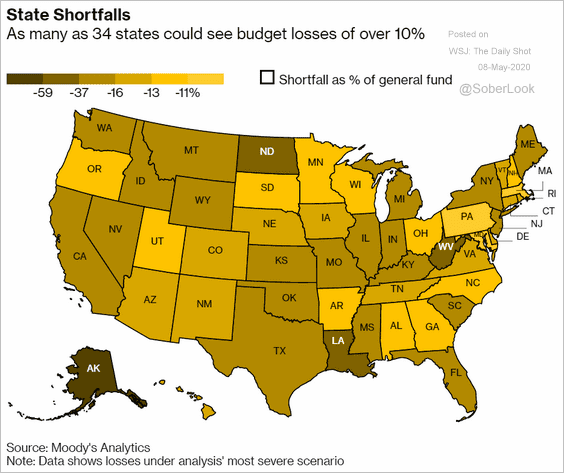 Source: @markets Read full article
Rates
1. The US Treasury started by issuing massive amounts of T-Bills, but it will be terming out a great deal of that debt.
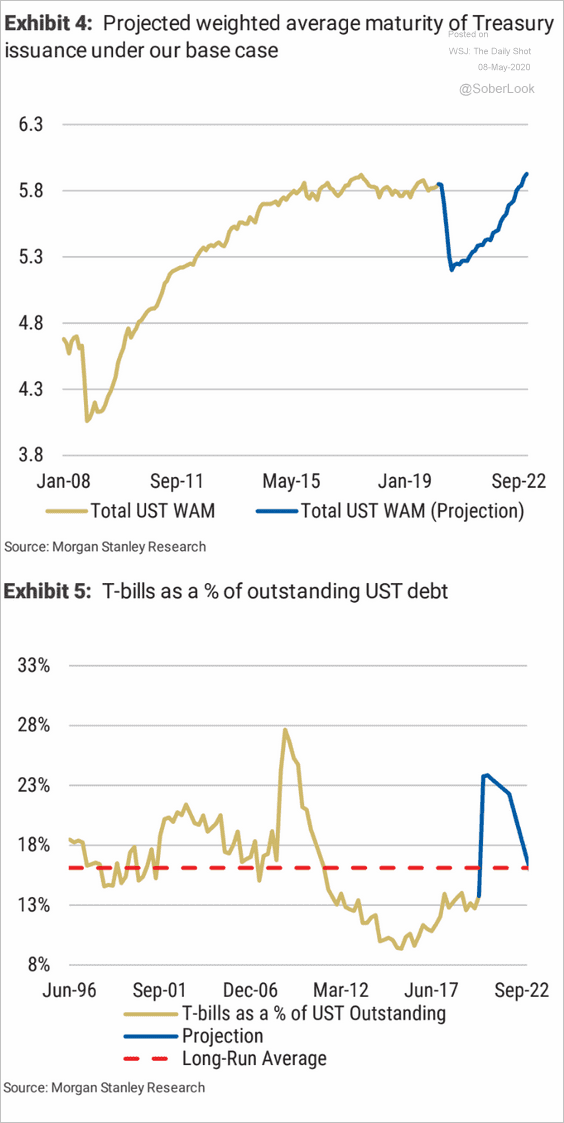 Source: Morgan Stanley Research
2. Here is a forecast for the Fed’s Treasury holdings as a percentage of the overall Treasury market (from Oxford Economics).
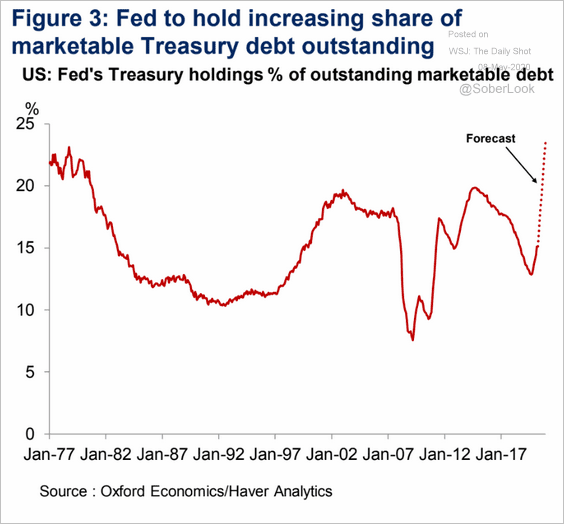 Source: Oxford Economics
3. Banks’ net repo lending has increased substantially over the past decade.
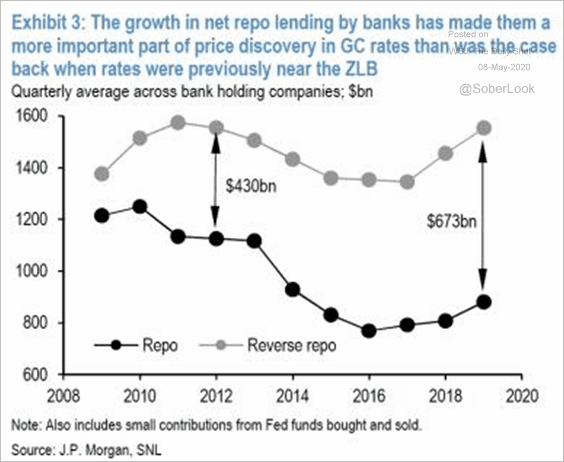 Source: JP Morgan, {ht} Adam Kneller
4. Finally, we have a scatterplot illustrating the relationship between the fed funds – IOER spread and bank reserves (as liquidity increases, the fed funds rate declines relative to IOER – see discussion).
 Source: BofA Merrill Lynch Global Research, {ht} Adam Kneller
Global Developments
1. How have Bank of America’s wealth management clients changed their asset allocations last month?
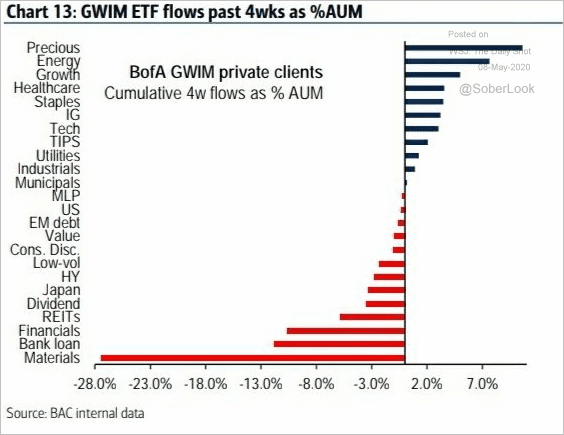 Source: BofA Merrill Lynch Global Research, @WallStJesus
2. This chart shows the lockdowns’ impact on the global GDP (an estimate from Goldman Sachs).
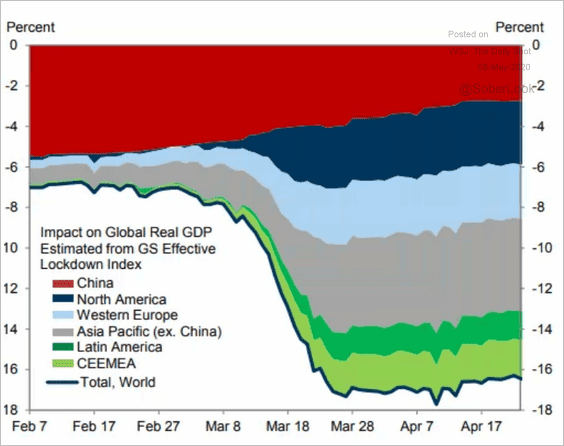 Source: @ISABELNET_SA, @GoldmanSachs
3. What percentage of the workforce will be working from home in the second half of the year?
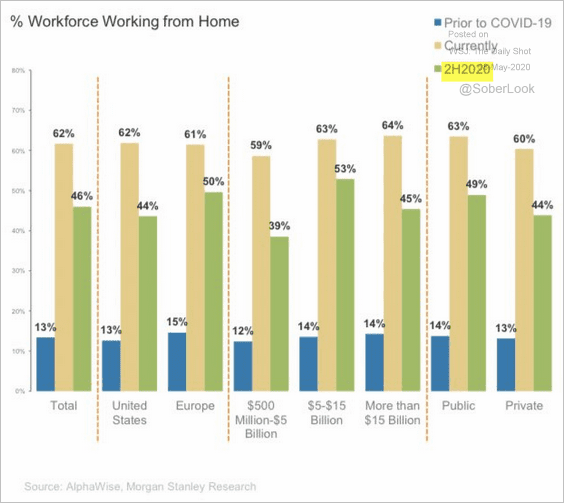 Source: Morgan Stanley Research, @carlquintanilla
——————–
Food for Thought
1. Average US homeownership tenure:
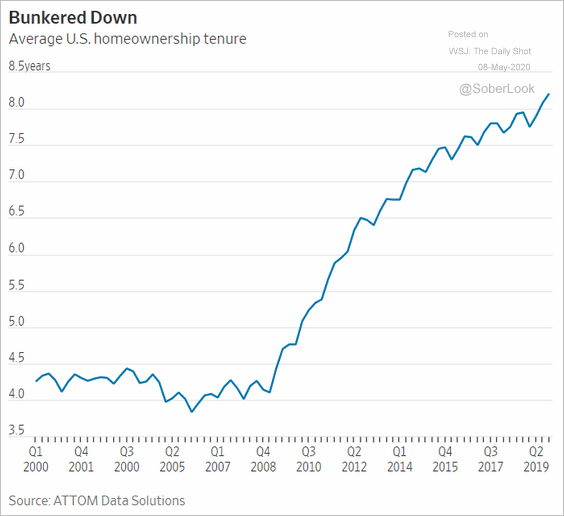 Source: @WSJ Read full article
2. Consumer spending by Americans who are over 55 years old:
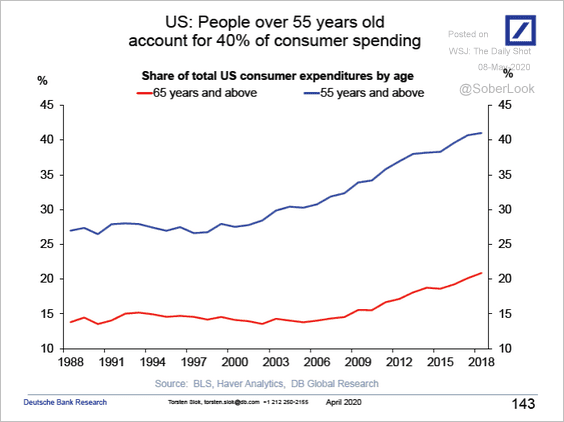 Source: Deutsche Bank Research
3. The percentage of time spent at home:
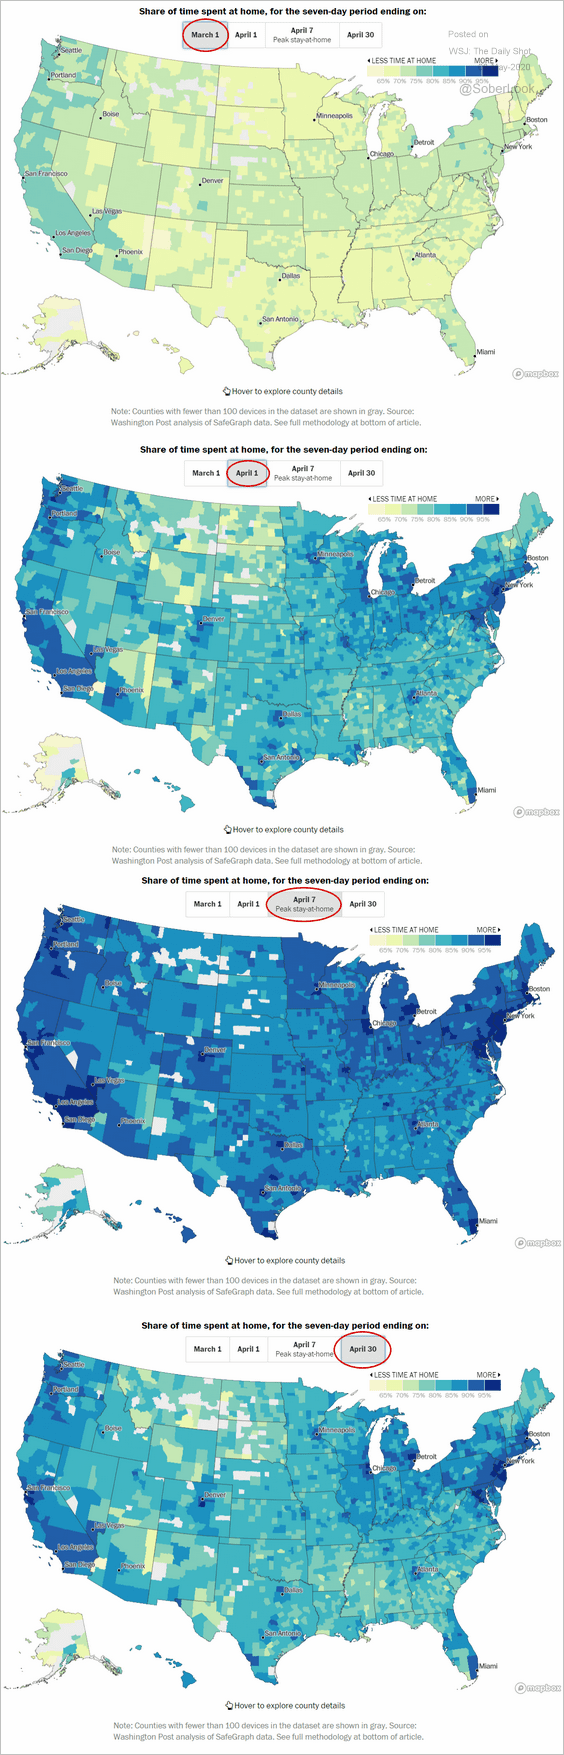 Source: The Washington Post Read full article
4. Eviction moratoria:
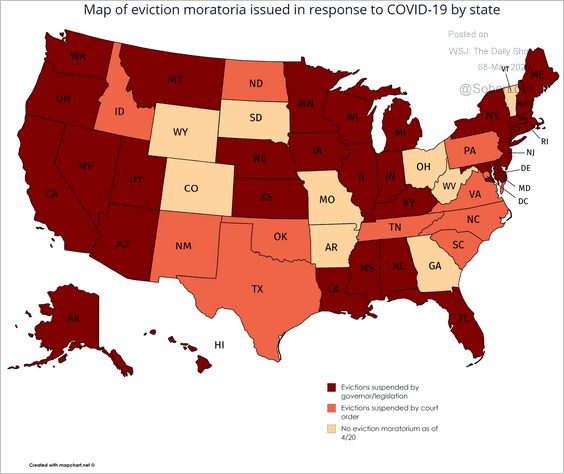 Source: Pioneer Institute Read full article
5. COVID-19 at meat processing plants:
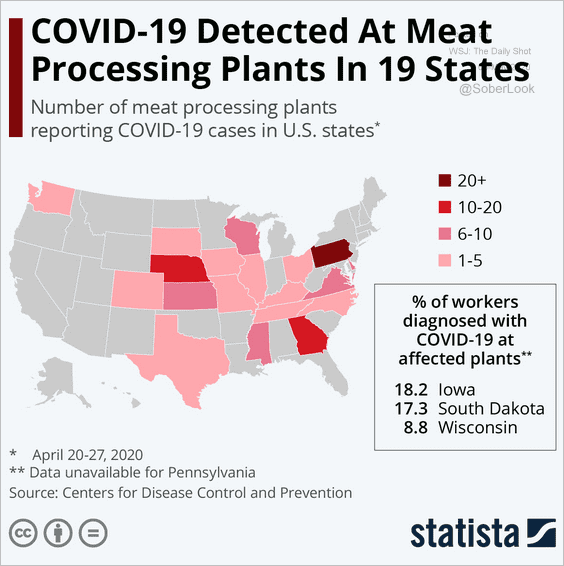 Source: Statista
6. Google search frequency for phrases …
• “drive-through” vs. “coronavirus symptoms”:
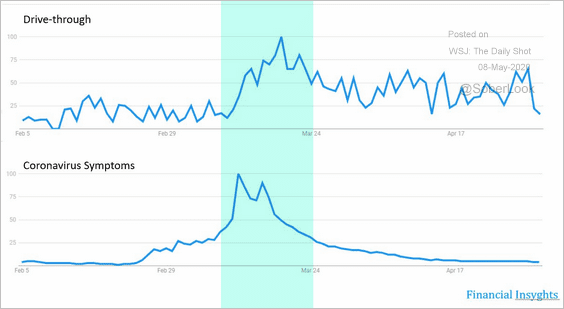 Source: @Peter_Atwater
• “coronavirus symptoms” vs. “reopen”:
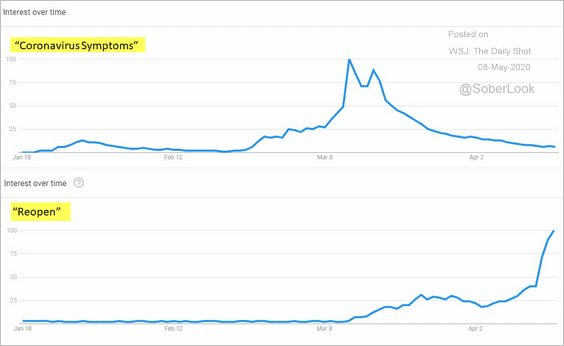 Source: @Peter_Atwater
——————–
7. What products sold well during the lockdown peak?
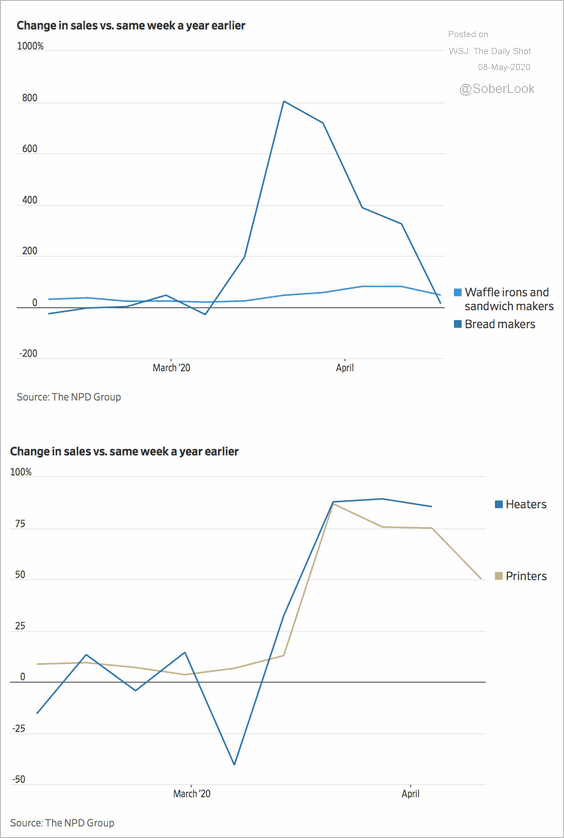 Source: @WSJ Read full article
8. Would you get vaccinated?
 Source: Morning Consult Read full article
9. Elevator distancing:
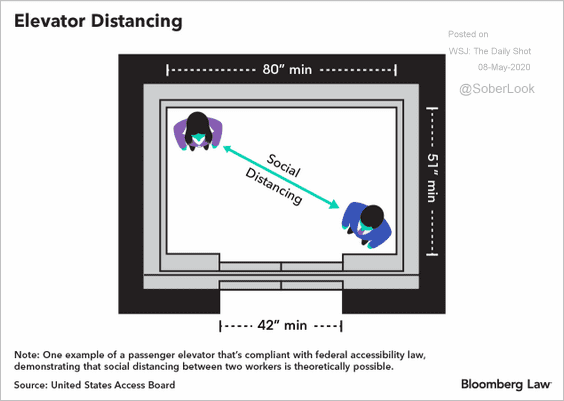 Source: Bloomberg Law Read full article
10. Highest-grossing romantic comedies:
 Source: Statista
——————–
Have a great weekend!