
The Daily Shot: 13-Jun-24
• The United States
• The United Kingdom
• The Eurozone
• Asia-Pacific
• China
• Emerging Markets
• Energy
• Equities
• Credit
• Global Developments
• Food for Thought
The United States
1. US inflation cooled in May, with the CPI report coming in below expectations. The headline CPI was flat for the month.
 Source: @TheTerminal, Bloomberg Finance L.P.
The core CPI showed the smallest increase since 2021 (2 charts).
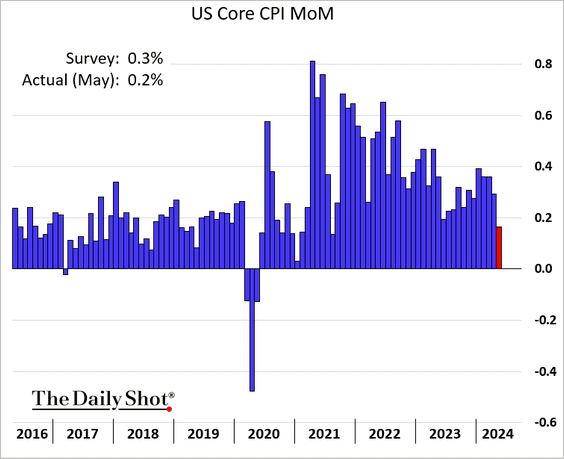
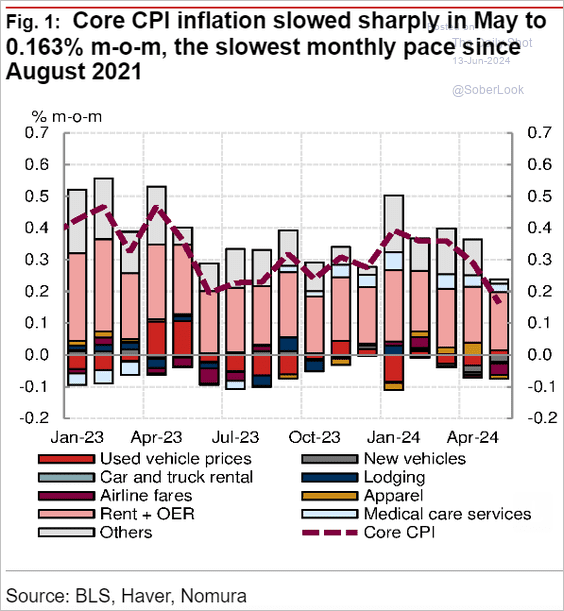 Source: Nomura Securities
Below is the year-over-year trend.

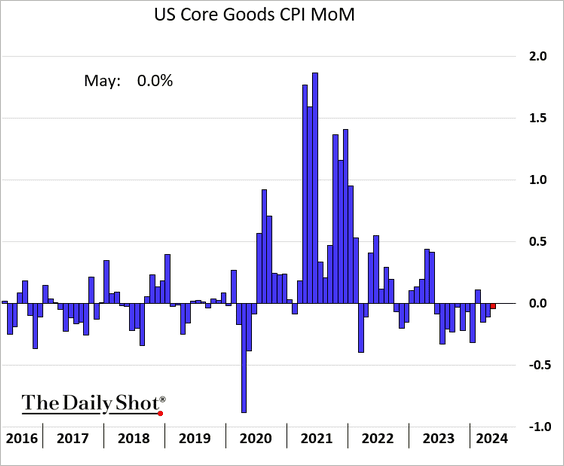
• The core goods CPI declined slightly.
Here is the core services CPI.

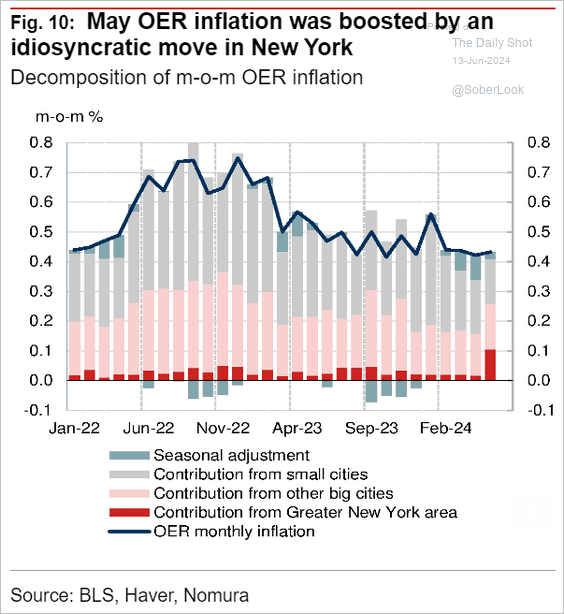
• Housing inflation remains elevated.

The Owners Equivalent Rent component of the CPI was buoyed by increases in the NYC metro area.
 Source: Nomura Securities
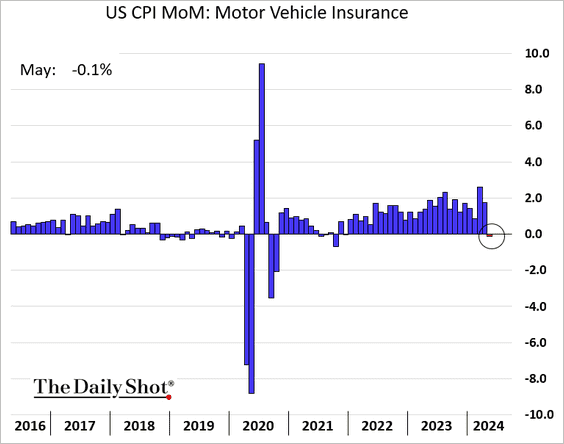
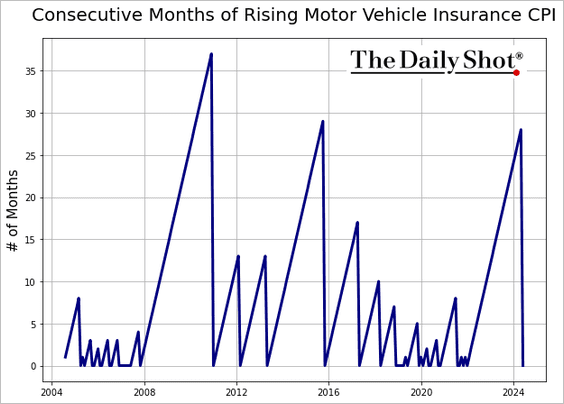
• The supercore CPI registered a negative change in May as costs for transportation services declined, primarily due to lower vehicle insurance and repair expenses.
 Source: @TheTerminal, Bloomberg Finance L.P.
– It’s been a while since we saw a decline in car insurance costs (2 charts).
• Alternative measures of core inflation also softened.
– Sticky CPI:

– Trimmed mean CPI:

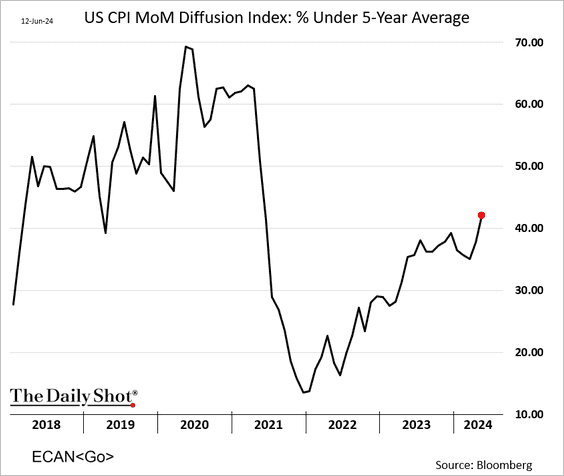
• The percentage of CPI components running below their 5-year average continues to rise.
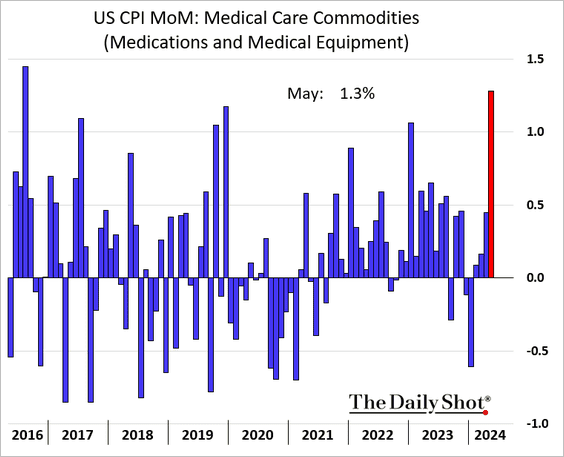
• Here are some additional CPI components.
– Airline fare:

– New and used vehicles:

– Medications:
——————–
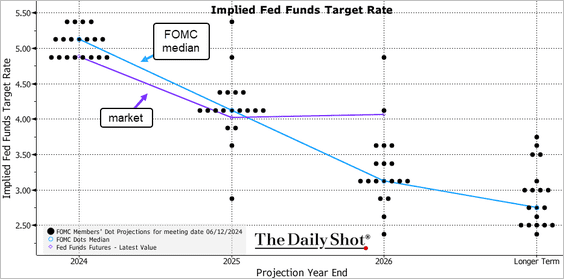
2. The FOMC boosted their forecasts for the target rate, now projecting only one rate cut for 2024.
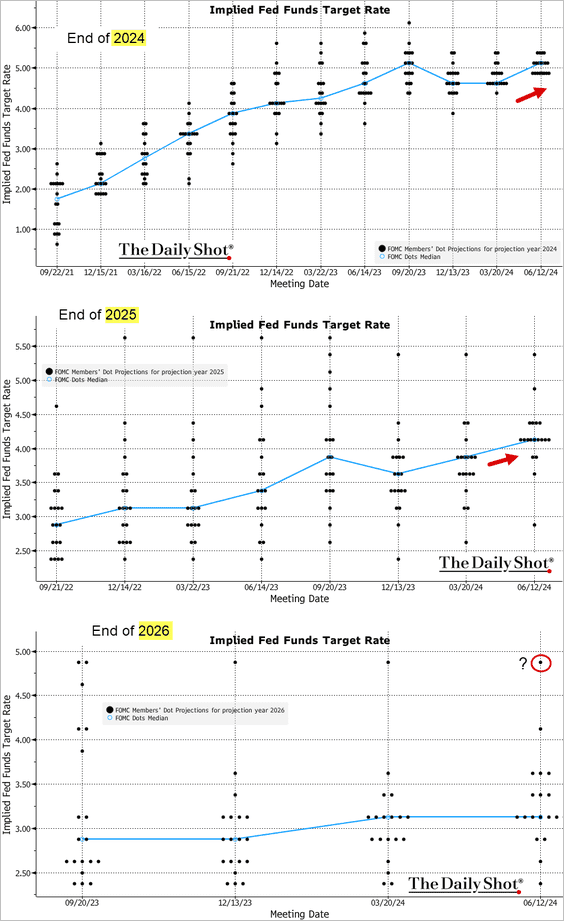 Source: @TheTerminal, Bloomberg Finance L.P.
 Source: @economics Read full article
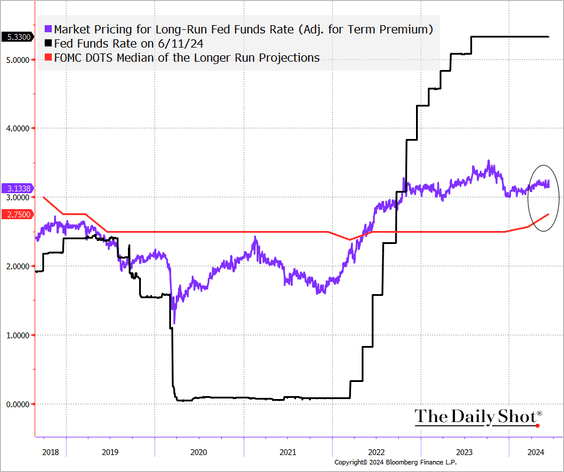
• The Committee also increased its estimate of the nominal “longer-run” rate, …
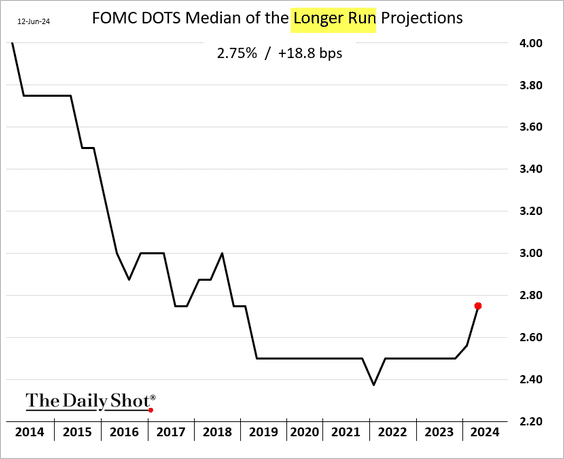
… bringing it closer to the market’s expectations.
 Source: @TheTerminal, Bloomberg Finance L.P.
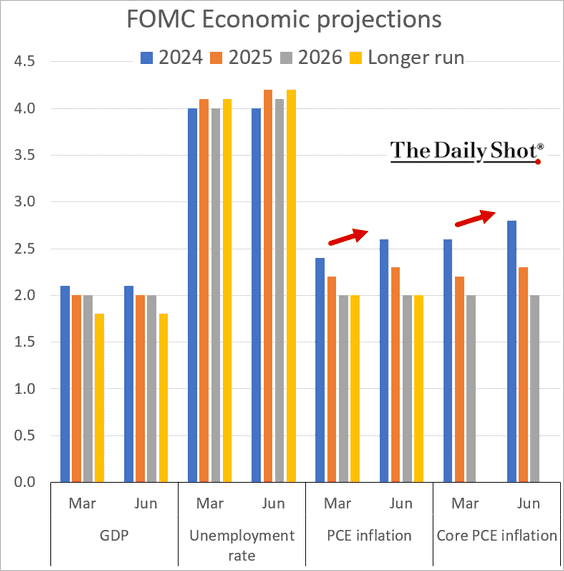
• The FOMC statement acknowledged “modest” progress in reducing inflation.

• THe FOMC raised their inflation estimates for 2024 and 2025.
——————–
3. Given the soft CPI print, the market is leaning toward two rate cuts this year rather than one, ….
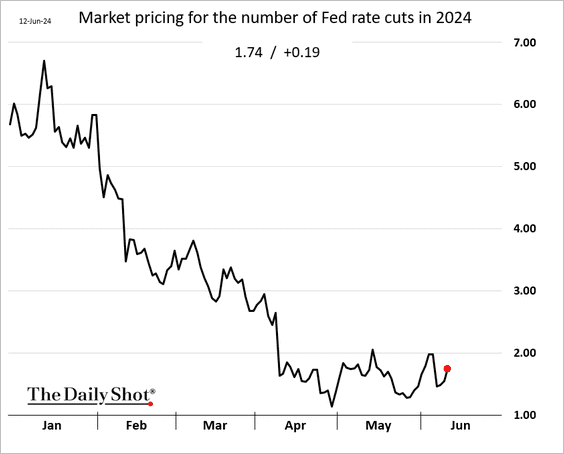
… diverging from the dot plot.
 Source: @TheTerminal, Bloomberg Finance L.P.
– Here are the market-implied rate changes in the months ahead.

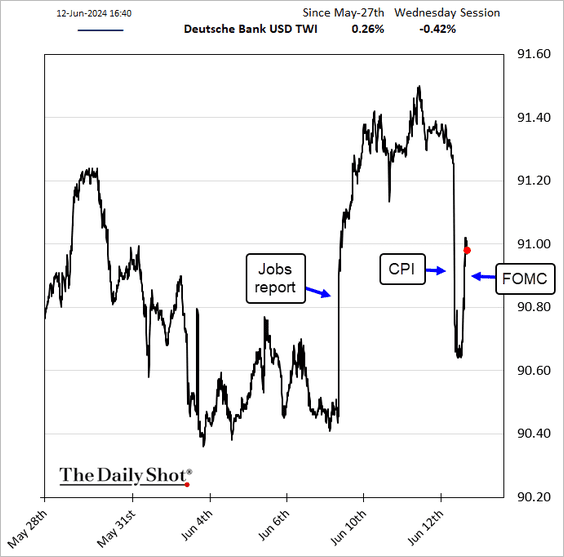
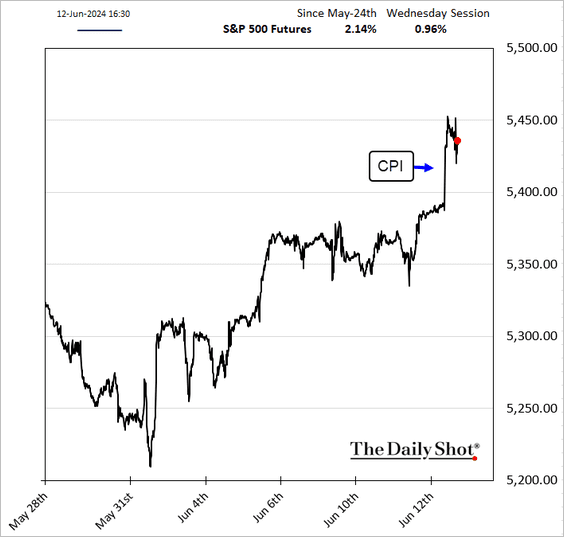
• Treasury yields and the dollar declined on the back of the soft CPI report but bounced after the Fed’s dot plot showed only one rate reduction this year.

Stocks climbed further.
Back to Index
The United Kingdom
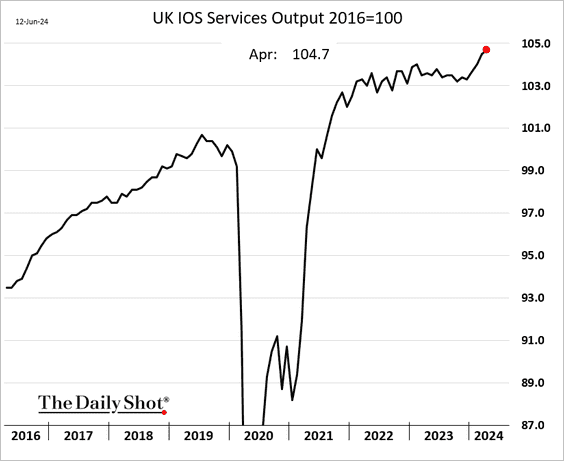
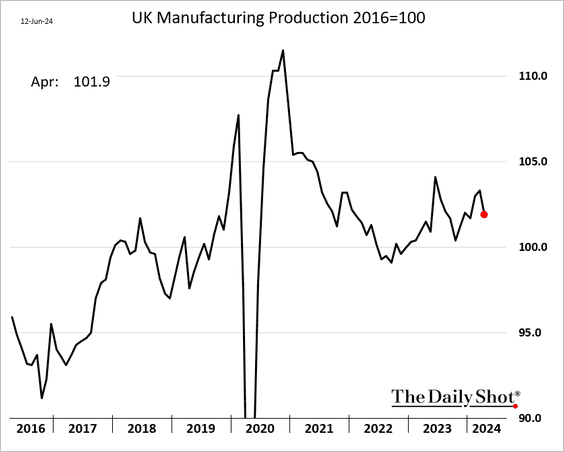
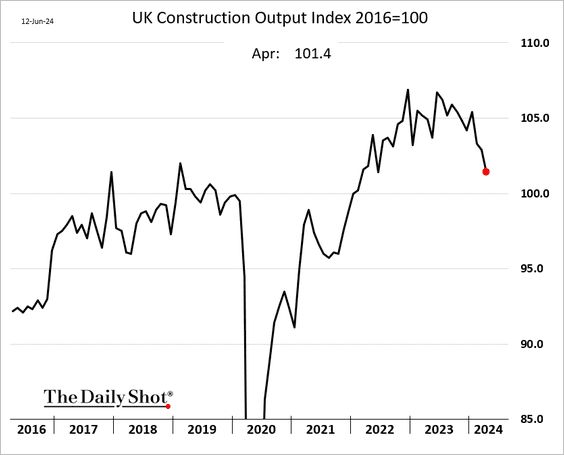
1. The monthly GDP estimate held steady in April (the market expected a decline).

• Service sector output increased again.
• Factory output dropped.
• Construction activity has been rolling over.
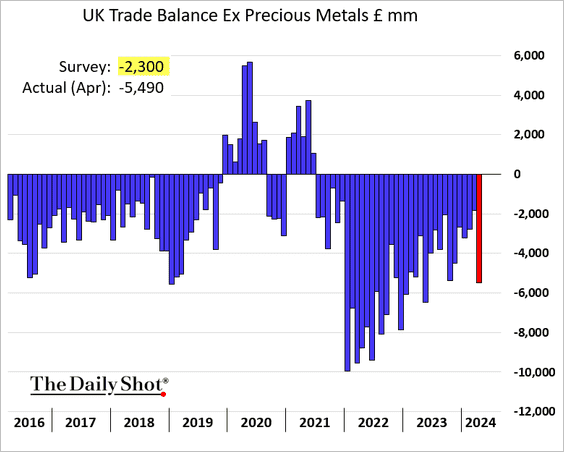
2. The trade deficit widened sharply in April.
3. The housing market is losing momentum, according to RICS.
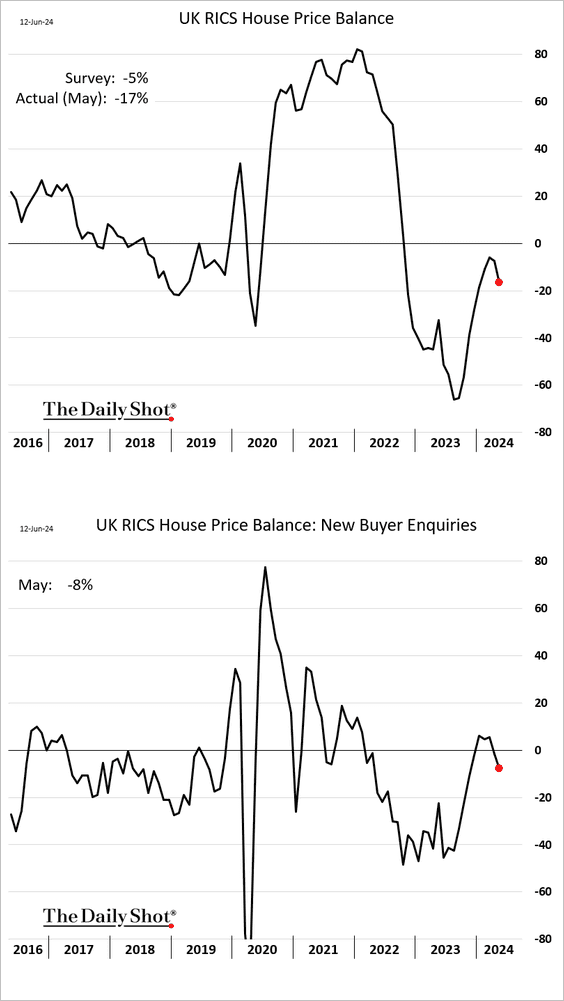
 Source: Evening Standard Read full article
Back to Index
The Eurozone
1. The euro bounced following the subdued US CPI report.

2. French stocks have been tumbling relative to German shares.
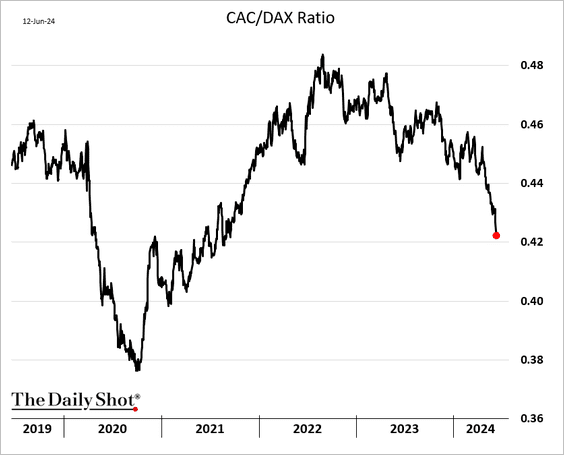 h/t Heather Burke, Markets Live Editor, Bloomberg
This chart illustrates the implied volatility divergence between French and German indices.
 Source: @TheTerminal, Bloomberg Finance L.P.{h/t} Heather Burke, Markets Live Editor
• The Spain-France 10-year spread hit the lowest level since 2009.

Back to Index
Asia-Pacific
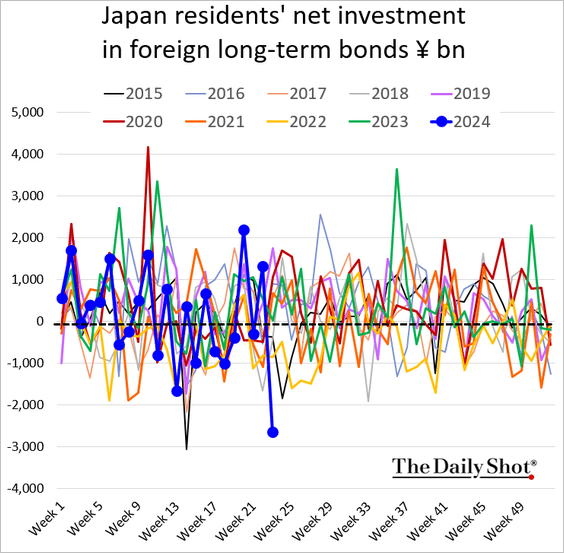
1. Japanese investors dumped foreign bonds after the JGB yield surge.
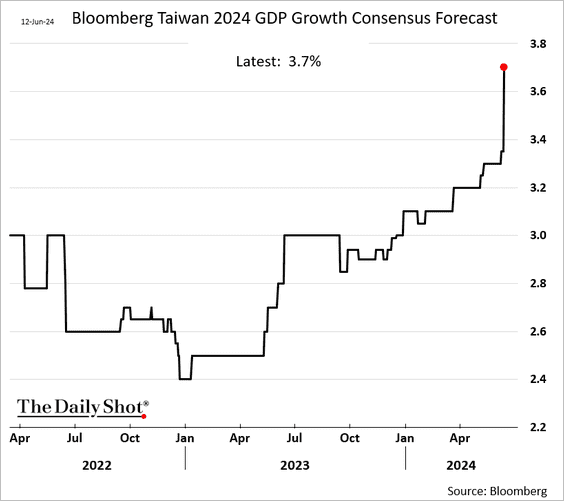
2. Economists sharply boosted Taiwan’s GDP growth for this year.
3. South Korea’s job growth has been slowing.
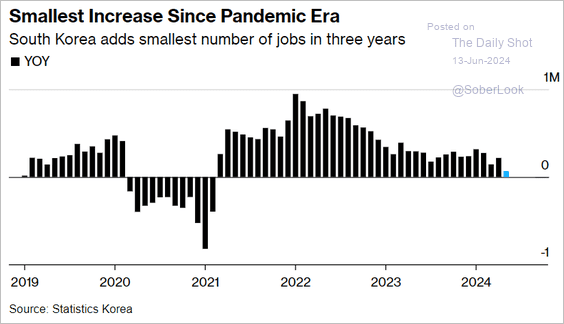 Source: @economics Read full article
• Inflation continues to cool.
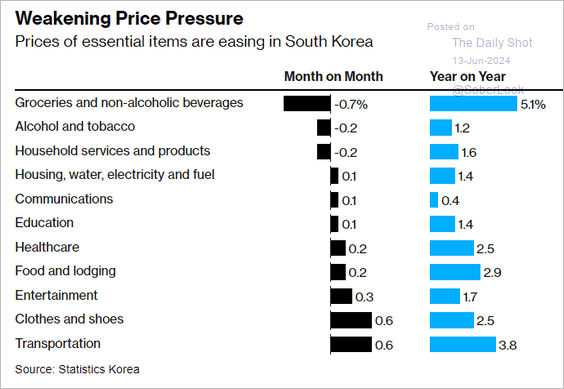 Source: @economics Read full article
——————–
4. New Zealand’s retail card spending has been rolling over.

5. Next, we have some updates on Australia.
• The labor market remains strong, with healthy job gains reported in May.

 Source: Reuters Read full article
– The unemployment rate edged lower.
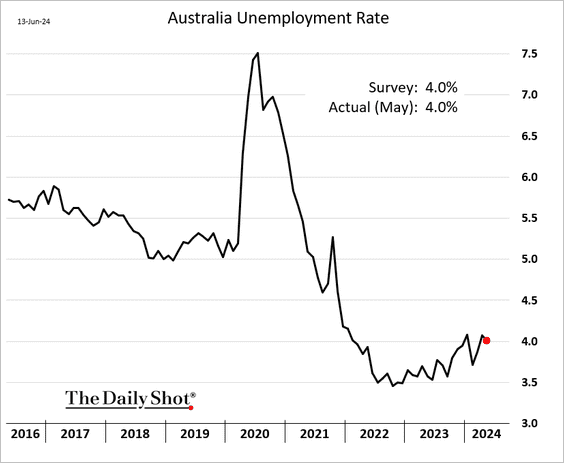
– The participation rate held steady.

• Australia’s household spending showed improvement in May.

Back to Index
China
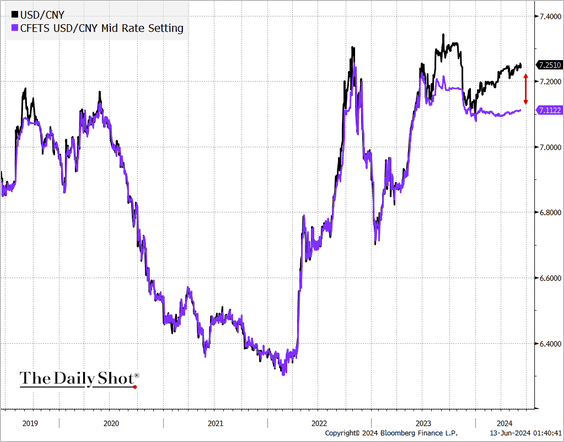
1. The renminbi continues to trade weaker than the PBoC’s midpoint setting.
2. Credit issues among China’s housing developers persist.
 Source: @markets Read full article

Back to Index
Emerging Markets
1. The Mexican peso has been facing downward pressure.
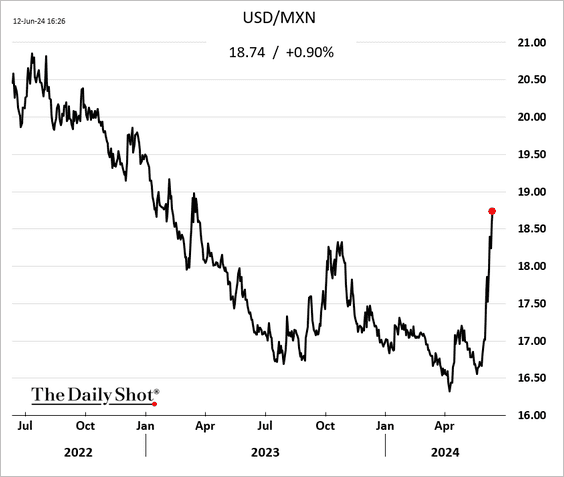
 Source: @markets Read full article
 Source: @markets Read full article
——————–
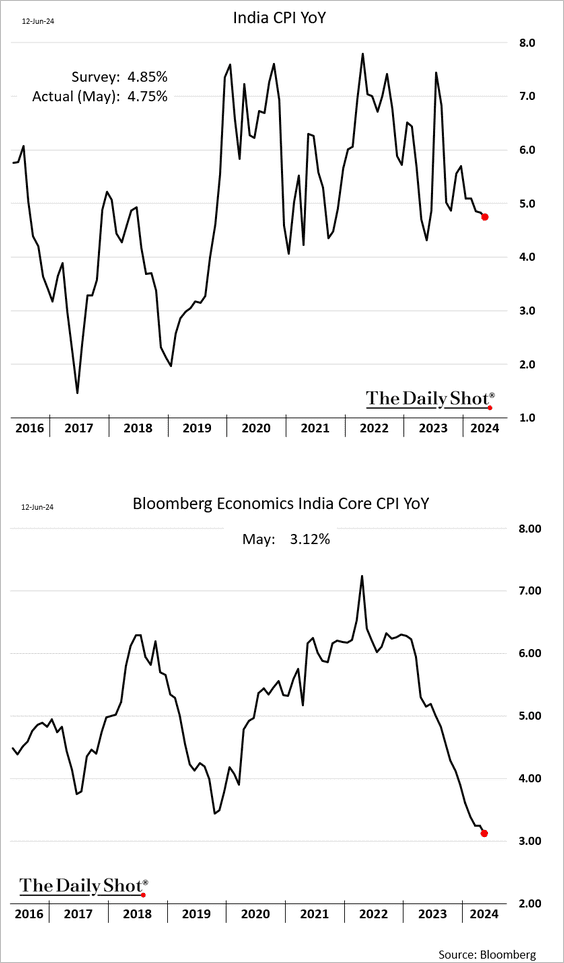
2. India’s inflation continues to moderate.
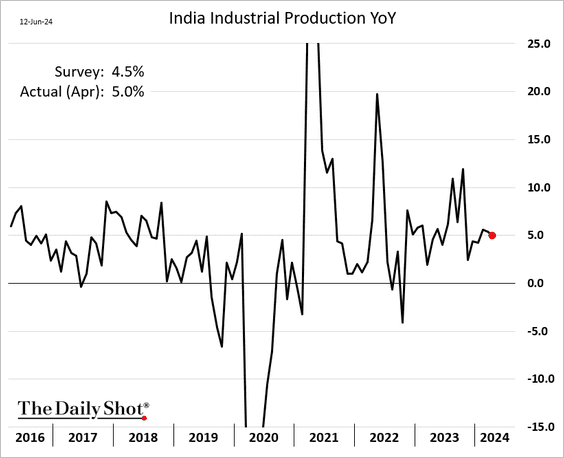
• Growth in India’s industrial production remains robust.
——————–
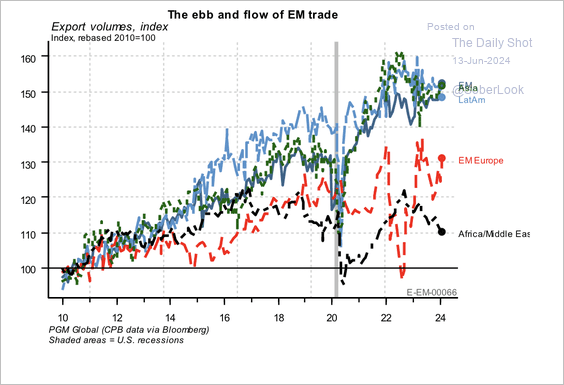
3. EM export volumes vary by region.
 Source: PGM Global
Back to Index
Energy
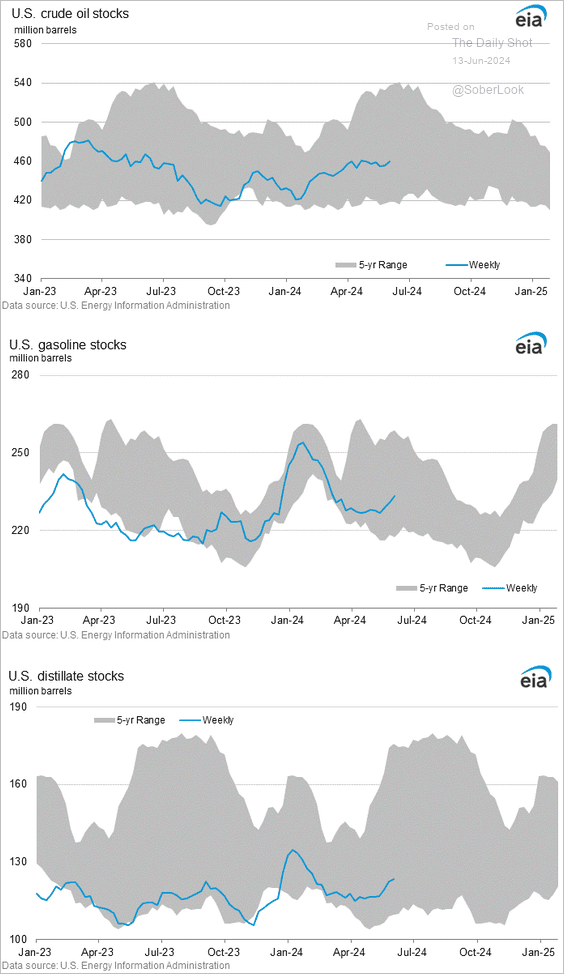
• US crude oil inventories unexpectedly increased again last week as net imports jumped. Refined product stockpiles were higher as well (2 charts).


 Source: Reuters Read full article
– Here are the inventory levels.
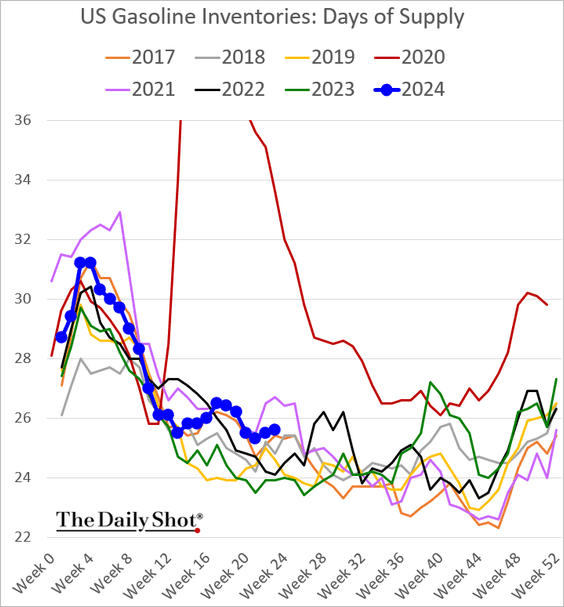
This chart shows gasoline inventories measured in days of supply.
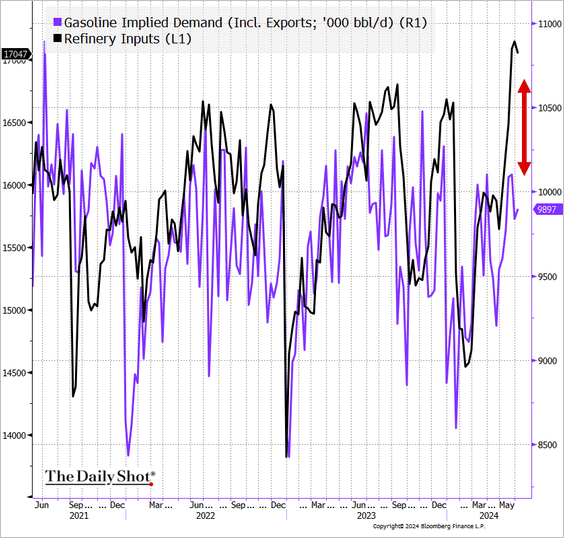
• US refinery activity remains elevated, …

… outpacing gasoline demand.
 Source: @TheTerminal, Bloomberg Finance L.P.
Back to Index
Equities
1. Even with the record-setting rally in key indices, market breadth remains relatively weak
• Percent of S&P 500 members above their 50-day moving average:
 Source: @TheTerminal, Bloomberg Finance L.P.
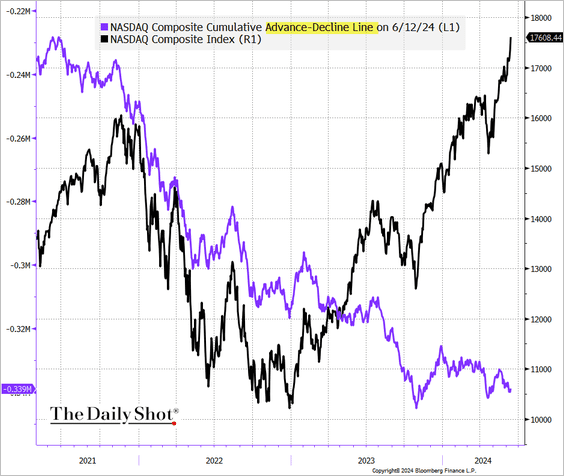
• The Nasdaq advance-decline line:
 Source: @TheTerminal, Bloomberg Finance L.P.
——————–
2. The S&P 500 equal-weight index is at the lowest level relative to the S&P 500 since the GFC.

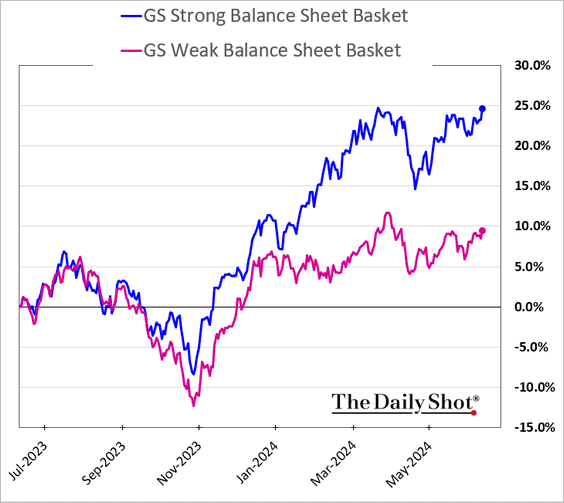
3. Leveraged companies continue to lag.
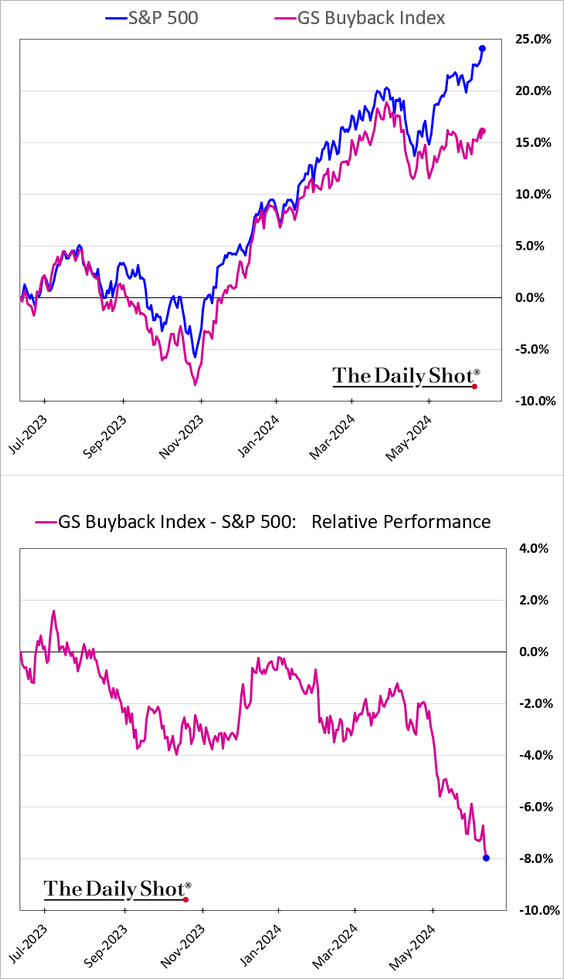
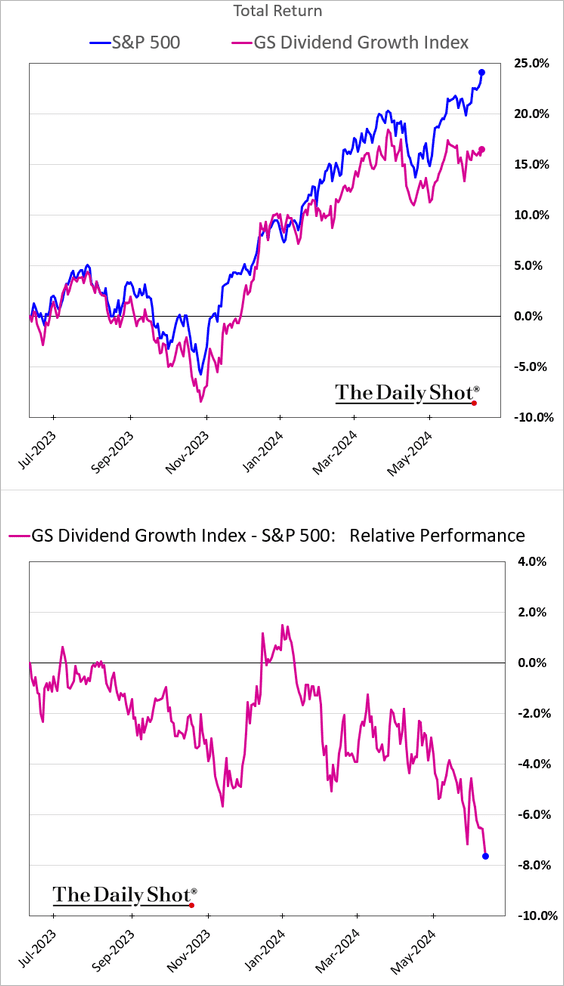
4. Companies known for share buybacks and dividend growth have been underperforming the S&P 500.
——————–
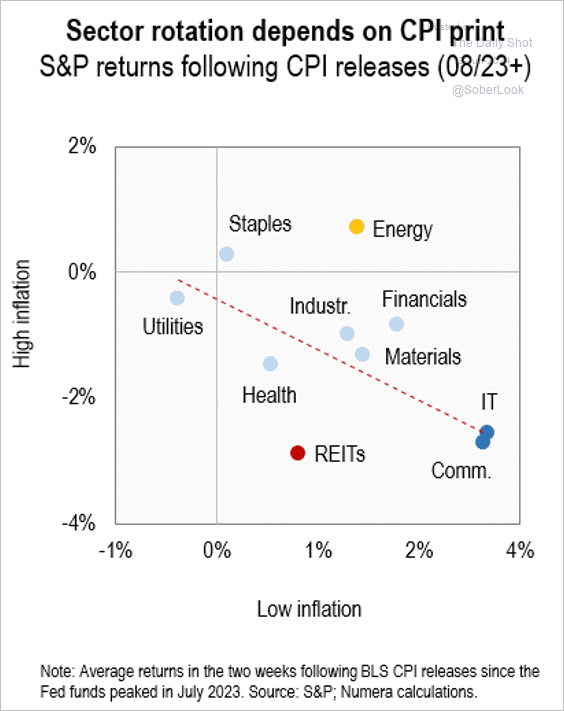
5. This scatterplot shows average returns by S&P 500 sectors in the two weeks following the CPI release.
 Source: Numera Analytics (@NumeraAnalytics)
6. Here is a look at the S&P 500 broad sector composition over time.
 Source: BofA Global Research; @AyeshaTariq
7. Regression analysis suggests that macro hedge funds are long stocks vs. bonds.
 Source: Simon White, Bloomberg Markets Live Blog
8. The S&P 500 volatility skew shows increased risk appetite.
 Source: @TheTerminal, Bloomberg Finance L.P.
Back to Index
Credit
Here are some updates on commercial real estate.
• Debt maturity wall:
 Source: Torsten Slok, Apollo
• Distressed properties:
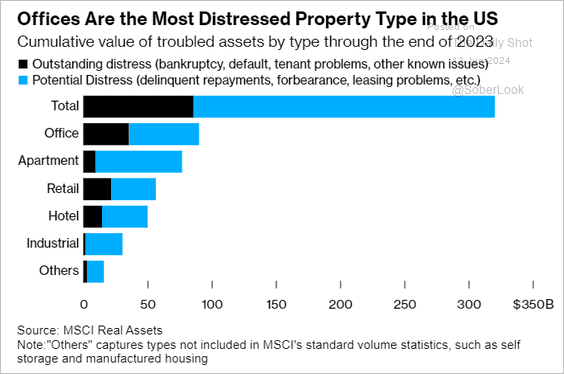 Source: @wealth Read full article
• Multi-family property prices:
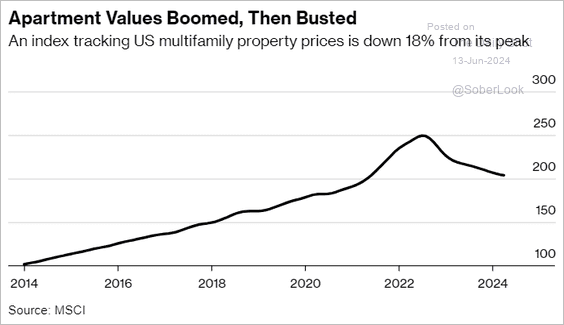 Source: @wealth Read full article
• Banks’ exposure to property loans:
 Source: @wealth Read full article
 Source: @markets Read full article
Back to Index
Global Developments
1. Here is a look at fund flows by asset class:
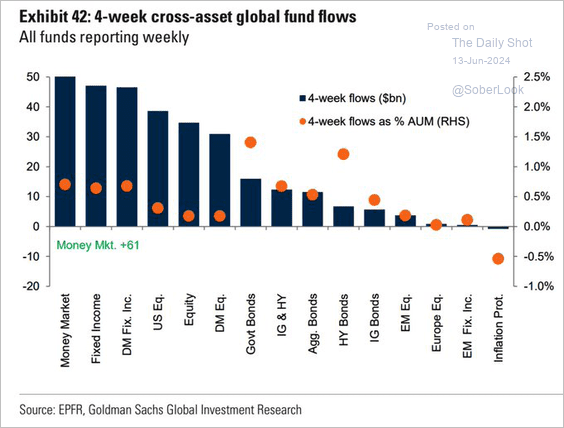 Source: Goldman Sachs; @WallStJesus
2. Equities have outperformed other major assets over the past 50 years, while commodities have struggled to compete with income-producing financial assets over the long term.
 Source: Deutsche Bank Research
3. Finally, we have the composition of global international reserves from 1900 to 2022.
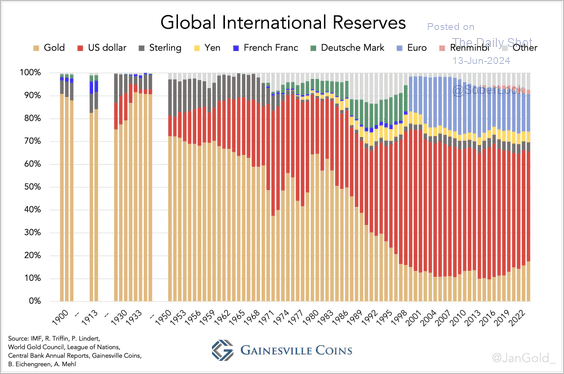 Source: Gainesville Coins
——————–
Food for Thought
1. Homeownership rate changes by state since 2014:
 Source: Agent Advice
2. Fertility rates in select countries:
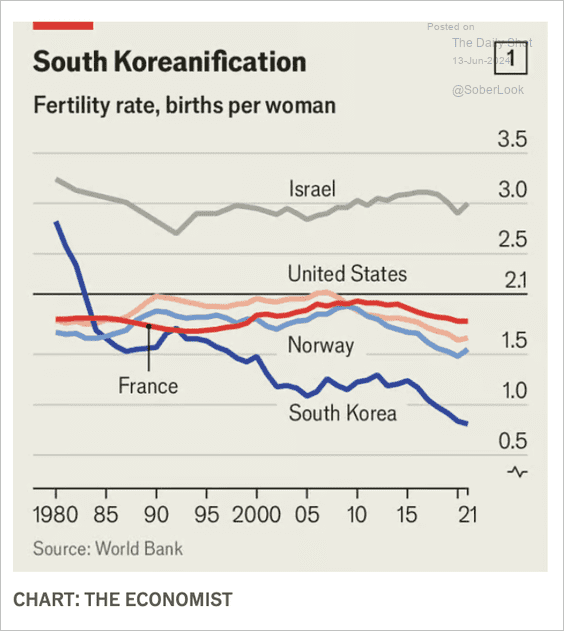 Source: The Economist Read full article
3. Russia’s goods trade:
 Source: The Economist Read full article
4. Xi Jinping’s meetings with foreign leaders:
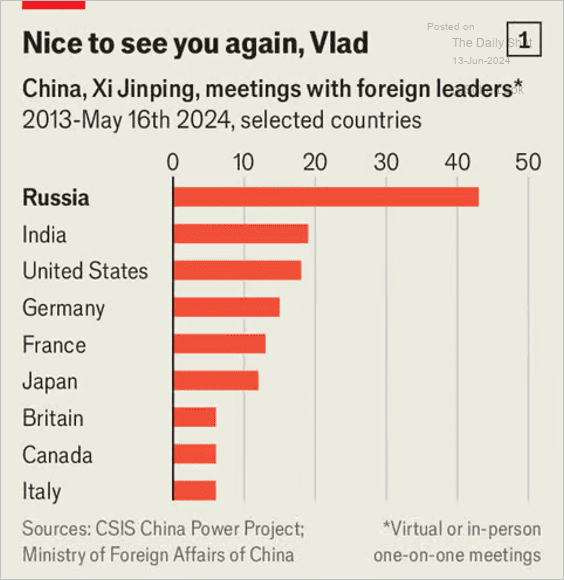 Source: The Economist Read full article
5. Demographic trends across swing states:
 Source: @bbgvisualdata Read full article
6. Working pensioners by state:
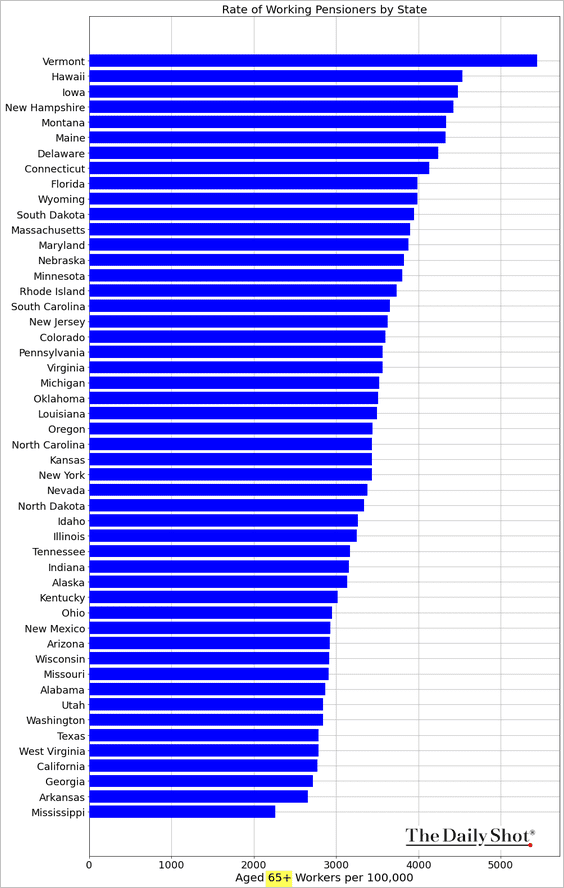 Source: QR Code Generator
7. Market share of US carbonated drinks:
 Source: @WSJ Read full article
——————–
Back to Index