
The Daily Shot: 10-May-24
• The United States
• The United Kingdom
• Asia-Pacific
• China
• Emerging Markets
• Commodities
• Energy
• Equities
• Credit
• Rates
• Food for Thought
The United States
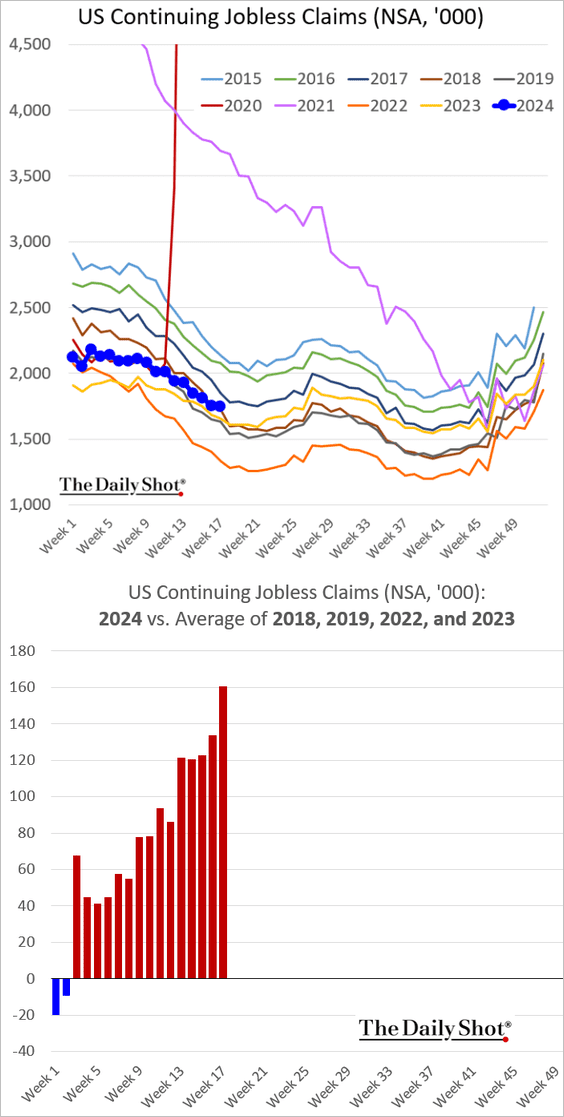
1. Initial jobless claims jumped last week, sparking concerns over potential weaknesses in the labor market.

A substantial portion of the increase originated from New York State. New York City public schools had their recess last week. During winter and spring breaks, public school employees, including bus drivers, can file for benefits, often increasing weekly claims.
 Source: Goldman Sachs; @MikeZaccardi
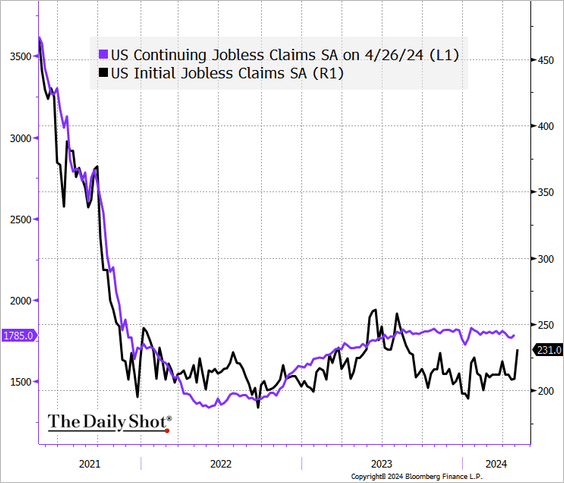
• Continuing claims have been trending higher relative to recent years.
• This chart shows the seasonally adjusted trends.
 Source: @TheTerminal, Bloomberg Finance L.P.
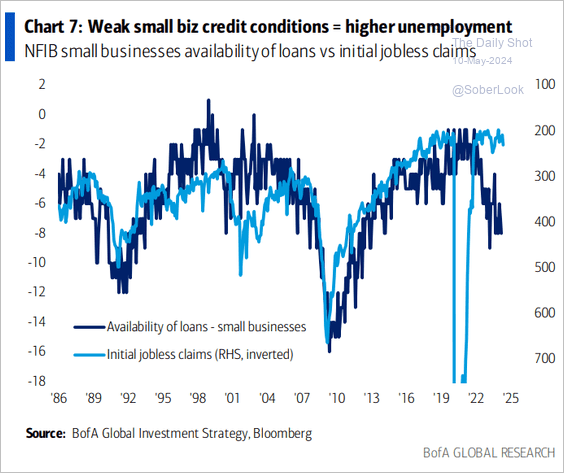
• Tighter credit conditions for small US firms point to upside risks for unemployment claims.
 Source: BofA Global Research
——————–
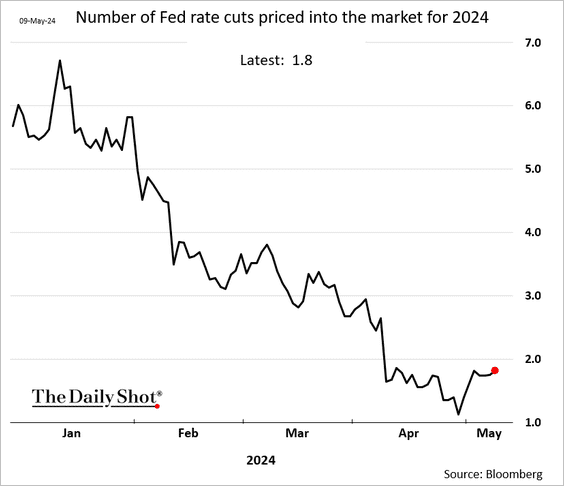
2. The probability of two Fed rate cuts this year increased in response to softer labor market data (above).
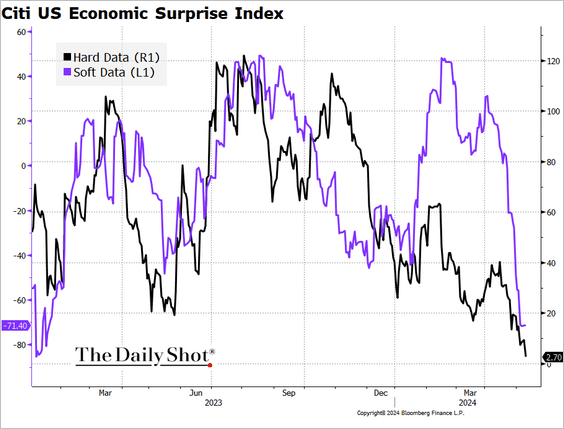
3. The jobless claims report pushed the Citi Economic Surprise Index deeper into negative territory, …
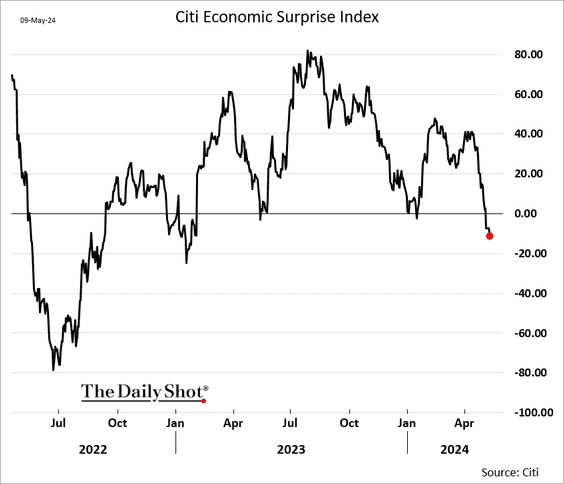
… driven by hard data.
 Source: @TheTerminal, Bloomberg Finance L.P.
——————–
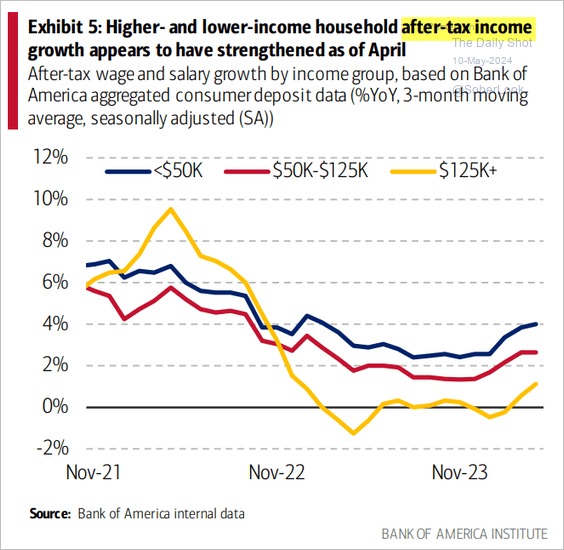
4. BofA’s card data point to a bounce in household spending last month, …
 Source: Bank of America Institute
… boosted by stronger income growth …
 Source: Bank of America Institute
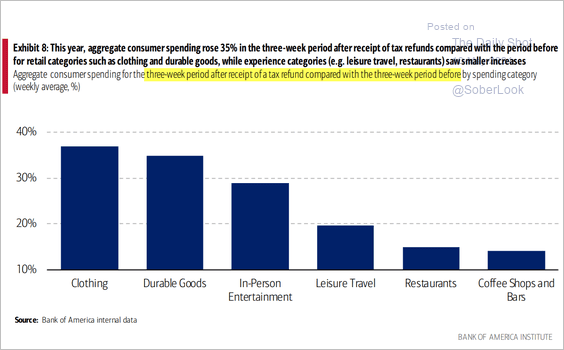
… and tax refunds. This chart shows post-tax-refund changes in consumer spending by category.
 Source: Bank of America Institute
• Households are also using tax refunds to pay down debt.
 Source: Bank of America Institute
——————–
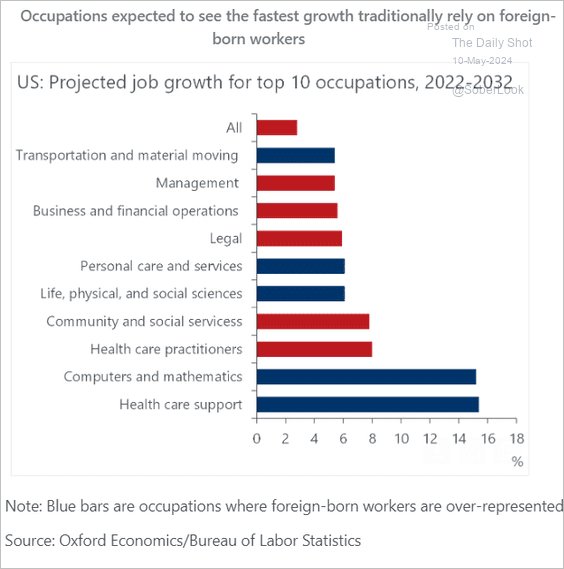
5. Occupations that are expected to see the fastest growth have often relied on foreign-born workers.
 Source: Oxford Economics
Back to Index
The United Kingdom
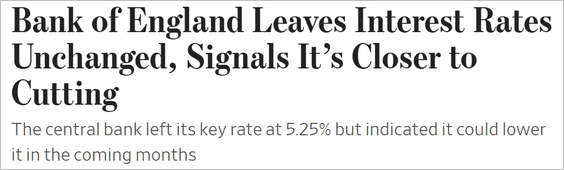
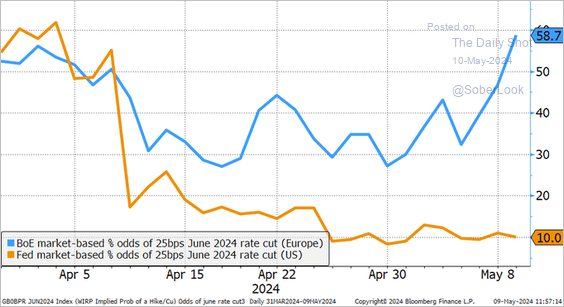
1. The Bank of England appears to be nearing a rate cut, possibly as early as next month.
 Source: @WSJ Read full article
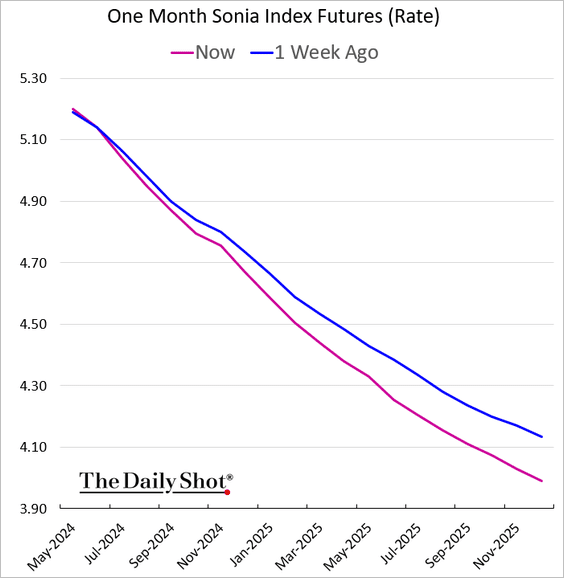
• Here is what’s priced into the market now vs. at the end of April.
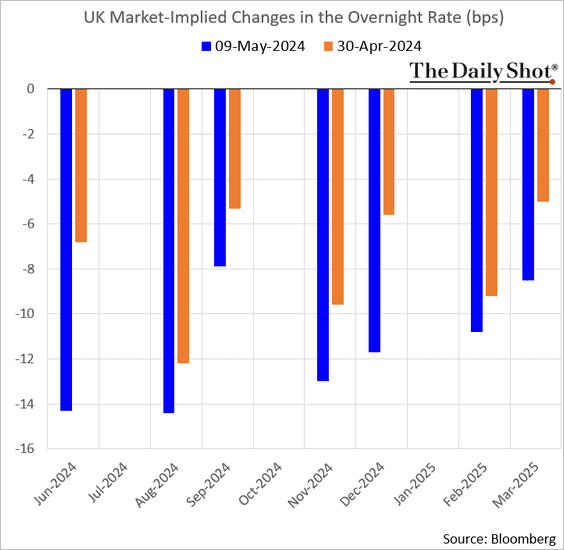
– The expected BoE rate trajectory has shifted lower.
– The market sees the BoE’s policy diverging from the Fed’s.
 Source: @JeffreyKleintop
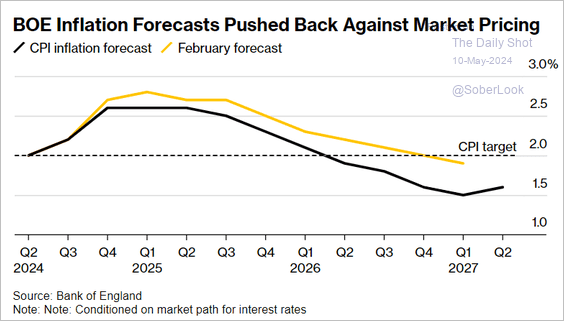
• The BoE lowered its inflation forecasts, signaling a dovish stance.
 Source: @economics Read full article
– The central bank also boosted its projections for economic growth.
 Source: @economics Read full article
——————–
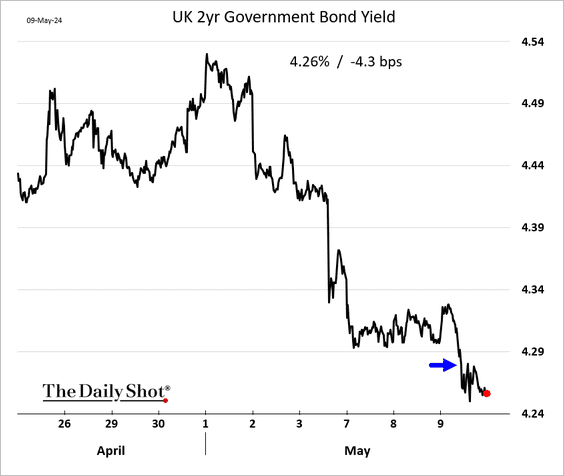
2. Gilt yields declined.
3. Speculative accounts are betting on a weaker pound in anticipation of the Bank of England’s impending rate cuts.

4. The Q4 GDP growth topped expectations as the UK recovers from recession. We will have more on the GDP report next week.

Back to Index
Asia-Pacific
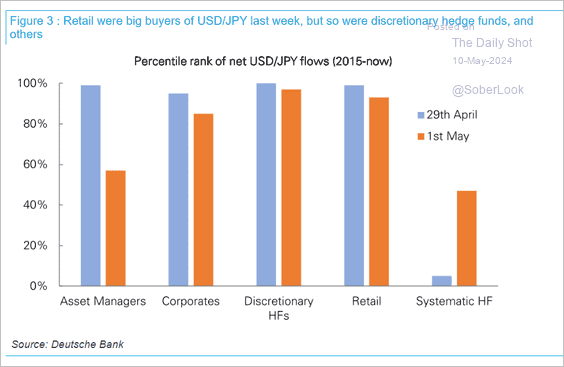
1. Retail traders and hedge funds were big buyers of USD/JPY last week.
 Source: Deutsche Bank Research
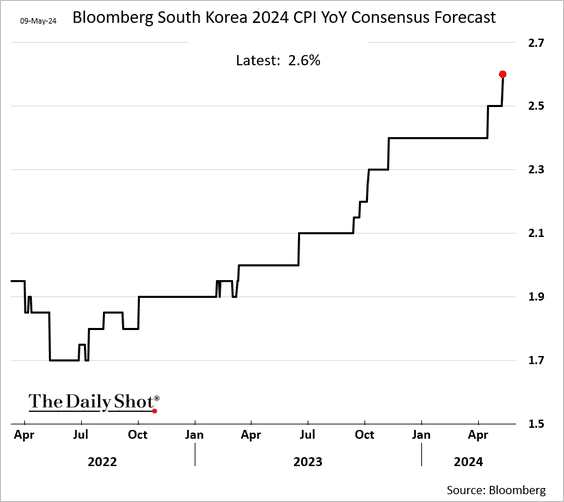
2. Economists boosted their estimates for South Korea’s GDP growth this year.
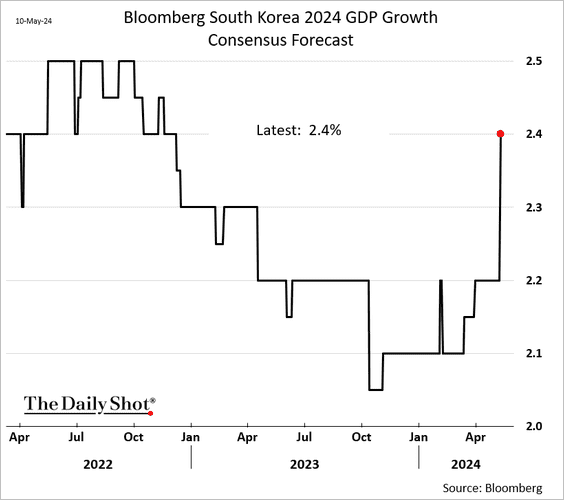
Forecasts also show faster inflation in 2024.
Back to Index
China
1. Equities continue to climb, with Hong Kong-listed shares outperforming mainland stocks.
 Source: @TheTerminal, Bloomberg Finance L.P.
• Stock prices have diverged from forward earnings.
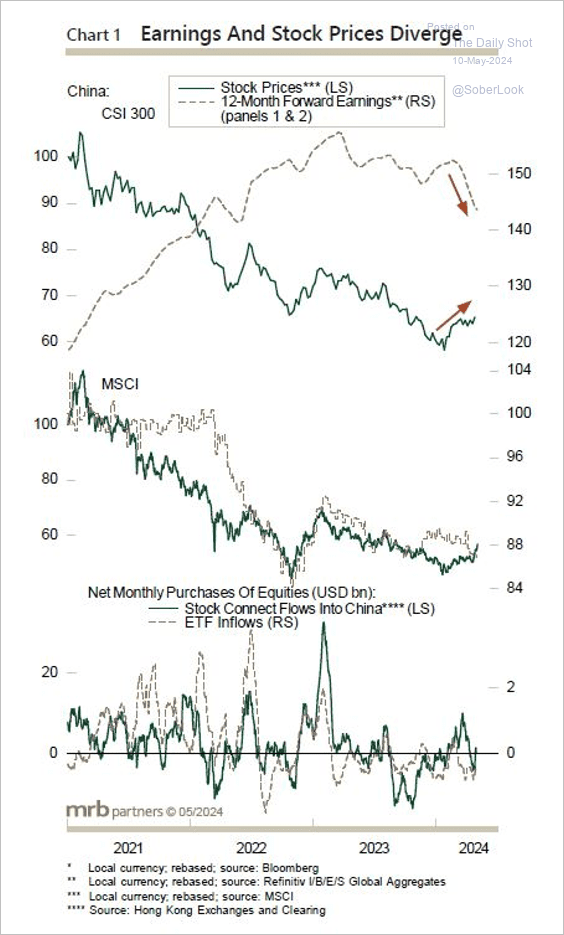 Source: MRB Partners
——————–
2. Here is a look at China’s equity and bond markets’ performance relative to the US.
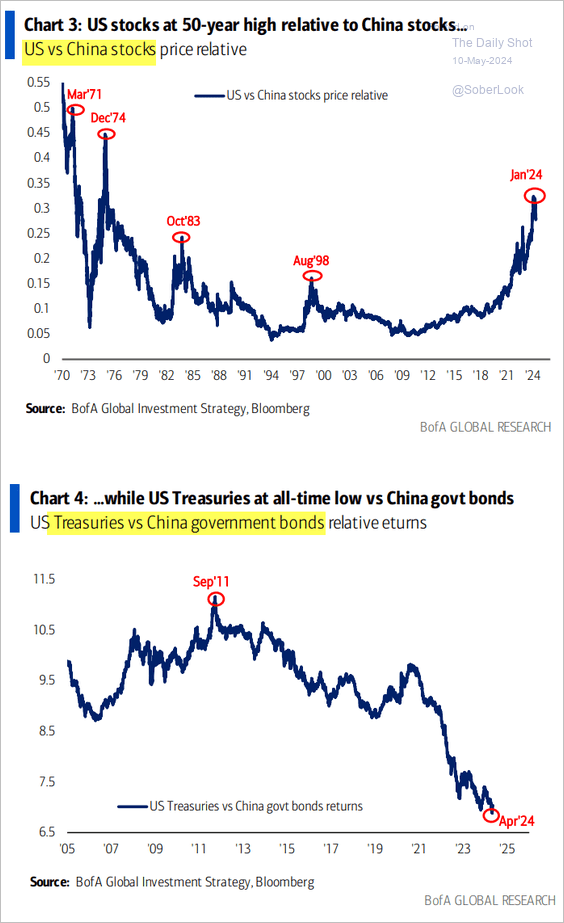 Source: BofA Global Research
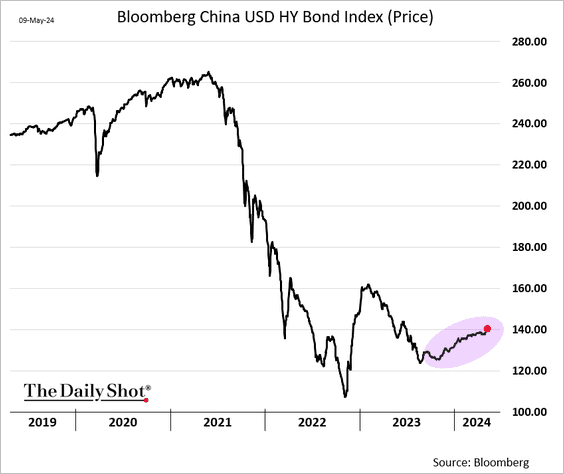
3. USD-denominated high-yield bonds have been gaining some ground.
4. Fixed investment is rising in the power and electricity sector while manufacturing and construction remain weak.
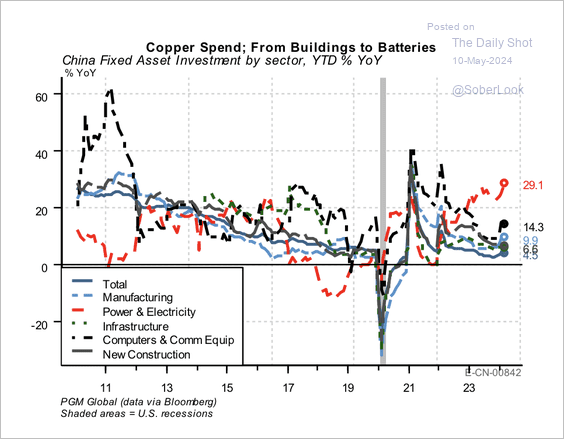 Source: PGM Global
Back to Index
Emerging Markets
1. Mexico’s headline inflation increased last month, but the core CPI continues to ease.

 Source: MarketWatch Read full article
Banxico left rates unchanged, …
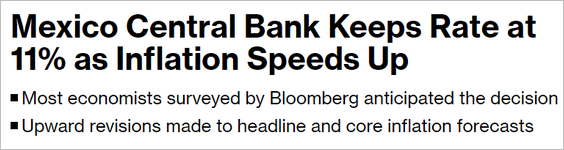 Source: @economics Read full article
… sending the peso higher (chart shows the US dollar declining against the peso).

——————–
2. South Africa’s factory output deteriorated in March.

3. The Zambian kwacha hit a record low as severe drought crushes the nation’s economic growth.
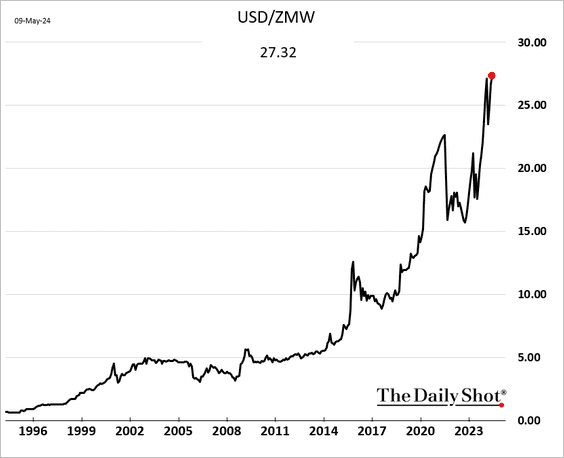
 Source: @economics Read full article
Back to Index
Commodities
1. Gold is surging again.

• Until recently, gold mining stocks have lagged the spot gold price rally partly because their all-in sustaining production costs (AISC) have risen over the past decade.
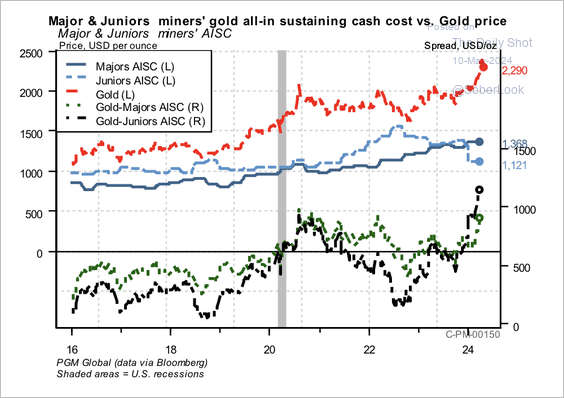 Source: PGM Global
– Gold production is expected to decline over the year for the Big Three.
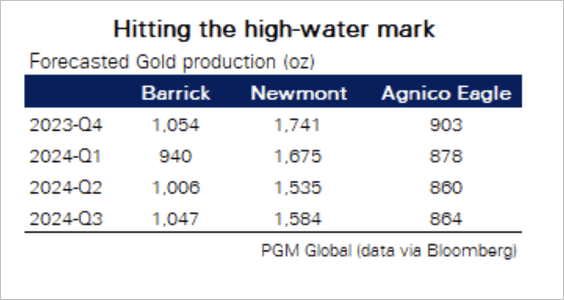 Source: PGM Global
• This chart shows how major geopolitical events have impacted gold prices.
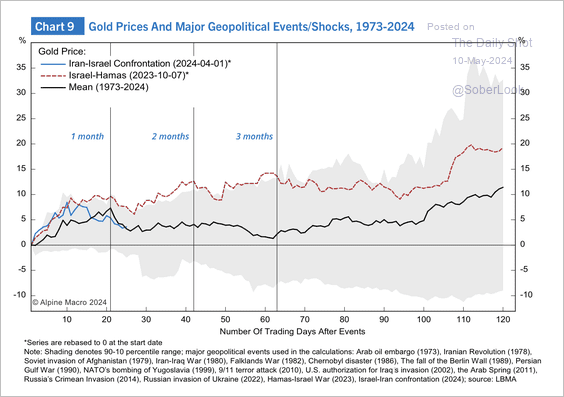 Source: PGM Global
——————–
2. The copper price rally occurred alongside improving economic sentiment in developed markets.
 Source: Numera Analytics (@NumeraAnalytics)
Back to Index
Energy
1. Growing deliveries of US oil are driving down the price of physical crude in Europe.
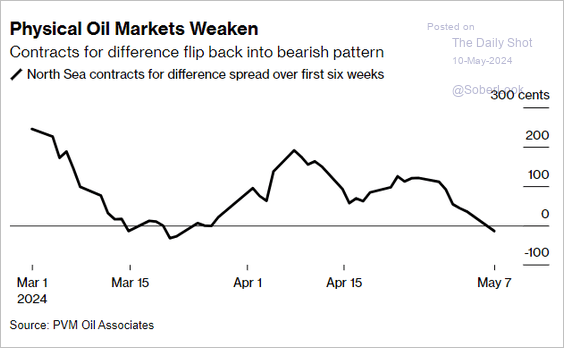 Source: @markets Read full article
2. Mexico’s government is considering absorbing $40 billion of Pemex debt.
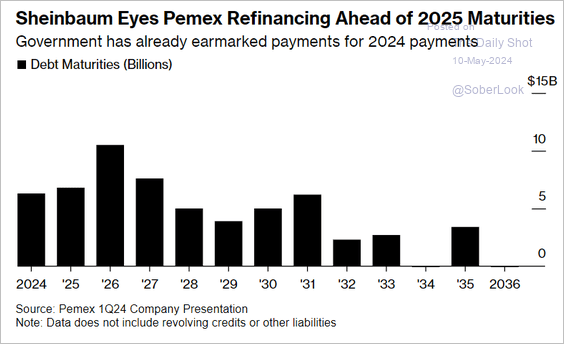 Source: @markets Read full article
• Pemex is highly indebted and not very profitable.
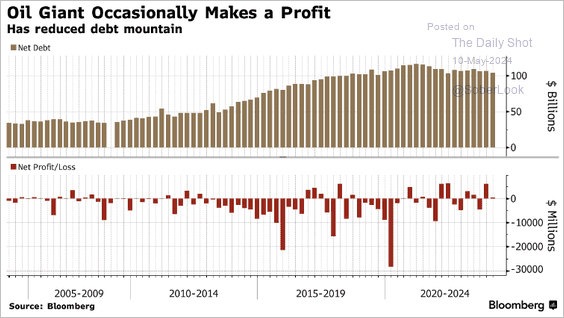 Source: @Sebaboyd, @business
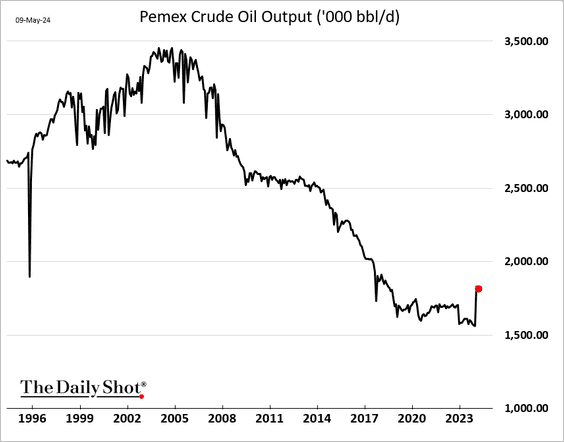
• The company’s oil output has stabilized at low levels.
——————–
3. This chart shows how conflicts impacting the Persian Gulf have impacted the oil price.
 Source: Alpine Macro
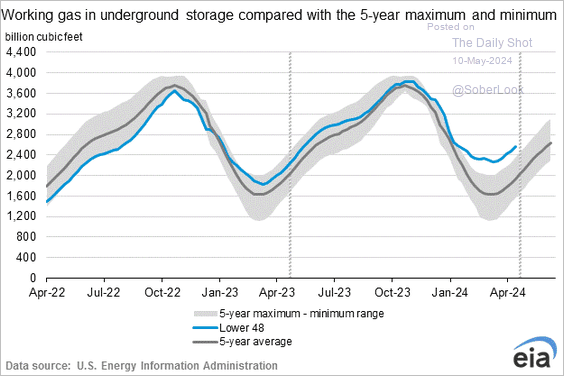
4. US natural gas is rebounding amid robust demand from LNG producers …
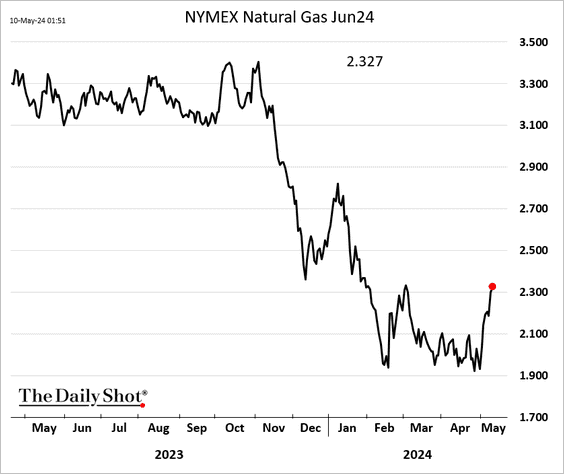
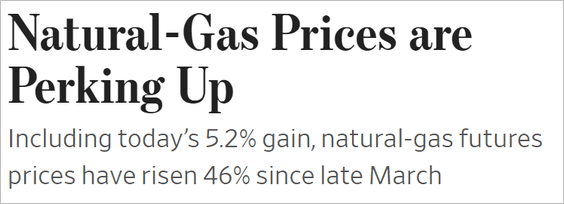 Source: @WSJ Read full article
… and slower increases in inventories.

——————–
5. BofA’s private clients are in love with high-dividend pipeline companies (MLPs).
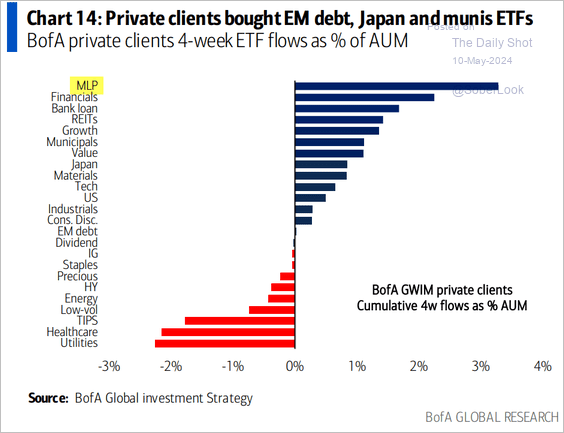 Source: BofA Global Research
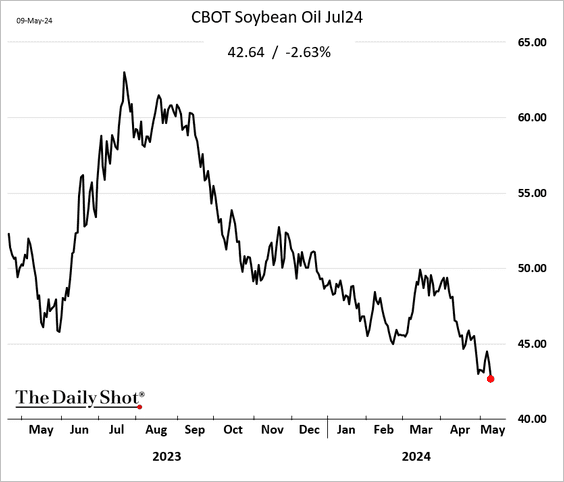
6. US biomass-based diesel feedstock imports have surged …
 Source: @SmplTrd77, @SusanNOBULL, @Barchart Read full article
… creating competition for soybean oil.
Back to Index
Equities
1. The Dow has been up for seven consecutive trading sessions.

2. SPY, the most liquid US equity security, is becoming less liquid.
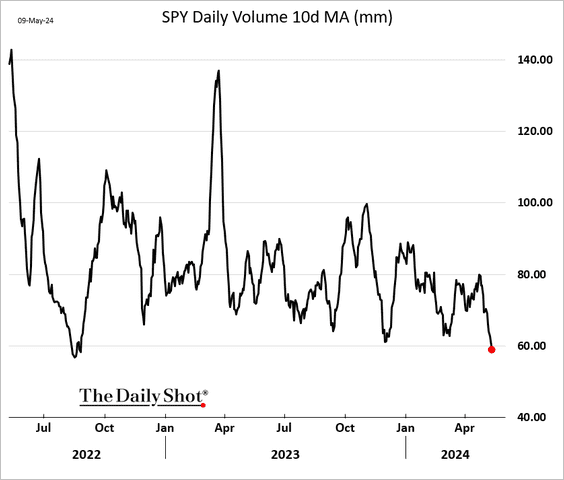
And so is QQQ, the second most liquid US equity security.

——————–
3. The pandemic winners have struggled since the end of 2020.
 Source: @financialtimes Read full article
4. “Organic growth” (earnings and dividend return) explains the average stock gains since 2010.
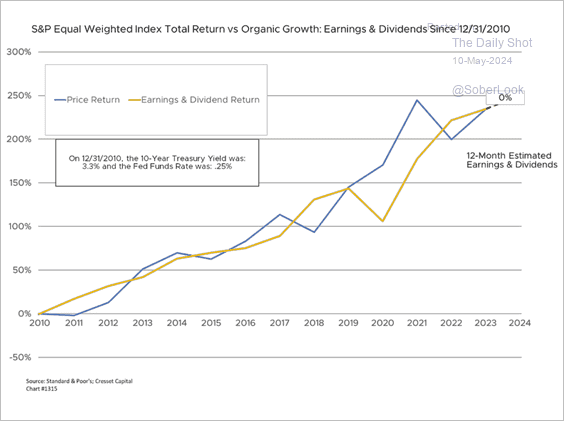 Source: Jack Ablin, Cresset Wealth Advisors
5. The market has been harsh on companies that missed Q1 earnings estimates, while offering limited rewards to those that exceeded expectations. The chart below illustrates the relative performance for earnings beats and misses.
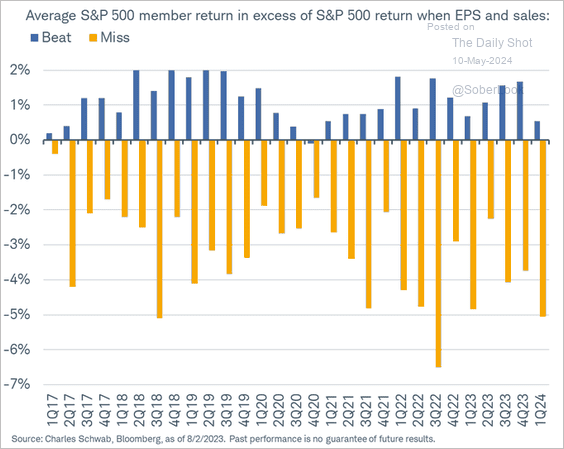 Source: @KevRGordon
6. It’s been nearly 300 days since the Fed’s last rate hike.

How does the market perform during the Fed’s pauses?
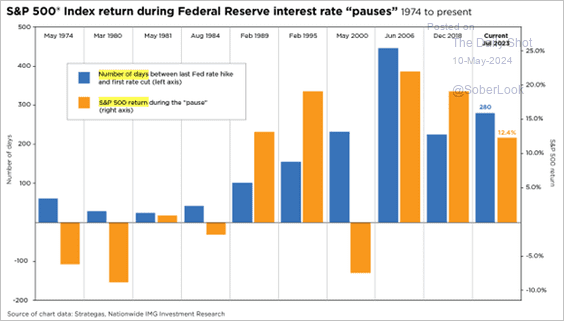 Source: Nationwide Read full article
——————–
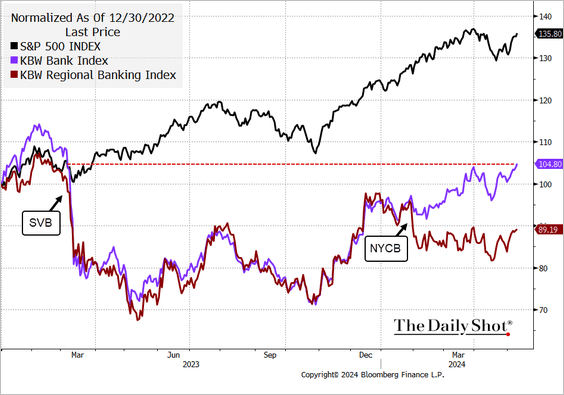
7. On average, bank shares have recouped most of their losses since the SVB collapse. However, regional banks have not seen much of a recovery.
 Source: @TheTerminal, Bloomberg Finance L.P.
8. The S&P 500 3-month implied volatility indicator hit the lowest level since January as the market brushes off potential risks.

• Similarly, the skew index on SPY (SkewDex) is falling rapidly.

Back to Index
Credit
1. Flows into corporate credit funds remain robust.
• Investment-grade bonds:
 Source: BofA Global Research
• Leveraged loans (2 charts):
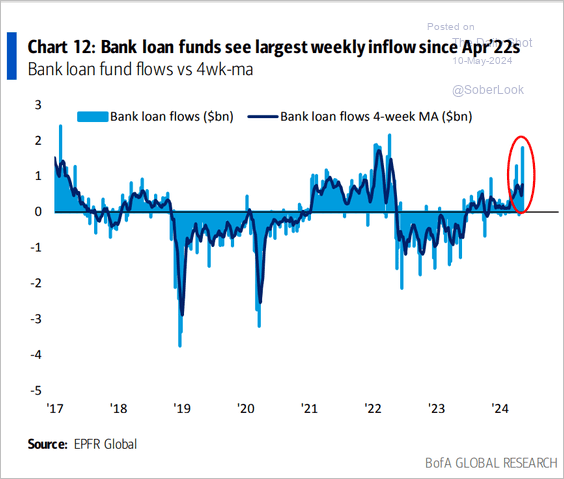 Source: BofA Global Research
 Source: BofA Global Research
——————–
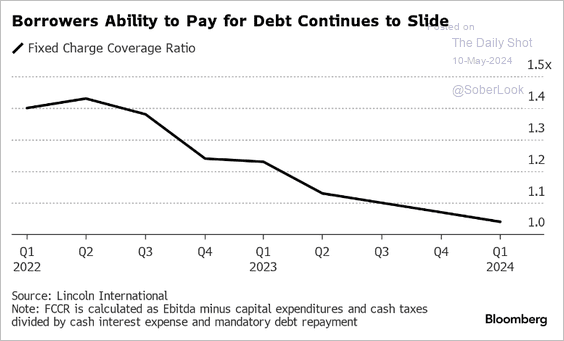
2. Private credit fixed charge coverage ratios have been trending lower.
 Source: @markets Read full article
3. Dividend recaps have gained momentum …
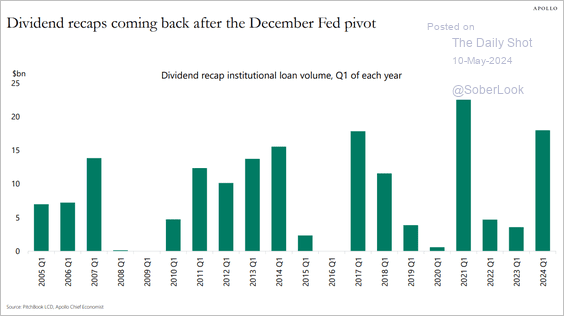 Source: Torsten Slok, Apollo
… as private equity firms struggle to engineer exits.
 Source: @markets Read full article
Back to Index
Rates
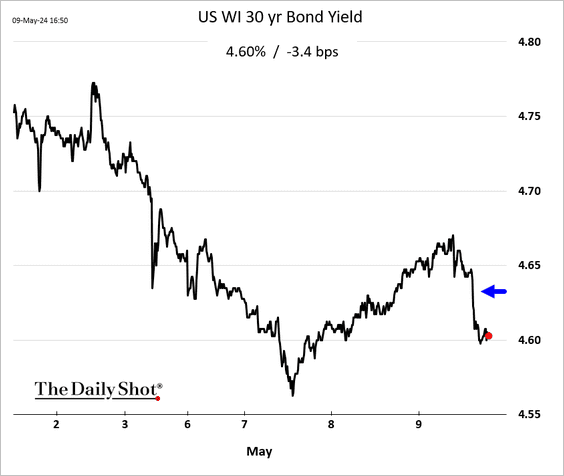
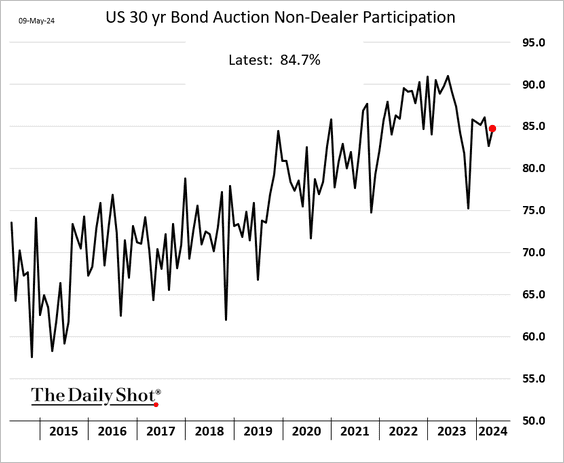
1. The 30-year bond auction performed surprisingly well, despite concerns about the market being flooded with Treasury debt.
 Source: @TheTerminal, Bloomberg Finance L.P.
• When-issued yield:
• Non-dealer participation:
• Bid-to-cover ratio:

——————–
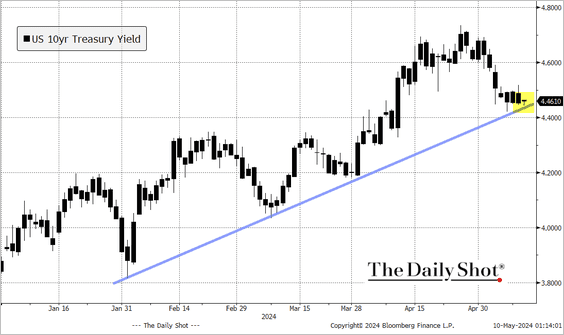
2. The 10-year Treasury yield is testing the uptrend support.
——————–
Food for Thought
1. Robots in manufacturing:
 Source: The Economist Read full article
2. Promotions at professional services firms:
 Source: @financialtimes Read full article
3. Regional and state tax revenue as a share of the total:
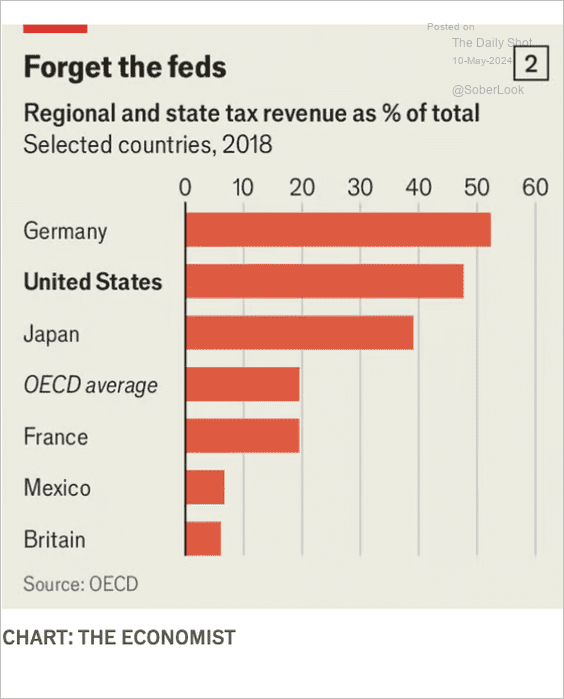 Source: The Economist Read full article
4. Comparison of population median age and legislators’ average age by country:
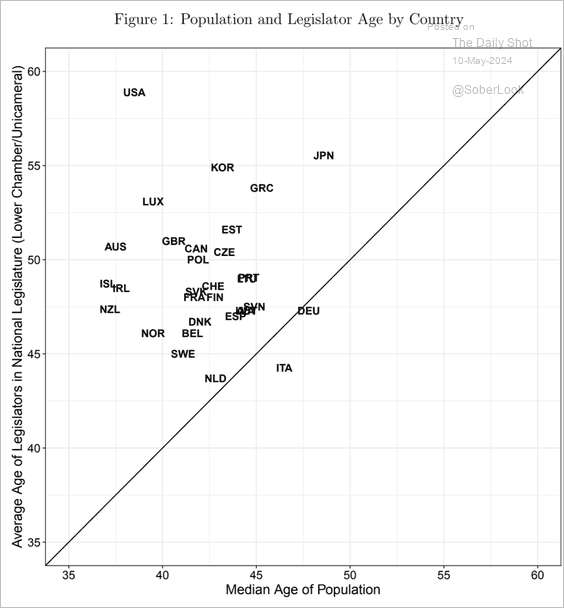 Source: Adam Bonica and Jacob Grumbach, Stanford University
5. Employment trends among native and foreign-born populations in the US:
 Source: @bbgequality Read full article
6. Assisted reproductive technology utilization:
 Source: @axios Read full article
7. Vegetables highest in protein:
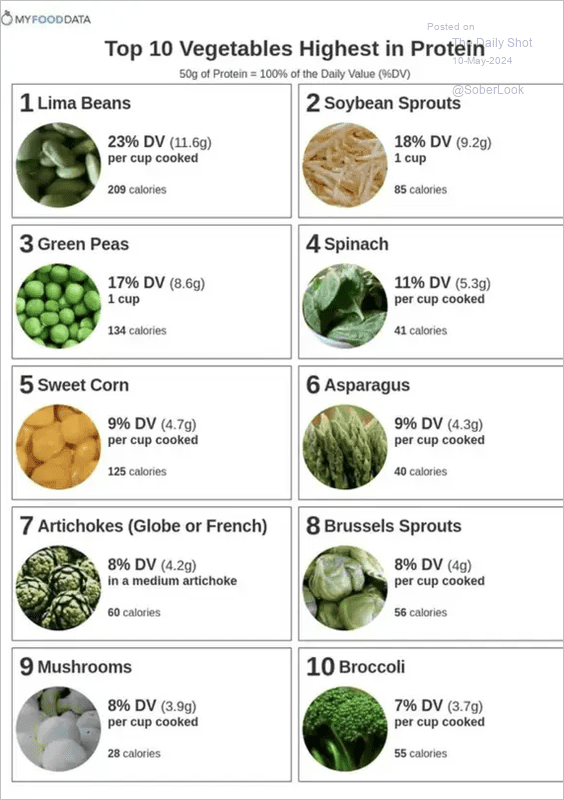 Source: BuzzFeed
——————–
Have a great weekend!
Back to Index