
The Daily Shot: 02-May-24
• The United States
• Canada
• The Eurozone
• Japan
• Asia-Pacific
• China
• Emerging Markets
• Cryptocurrency
• Commodities
• Energy
• Equities
• Credit
• Rates
• Food for Thought
The United States
1. While the FOMC expressed concerns about the “lack of further progress” on inflation, the US central bank did not “pivot” toward rate hikes. In addition, the Fed’s QT taper announcement (cap dropped “from $60 billion to $25 billion”) was a bit more aggressive than projected (the market expected $30 billion).

• Moreover, Powell indicated that the Fed sees the tight monetary policy dampening demand for labor.
Jerome Powell: – I do think that the evidence shows pretty clearly that policy is restrictive and is weighing on demand. And there are a few places I would point to for that. You could start with the labor market. So, demand is still strong. The demand side of the labor market, in particular. But it’s cool from its extremely high level of a couple of years ago. You see that in job openings. You see more evidence of that today in the Jols Report as you know.
• Bloomberg’s FOMC sentiment indicator moved back into dovish territory.
 Source: @TheTerminal, Bloomberg Finance L.P.
• Nomura still expects two rate cuts this year.
 Source: Nomura Securities
——————–
2. Markets breathed a sigh of relief following the Fed’s less-hawkish-than-expected policy stance.
• Treasury yields and the dollar declined.


Here is the trade-weighted US dollar index.

• Stocks jumped initially but quickly reversed gains to close lower.

——————–
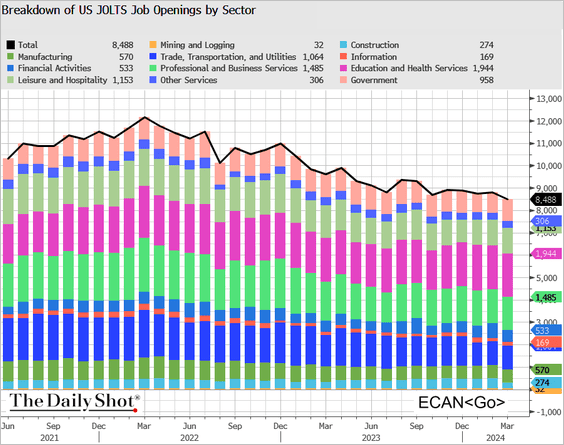
3. Job openings declined sharply in March, indicating that labor market imbalances are continuing to ease. Per Powell’s comments (above), this suggests that the Fed’s tight monetary policy is reducing demand (2 charts).

 Source: @TheTerminal, Bloomberg Finance L.P.
 Source: MarketWatch Read full article
• The ratio of job openings per unemployed person is still above pre-COVID levels.
 Source: Oxford Economics
• The construction sector saw a sharp reduction in job openings (2 charts).


– Job openings in retail are falling rapidly.

• The Beveridge curve also indicates that the labor market is nearing normalization.
 Source: @TheTerminal, Bloomberg Finance L.P.
• An even more important trend has been the ongoing decline in quits (voluntary resignations).

– Quits are highly correlated with wage growth (2 charts).
 Source: Oxford Economics
 Source: Longview Economics
– Layoffs remained low in March.

——————–
4. The April ADP report indicated robust job gains in the private sector.

• Here are the April changes by sector.

This chart shows the ADP Diffusion Index.

• Job growth in the Leisure & Hospitality and Healthcare sectors is holding up.

——————–
5. Vehicle sales edged higher in April.

Back to Index
Canada
1. Factory activity remains in contraction territory, with new orders declining (PMI < 50) for 14 months in a row.

2. The TSX materials sector has significantly outperformed its US peers over the past two months driven by the rally in gold and silver prices.
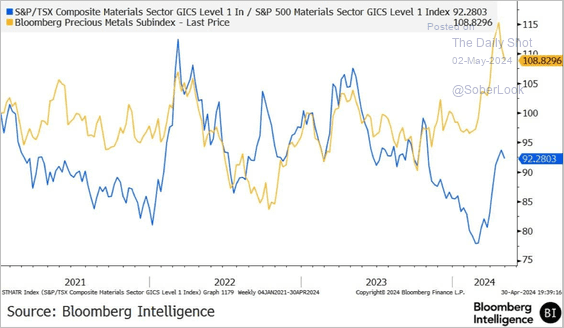 Source: @BBGIntelligence
Back to Index
The Eurozone
1. The Dutch manufacturing sector is back in growth territory.

2. Bank funding costs remain elevated amid the winding-down of TLTRO.
 Source: ECB
• Lending rates are starting to decline from their peak in October 2023. The cross-country dispersion of lending rates for firms and households remained at a low level, suggesting smooth monetary policy transmission across euro area countries, according to the ECB.
 Source: ECB
• Euro area banks expect rising demand for loans to households for home purchases and a moderate fall in demand for loans to firms in Q2. Banks have been reporting a net increase in the share of rejected loan applications across all segments, according to the ECB.
 Source: ECB
Back to Index
Japan
1. Dollar-yen volatility surged this week.


——————–
2. Japan’s consumer confidence unexpectedly declined in April.

Back to Index
Asia-Pacific
1. The April PMI from S&P Global showed Taiwan’s manufacturing sector returning to growth.
 Source: S&P Global PMI
On the other hand, South Korea’s PMI dipped below 50, signaling contraction.
 Source: S&P Global PMI
——————–
2. South Korea’s inflation continues to moderate.

3. Australian residential building approvals remain soft, with March figures significantly below the levels seen in 2023.

Back to Index
China
1. There has been speculation about China potentially devaluing the yuan, similar to what occurred in 2015.
 Source: @TheTerminal, Bloomberg Finance L.P.
However, such an outcome is highly unlikely. Aside from the market chaos and pressure on reserves that such a move would entail, the renminbi has already weakened on a real basis.
 Source: Capital Economics
——————–
2. China’s return on equity has steadily declined over the past decade and significantly lagged other markets during the post-pandemic period.
 Source: BCA Research
Back to Index
Emerging Markets
Let’s look at Asian manufacturing PMI trends through April.
• ASEAN (growth continues):
 Source: S&P Global PMI
• Indonesia (solid):
 Source: S&P Global PMI
• Thailand (struggling):
 Source: S&P Global PMI
• Malaysia:
 Source: S&P Global PMI
• The Philippines (acceleration):
 Source: S&P Global PMI
• Vietnam (modest growth):
 Source: S&P Global PMI
Back to Index
Cryptocurrency
1. Bitcoin is trading below $58k.
 Source: @TheTerminal, Bloomberg Finance L.P.
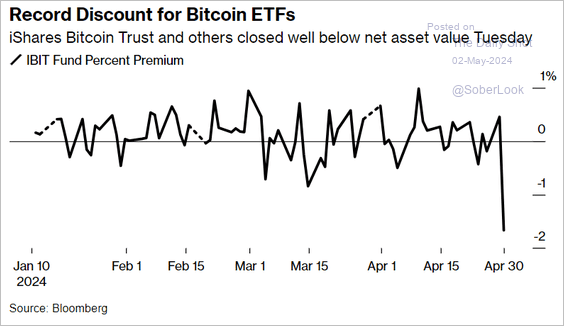
2. Was the SEC right about potential liquidity issues with crypto ETFs? IBIT has been trading at a substantial discount to NAV.
 Source: @crypto Read full article
Back to Index
Commodities
1. Industrial metals are outperforming the broader commodity index.
 Source: TS Lombard
2. China consumed more gold than India over the past two years.
 Source: TS Lombard
• Here is the distribution of global gold production.

——————–
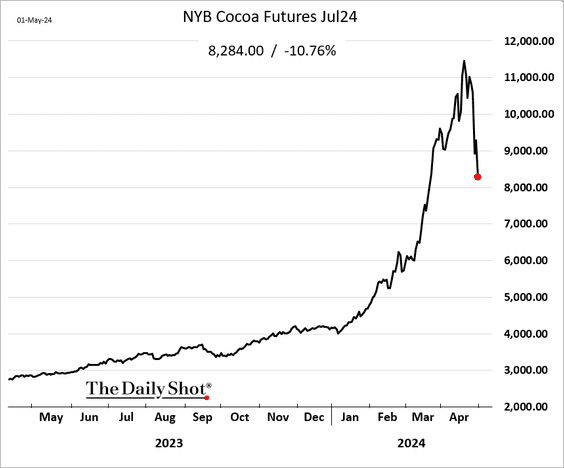
3. Cocoa futures tumbled another 11% on Wednesday.
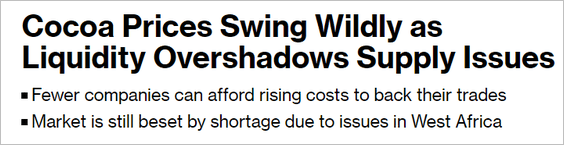 Source: @markets Read full article
Back to Index
Energy
1. US crude oil inventories unexpectedly jumped last week.
– Weekly changes:

– Levels:

Crude oil stockpiles crossed above the five-year average for the first time since July 2023.
 Source: TS Lombard
• Measured in days of supply, gasoline inventories hit the highest level since the COVID shock.

• US refinery utilization is at the lowest level since 2021.

——————–
2. Crude oil declined in response to the US inventory report.
 Source: @TheTerminal, Bloomberg Finance L.P.

 Source: CNBC Read full article
——————–
3. Uranium prices jumped on Wednesday.

 Source: Reuters Read full article
Back to Index
Equities
1. Elevated real rates pose a risk for equity valuations.
 Source: Hugo Ste-Marie, Portfolio & Quantitative Strategy Global Equity Research, Scotia Capital
2. During the recent selloff, the valuation of the average S&P 500 stock, as measured by the equal-weight index, dipped below the longer-term average. This scatterplot compares current valuations to the 10-year average.

3. The re-rating of P/E multiples has been the driving force behind the recent stock market rally.
 Source: BCA Research
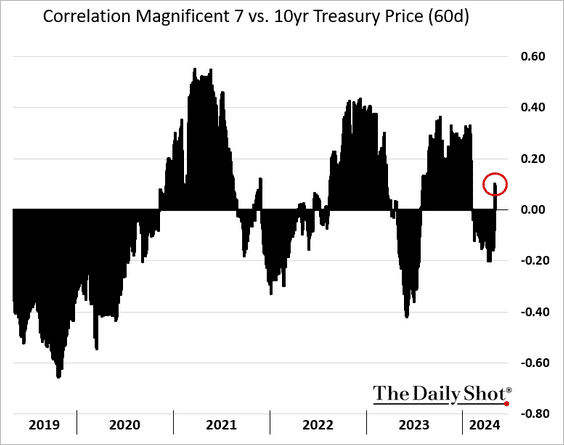
4. Treasury yields matter again for the Magnificent 7 stocks.
5. The momentum factor has been underperforming recently.

6. Trading activity at market close for the SP 500 stocks is becoming a larger share of the total market volume.
 Source: @markets Read full article
7. The next set of scatterplots displays forward earnings yields and implied volatility, illustrating expected performance versus perceived risk.
• Sectors:

• Equity factors/styles:

• International markets:

Back to Index
Credit
1. US corporate balance sheets have improved relative to peers.
 Source: BCA Research
2. The gap in financing costs between US small businesses and larger firms that can access the capital markets has been widening.
 Source: MUFG Securities
3. CLO managers have been purchasing stressed multifamily loans from their vehicles to avoid exceeding the distressed limit, which could result in their fees being cut off.
 Source: @markets Read full article
Back to Index
Rates
1. The 10-year Treasury note appears oversold.
 Source: Longview Economics
• The 10-year Treasury yield faced minor resistance at 4.7%, although support is nearby.

——————–
2. Much of the pressure on Treasuries has occurred during overnight trading sessions.
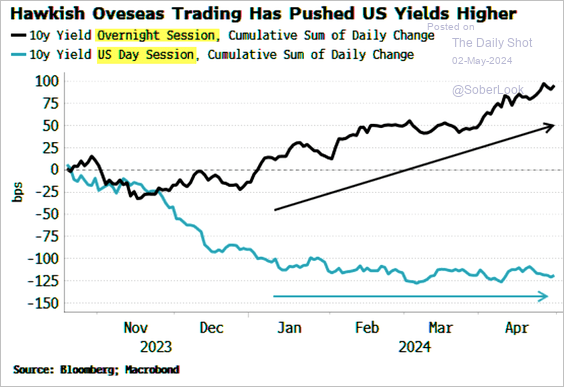 Source: Simon White, Bloomberg Markets Live Blog
3. This chart shows the evolution of Treasury debt maturity by holder.
 Source: Mizuho Securities USA
——————–
Food for Thought
1. Financial sector cyberattacks:
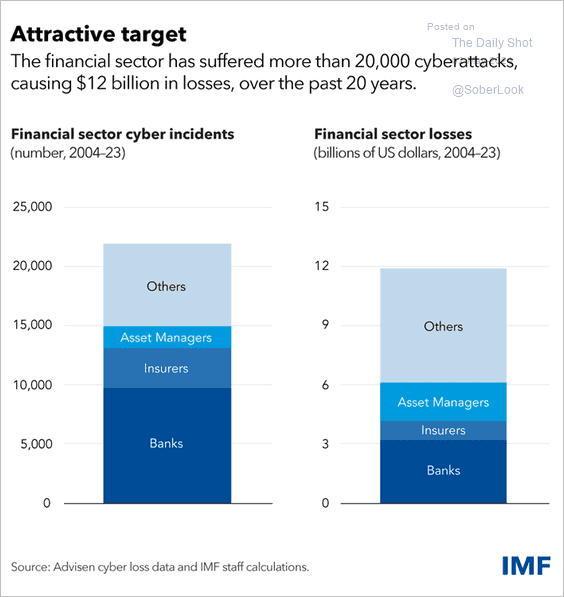 Source: IMF Read full article
2. US sales of EVs and hybrids:
 Source: @WSJ Read full article
3. Improving US bridge conditions:
 Source: @axios Read full article
4. Household wealth by generation:
 Source: @financialtimes Read full article
5. Impact of immigration status on housing patterns in the US:
 Source: Goldman Sachs; @MikeZaccardi
6. Voter preferences in the presidential matchup:
 Source: YouGov Read full article
7. Plastic waste:
 Source: @chartrdaily
——————–
Back to Index