
The Daily Shot: 22-Apr-24
• The United States
• The United Kingdom
• The Eurozone
• Europe
• Asia-Pacific
• China
• Emerging Markets
• Commodities
• Energy
• Equities
• Credit
• Rates
• Global Developments
• Food for Thought
The United States
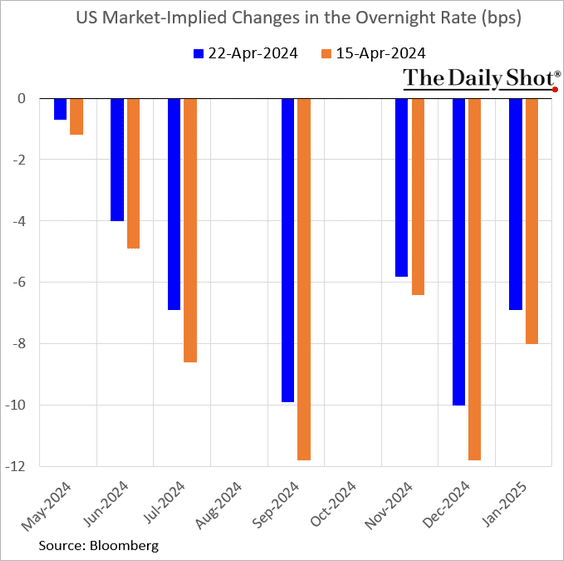
1. The market continues to scale back its expectations for Fed rate cuts in 2024.
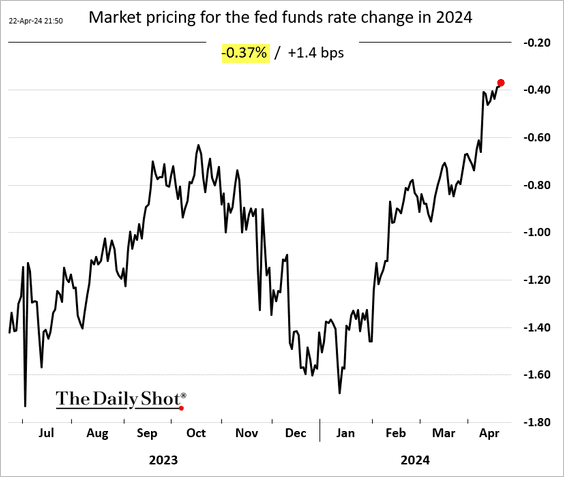
• The 2-year Treasury yield is back at 5%.

Here is the yield curve shift over the past week.

• The interval between the Fed’s final rate hike and the first rate cut in this cycle is likely to be one of the longest in recent history.

——————–
2. Financial conditions have been tightening.

3. Forecasters continue to boost their estimates for this year’s GDP growth, …

… with the labor market continuing to surprise to the upside.
– Average 2024 monthly employment gains projections:

– Unemployment rate:

• Economists are also upgrading their forecasts for this year’s CPI increase amid robust consumer spending and higher energy prices.

——————–
4. Will US inflation mirror the post-WWII pattern: a pause followed by a resumed decline in the CPI?
 Source: Elaine Garzarelli; @carlquintanilla
5. Morgan Stanley expects labor productivity to remain above trend, increasing at about its pre-pandemic pace.
 Source: Morgan Stanley Research
6. More Americans are planning to age in place, which is getting expensive. (2 charts)
 Source: Quill Intelligence
 Source: Quill Intelligence
Back to Index
The United Kingdom
1. The housing market continues to strengthen, …
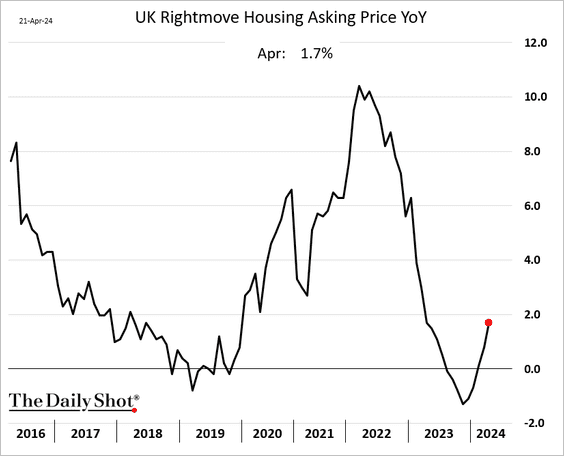
… boosted by high-end homes.
 Source: @markets Read full article
——————–
2. Retail sales (excluding fuel) unexpectedly declined last month.

 Source: @WSJ Read full article
——————–
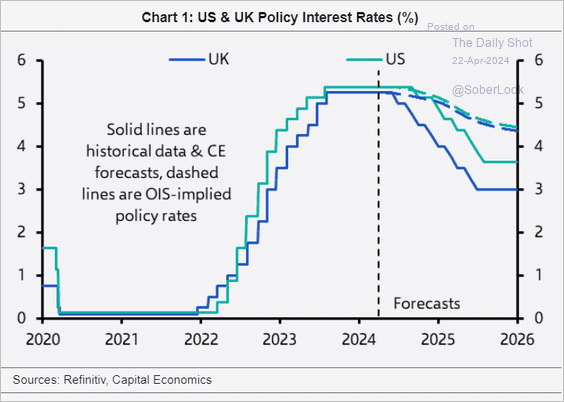
3. Capital Economics sees more substantial rate cuts for the UK and US than is priced into the market.
 Source: Capital Economics
4. Here is a look at government support for Britain’s railways.
 Source: @financialtimes Read full article
Back to Index
The Eurozone
1. If the ECB cuts rates in June, it will mark the longest period between the final rate hike and the first rate cut in the ECB’s history.

2. Here is a look at the estimates of natural rates of interest for the euro area and the US.
 Source: @TheTerminal, Bloomberg Finance L.P.
3. Traders are growing less optimistic about the euro (2 charts).

 Source: @financialtimes Read full article
——————–
4. The Dutch housing market continues to strengthen.

Back to Index
Europe
1. Speculative accounts are raising their bets against the Swiss franc.

2. Economists have been boosting their forecasts for Sweden’s inflation this year.

• When Riksbank finally cuts rates, it will mark the longest period between the final rate hike and the first rate cut in decades.

——————–
3. This map shows which regions have performed above and below their national average GDP growth between 1991 and 2023.
 Source: Publications Office of the European Union Read full article
Back to Index
Asia-Pacific
1. Speculators continue to press their bets against the yen (many using the currency as the funding leg of carry trades).

2. South Korea’s exports strengthened further this month, running well above 2023 levels.

 Source: @economics Read full article
 Source: @economics Read full article
• South Korea’s bond yields are rising.

• Corporate insolvencies hit the highest level in at least 25 years.
 Source: Coolabah Capital Investments Read full article
Back to Index
China
1. The US dollar continues to grind higher against the renminbi.

2. Utilized foreign direct investment remains soft.

 Source: @economics Read full article
——————–
3. Bloomberg Economics expects the PBoC to keep cutting rates this year.
 Source: Chang Shu and David Qu, Bloomberg Economics Read full article
Back to Index
Emerging Markets
1. LatAm central banks’ policies remain restrictive.
 Source: @economics Read full article
2. Here is a look at last week’s performance.
• Currencies:

• Bond yields:

• Equity ETFs:

Back to Index
Commodities
1. Industrial metals continue to rally.
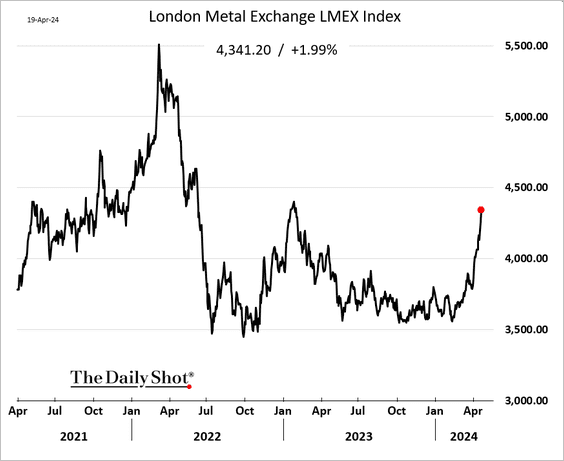
Copper registered four consecutive weekly gains.

• Treaders continue to increase their bets on copper.

• Separately, China’s copper stock levels are abnormally high.
 Source: Steno Research
——————–
2. Gold has been up for five weeks in a row.

3. Next, we have some speculative positioning trends.
• Coffee:

• Chicago hogs:

• Hard red winter wheat:

——————–
4. Finally, here is a look at last week’s performance.

Back to Index
Energy
1. Crude oil is down sharply, with Brent nearing its 50-day moving average as geopolitical tensions ease.
 Source: @TheTerminal, Bloomberg Finance L.P.
 Source: OilPrice.com Read full article
——————–
2. The US rig count climbed last week.

3. Russia’s refinery inputs have been trending lower.
 Source: @markets Read full article
Back to Index
Equities
1. The S&P 500 has recorded six consecutive losses.

Technicals suggest the S&P 500 is oversold. (2 charts)
 Source: MarketDesk Research
 Source: SentimenTrader
——————–
2. The Magnificent 7 also posted six consecutive losses.
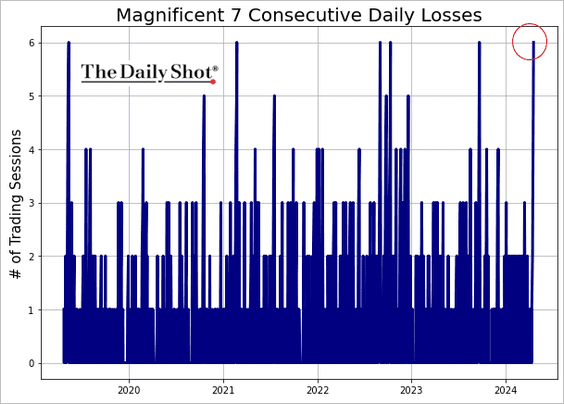
• Friday proved to be a particularly harsh day for the Magnificent 7 shares.

 Source: MarketWatch Read full article
• Here are the weekly price changes.

• Below are the weekly moves for the Nasdaq 100, …

… which is entering oversold territory.

• The percentage of tech shares trading above their 50-day moving average dipped below 10%.

——————–
3. Growth shares sharply underperformed value last week.

4. The percentage of S&P 500 stocks outperforming the index has risen from very low levels.
 Source: Barclays Research
5. Investor sentiment has deteriorated sharply, which increases the chances of a market bounce.
 Source: CNN Business
6. The S&P 500 typically experiences a summer rally during election years.
 Source: @RyanDetrick
7. This chart shows VIX seasonality during election years.

8. 10% drawdowns in the S&P 500 are common historically, occurring in roughly half of calendar years since 1980.
 Source: Variant Perception
9. Few investors are willing to short the two largest US equity ETFs.
 Source: JP Morgan Research; @WallStJesus
10. Next, let’s take a look at last week’s performance data.
• Sectors:

• Equity factors/styles:

• Macro basket pairs’ relative performance:

• Thematic ETFs:

• Largest US tech firms:

Back to Index
Credit
1. Bonds of highly leveraged firms have been under pressure.
 Source: @markets Read full article
2. US high-yield funds experienced sharp outflows last week as investors scaled back the timing of rate cuts.
 Source: PitchBook
3. Here is the debt maturity profile for large and small-cap stocks.
 Source: BofA Global Research; @MikeZaccardi
4. Below we have last week’s performance data.

Back to Index
Rates
1. Speculative bets on the 10-year Treasury futures are shrinking as the futures/cash arb trades unwind.

2. Goldman sees Treasury yields declining by the end of the year.
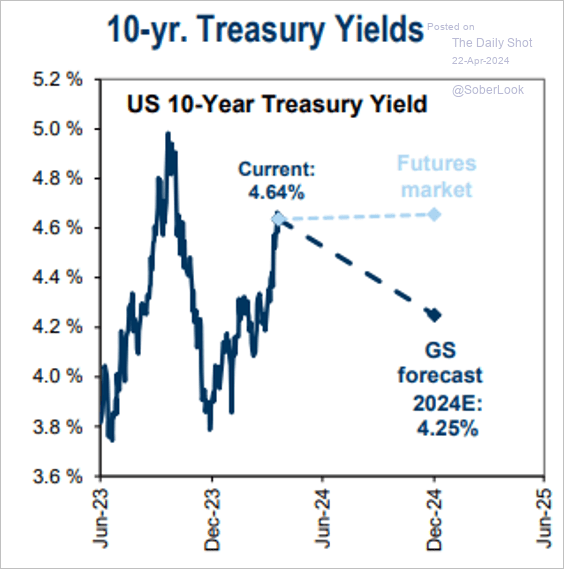 Source: Goldman Sachs; @MikeZaccardi
Back to Index
Global Developments
1. Speculative accounts continue to boost their bets on the US dollar.

2. F/X carry trades are starting to unwind. The Bloomberg F/X carry trade index measures the cumulative total return in eight EM currencies funded with a dollar short.
 Source: Aazan Habib, Paradigm Capital
• The carry trade unwind precipitated risk-off moves. MXN/USD experienced a sharp price drop.
 Source: Aazan Habib, Paradigm Capital
——————–
3. Next, we have some performance data from last week.
• Currencies:

• Bond yields:

• Equities:

——————–
Food for Thought
1. Rising relocation costs for US workers:
 Source: @economics Read full article
2. Boomers dominating ownership of the big homes:
 Source: @WSJ Read full article
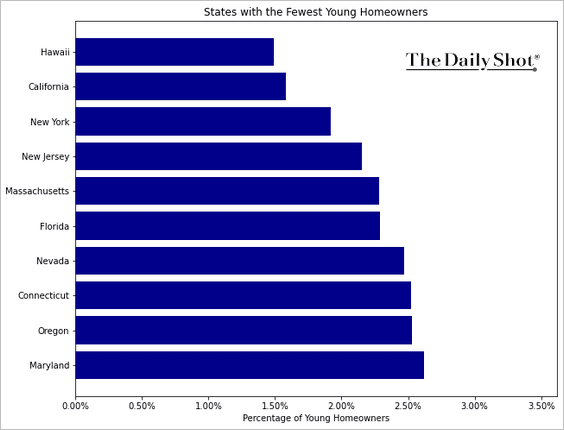
3. States with the fewest young homeowners:
 Source: Agent Advice
• States with the most young homeowners:
 Source: Agent Advice
——————–
4. Abortion access by state:
 Source: Reuters Read full article
• Distance to the nearest clinic:
 Source: Reuters Read full article
——————–
5. Concentration of health spending across population percentiles:
 Source: Health System Tracker Read full article
6. Observance of Jewish traditions in the US:
 Source: VOX Read full article
——————–
Back to Index