
The Daily Shot: 17-Apr-24
• The United States
• Canada
• The United Kingdom
• The Eurozone
• Europe
• Japan
• Asia-Pacific
• China
• Emerging Markets
• Commodities
• Energy
• Equities
• Alternatives
• Credit
• Rates
• Global Developments
• Food for Thought
The United States
1. Chair Powell stated that the US central bank is not rushing to cut rates in light of strong labor market and inflation data.
Chair Jerome Powell: – The recent data have clearly not given us greater confidence and instead indicate that it is likely to take longer than expected to achieve that confidence.
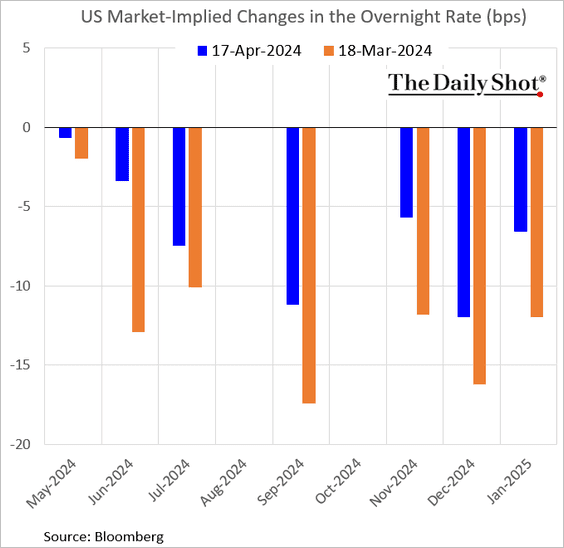
– The market is now pricing only 40 bps of rate reductions this year.
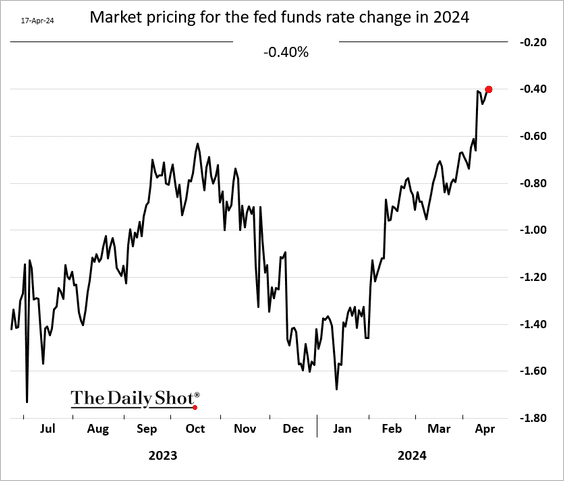
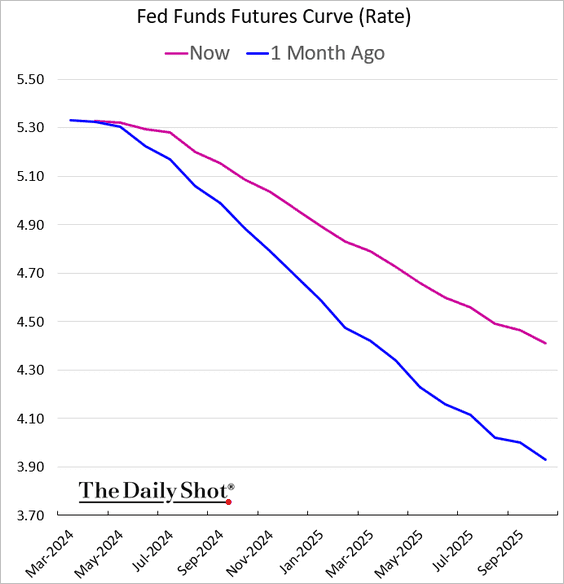
– It’s striking how much the markets have adjusted their expectations for the Fed funds rate trajectory compared to a month ago (2 charts).
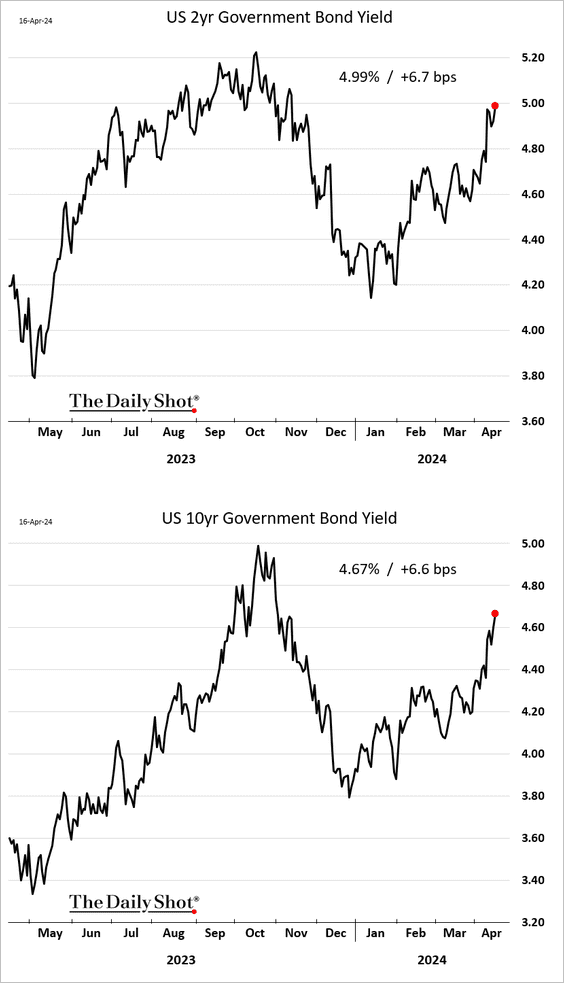
– Treasury yields climbed further.
• The positive output gap could mean the Fed has less room to cut interest rates than the market expects.
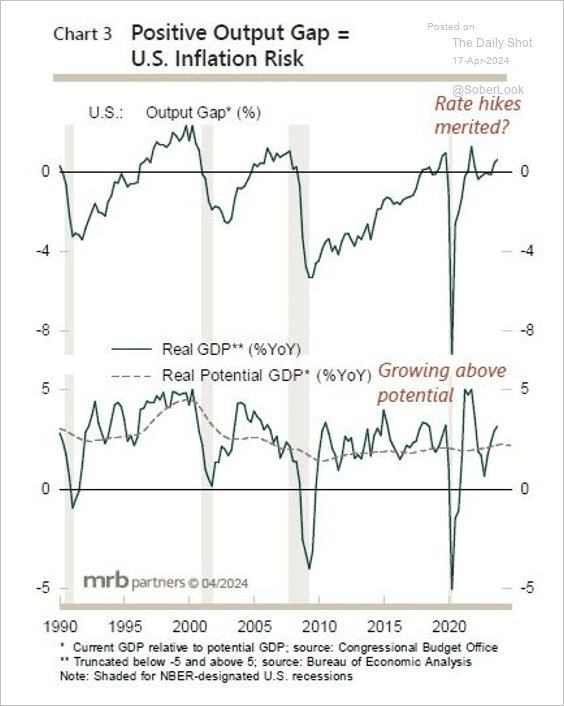 Source: MRB Partners
• Goldman expects the Fed to deliver its first rate cut in July.
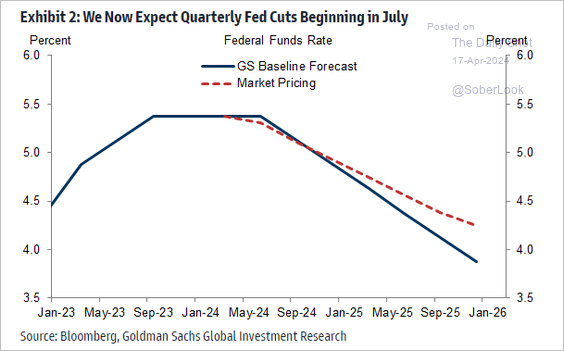 Source: Goldman Sachs; @MikeZaccardi
——————–
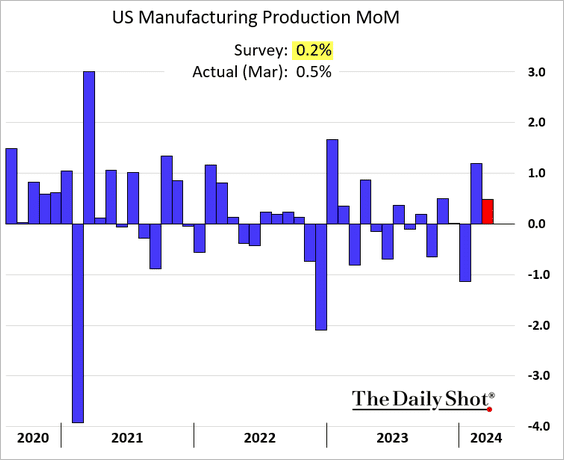
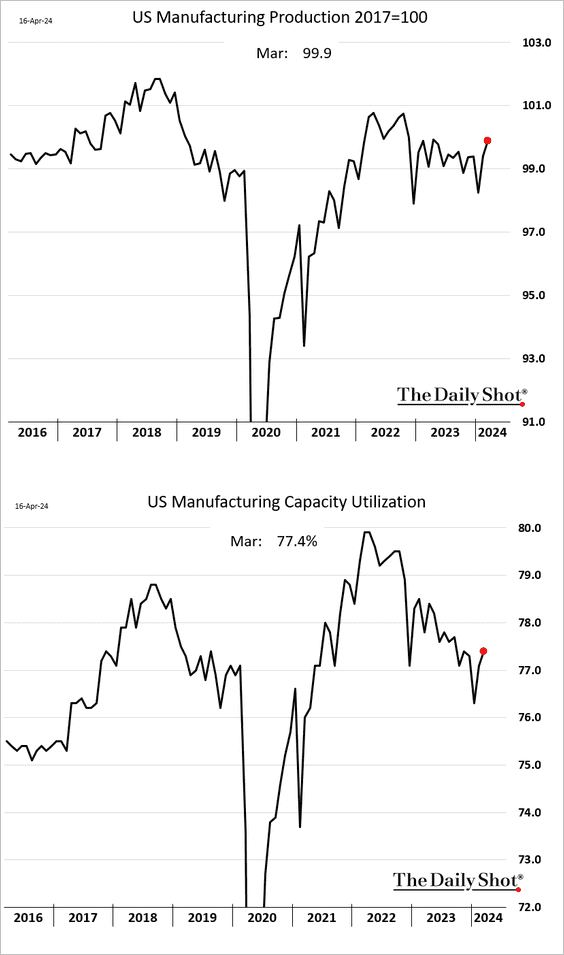
2. The US manufacturing sector showed further signs of a rebound, with the March gain in factory output topping expectations.
• Vehicle production increased again.
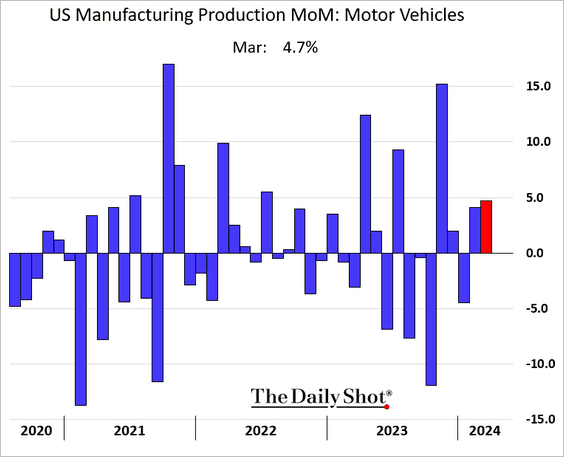
 Source: @economics Read full article
• Here are the indices (level) of manufacturing production and capacity utilization.
——————–
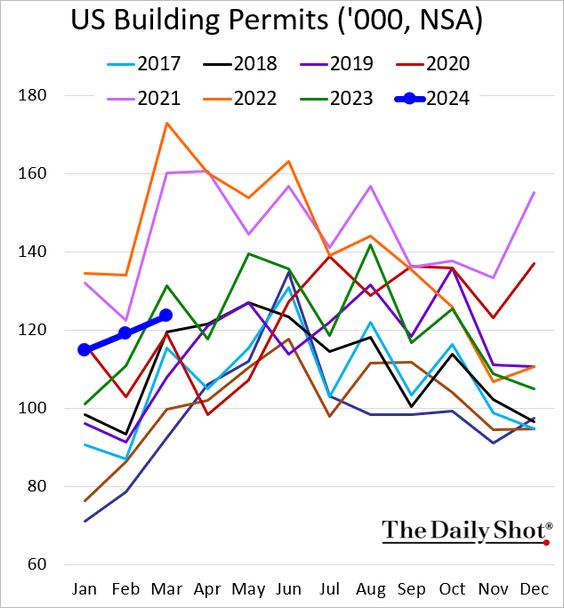
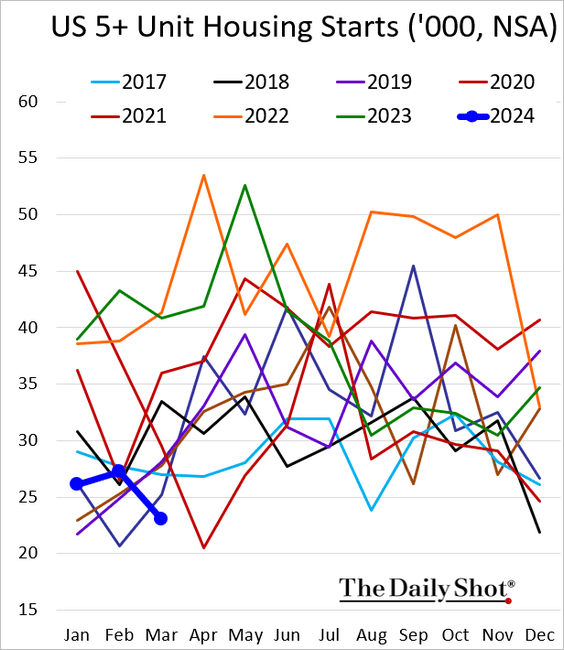
3. Next, we have some updates on the housing market.
• Residential construction activity dipped below last year’s levels.
Permits:
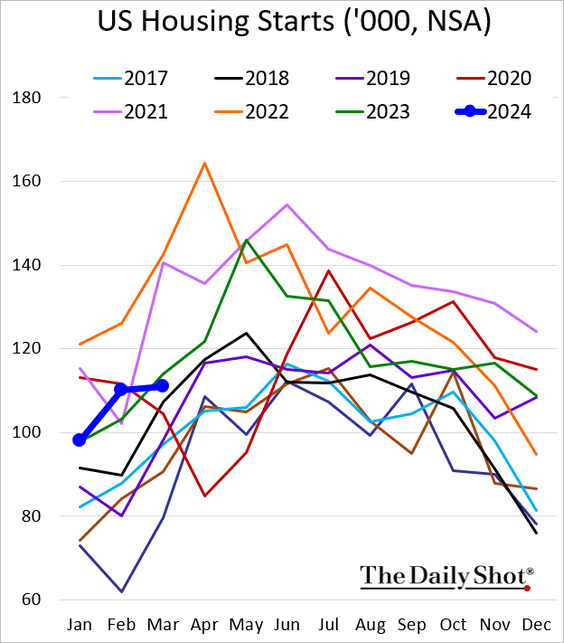
Starts:
– Single-family housing activity lost some momentum but was well above the 2023 level.
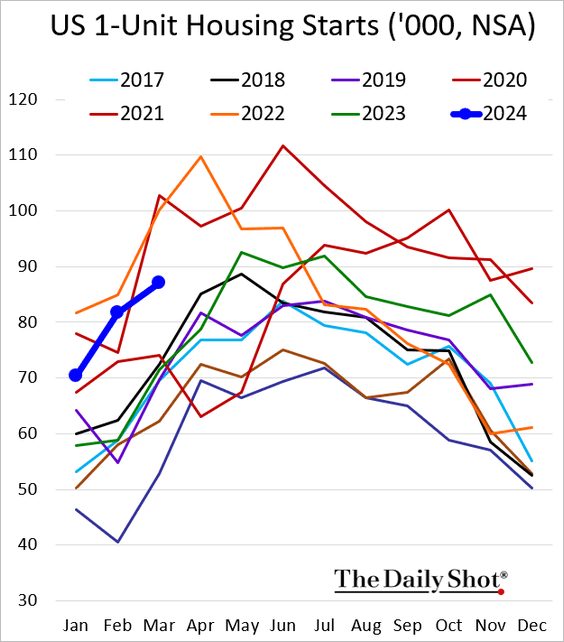
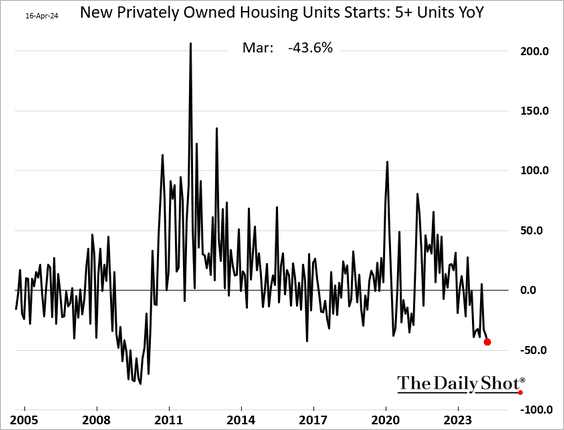
On the other hand, multifamily housing starts hit a multi-year low.
This chart shows the year-over-year changes.
– These charts employ dual y-axes to highlight the recent divergence between single-family and multifamily seasonally-adjusted housing trends.
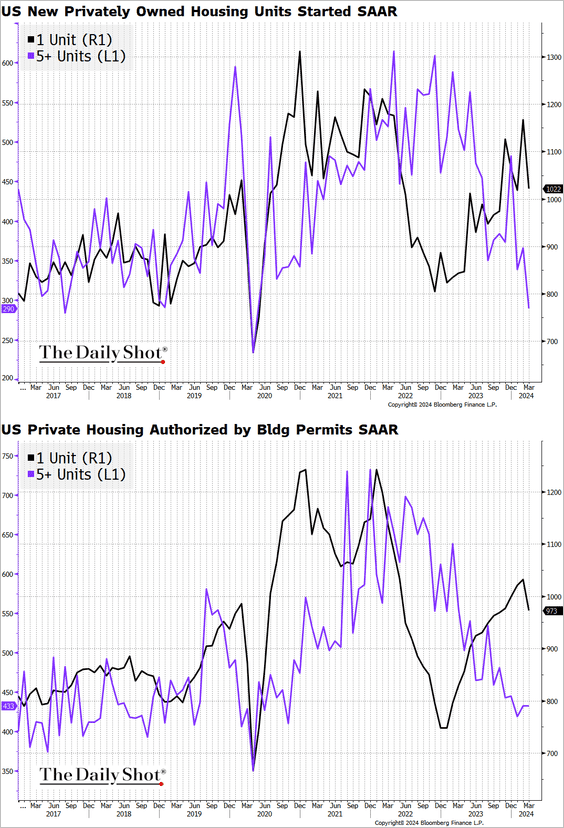 Source: @TheTerminal, Bloomberg Finance L.P.
• Mortgage rates continue to climb.
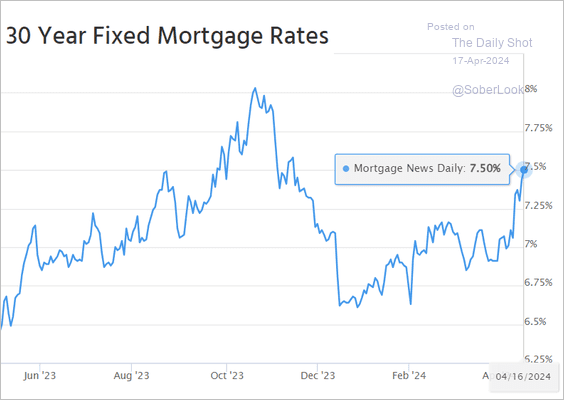 Source: Mortgage News Daily
• Homeowners’ insurance costs have increased rapidly in recent years, exacerbating housing affordability woes (2 charts).
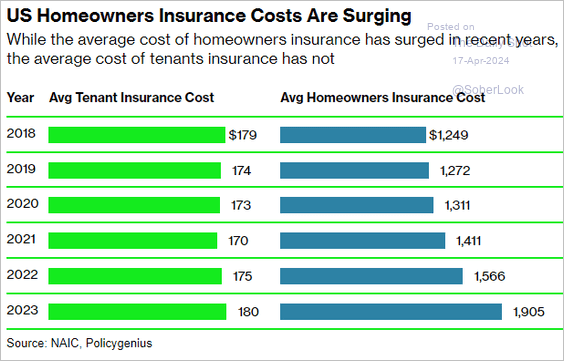 Source: @climate Read full article
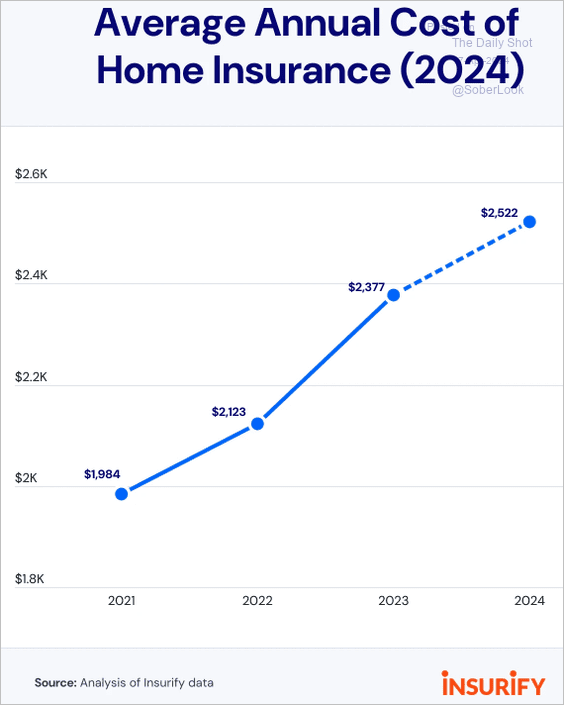 Source: Insurify
Back to Index
Canada
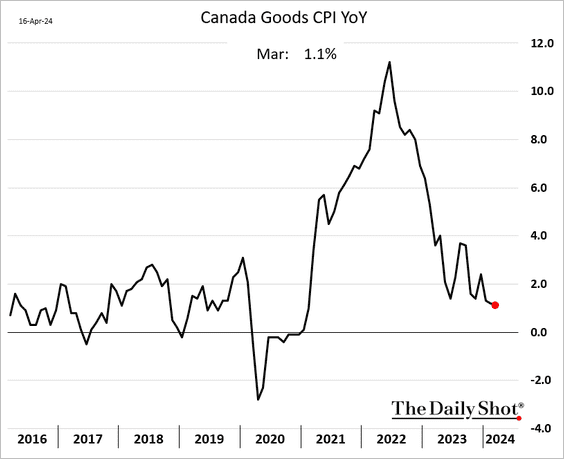
1. The March CPI edged higher on a year-over-year basis.
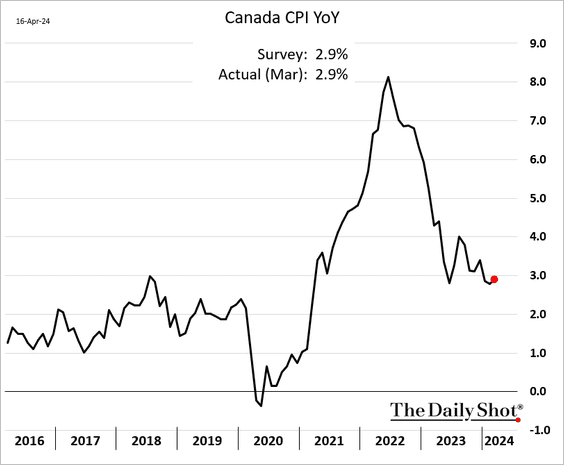
• Canada’s core inflation measures came in lower than expected, though the CPI excluding food and energy (3rd panel) recorded an increase.
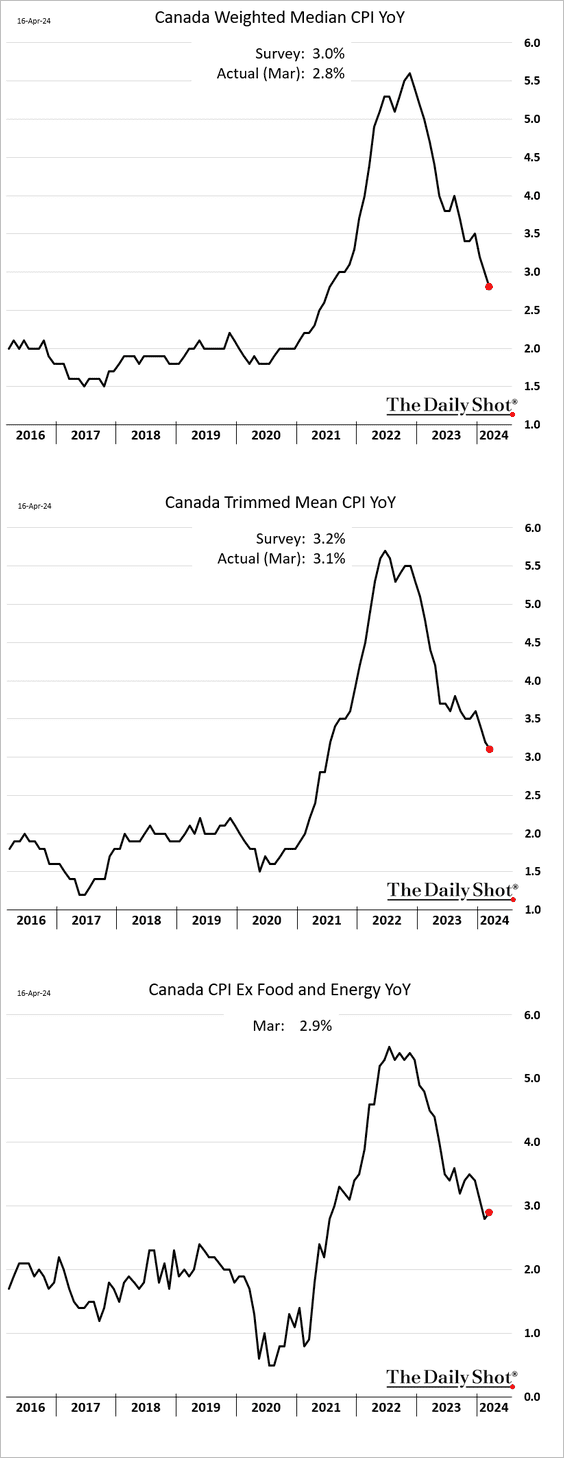
 Source: Reuters Read full article
• Goods inflation continues to moderate.
• But services CPI remains sticky as rent inflation surges.
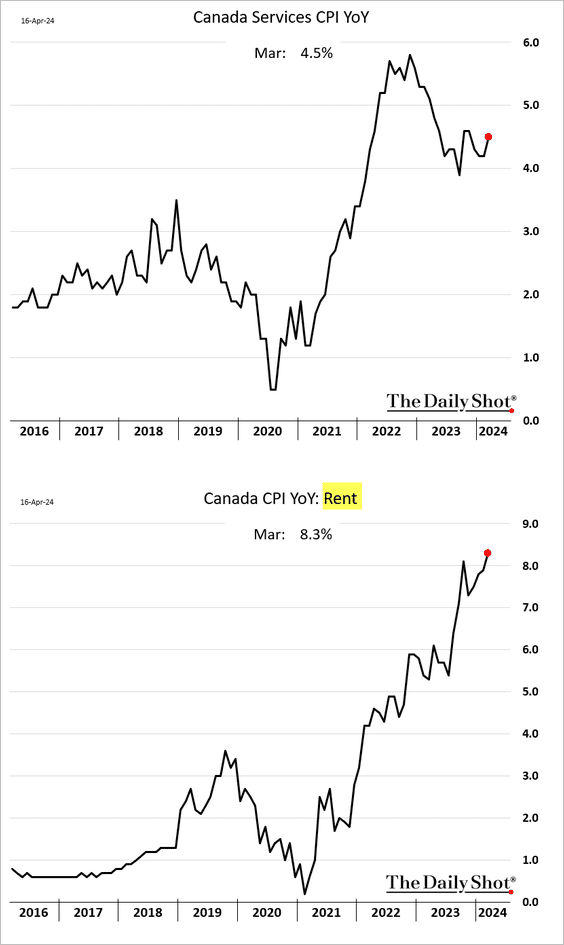
The government is raising funds to ease the impact of escalating housing costs on lower-income households.
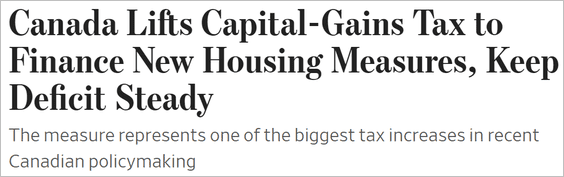 Source: @WSJ Read full article
——————–
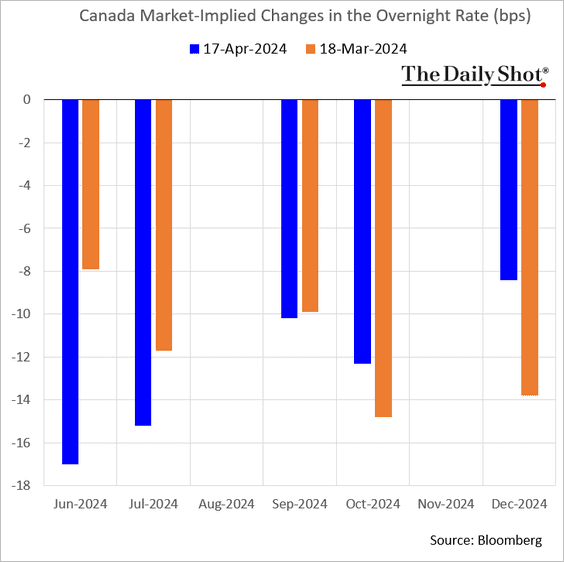
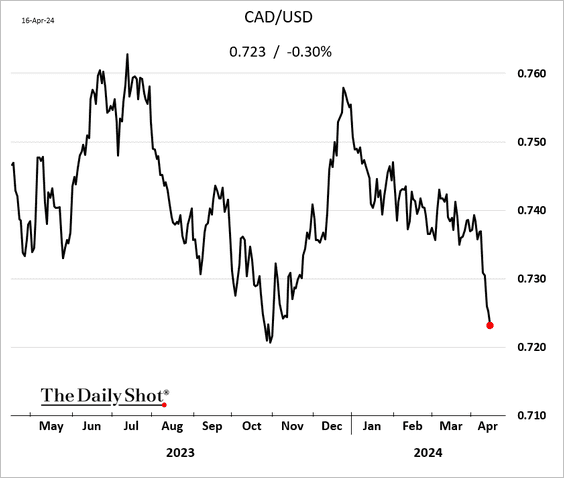
2. June is becoming increasingly likely as the timing for the first BoC rate cut.
• The loonie continues to weaken.
——————–
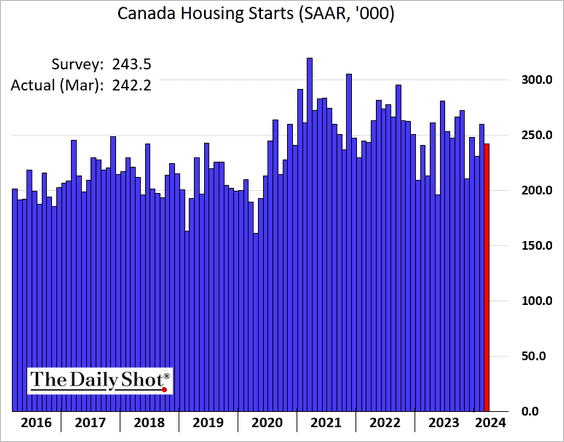
3. March housing starts were slightly below forecasts.
Back to Index
The United Kingdom
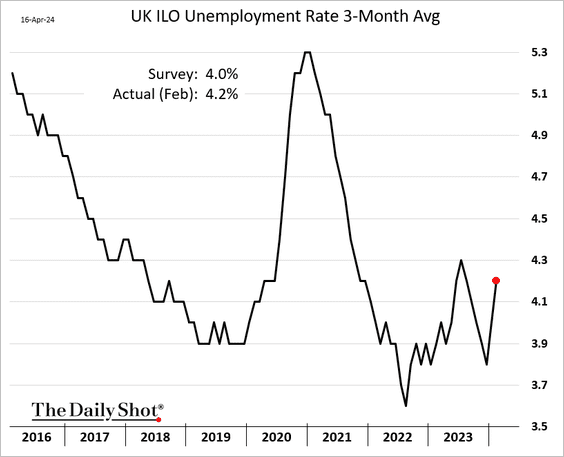
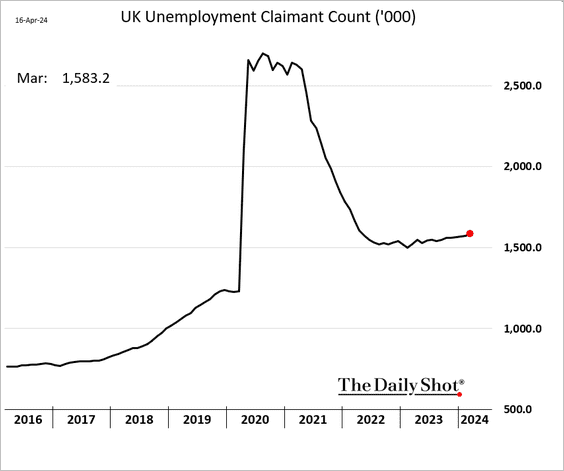
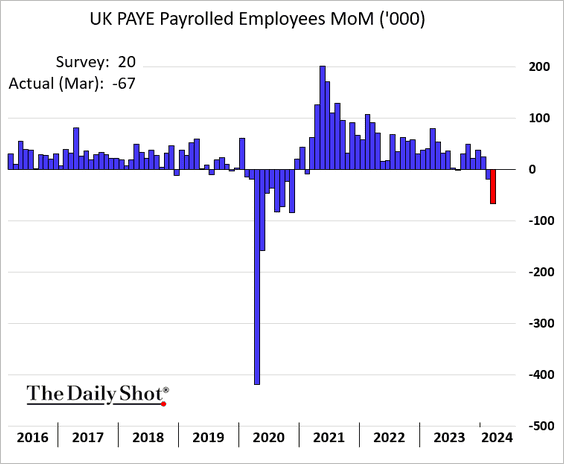
1. The UK labor market is exhibiting signs of weakness.
– The unemployment rate:
 Source: BBC Read full article
– Claimant count:
– Payrolls (often subject to substantial revisions):
• Wage growth remains elevated, topping forecasts.
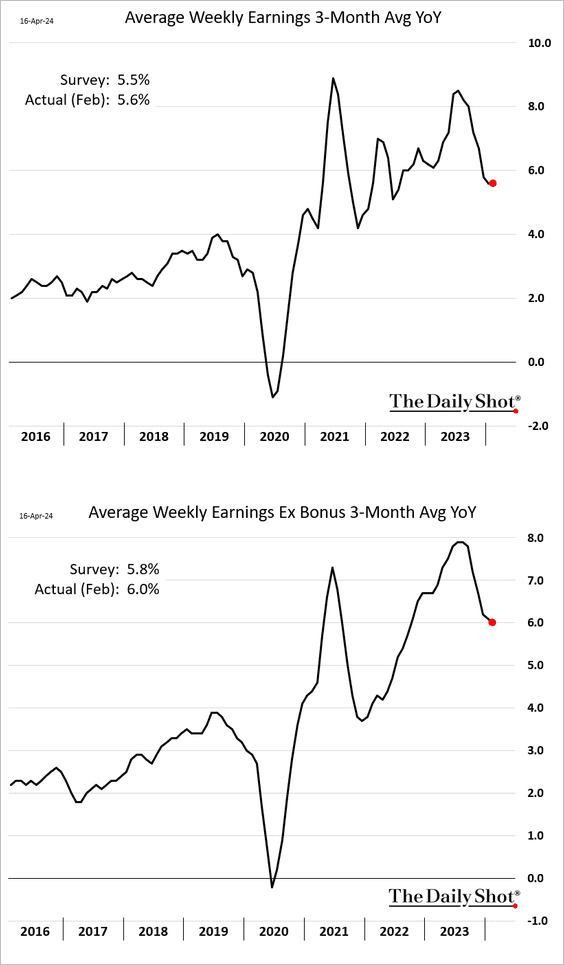
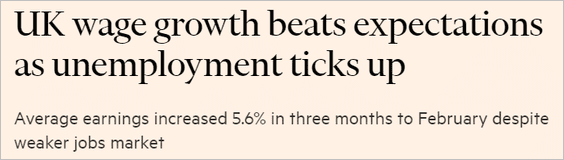 Source: @financialtimes Read full article
——————–
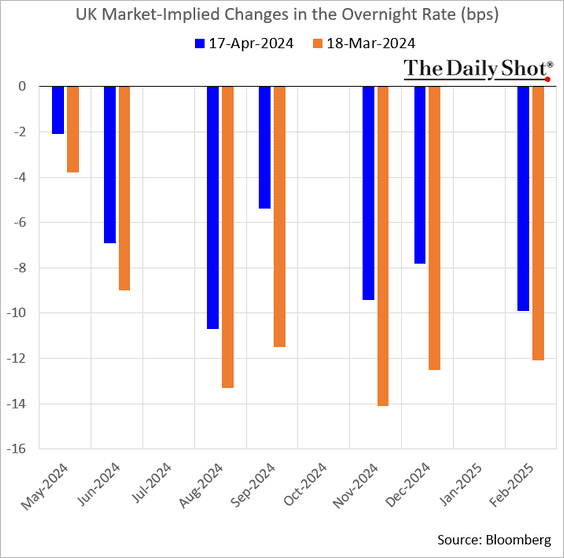
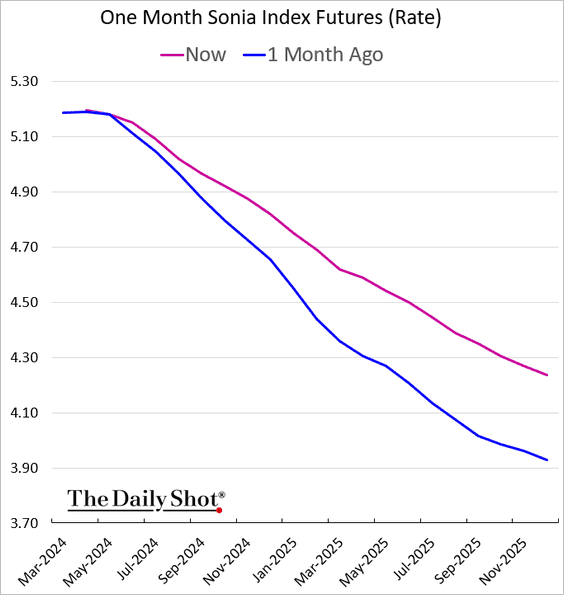
2. The market is progressively lowering its projections for BoE rate cuts this year (similar to the US).
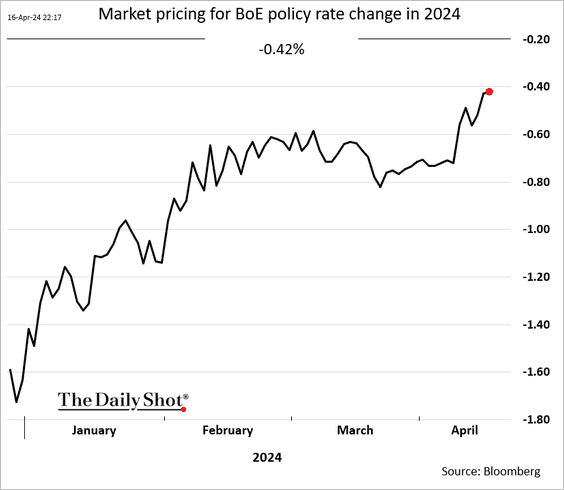
• The rate trajectory repricing over the past 30 days has been substantial (2 charts).
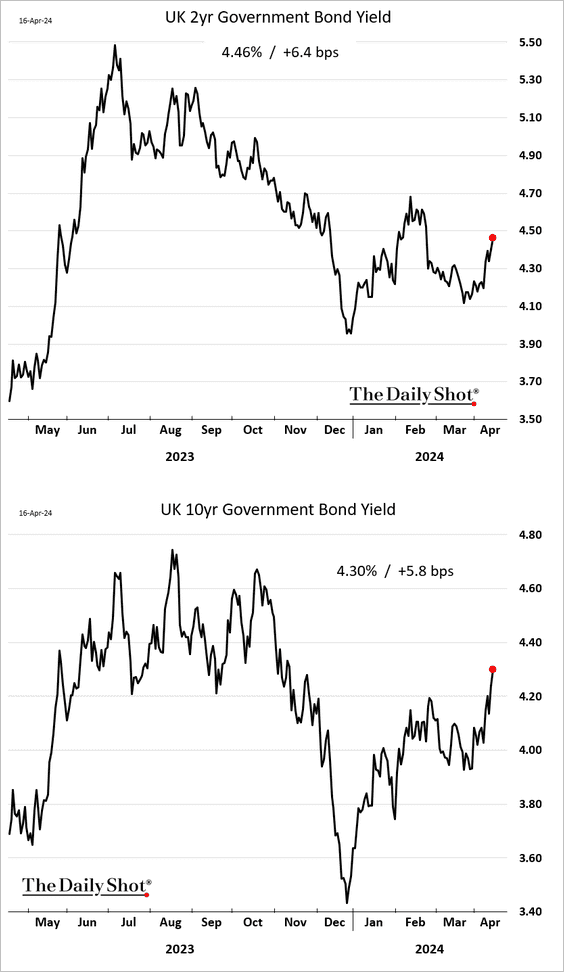
• Gilt yields are climbing.
Back to Index
The Eurozone
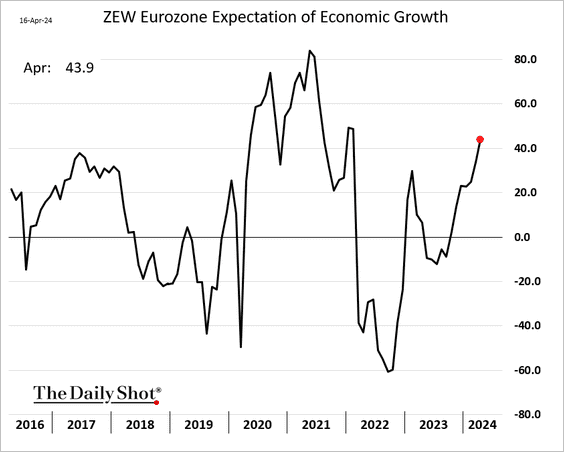
1. Germany’s ZEW expectations indicator topped forecasts as sentiment continues to improve.
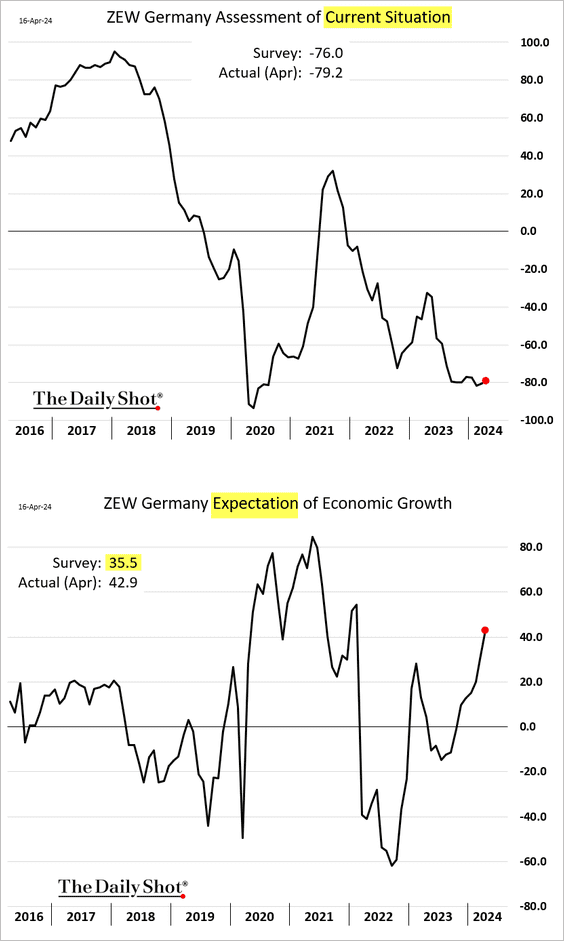
There is a similar trend at the Eurozone level.
——————–
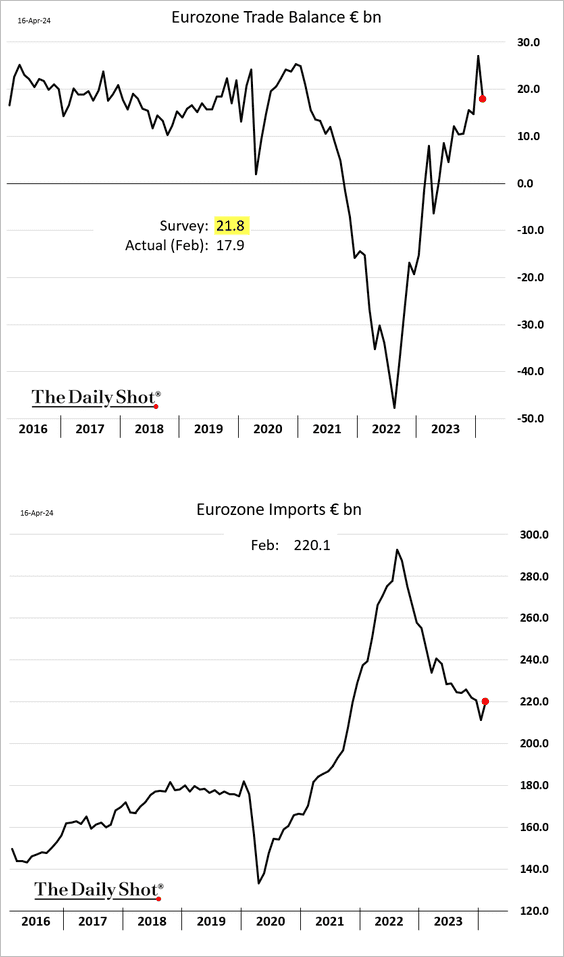
2. Euro-area trade surplus registered a pullback in February as imports climbed.
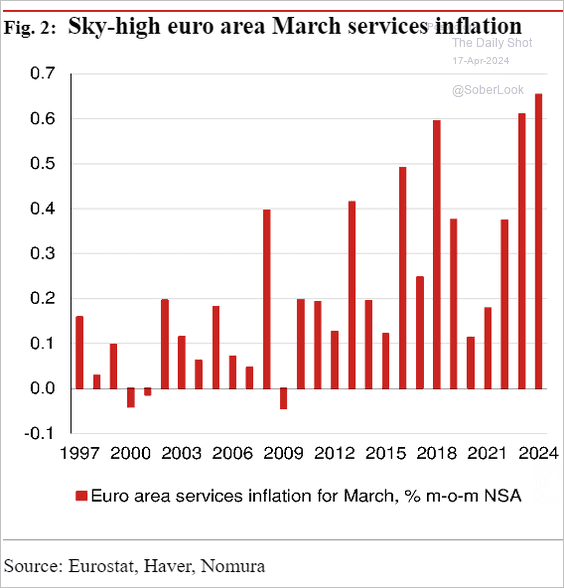
3. Services inflation has been running hot.
 Source: Nomura Securities
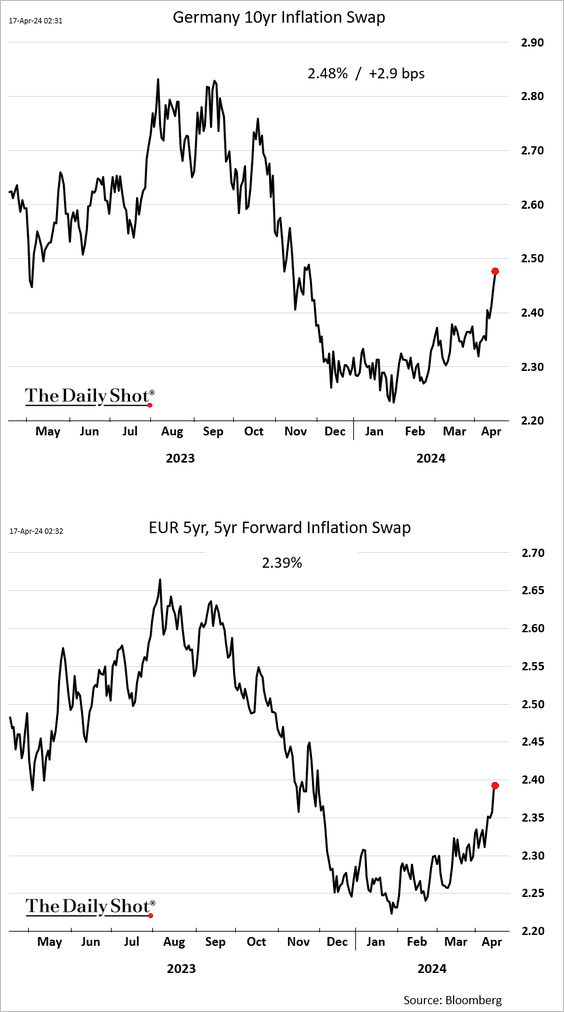
• Longer-term inflation expectations are rising.
——————–
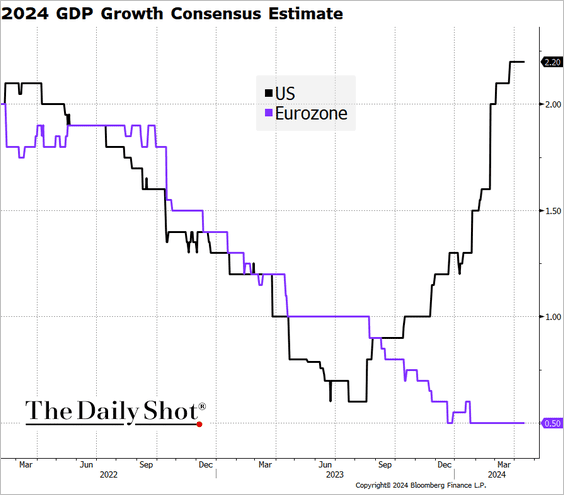
4. Market expectations for rate cuts in 2024 for the Eurozone and the US continue to diverge, …
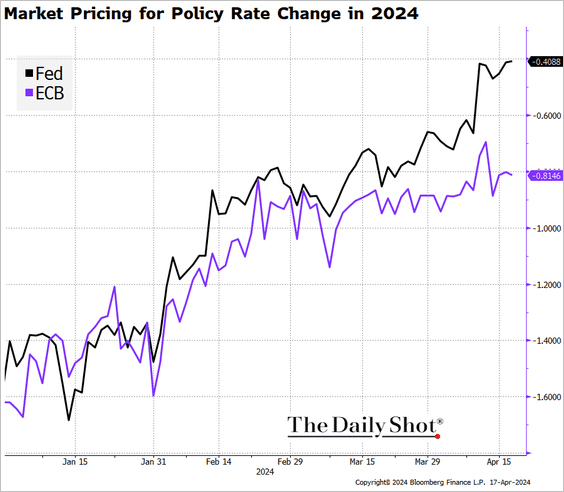
… as the gap in growth estimates widens.
Back to Index
Europe
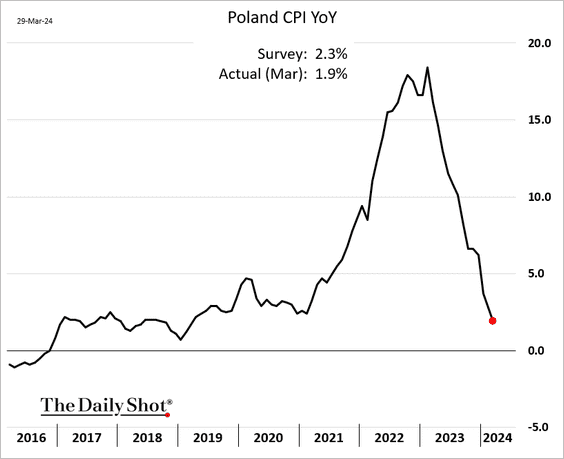
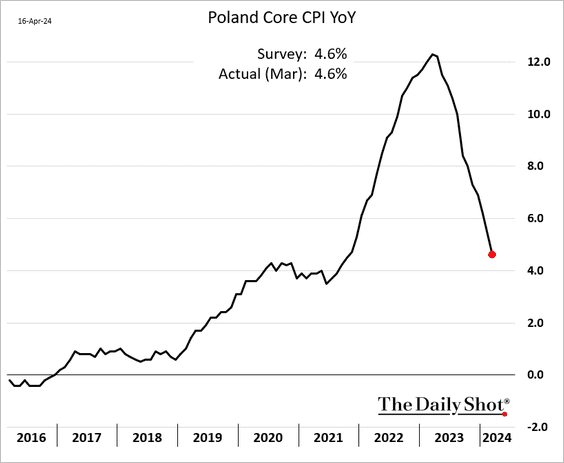
1. Poland’s inflation continues to moderate.
——————–
2. This scatterplot shows the share of intra-EU trade by country.
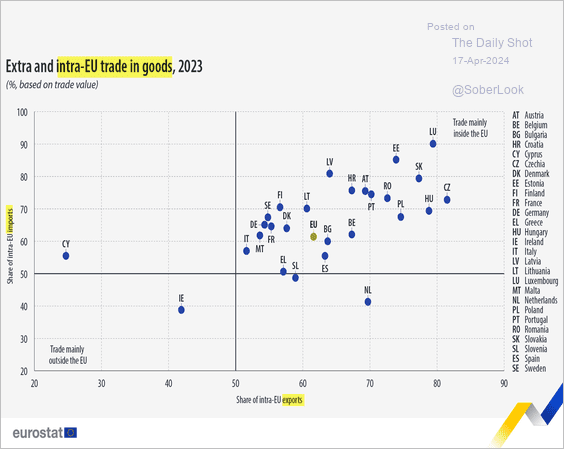 Source: Eurostat Read full article
3. Here is a look at the EU’s non-citizen migration, showing orders to leave and compliance in Q4 2023.
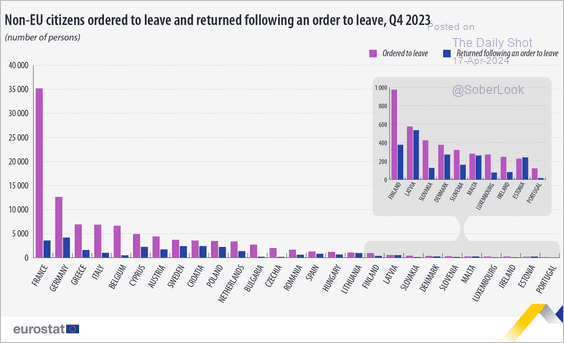 Source: Eurostat Read full article
Back to Index
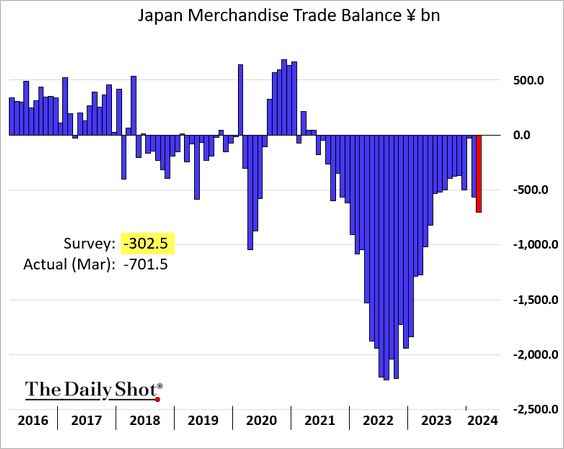
Japan
1. The trade deficit was wider than expected on stronger imports.
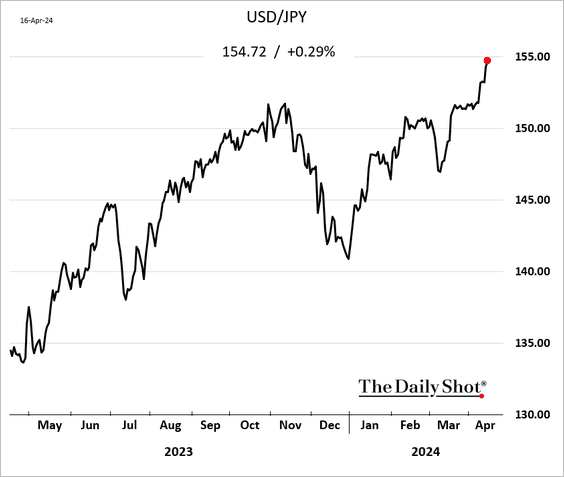
2. Dollar-yen is nearing 155.
Back to Index
Asia-Pacific
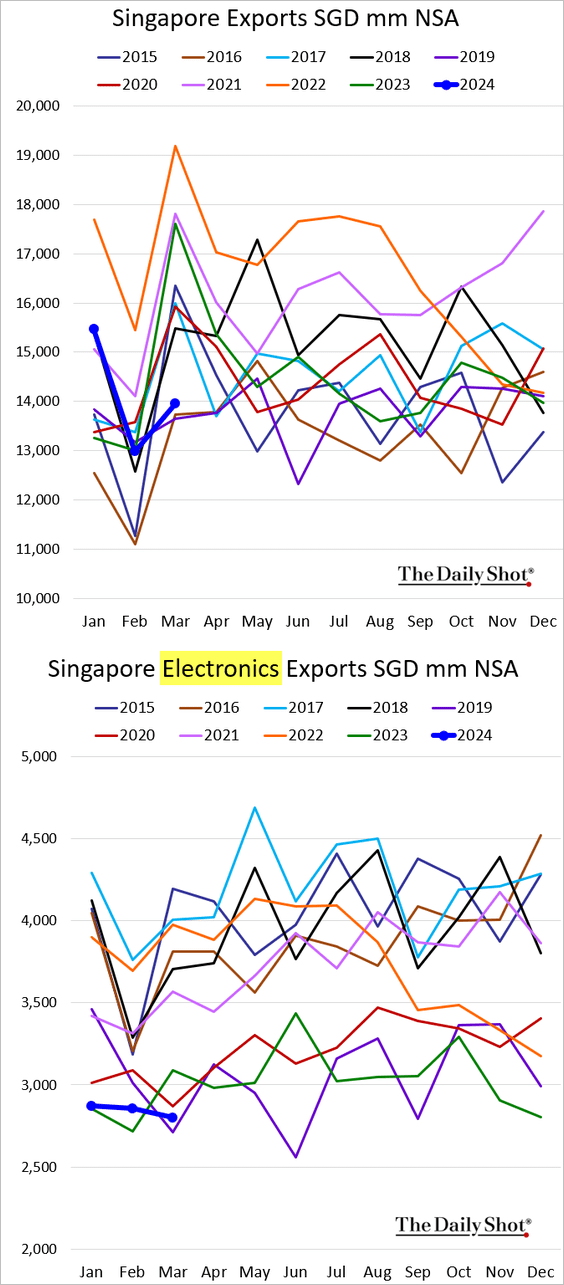
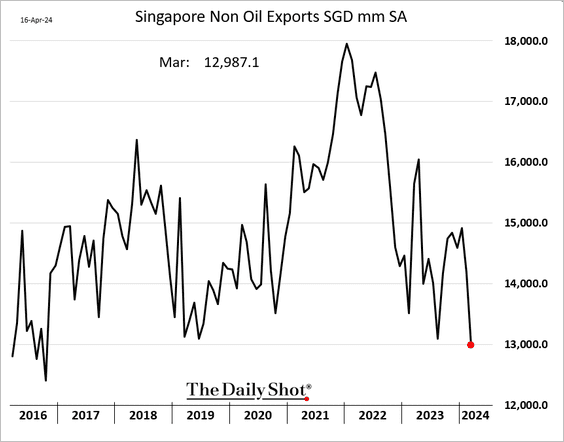
1. Singapore exports slump as electronics trade slows.
This chart shows the seasonally adjusted trend.
 Source: @WSJ Read full article
——————–
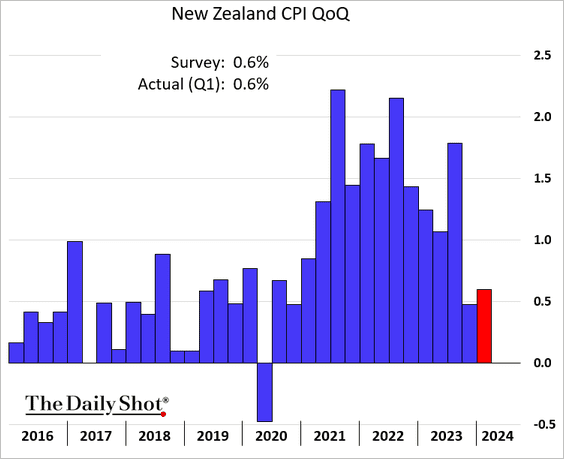
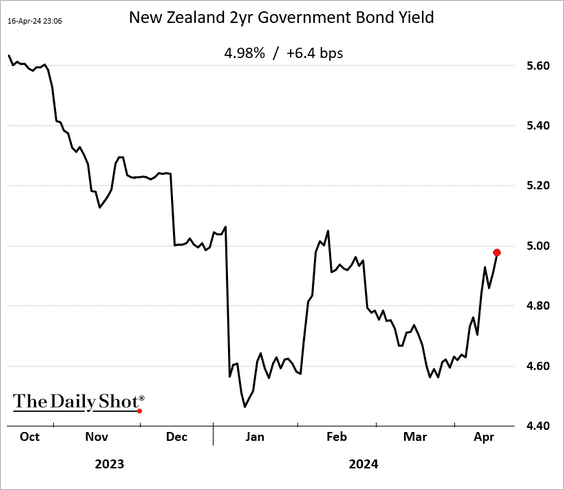
2. New Zealand’s inflation rose in the first quarter.
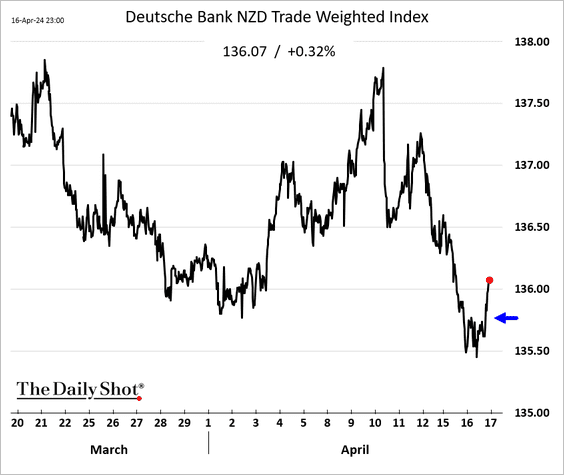
• The Kiwi dollar (trade-weighted index) and bond yields climbed.
Back to Index
China
1. Let’s begin with the residential property market.
• Year-over-year changes in home prices:
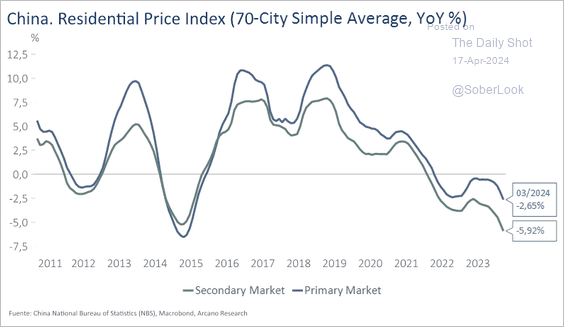 Source: Arbor Research & Trading
• Residential housing activity:
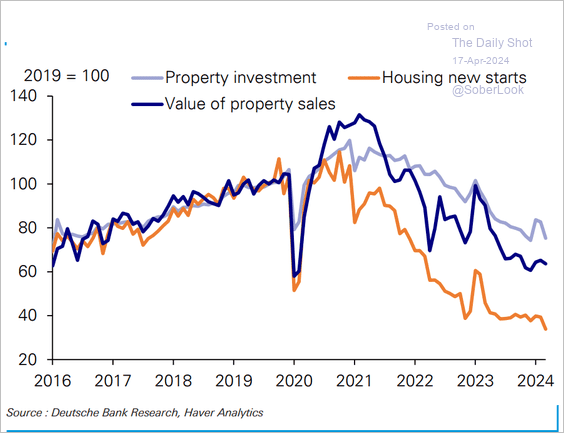 Source: Deutsche Bank Research
• New residential construction (YTD):
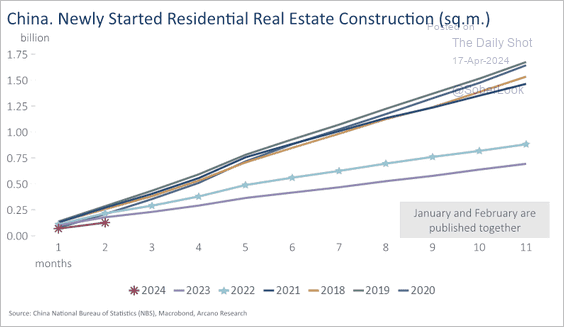 Source: Arbor Research & Trading
——————–
2. Migrant worker employment and wages continue to improve.
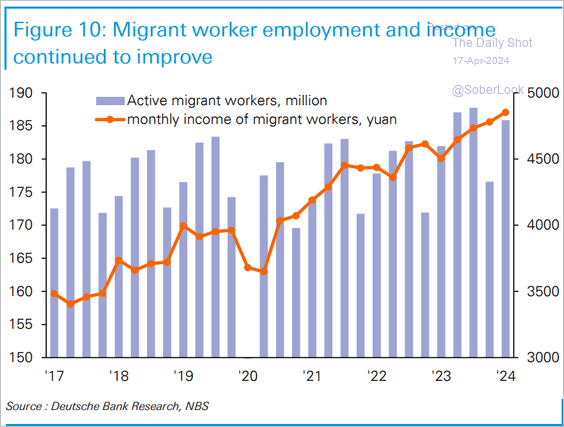 Source: Deutsche Bank Research
3. Soft consumer confidence has been a drag on retail sales.
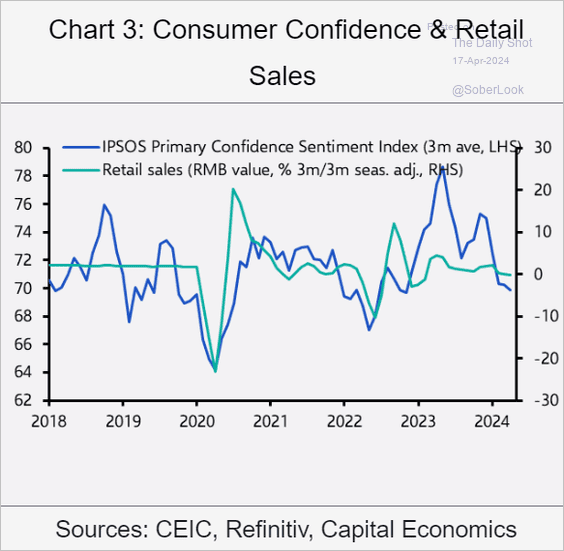 Source: Capital Economics
4. China’s economy, as a percentage of the US economy, has been trending lower in recent years.
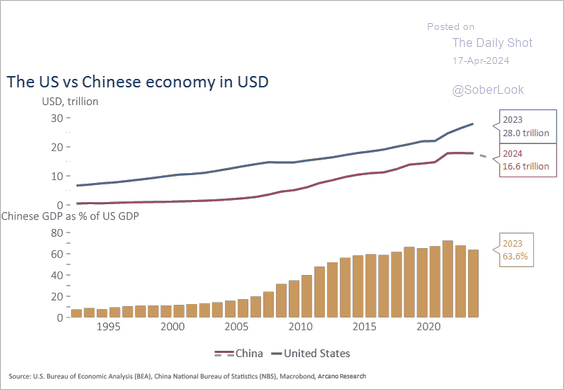 Source: Arbor Research & Trading
Back to Index
Emerging Markets
1. India and ASEAN economies are expected to grow strongly versus their pre-pandemic trends.
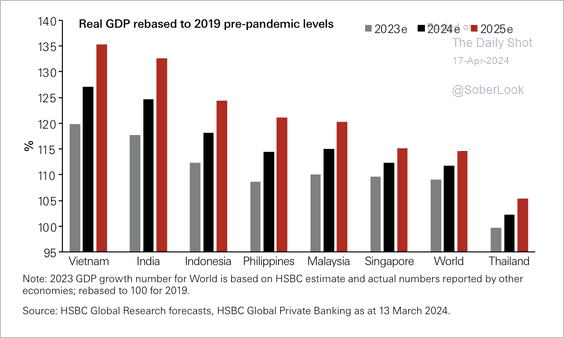 Source: HSBC Global Research
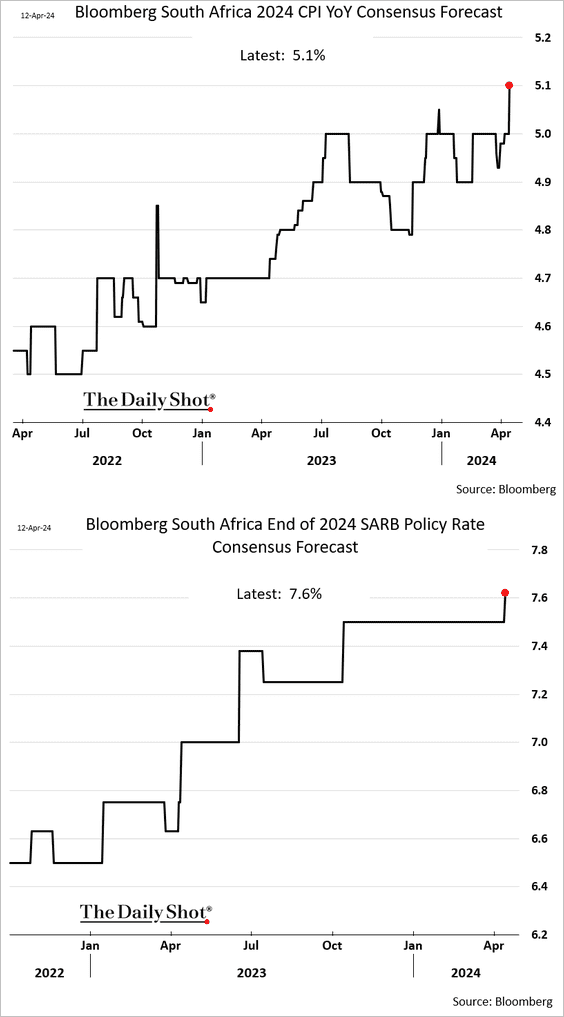
2. Economists are raising their forecasts for South Africa’s 2024 inflation and central bank policy rate.
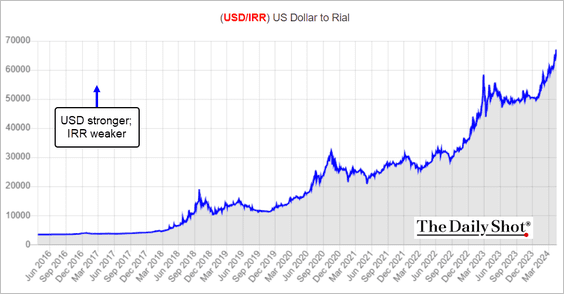
3. Iran’s currency continues to weaken, fueling the nation’s crippling inflation.
 Source: Bonbast
Back to Index
Commodities
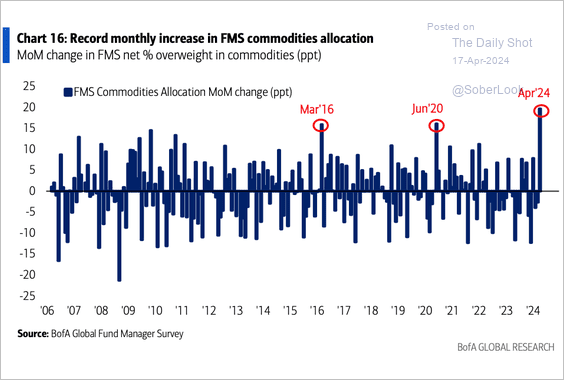
1. Fund managers have been boosting their allocations to commodities.
 Source: BofA Global Research
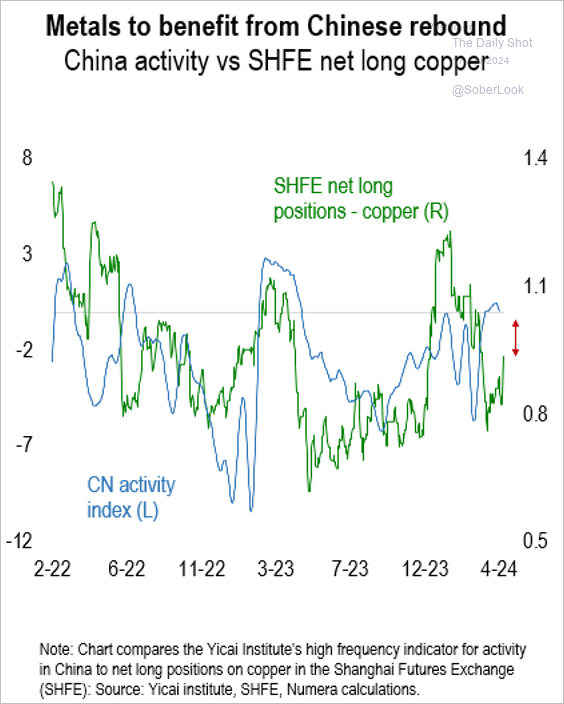
2. A rebound in China’s economic activity could encourage more bullish copper positioning, which is not yet extreme.
 Source: Numera Analytics (@NumeraAnalytics)
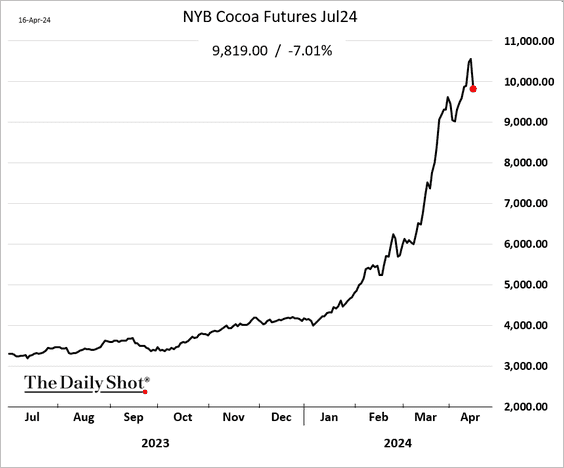
3. Is the cocoa rally fading?
4. Commodities have traded at historical lows relative to the S&P 500 in recent years.
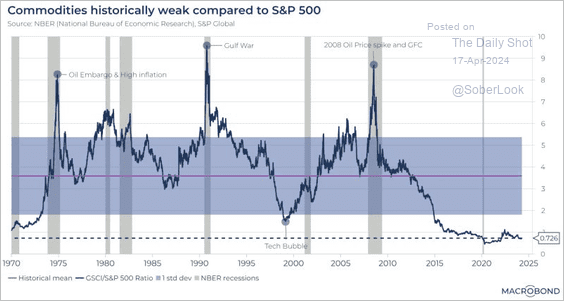 Source: Macrobond
Back to Index
Energy
1. The volume of bullish options on Brent crude has surged in recent days.
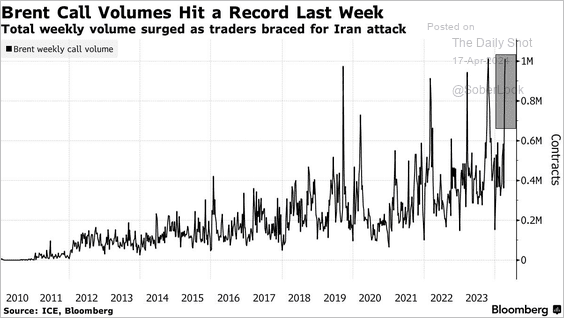 Source: @markets Read full article
2. Elevated OPEC capacity mitigates the impact of potential upside oil price shocks.
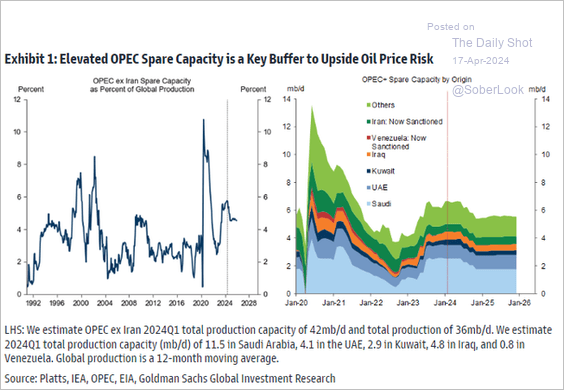 Source: Goldman Sachs; @MikeZaccardi
Back to Index
Equities
1. Market breadth has deteriorated rapidly …
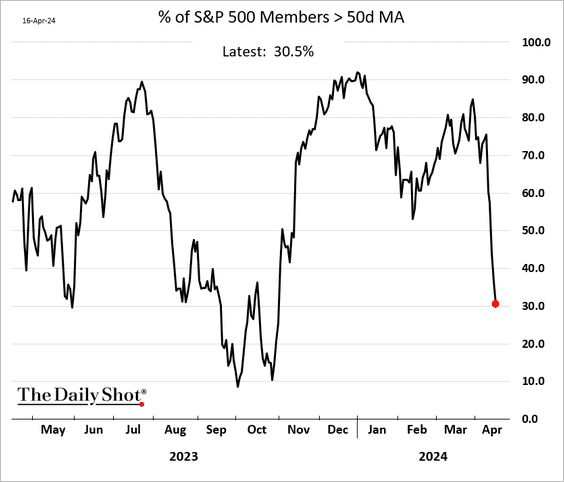
… and could worsen further amid elevated bond yields.
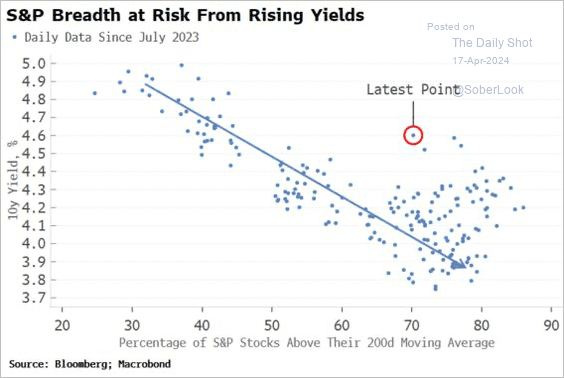 Source: Simon White, Bloomberg Markets Live Blog
——————–
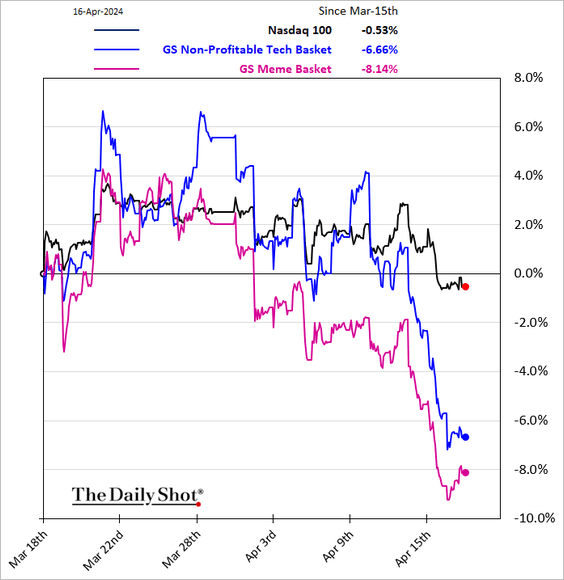
2. Speculative shares underperformed sharply in recent days.
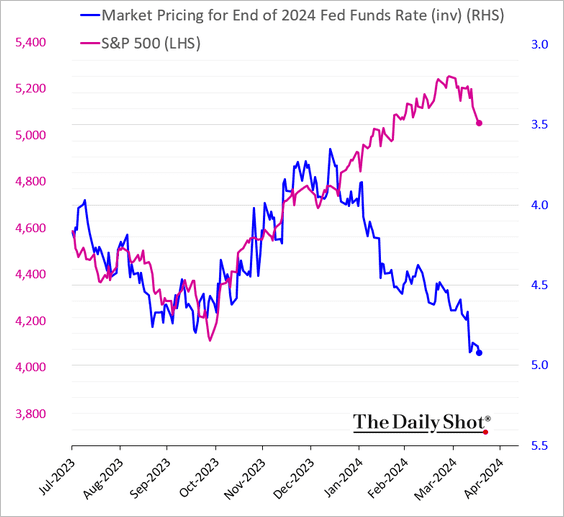
3. Melting Fed rate cut expectations remain a drag on stocks.
4. Fund managers have been increasingly bullish on equities, …
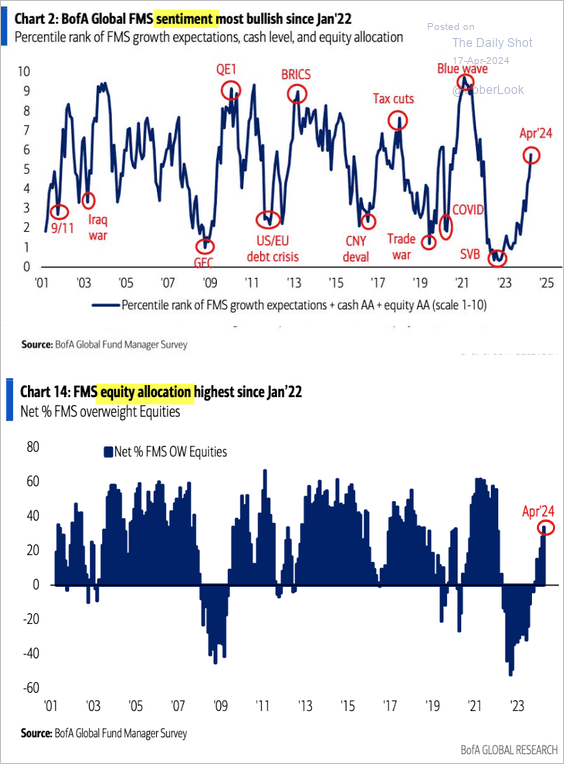 Source: BofA Global Research
… with cash levels sinking.
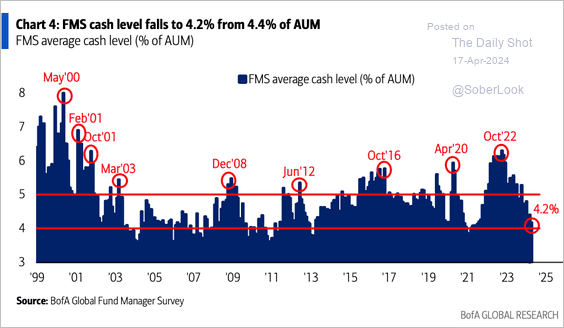 Source: BofA Global Research
——————–
5. More firms have been issuing negative guidance.
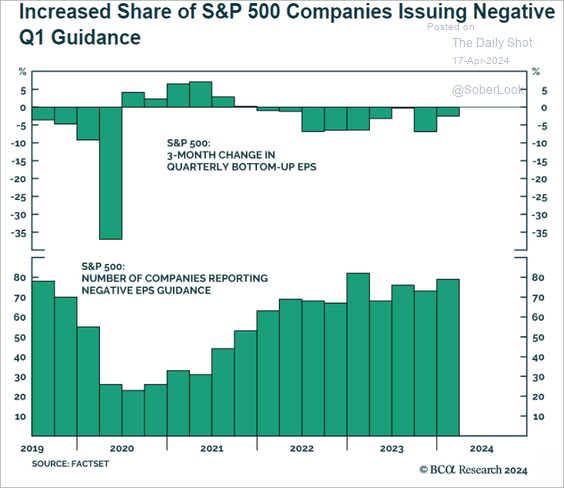 Source: BCA Research
6. Earnings expectations for large and small caps continue to diverge.
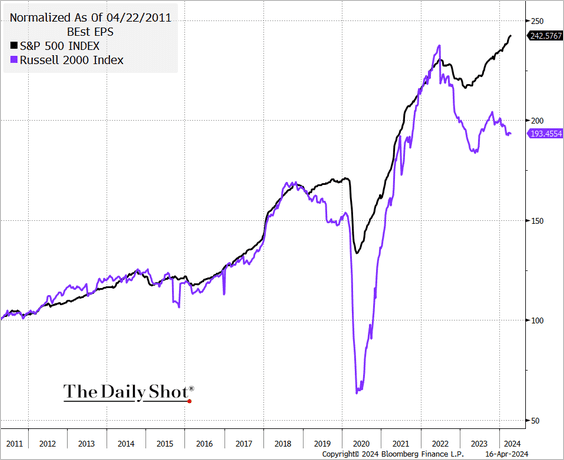 Source: @TheTerminal, Bloomberg Finance L.P.
7. Share buyback activity remains robust.
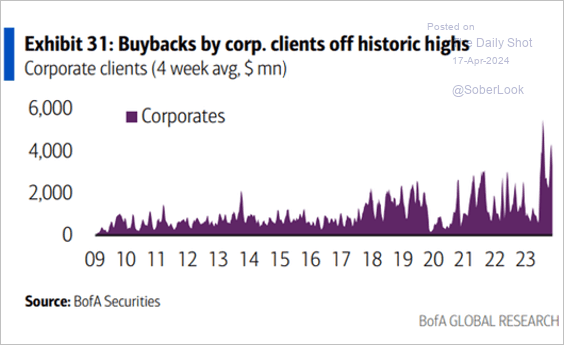 Source: BofA Global Research
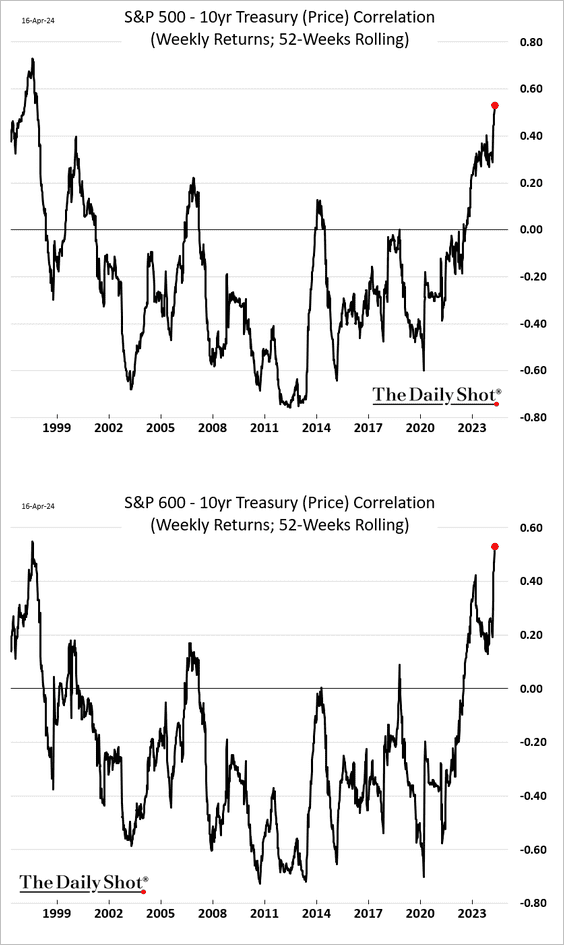
8. On a 52-week rolling basis, the correlation between stocks and bonds hasn’t been this high since the late 1990s.
9. Next, we have a couple of sector updates.
• The high interest expense among US utilities stocks has reduced the sector’s defensive appeal.
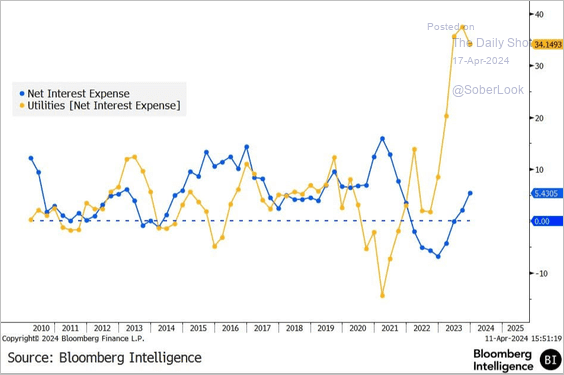 Source: @GinaMartinAdams
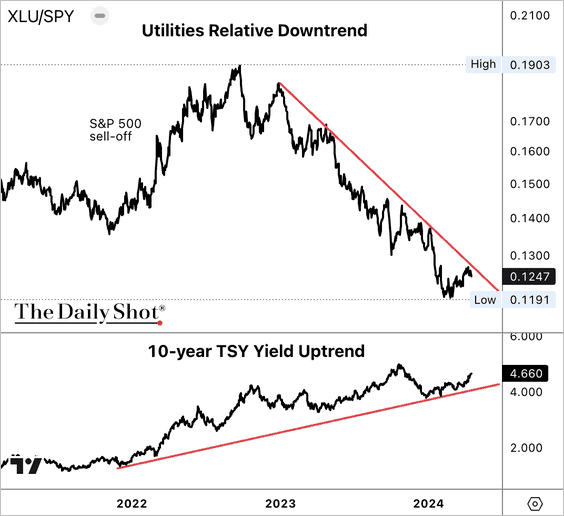
– The utilities sector remains in a long-term downtrend relative to the S&P 500, while yields have trended higher.
• Aerospace and defense stocks are outperforming amid rising geopolitical risk.
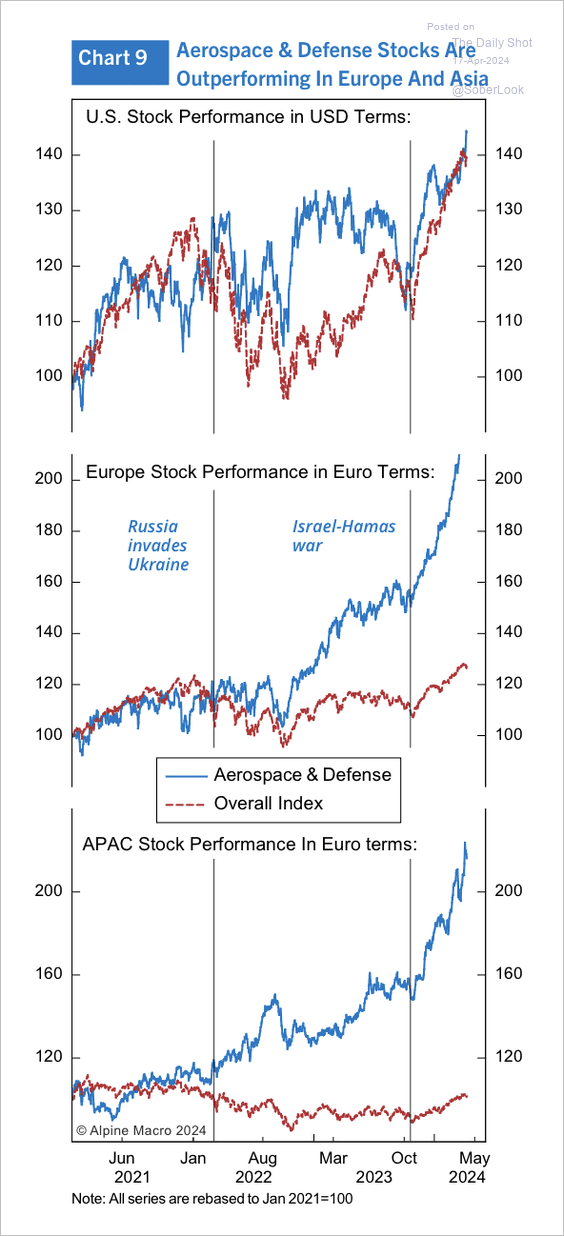 Source: Alpine Macro
Back to Index
Alternatives
1. Here is a look at global infrastructure assets under management by region.
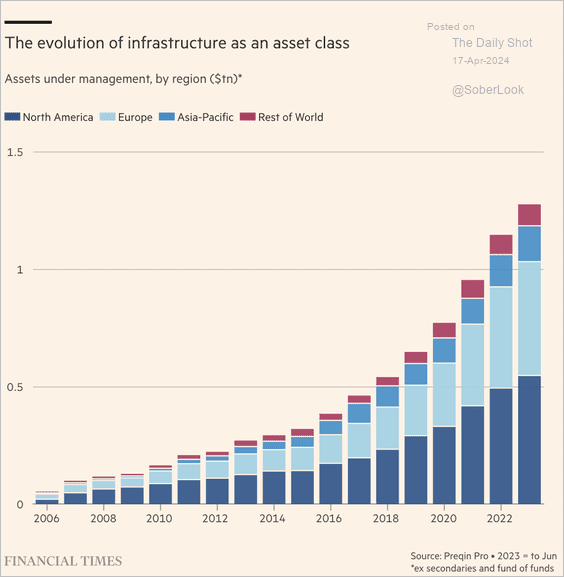 Source: @financialtimes Read full article
2. European mega fundraising activity accelerated last year.
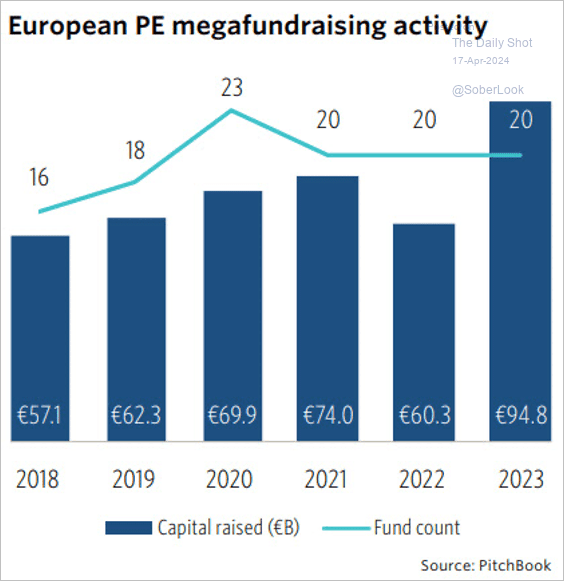 Source: PitchBook
3. Next, we have some updates on venture capital.
• Venture capital deployment has returned to its pre-COVID trend line.
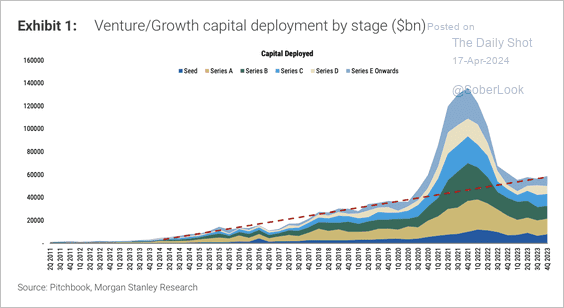 Source: Morgan Stanley Research
• Rising Treasury yields weighed on US venture capital activity in recent years.
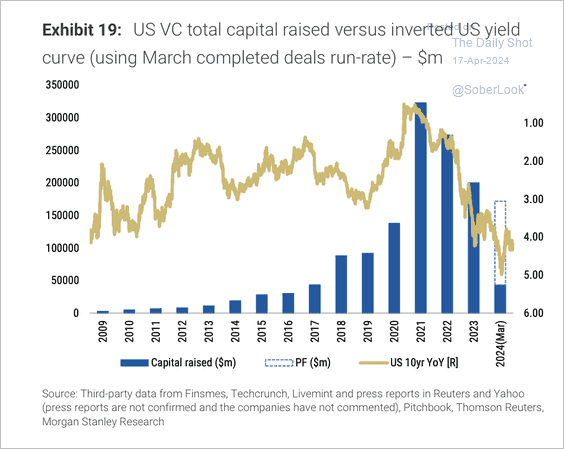 Source: Morgan Stanley Research
• US venture capital distributions remain weak, which has stifled fundraising activity.
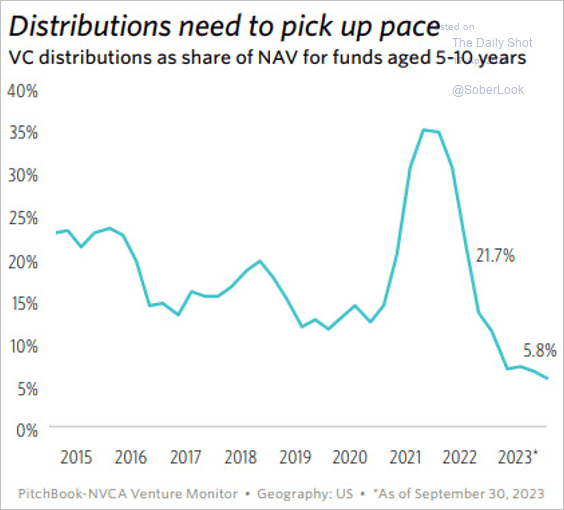 Source: PitchBook
• The Thomson Reuters US VC price index has troughed.
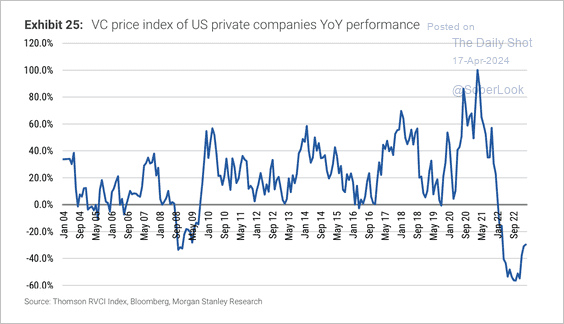 Source: Morgan Stanley Research
Back to Index
Credit
1. Commercial banks’ securities holdings reflect deposit levels.
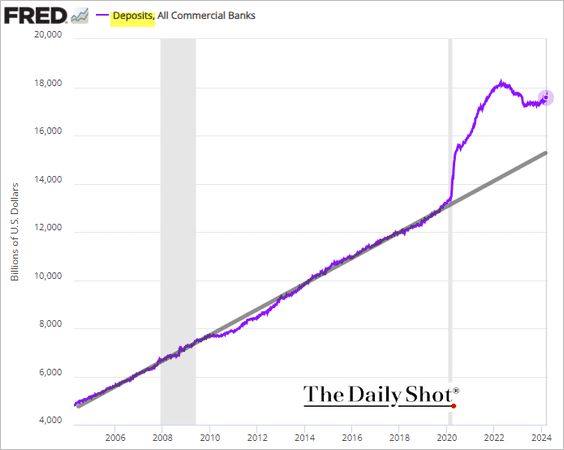
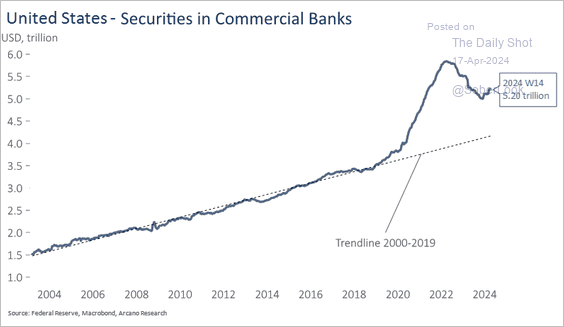 Source: Arcano Economics
——————–
2. This chart shows US banks’ exposure to commercial real estate debt, by state.
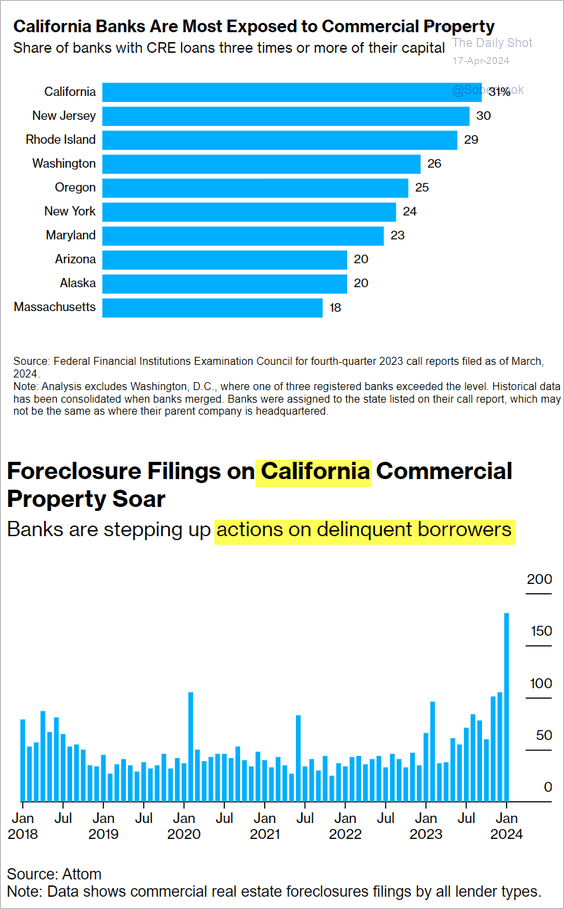 Source: @wealth Read full article
Back to Index
Rates
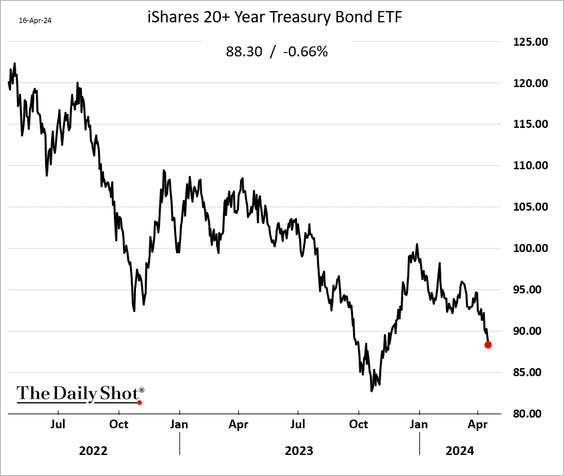
1. Treasuries remain under pressure.
2. Treasury gross issuance is hitting record highs.
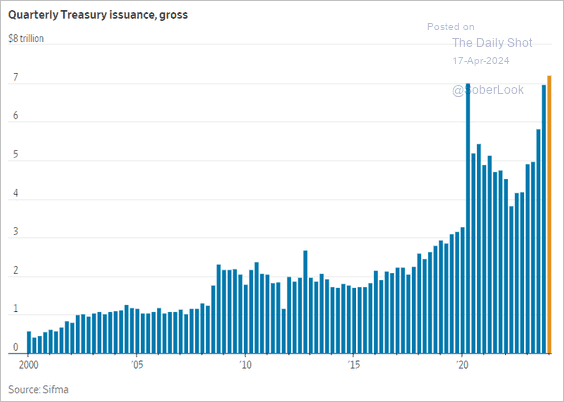 Source: @WSJ Read full article
• Surging refinancing needs over the next year are expected to increase the federal government’s interest expense.
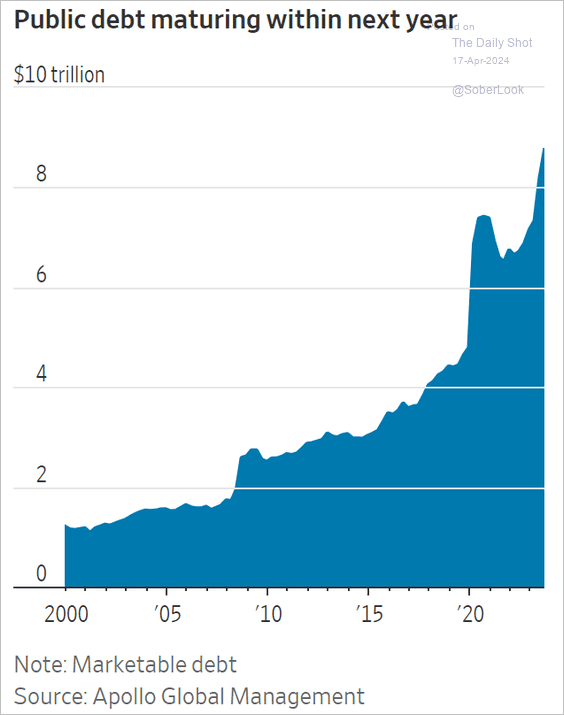 Source: @WSJ Read full article
Back to Index
Global Developments
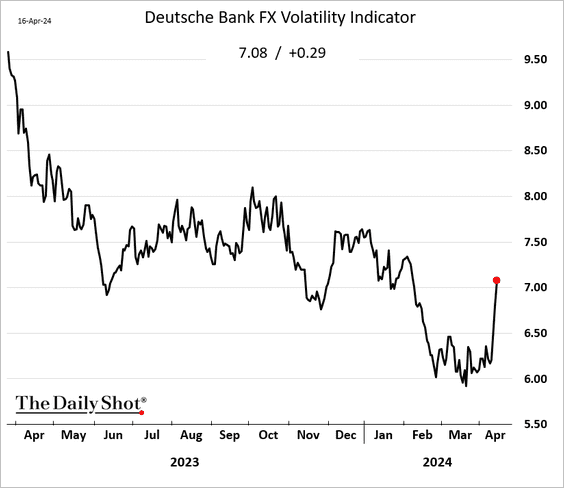
1. Implied volatility in the currency markets is rebounding.
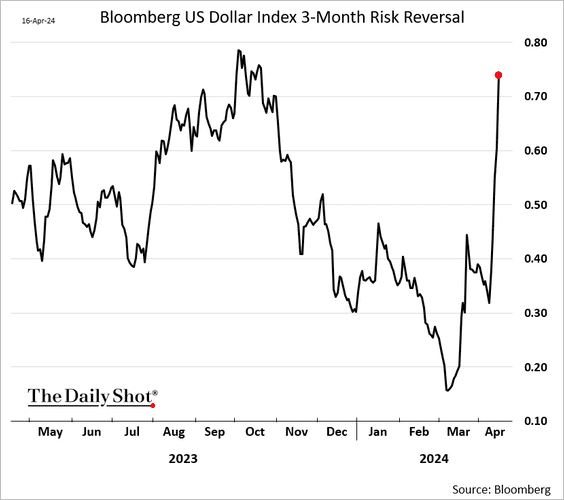
• The options market bias has increasingly been to the upside for the US dollar.
• Cyclical currencies remain in a downtrend versus the dollar.
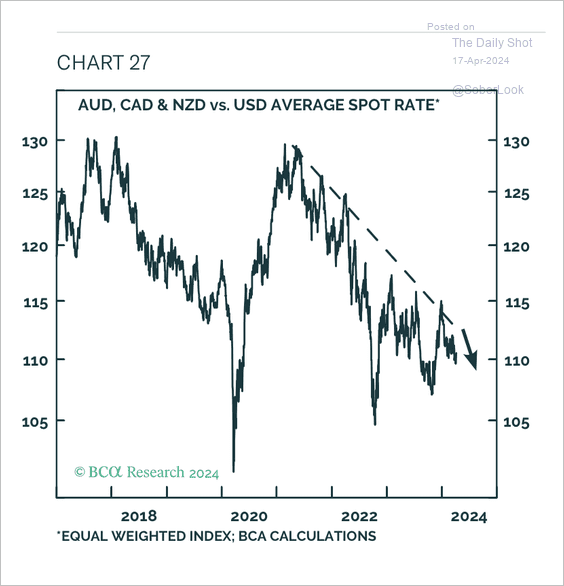 Source: BCA Research
——————–
2. Global bonds are off to a difficult start this year, although not as bad as the 2022 sell-off.
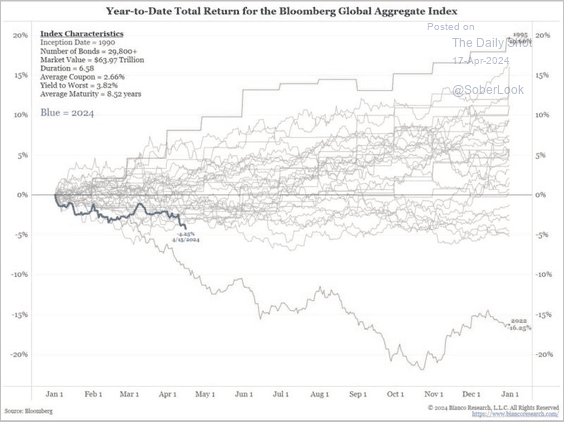 Source: Bianco Research
3. Here is a look at domestic ownership of government bonds.
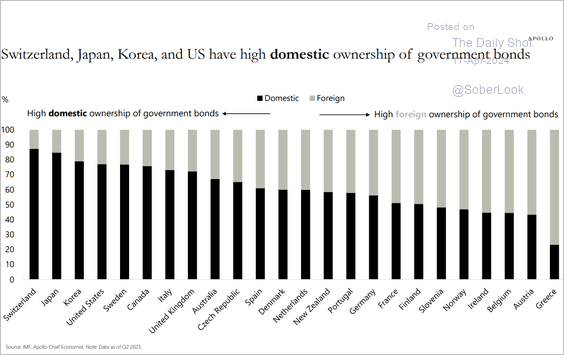 Source: Torsten Slok, Apollo
4. This scatterplot shows grains allocation for human consumption versus GDP per capita.
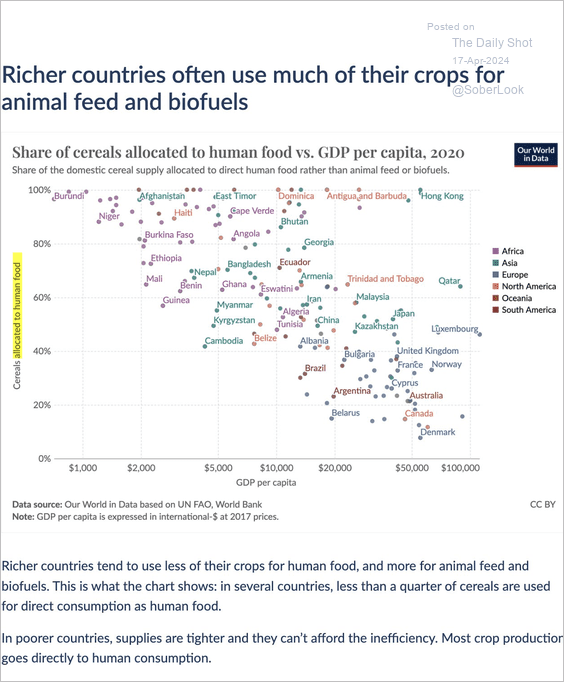 Source: Our World in Data Read full article
——————–
Food for Thought
1. Fast food price inflation:
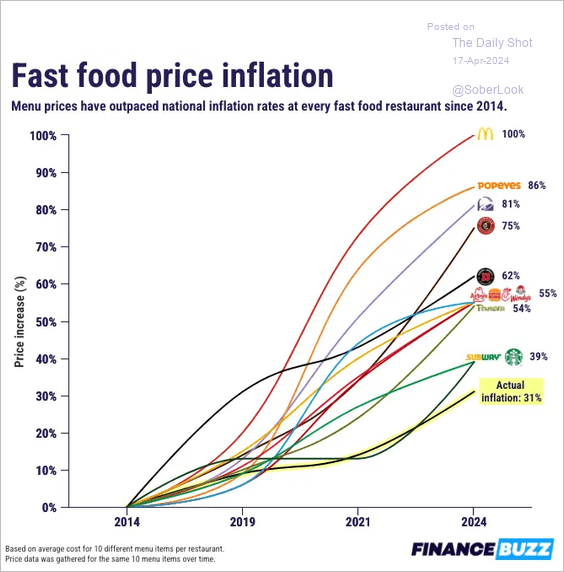 Source: FinanceBuzz
2. Labor force participation index for US workers aged 55 and older by educational attainment:
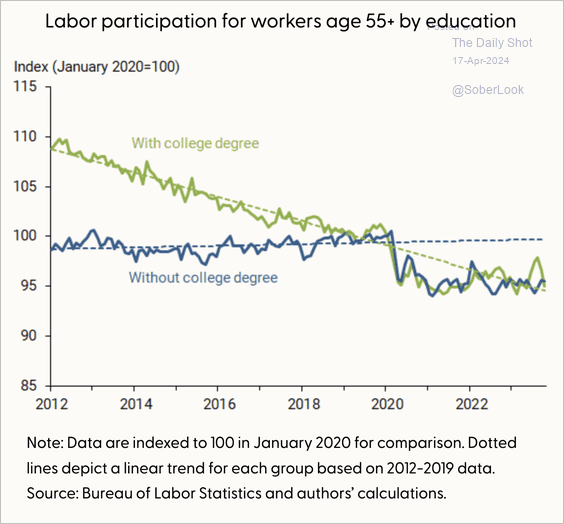 Source: Federal Reserve Bank of San Francisco Read full article
3. Lottery spending by income level across US zip codes:
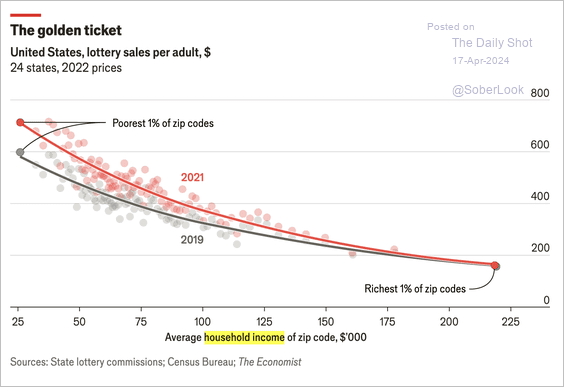 Source: The Economist Read full article
4. Global predictions and preferences for the US presidential election:
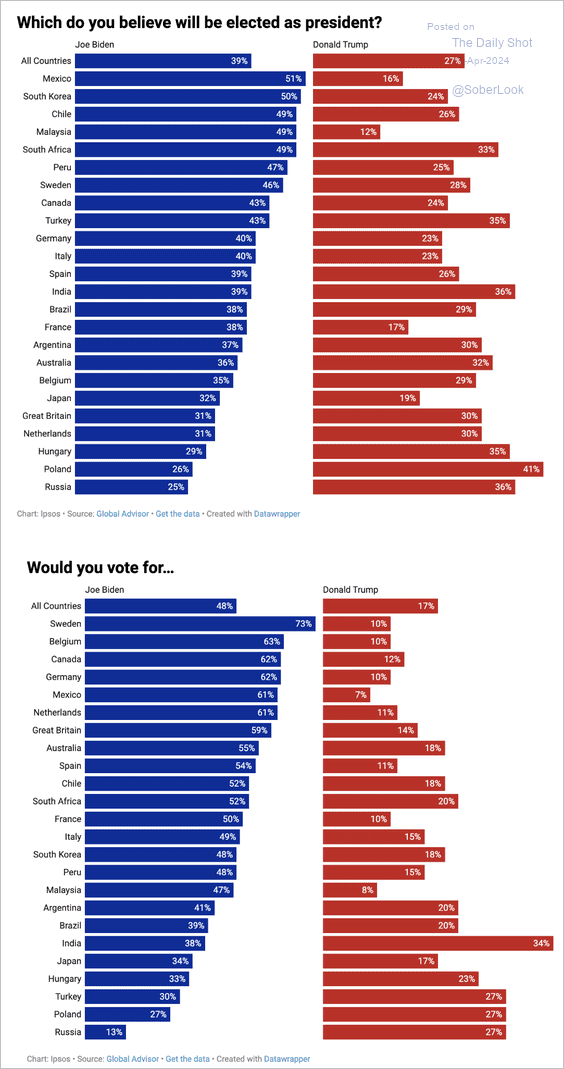 Source: Ipsos Read full article
5. Populist parties in Europe:
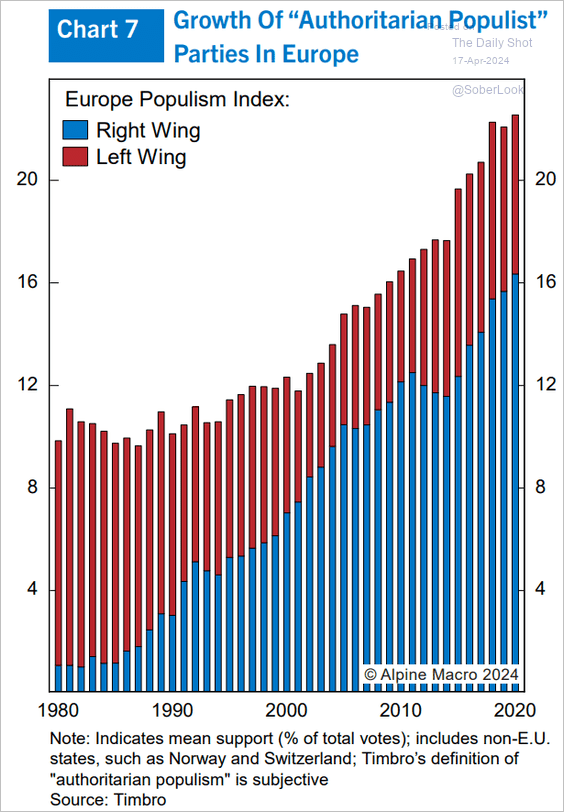 Source: Alpine Macro
6. Trend in medication-induced abortions as a percentage of total abortions in the US:
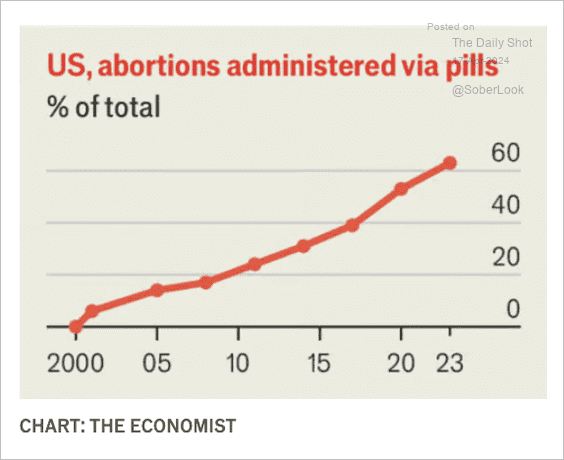 Source: The Economist Read full article
7. Broadway show attendance:
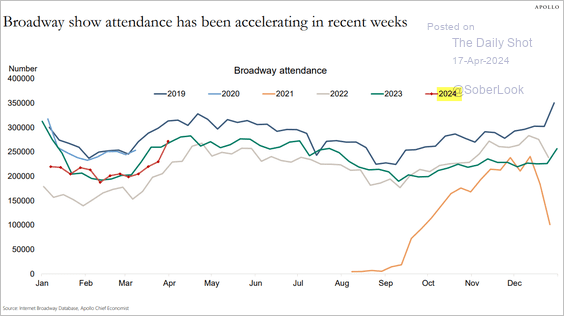 Source: Torsten Slok, Apollo
——————–
Back to Index