
The Daily Shot: 18-Mar-24
• The United States
• Canada
• The United Kingdom
• The Eurozone
• Europe
• China
• Emerging Markets
• Cryptocurrency
• Commodities
• Energy
• Equities
• Credit
• Global Developments
• Food for Thought
The United States
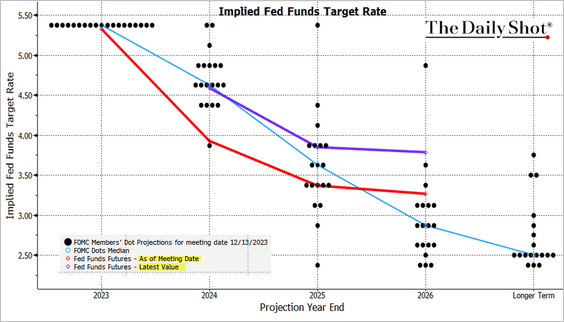
1. Market expectations for the Fed’s policy rate trajectory have moved up substantially since the last projections were published in December. Will the Fed’s new dot plot shift higher?
 Source: @TheTerminal, Bloomberg Finance L.P.
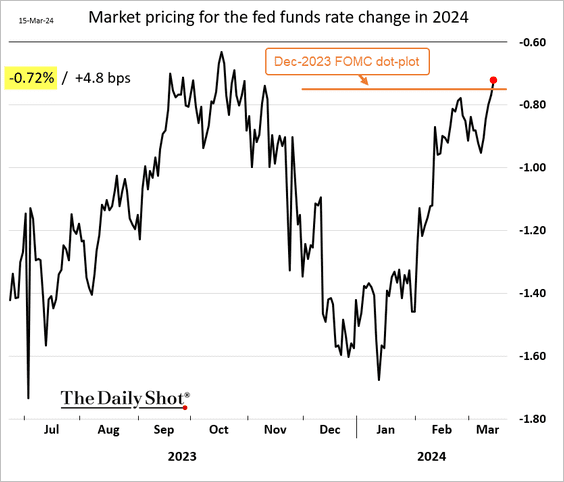
• The market now expects a smaller rate cut this year than the FOMC’s last dot plot.
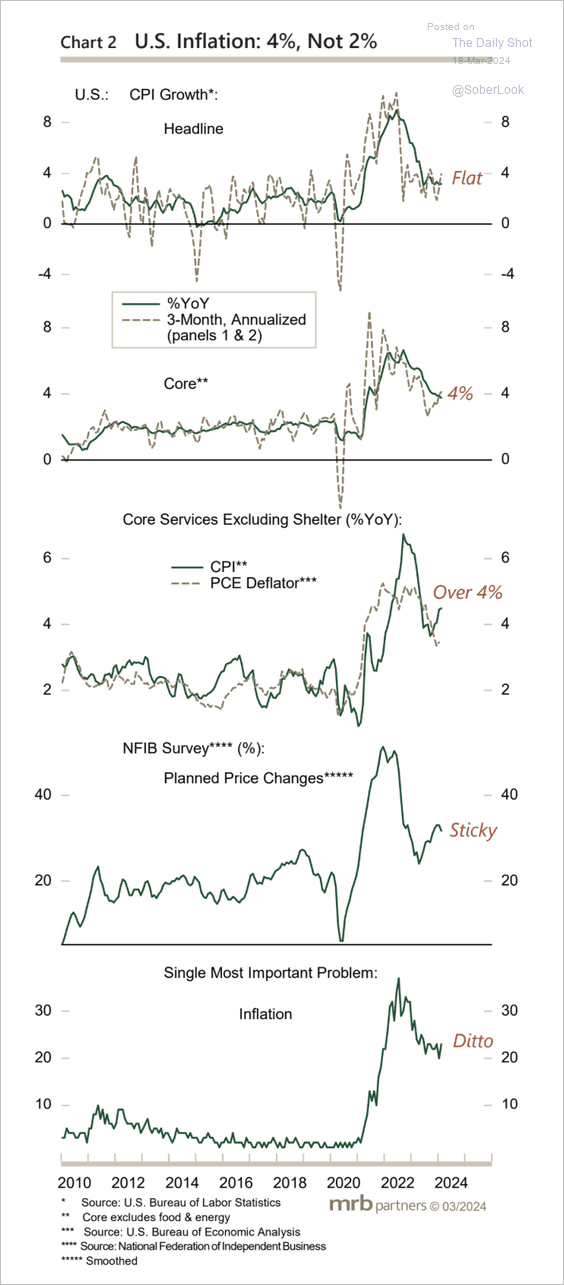
• Underlying inflation measures remain sticky, which could delay rate cuts.
 Source: MRB Partners
• Treasury yields surged last week, reflecting a growing ‘higher for longer’ interest rate sentiment.
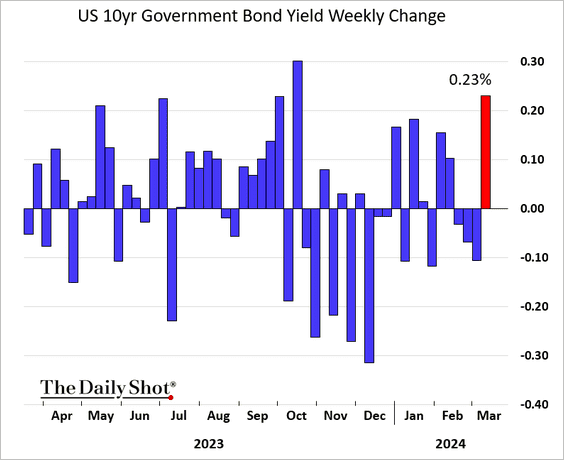
• Traders are trimming their bets on rate cuts.
 Source: Deutsche Bank Research
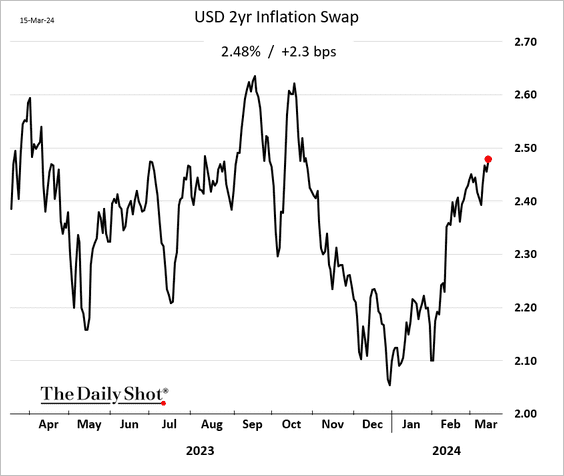
• Market-based inflation expectations have been rising with crude oil prices.
——————–
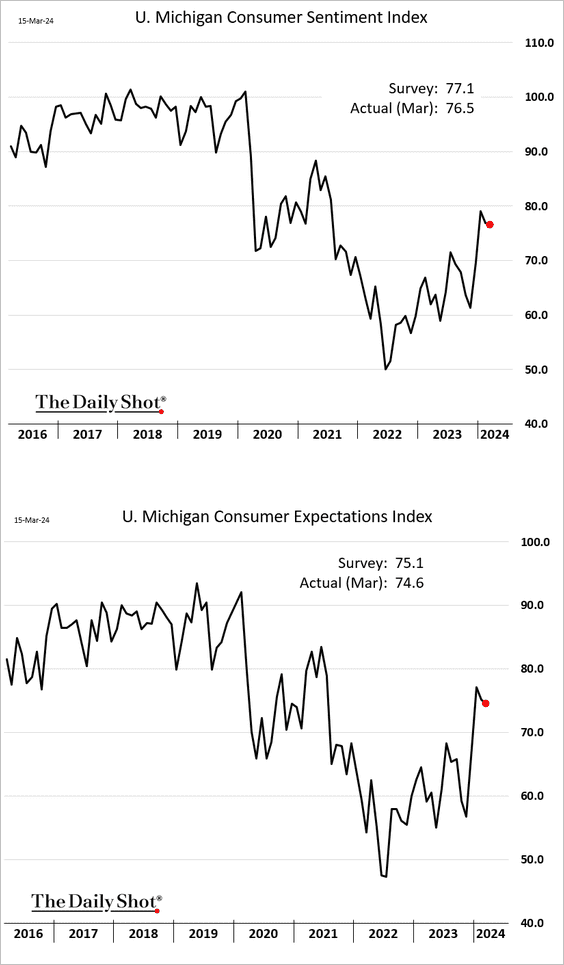
2. The U. Michigan consumer sentiment index edged lower this month.
 Source: @TheTerminal, Bloomberg Finance L.P.
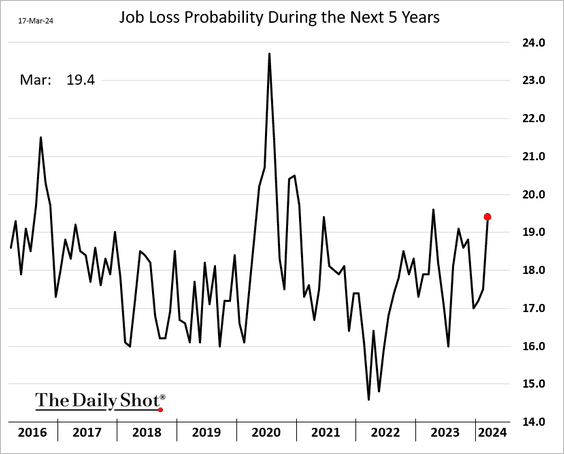
• Concerns over potential job loss in the next five years have intensified.
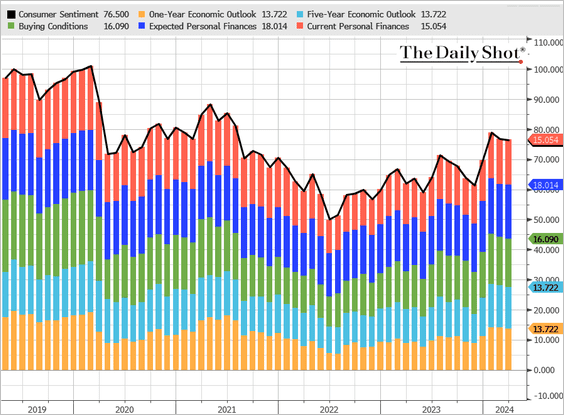
• However, expectations of households’ financial situation improved as stocks surged.
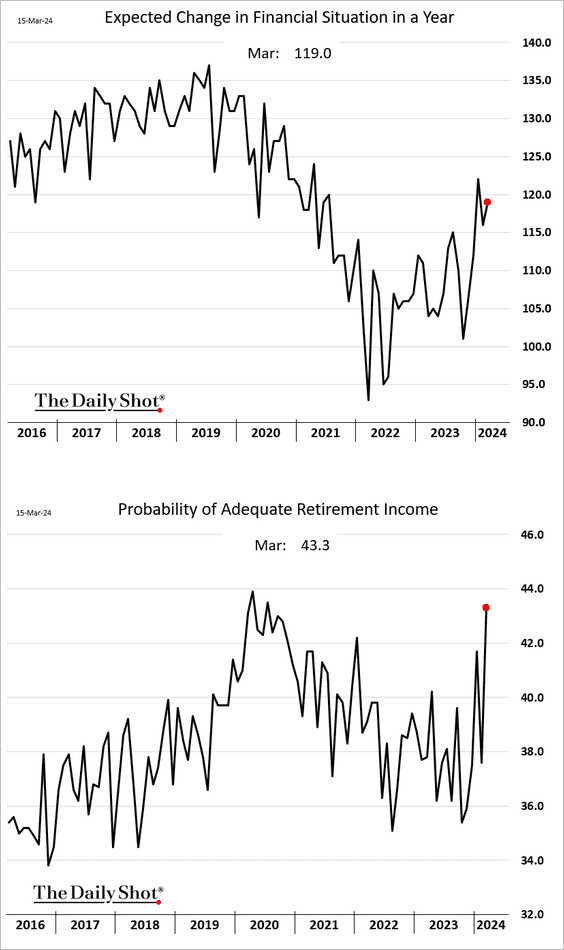
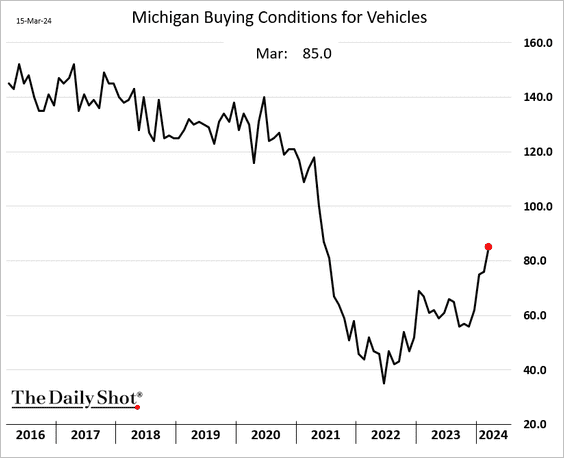
• Buying conditions for vehicles continue to move higher.
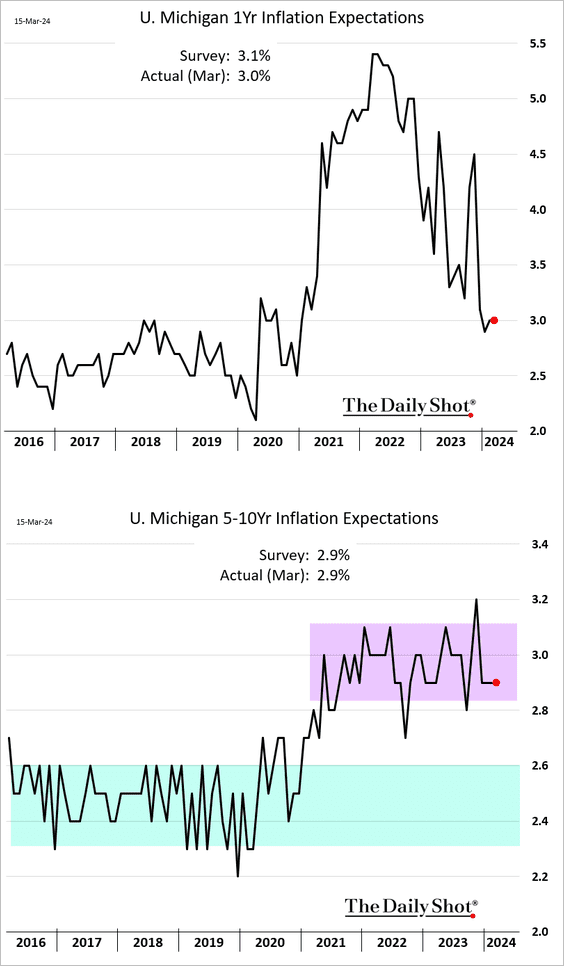
• Inflation expectations were roughly unchanged.
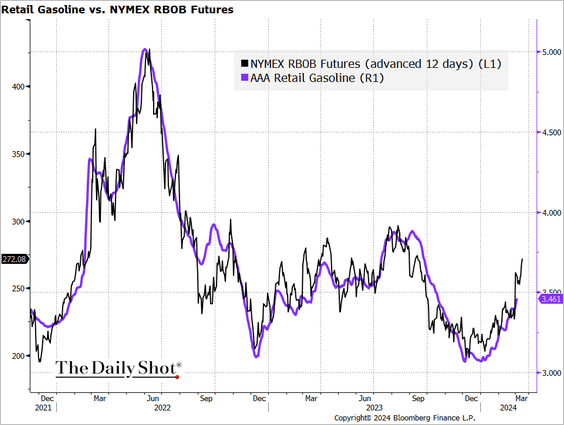
Inflation expectations could be revised upwards later this month due to rising gasoline prices. Futures indicate an increase in pump prices in the coming days.
 Source: @TheTerminal, Bloomberg Finance L.P.
——————–
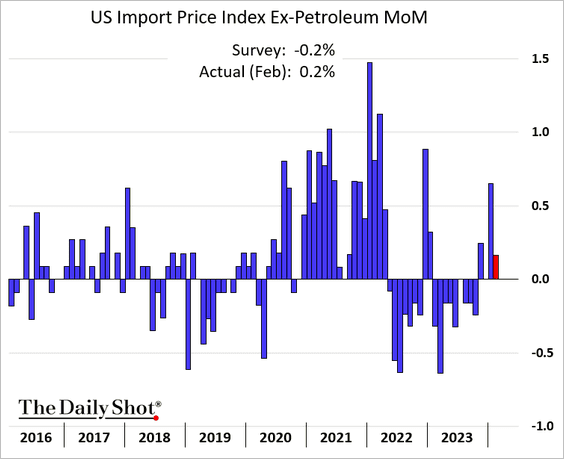
3. US import prices (ex petroleum) unexpectedly climbed last month.
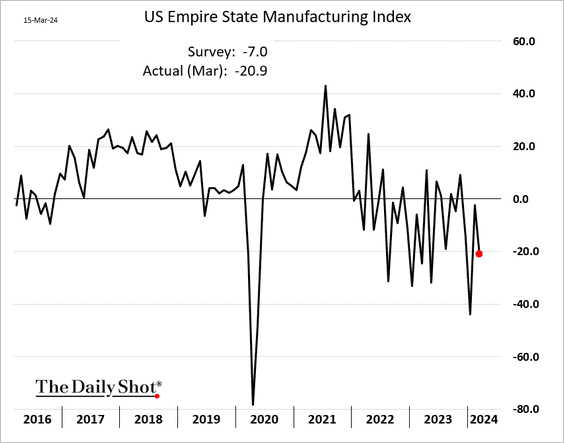
4. The NY Fed’s manufacturing index (Empire Manufacturing) moved deeper into contraction territory this month.
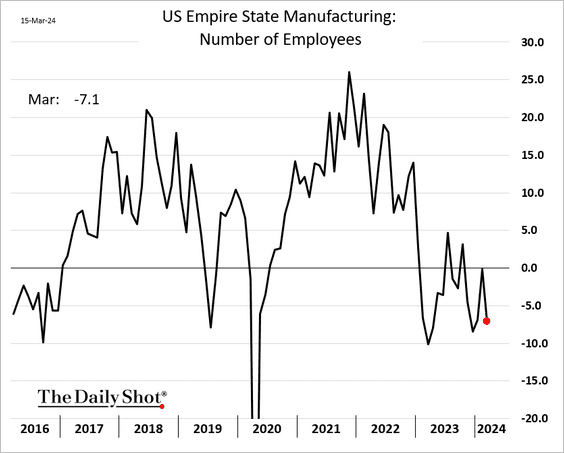
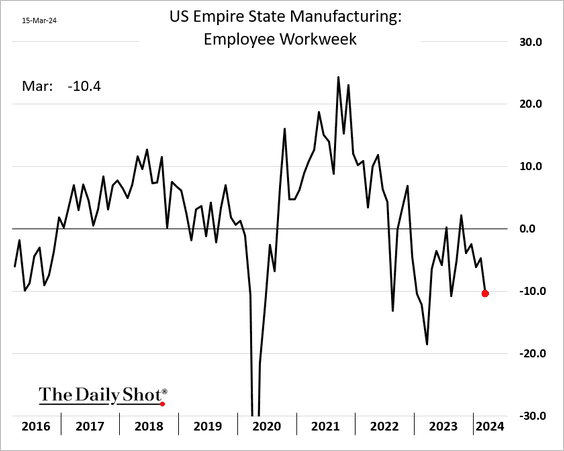
• Employment and workers’ hours declined.
• However, forward-looking indicators were more upbeat.
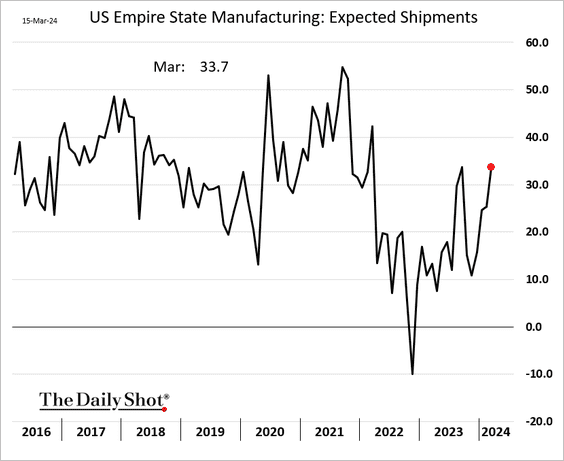
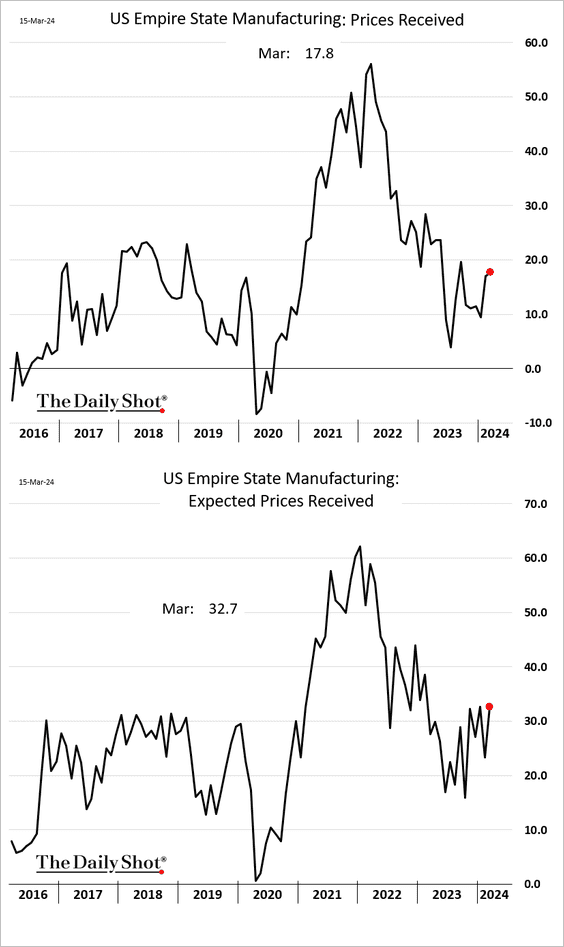
• Price indices have been trending higher.
——————–
5. The federal government’s interest expenses continue to climb.
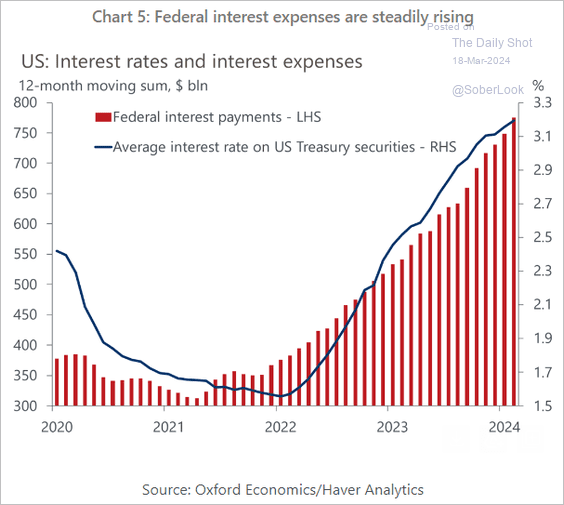 Source: Oxford Economics
Back to Index
Canada
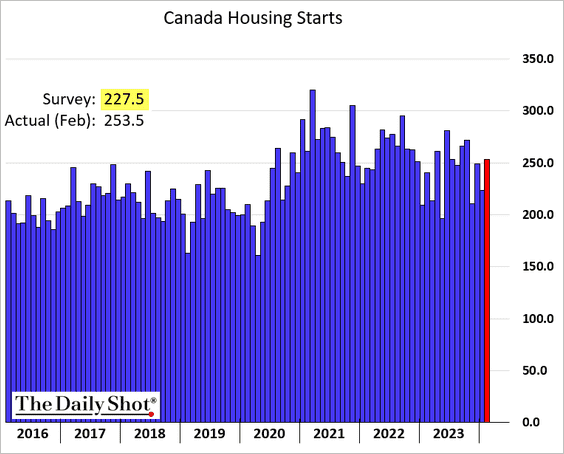
1. Housing starts were stronger than expected last month.
2. Canada’s goods trade is well below last year’s levels.
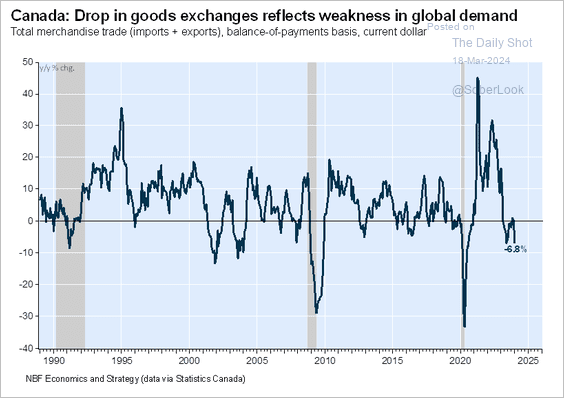 Source: Economics and Strategy Group, National Bank of Canada
Back to Index
The United Kingdom
1. Wage growth is drifting lower.
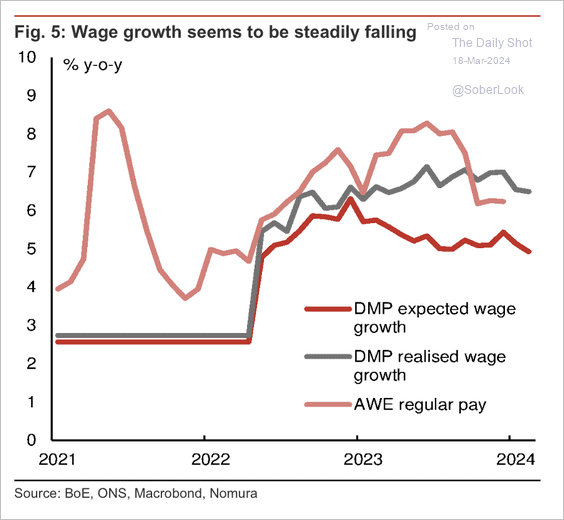 Source: Nomura Securities
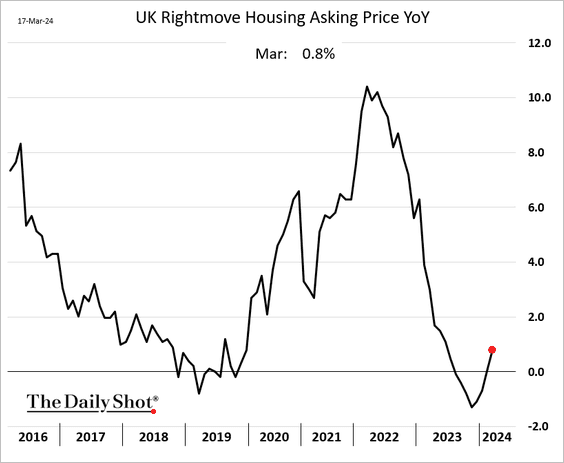
2. House prices are rebounding.
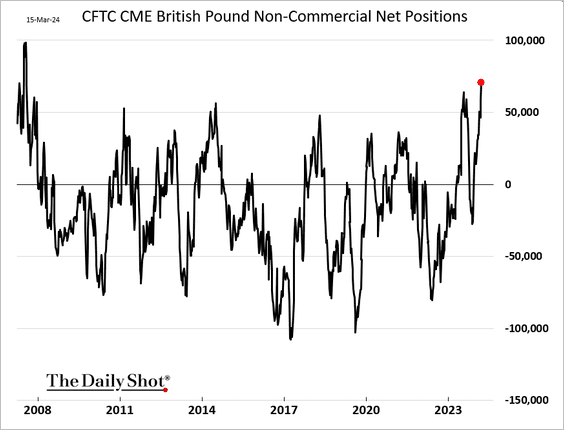
3. Traders haven’t been this bullish on the British pound (vs. USD) in a long time.
Back to Index
The Eurozone
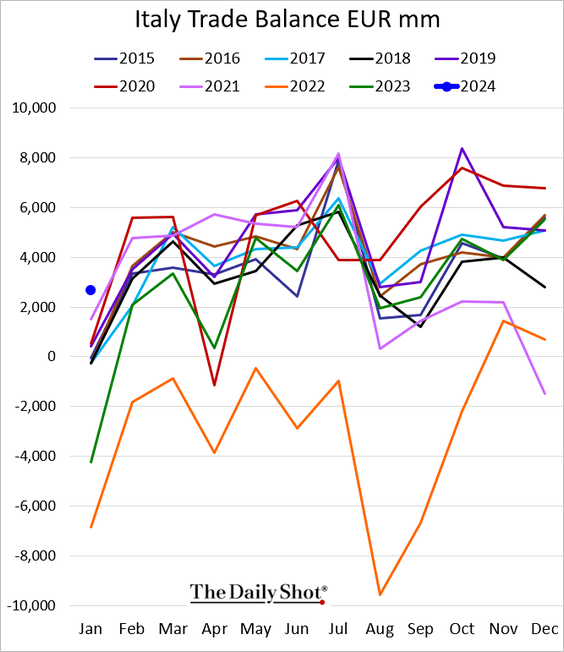
1. Italy was running a trade surplus in January.
2. Here is a look at the consensus estimates for GDP and inflation over time in the Eurozone and the US.
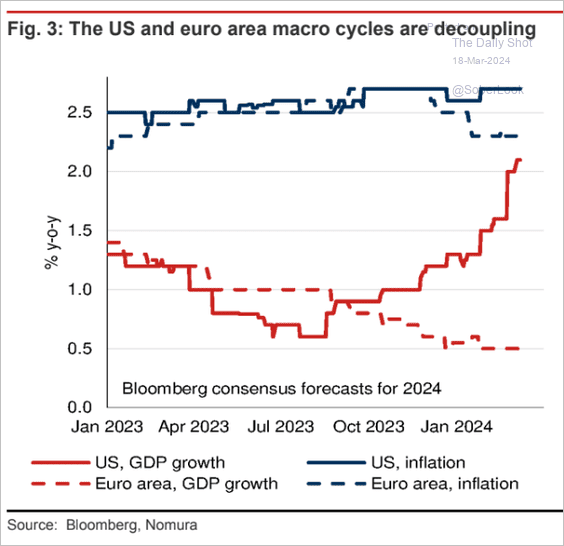 Source: Nomura Securities
• Euro-area/US economic surprises continue to diverge.
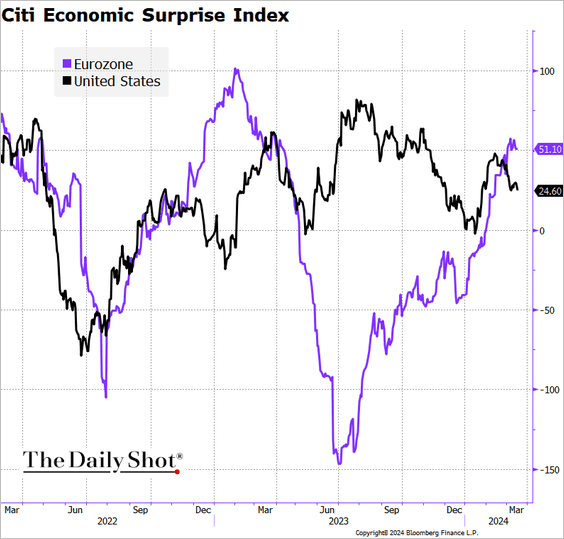 Source: @TheTerminal, Bloomberg Finance L.P.
——————–
3. Wage growth is moderating.
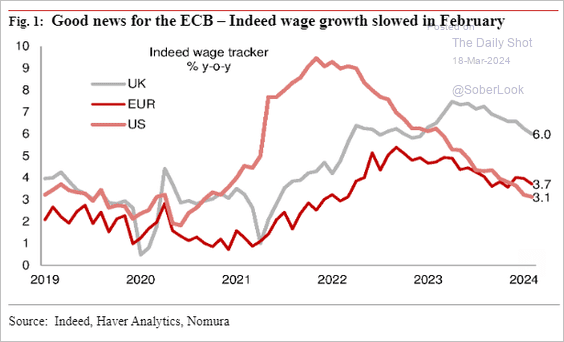 Source: Nomura Securities
Back to Index
Europe
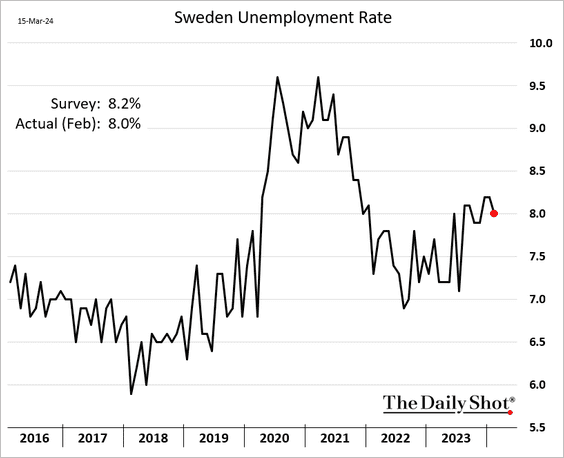
1. Sweden’s unemployment rate, which has been trending higher, declined last month.
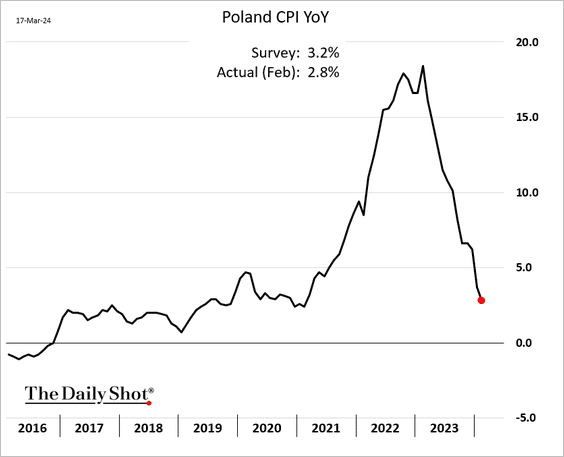
2. Poland’s inflation continues to sink.
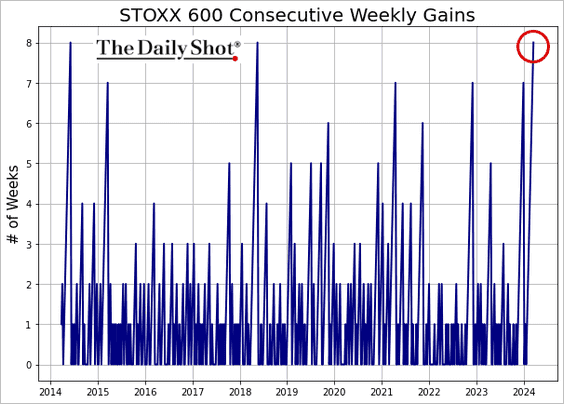
3. STOXX 600 has been up for eight weeks in a row.
4. Here is a look at overcrowding rates in European homes by country.
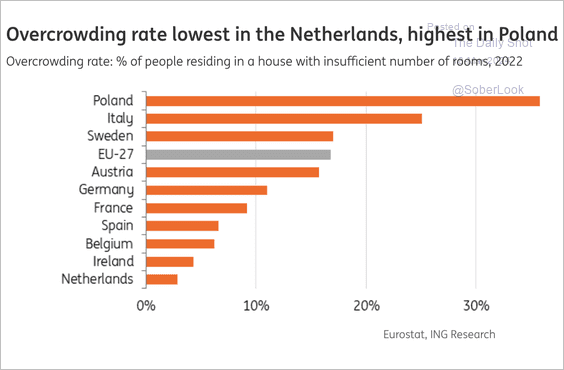 Source: ING
Back to Index
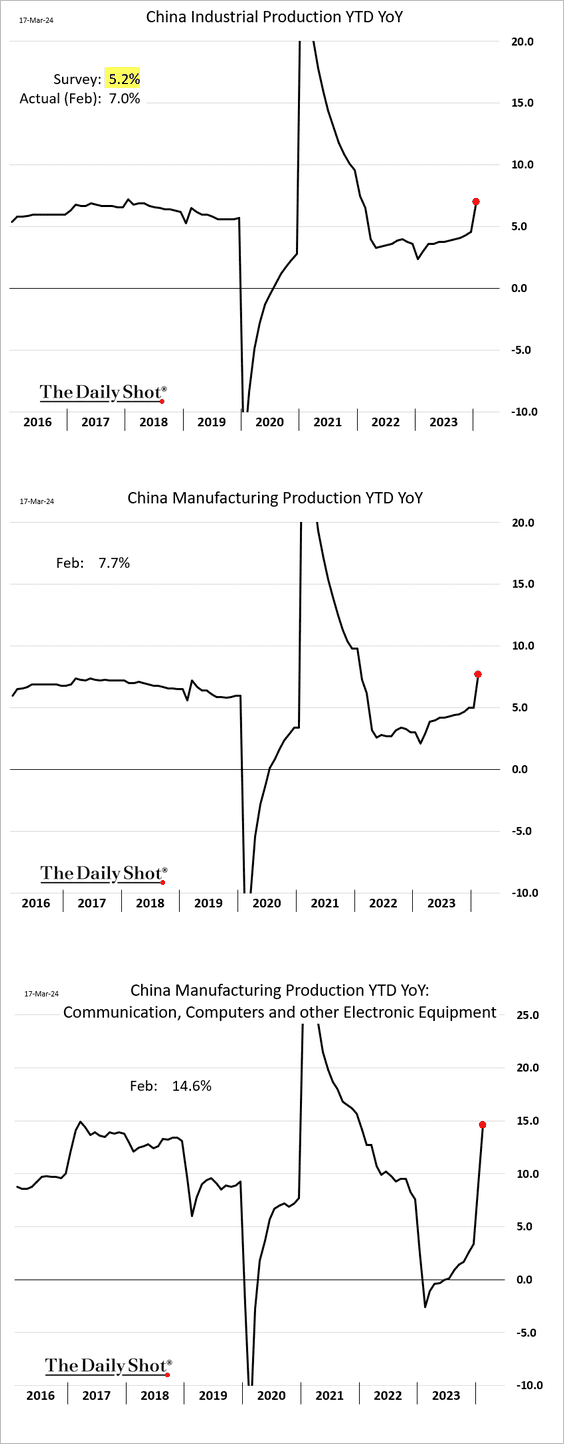
China
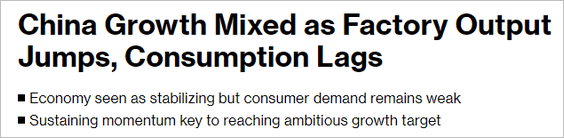
1. Industrial output surprised to the upside.
 Source: Reuters Read full article
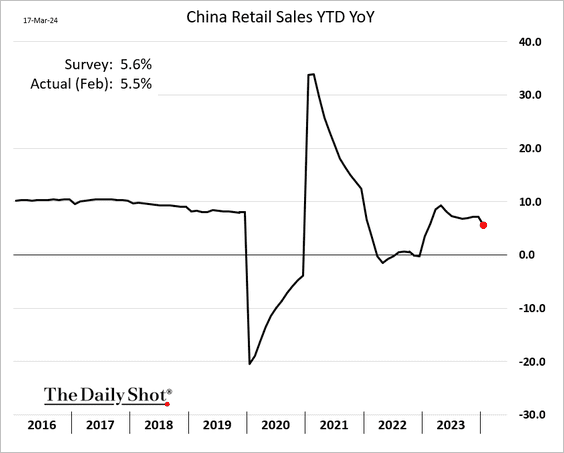
• Fixed-asset investment was also robust in the first two months of the year.
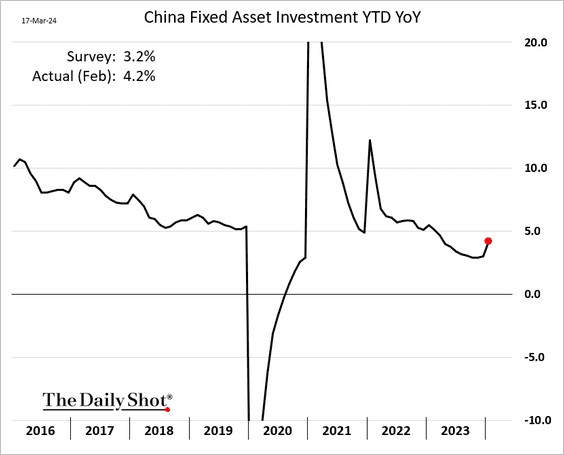
• Retail sales were roughly in line with expectations.
 Source: @economics Read full article
——————–
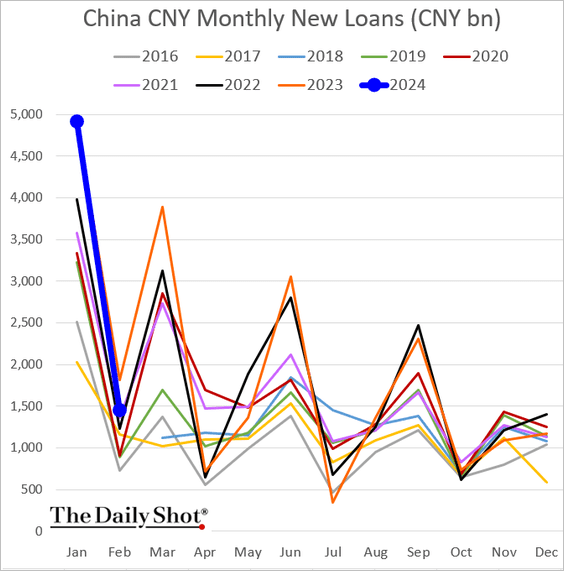
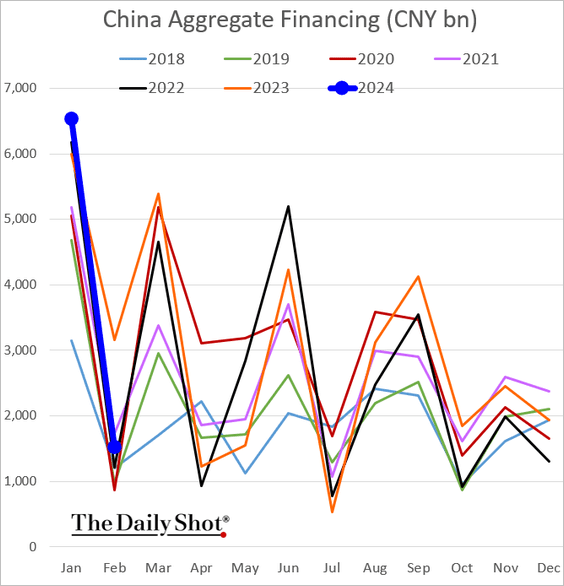
2. Credit growth slowed last month.
– Bank loans:
– Total financing:
– Year-over-year changes:
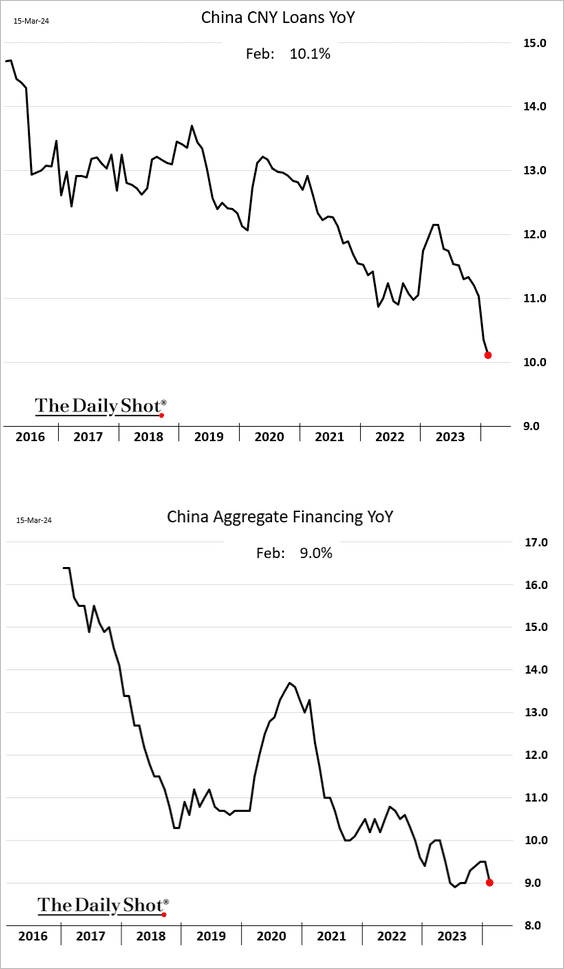
 Source: Reuters Read full article
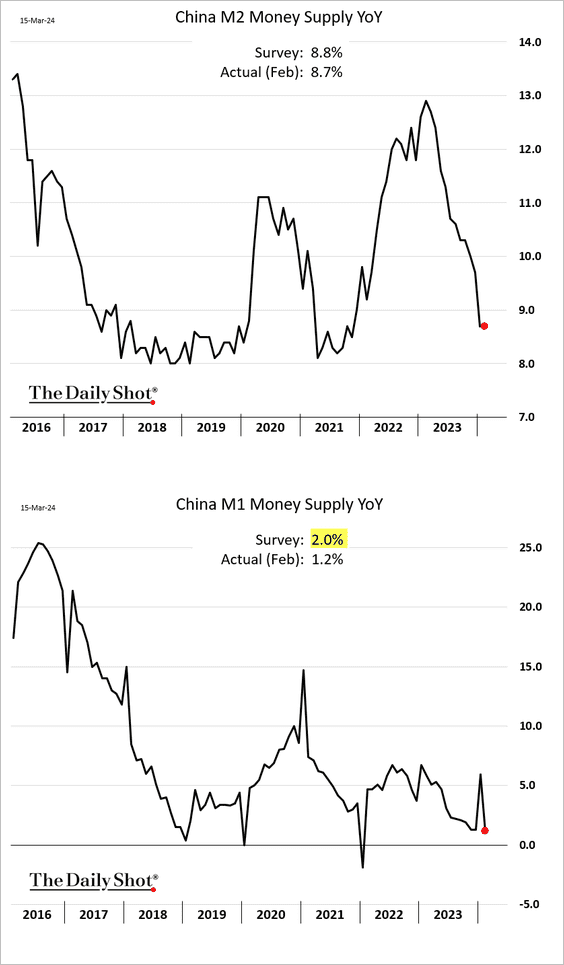
• The money supply growth has been trending lower.
——————–
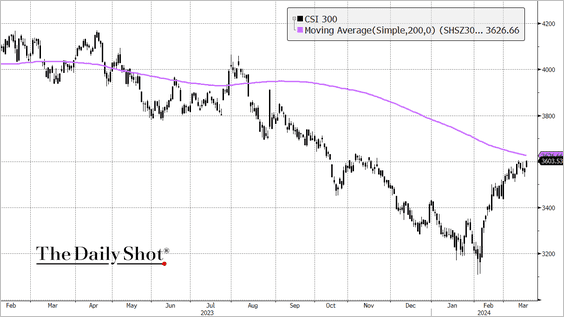
3. The CSI 300 index is nearing its 200-day moving average.
 Source: @TheTerminal, Bloomberg Finance L.P.
Back to Index
Emerging Markets
1. India’s exports jumped last month.
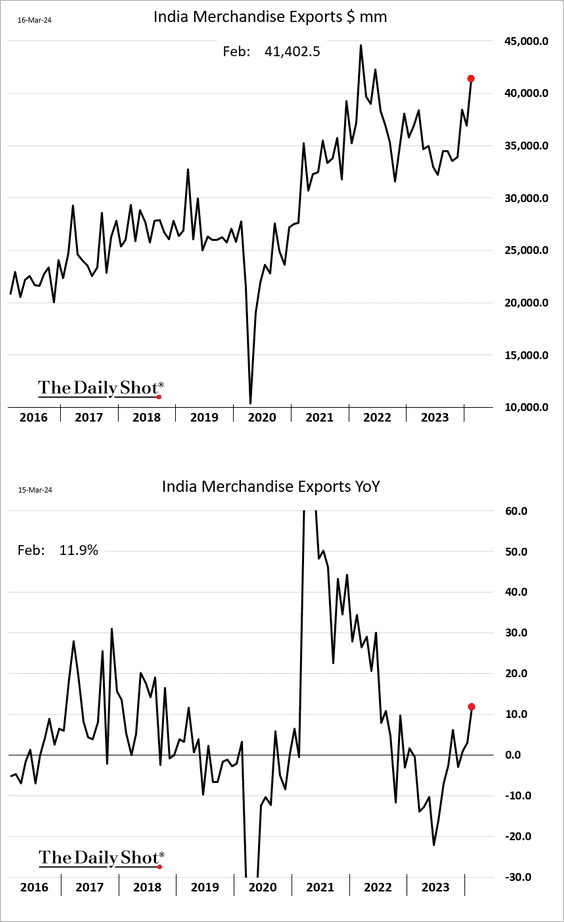
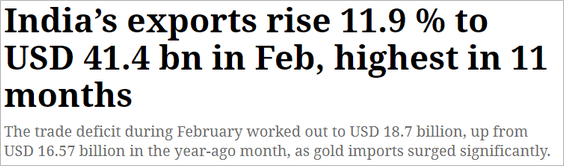 Source: The Indian Express Read full article
——————–
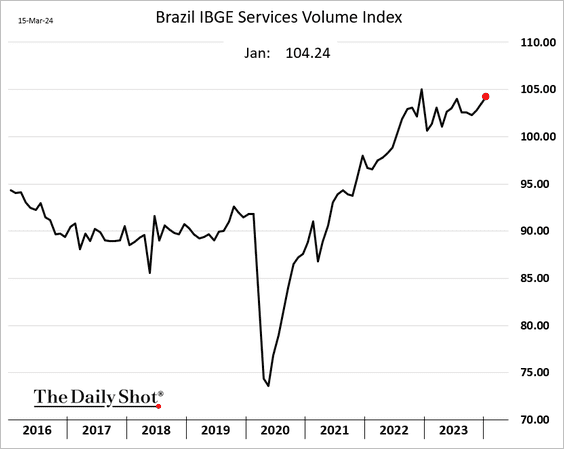
2. Brazil’s service sector output strengthened in January.
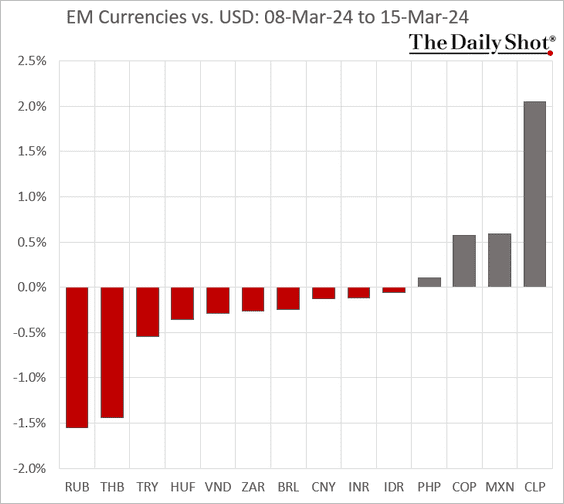
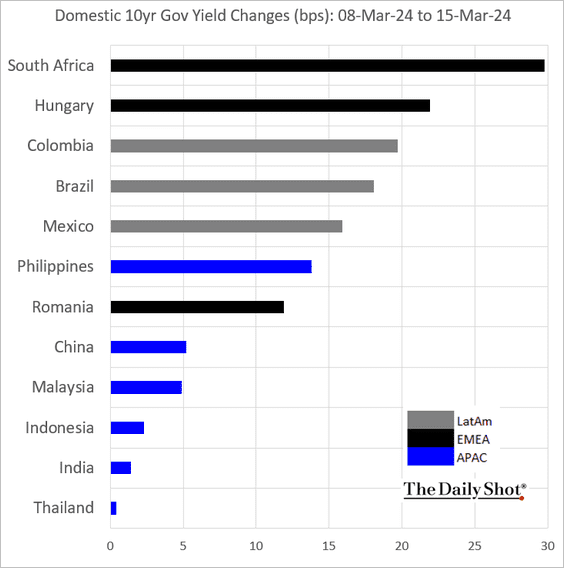
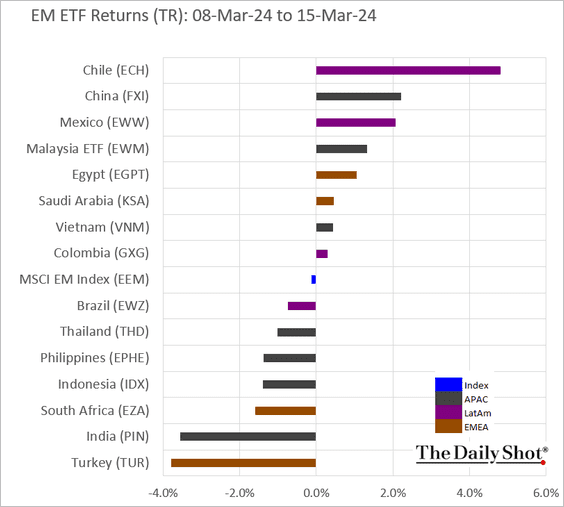
3. Here is a look at last week’s performance.
• Currencies:
• Bond yields:
• Equity ETFs:
Back to Index
Cryptocurrency
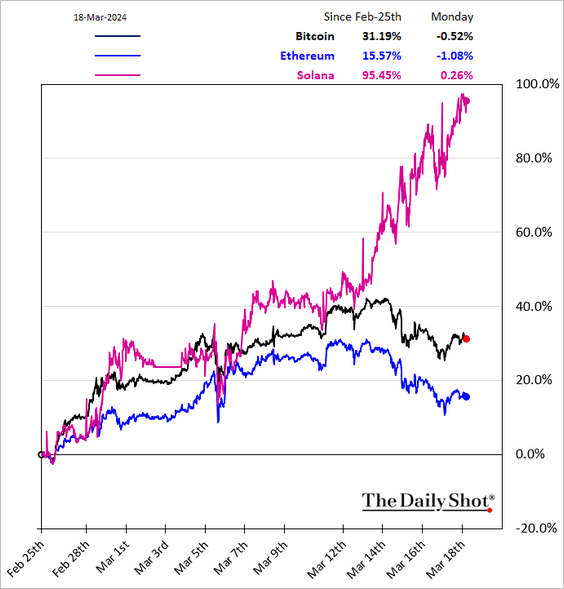
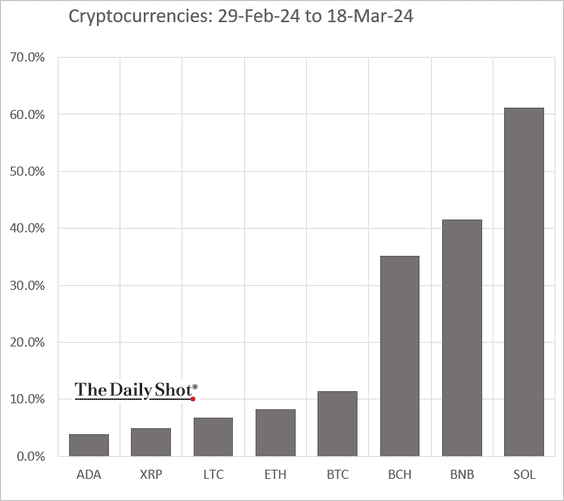
1. Solana has been surging.
 Source: crypto.news Read full article
Here is the month-to-date performance.
——————–
2. Bitcoin fund flows have diverged from gold.
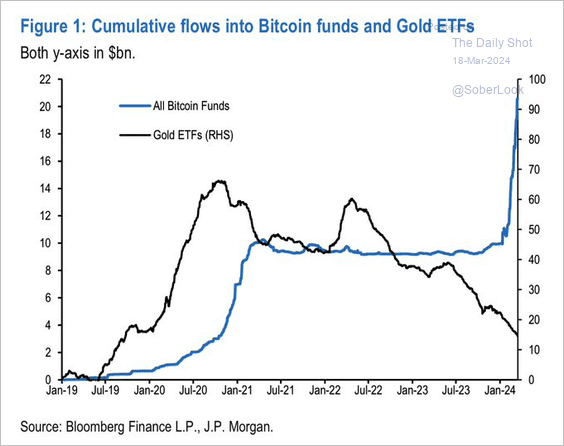 Source: JP Morgan Research; @WallStJesus
3. The trading volume in memecoins soared this month.
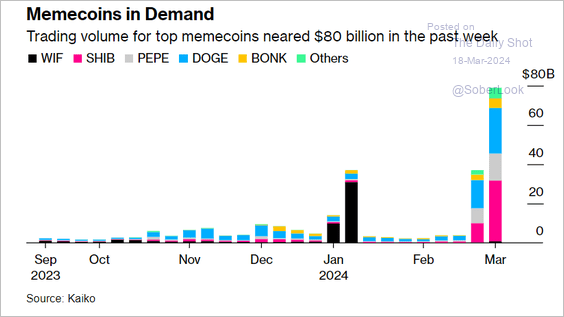 Source: @wealth Read full article
Back to Index
Commodities
1. Central banks have room to acquire more gold reserves. (2 charts)
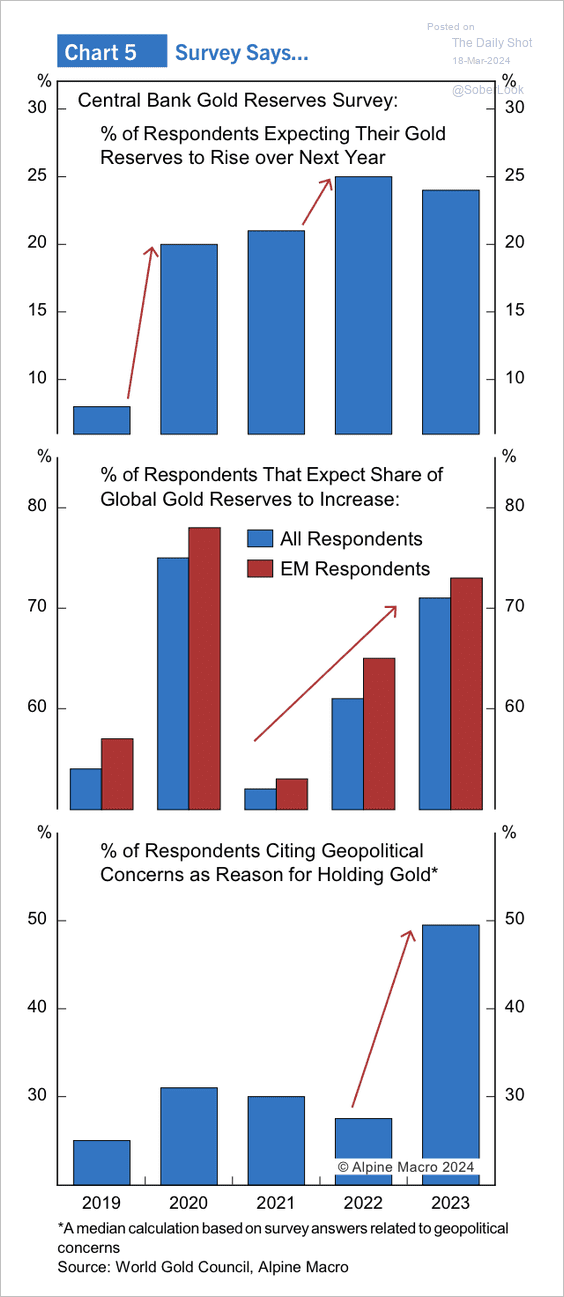 Source: Alpine Macro
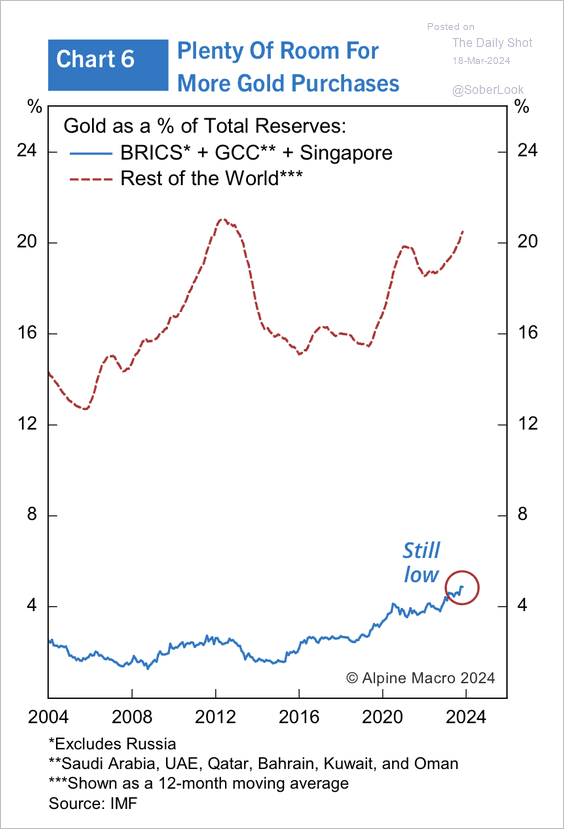 Source: Alpine Macro
——————–
2. Commodities are starting to improve relative to the S&P 500.
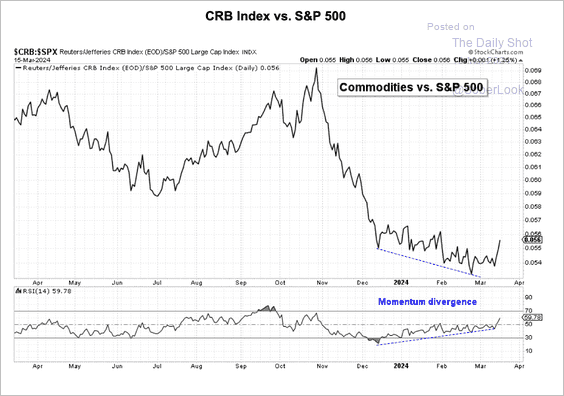 Source: Aazan Habib, Paradigm Capital
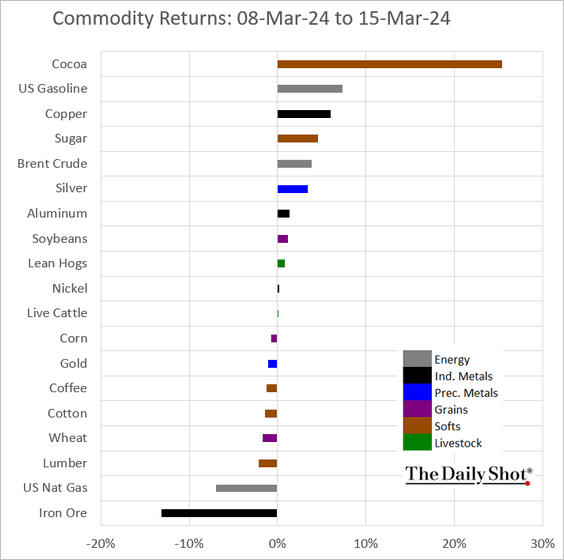
3. This chart shows last week’s performance across key commodity markets.
Back to Index
Energy
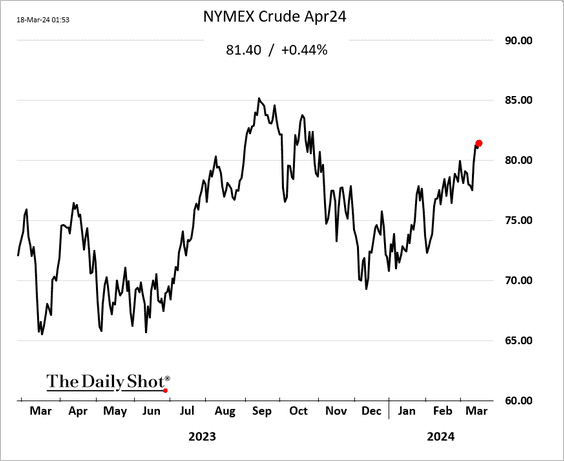
1. Crude oil futures continue to climb.
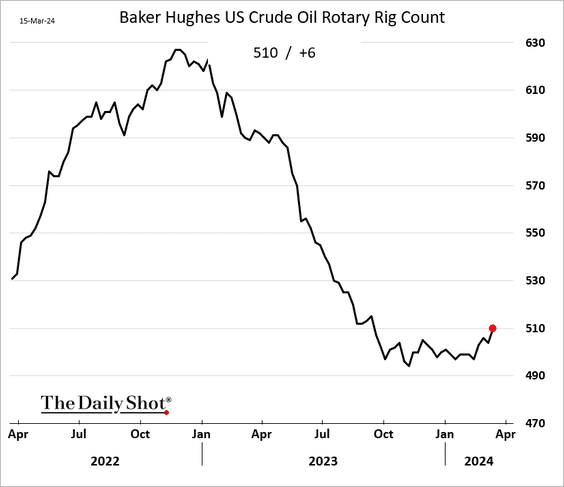
2. The US rig count is rebounding with prices.
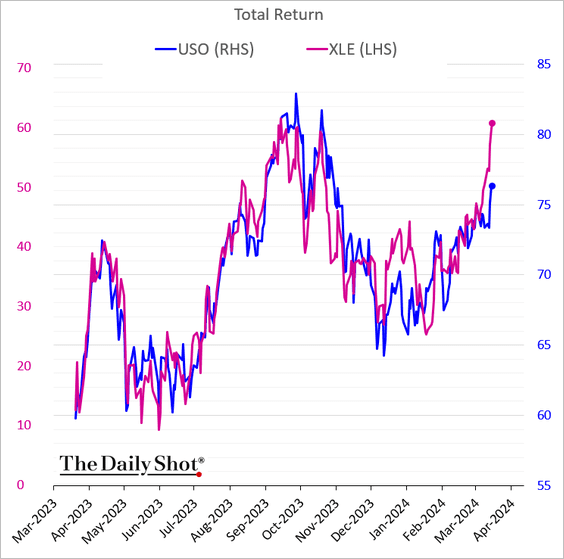
3. Energy shares have been outperforming crude oil.
4. Here is a look at the trend in global oil and gas upstream investment.
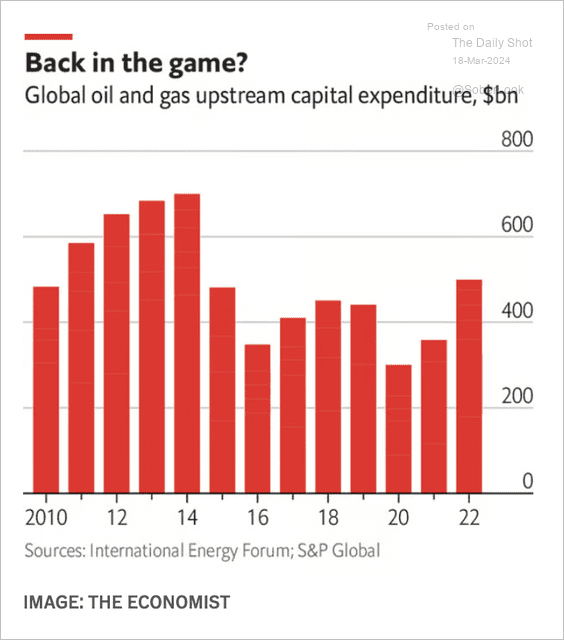 Source: The Economist Read full article
Back to Index
Equities
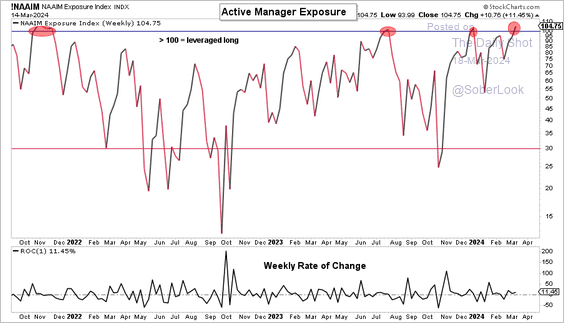
1. Bullish positioning in US equities is getting crowded.
 Source: Aazan Habib, Paradigm Capital
• Here is Goldman’s sentiment indicator.
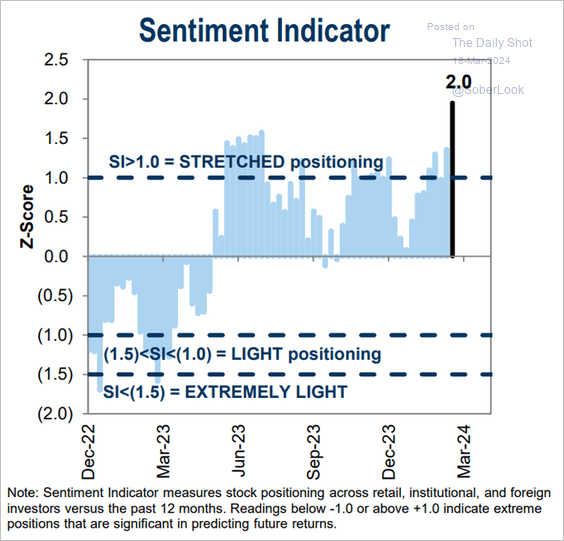 Source: Goldman Sachs; @MikeZaccardi
• The volatility skew points to market complacency setting in (the title is supposed to say “25 delta”).
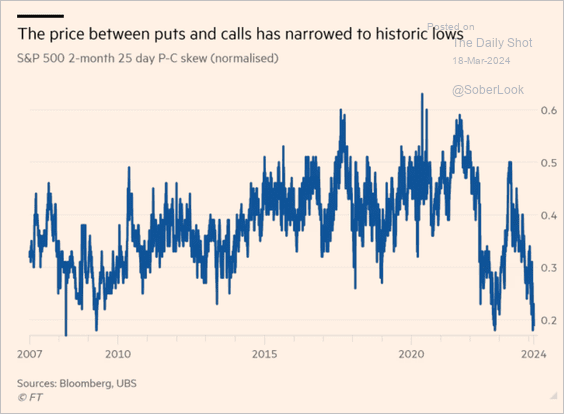 Source: @financialtimes Read full article
• Fund inflows have been surging.
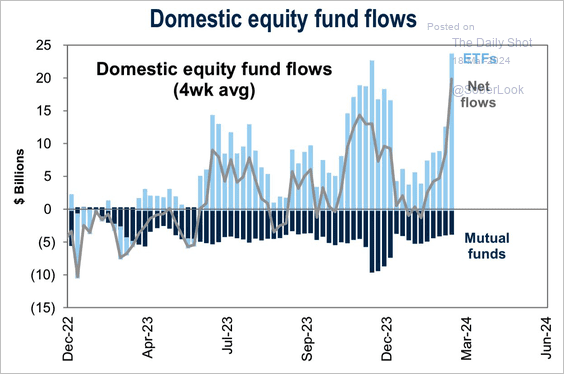 Source: Goldman Sachs; @WallStJesus
——————–
2. The following ETF segments have attracted the most funds year-to-date.
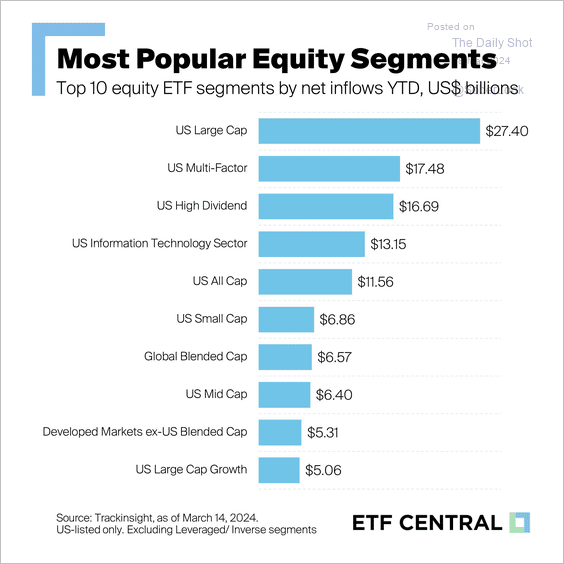 Source: The ETF Shelf
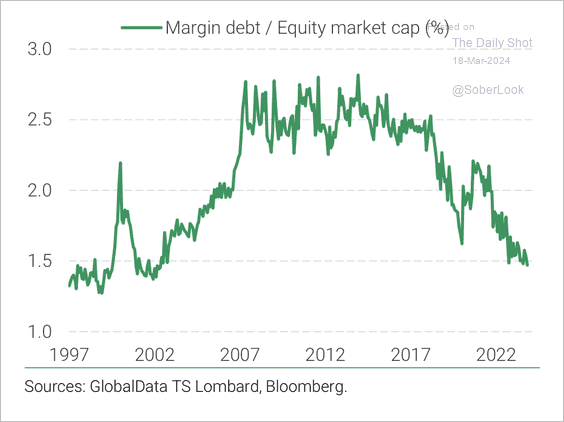
3. Unlike in 2020, margin debt has risen modestly and has declined relative to the S&P 500 market cap. (2 charts)
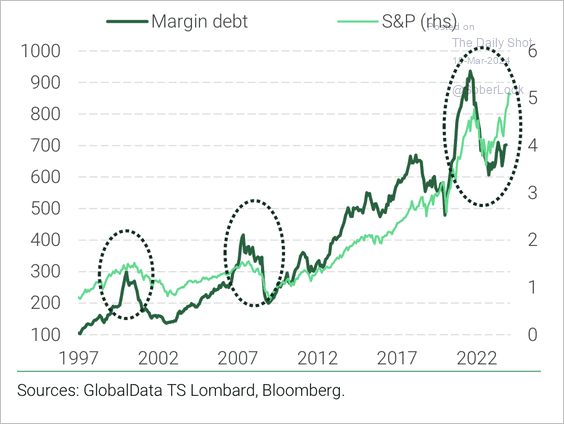 Source: TS Lombard
 Source: TS Lombard
Market leverage has shifted from margin borrowing to options.
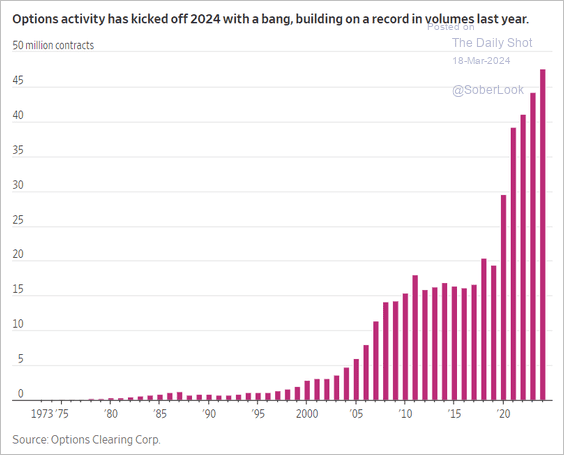 Source: @WSJ Read full article
——————–
4. US non-tech cyclicals have benefited from low financial stress.
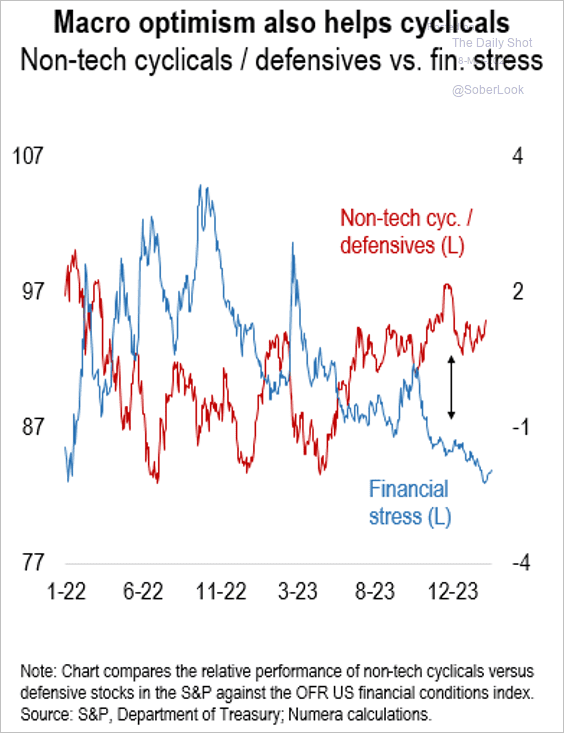 Source: Numera Analytics (@NumeraAnalytics)
5. Here is a look at activist campaigns.
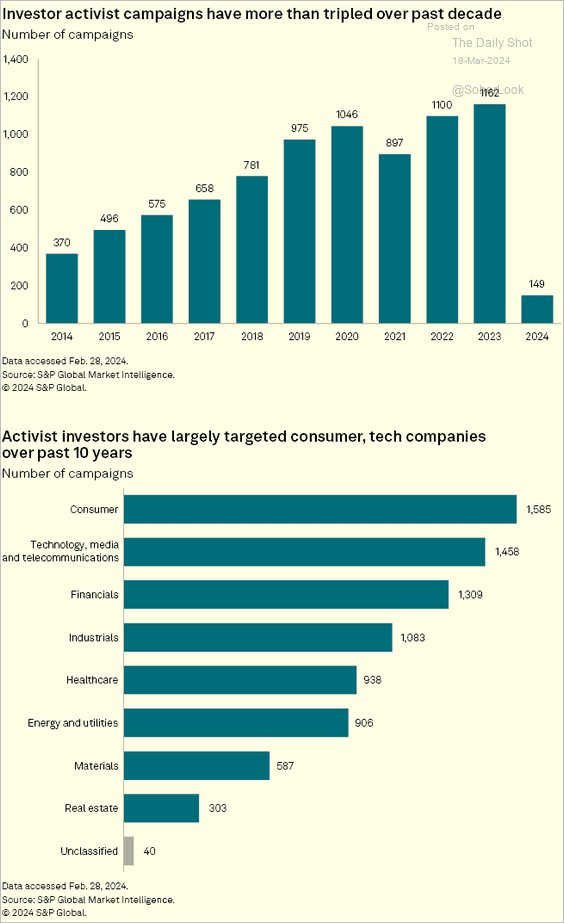 Source: S&P Global Market Intelligence
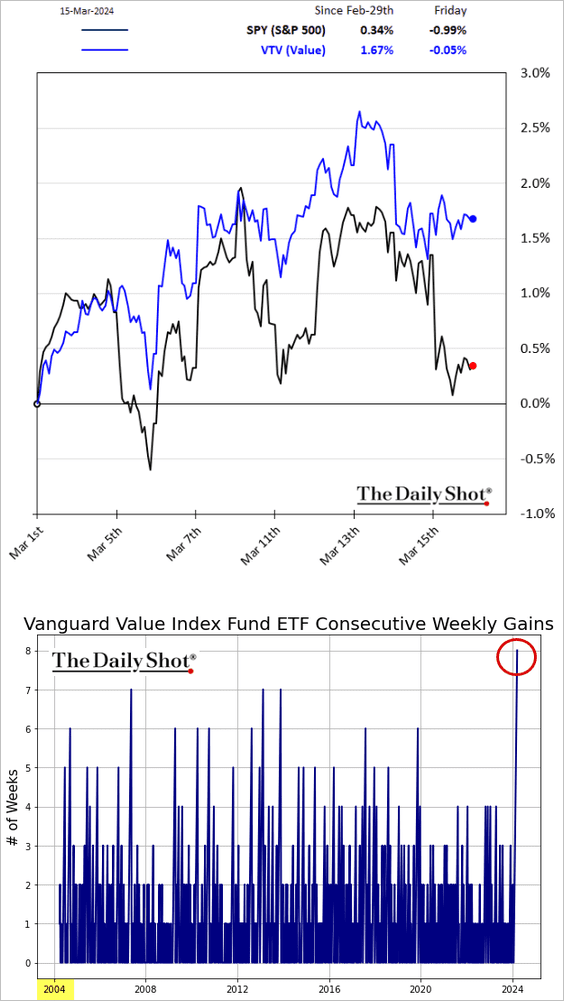
6. Value stocks have been outperforming in recent days. Vanguard’s value ETF has been up for eight weeks in a row.
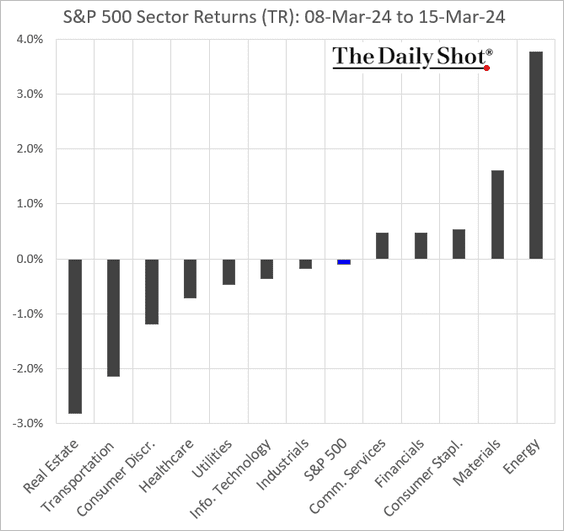
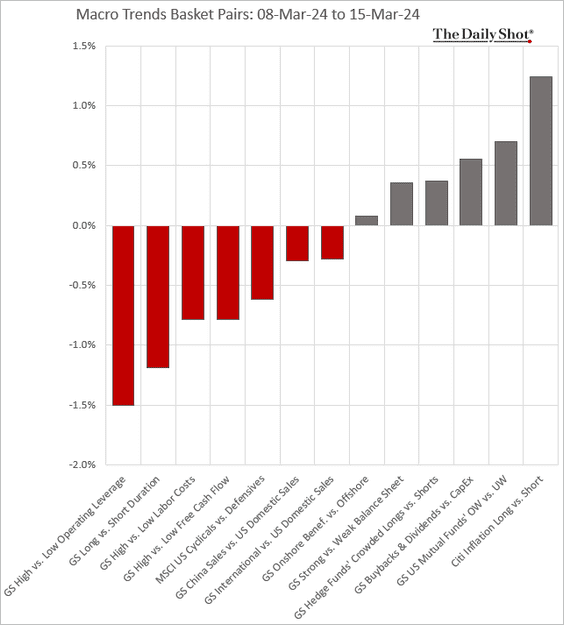
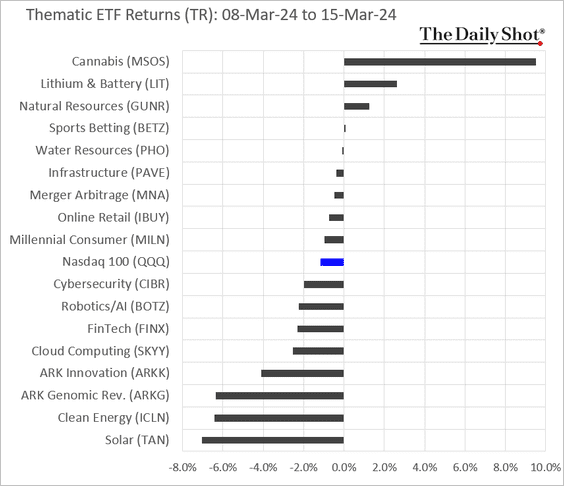
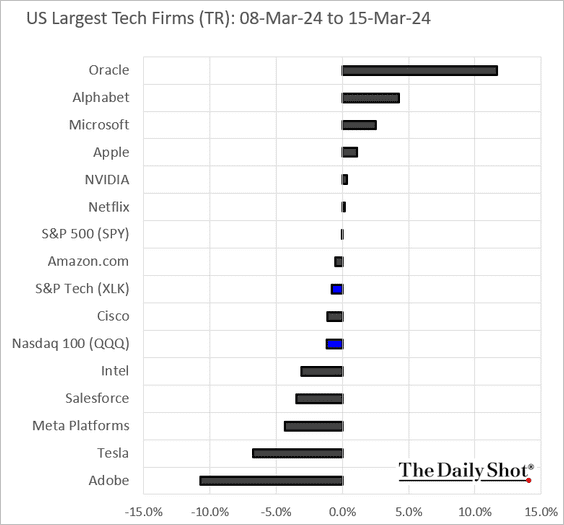
7. Next, let’s take a look at last week’s performance data.
• Sectors:
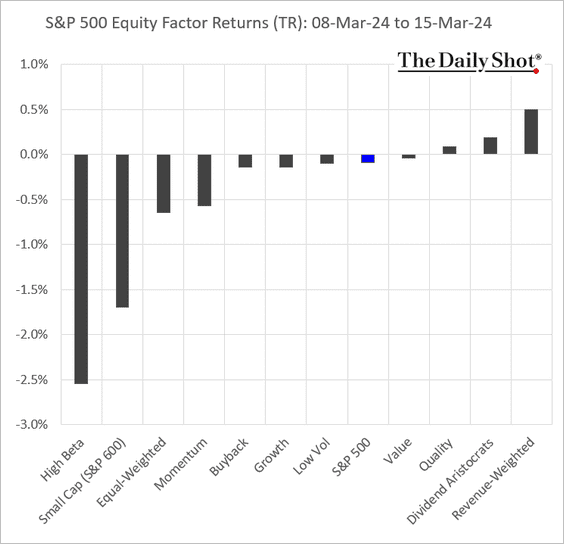
• Equity factors:
• Macro basket pairs’ relative performance:
• Thematic ETFs:
• Largest US tech firms:
Back to Index
Credit
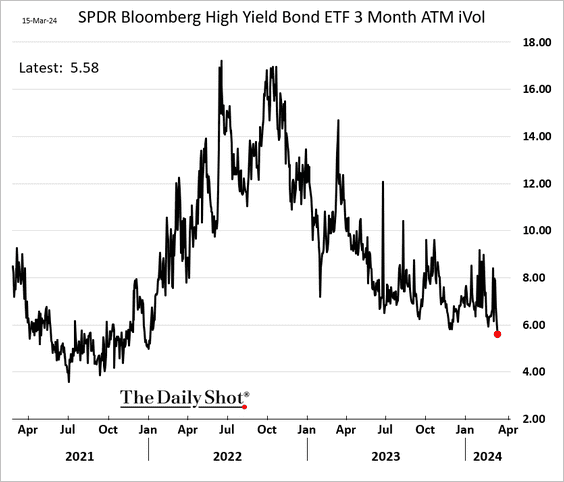
1. The implied volatility in high-yield bonds has been trending lower.
2. Global corporate defaults are at the highest level since 2009.
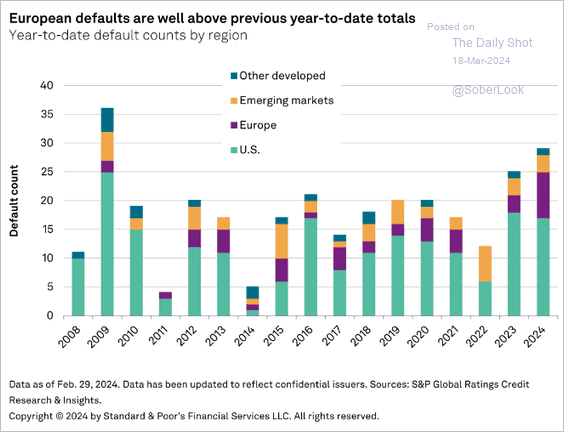 Source: S&P Global Ratings
• US and European default rates are climbing.
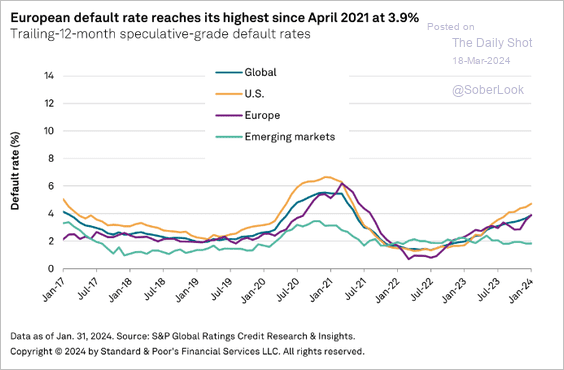 Source: S&P Global Ratings
——————–
3. Synthetic risk transfers have been increasingly popular.
![]() Source: @markets Read full article
Source: @markets Read full article
4. Commercial real estate prices are starting to rebound.
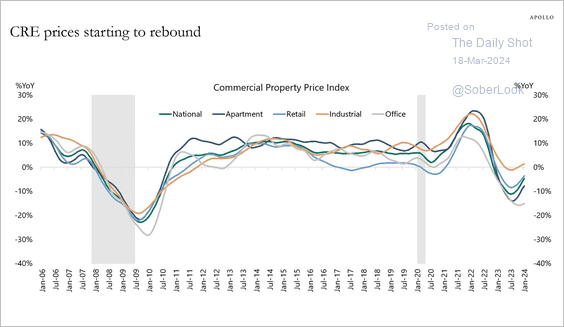 Source: Torsten Slok, Apollo
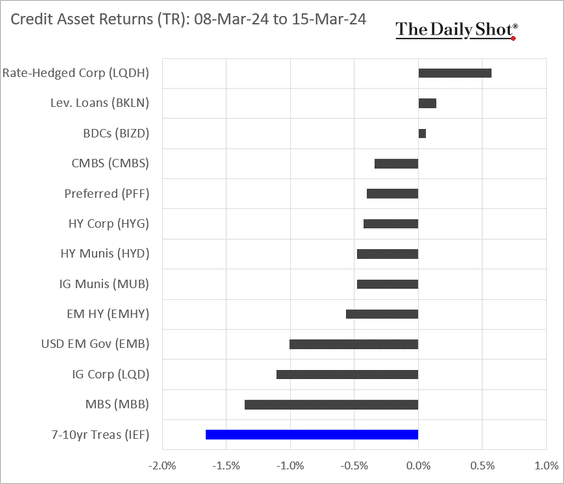
5. Here is a look at last week’s performance (price weakness driven by Treasuries).
Back to Index
Global Developments
1. World goods trade declined last year.
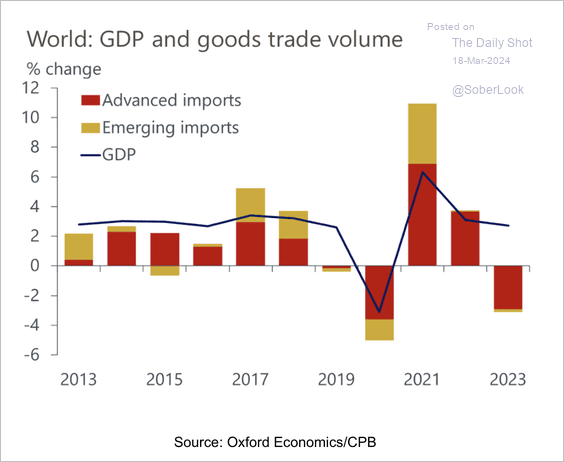 Source: Oxford Economics
2. The combined performance of ETFs tracking stocks, Treasuries, and credit hit a multi-year high this month.
![]() Source: @markets Read full article
Source: @markets Read full article
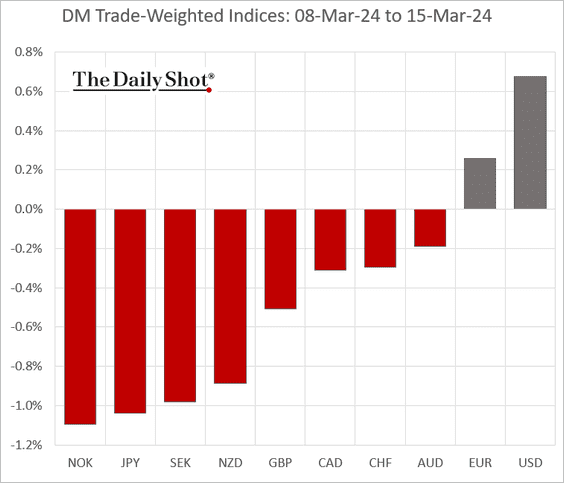
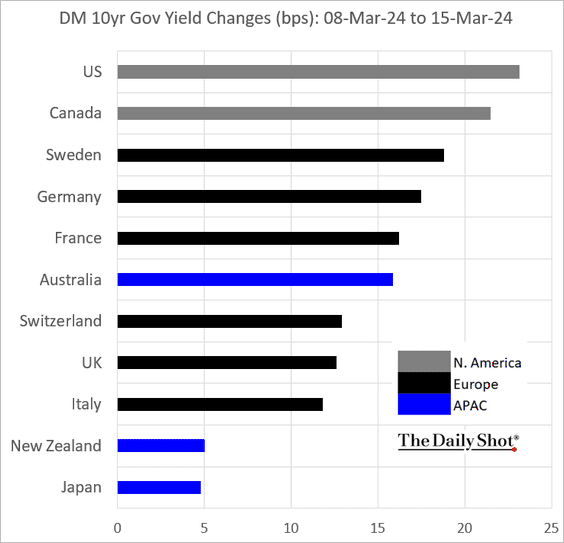
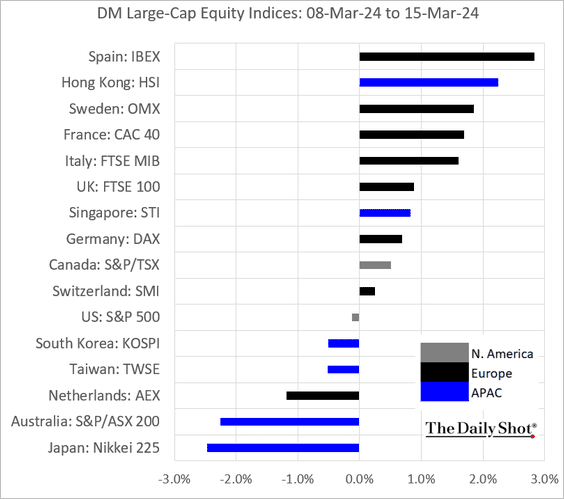
3. Here is last week’s performance across advanced economies.
• Currencies:
• Bond yields:
• Large-cap equities:
——————–
Food for Thought
1. The scale of the world’s largest stock markets by country:
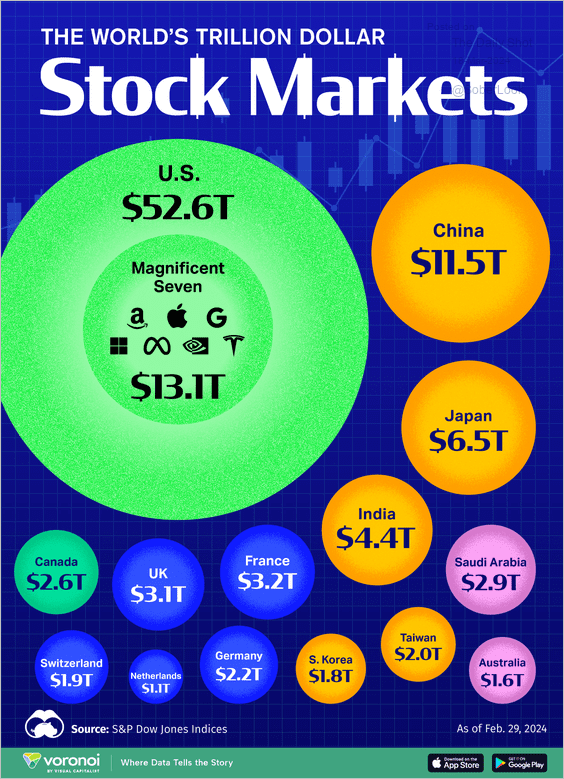 Source: Visual Capitalist Read full article
2. Global adoption of electric vehicles in new car sales:
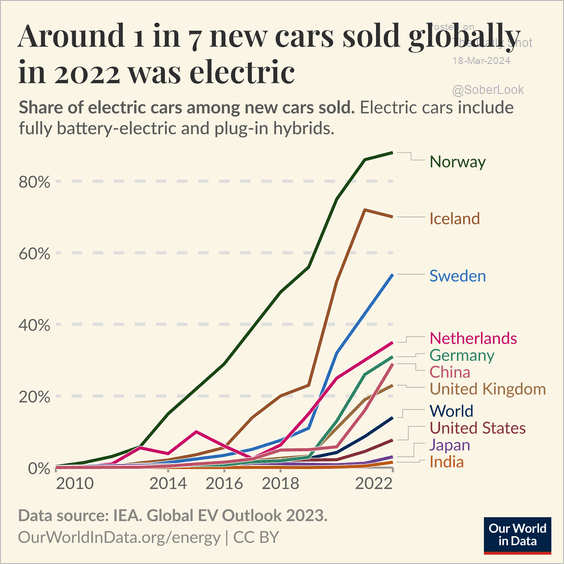 Source: @OurWorldInData
3. What it takes to join the 1%:
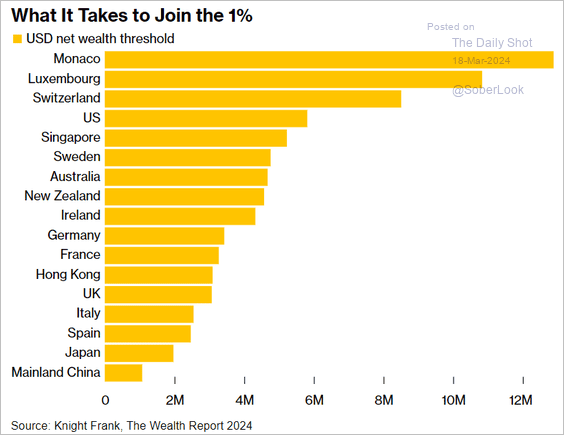 Source: @economics Read full article
4. US pharmaceutical imports from China:
 Source: PIIE Read full article
5. Ruminant livestock emissions:
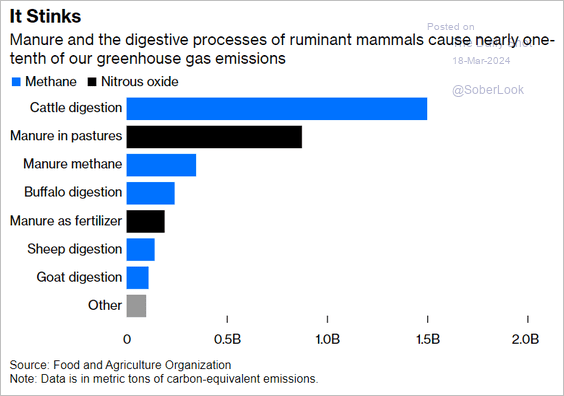 Source: @davidfickling, @opinion Read full article
6. Chip design and fabrication costs:
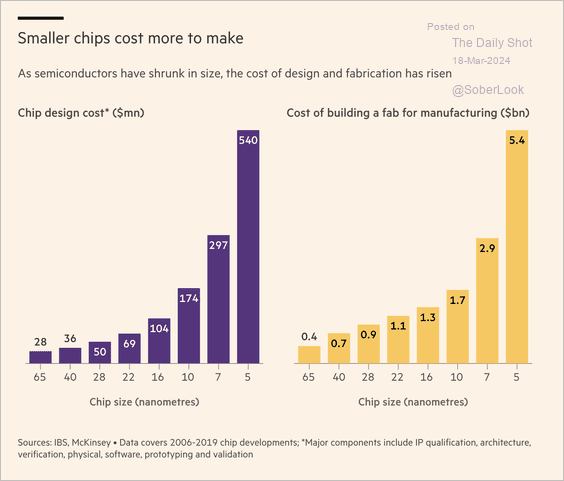 Source: @financialtimes Read full article
7. The most popular movie stars of 2023:
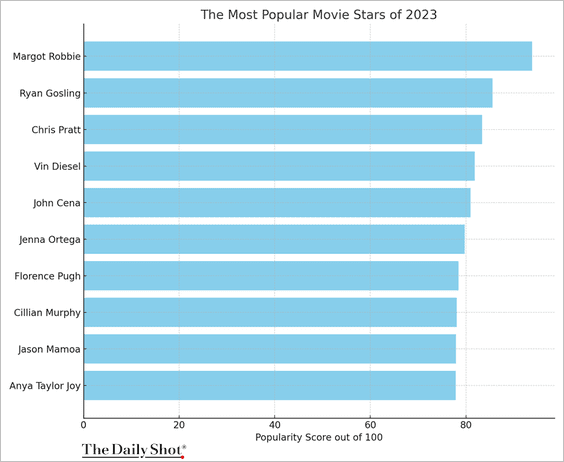 Source: NoDepositRewards.com
——————–
Back to Index