
The Daily Shot: 01-Apr-24
• The United States
• Canada
• The United Kingdom
• The Eurozone
• Europe
• Japan
• China
• Commodities
• Energy
• Equities
• Credit
• Rates
• Global Developments
• Food for Thought
The United States
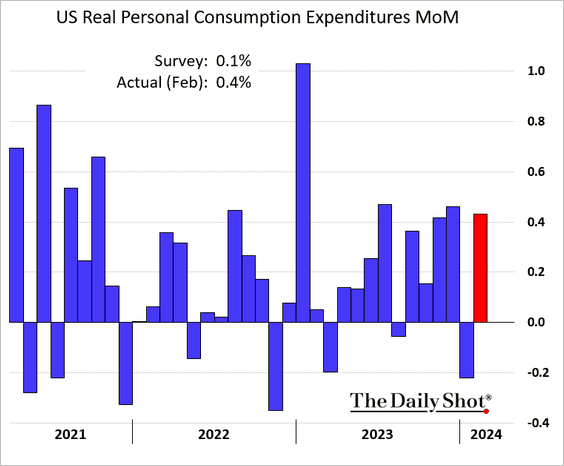
1. Consumer spending in February recovered from a weak start to the year, with real spending exceeding expectations.
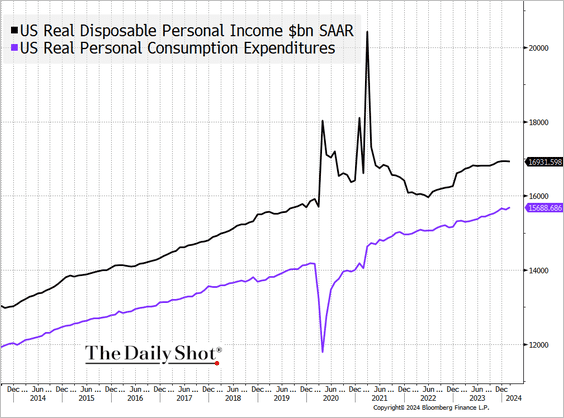
– Here are the trends in real consumer spending and disposable personal income.
 Source: @TheTerminal, Bloomberg Finance L.P.
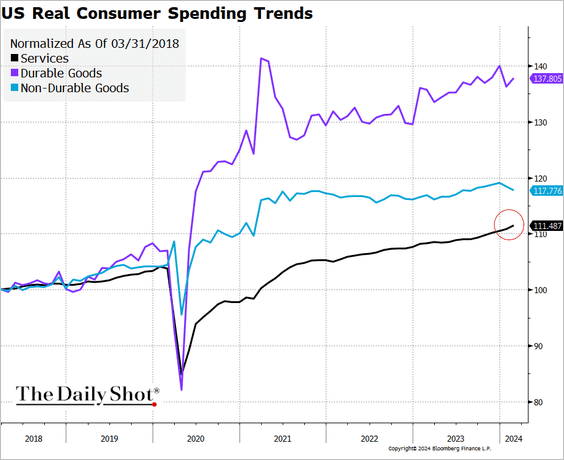
– Spending on services picked up momentum, …
 Source: @TheTerminal, Bloomberg Finance L.P.
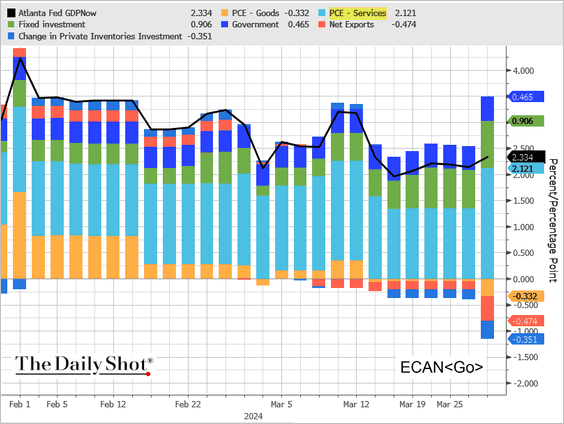
… boosting the Atlanta Fed’s GDPNow Q1 growth estimate.
 Source: @TheTerminal, Bloomberg Finance L.P.
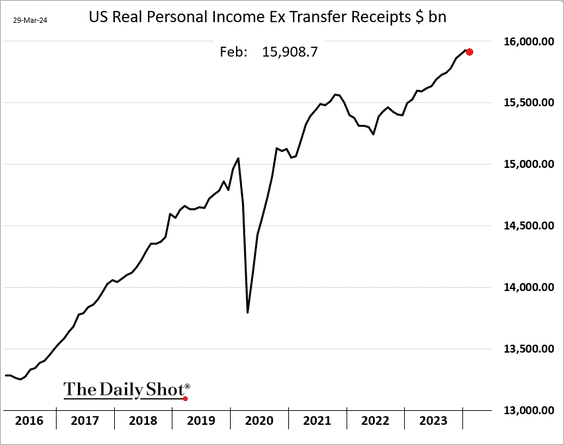
• Real personal income, excluding government transfers, edged lower in February.
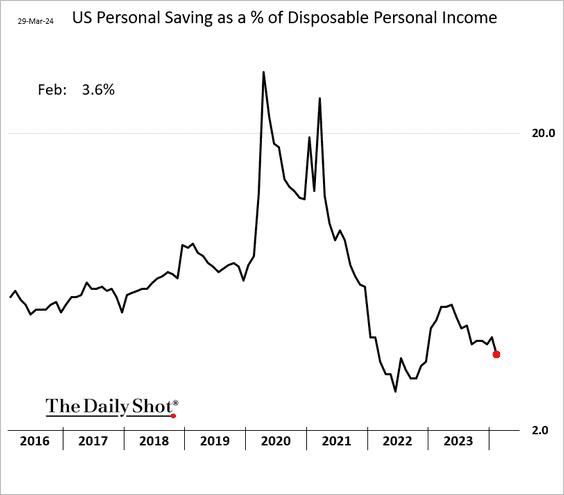
• The savings rate, as a percentage of disposable personal income, decreased.
 (log scale)
——————–
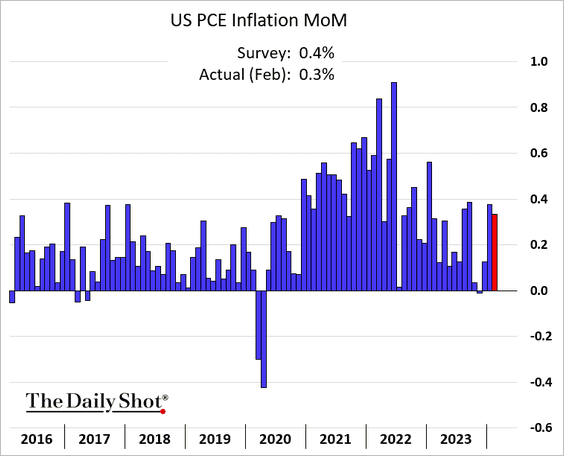
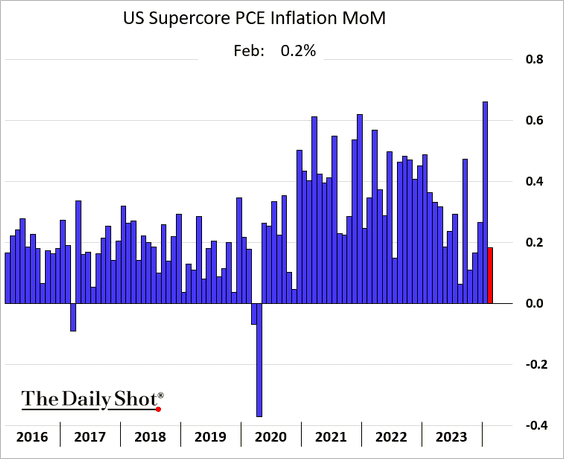
2. The February PCE inflation figure came in slightly below expectations (the chart shows monthly changes).
– Here is the core PCE.
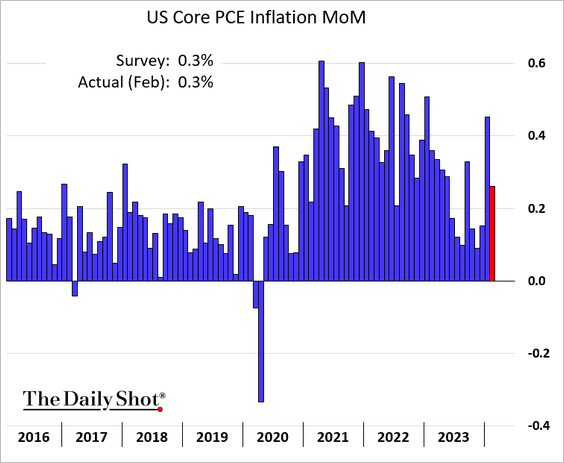
– The supercore PCE (core services ex housing) slowed.
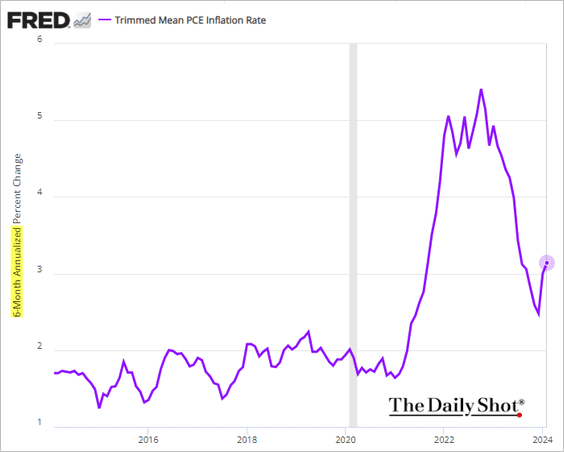
– On a six-month basis, the Dallas Fed’s trimmed mean PCE inflation is back above 3% (annualized).
——————–
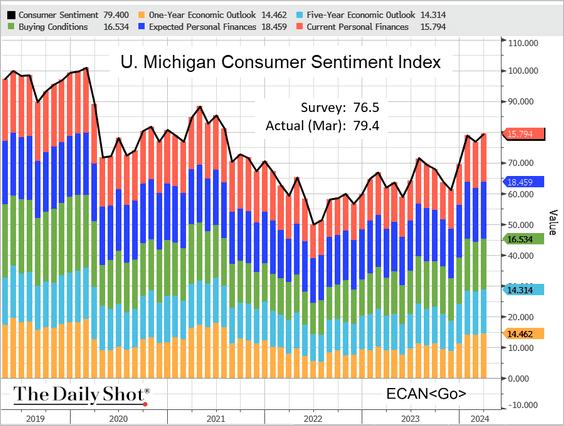
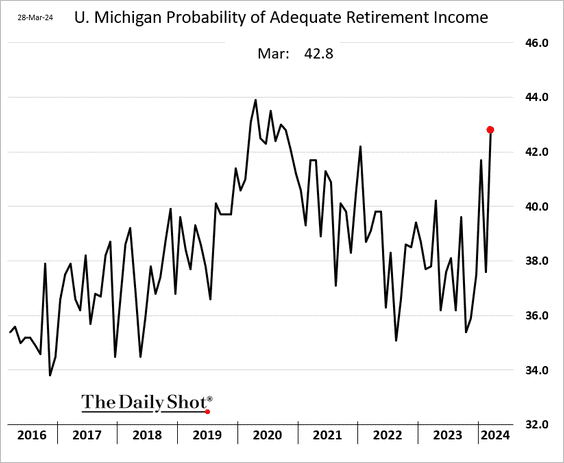
3. The updated U. Michigan index rebounded from softer readings earlier in March.
 Source: @TheTerminal, Bloomberg Finance L.P.
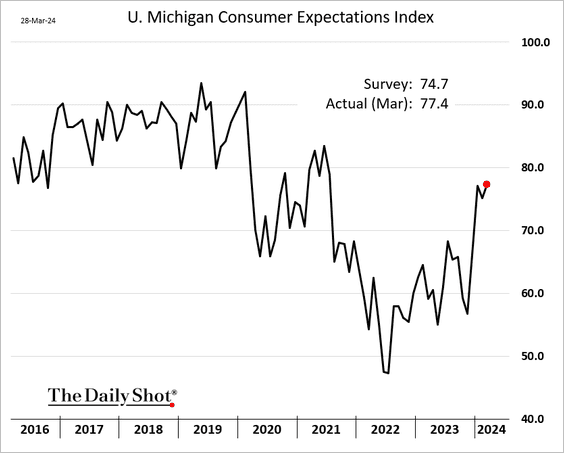
• Strength in the stock market has been boosting consumer morale.
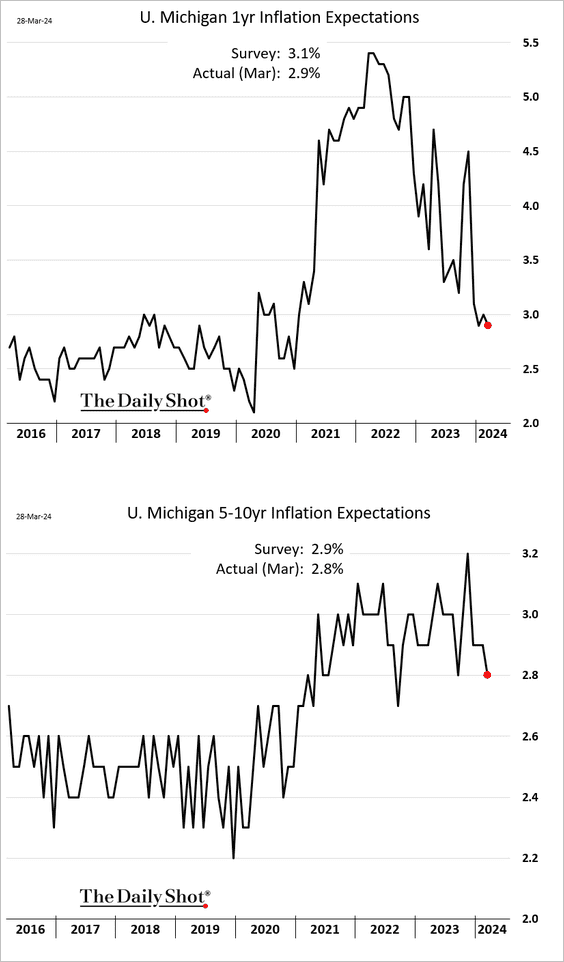
• Inflation expectations eased.
——————–
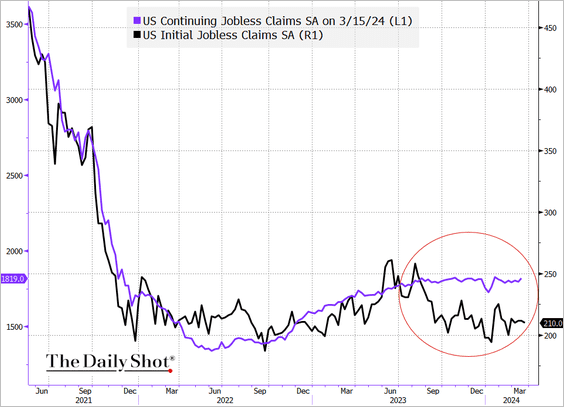
4. Initial jobless claims remain low, …
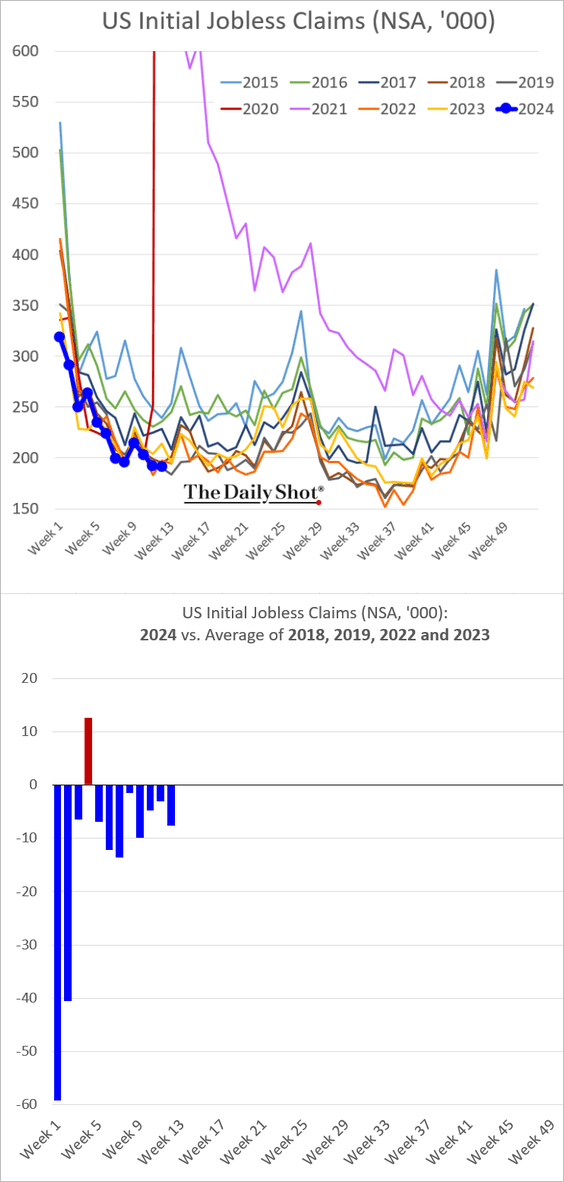
… diverging from continuing claims. Here is the seasonally adjusted chart.
 Source: @TheTerminal, Bloomberg Finance L.P.
——————–
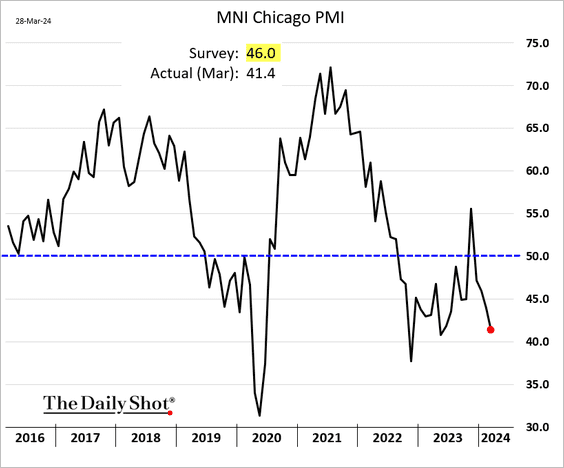
5. The Chicago PMI index indicated a worsening contraction in the region’s business activity, exacerbated by challenges at Boeing.
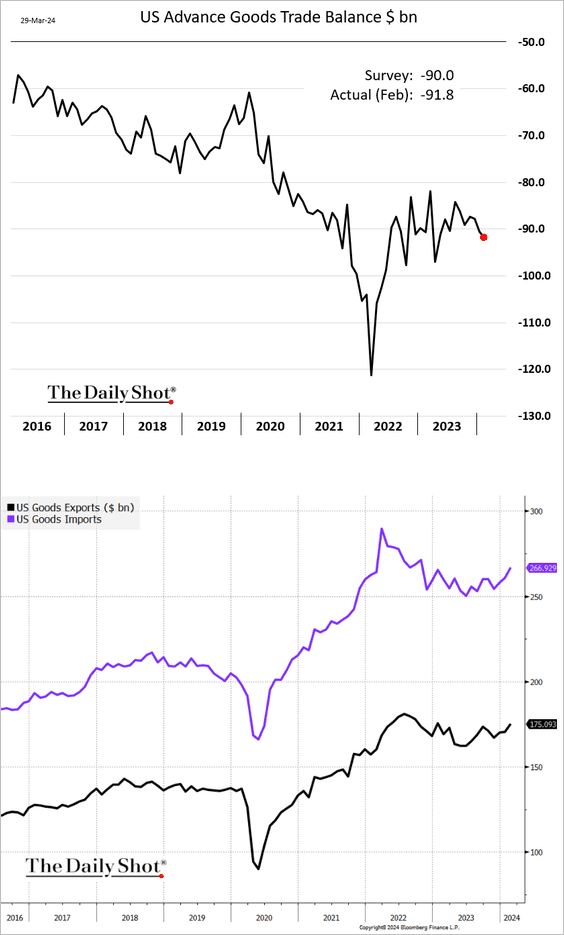
6. US trade in goods moved deeper into deficit as imports accelerated.
 Source: @TheTerminal, Bloomberg Finance L.P.
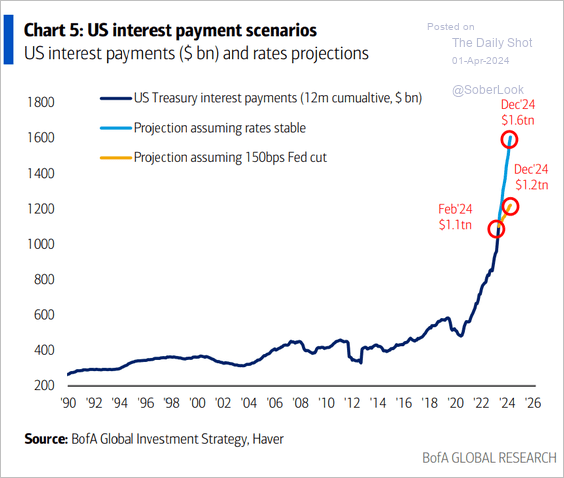
7. What effect will the Fed’s actions have on the federal government’s interest payments?
 Source: BofA Global Research
Back to Index
Canada
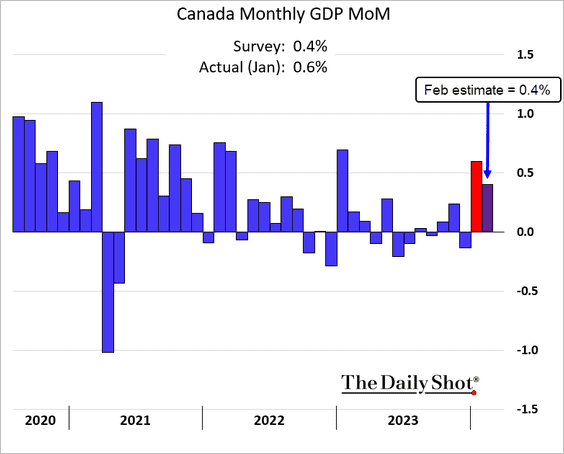
1. Canada’s economy began the year on a strong note, with January’s growth exceeding forecasts. The estimate for February also appears robust.
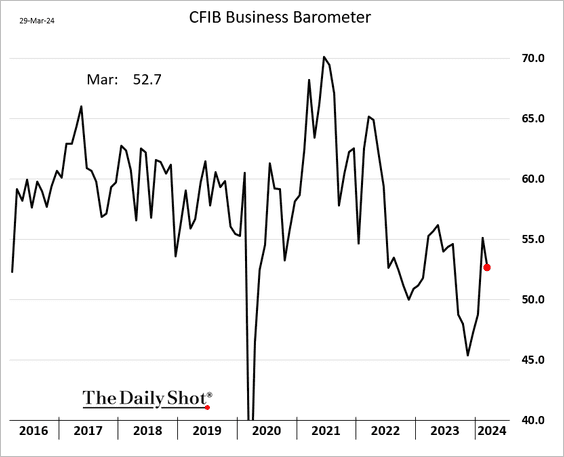
2. The CFIB index for medium- and small-sized business activity eased in March, yet it continued to reflect growth.
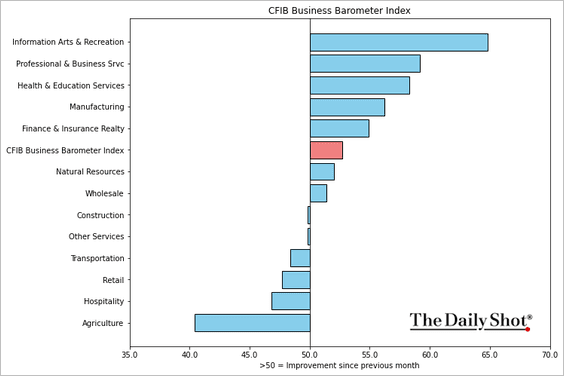
Here is the CFIB index by sector.
——————–
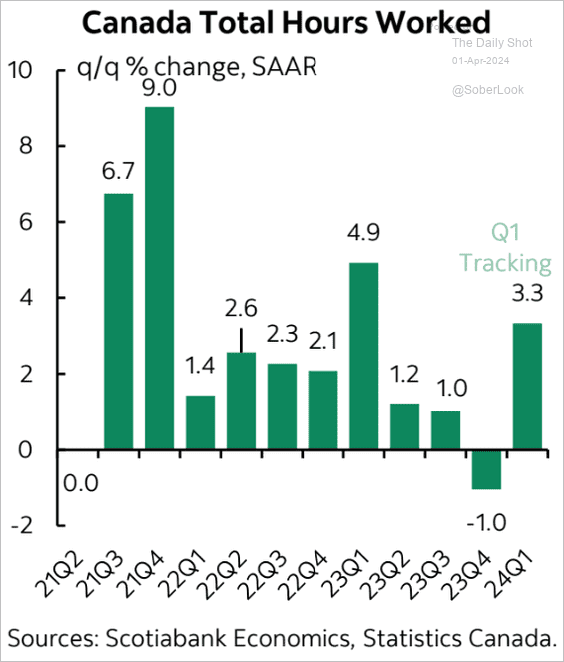
3. Scotiabank reports a sharp increase in the growth of hours worked in Canada for the first quarter.
 Source: Scotiabank Economics
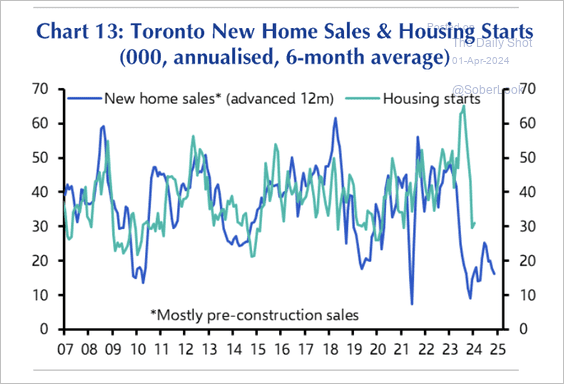
4. Toronto’s new home sales and housing starts remain depressed.
 Source: Capital Economics
Back to Index
The United Kingdom
1. Business investment has been trailing behind that of the US.
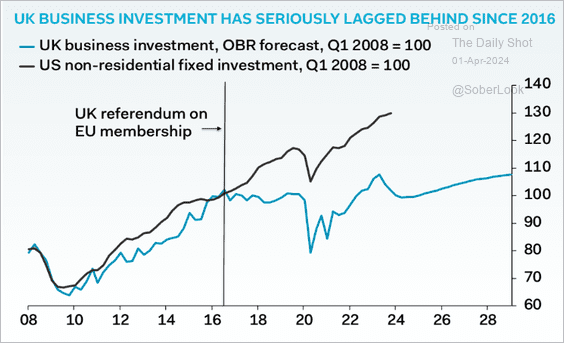 Source: Pantheon Macroeconomics
2. Economic growth is running below the pre-COVID trend.
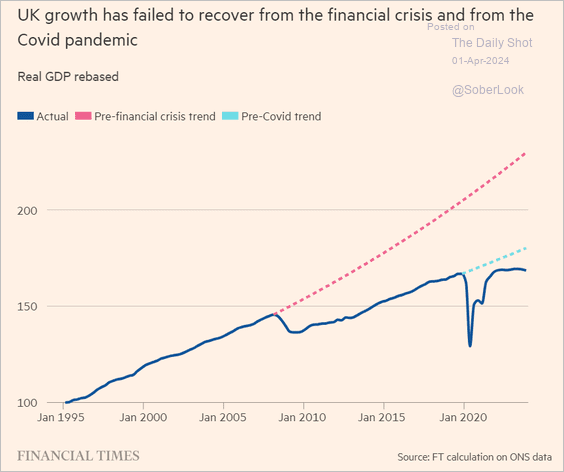 Source: @financialtimes Read full article
3. This chart displays the projected distribution of Parliament seats by party based on a recent poll.
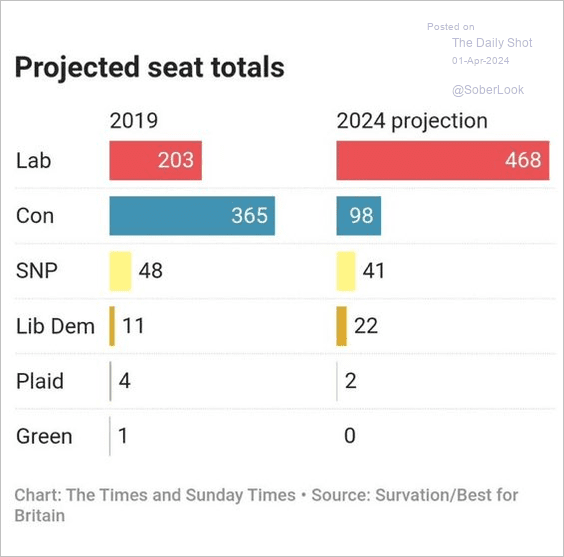 Source: The Sunday Times Read full article
Back to Index
The Eurozone
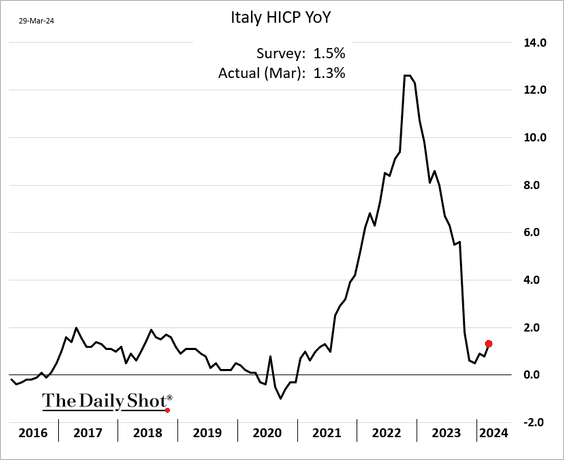
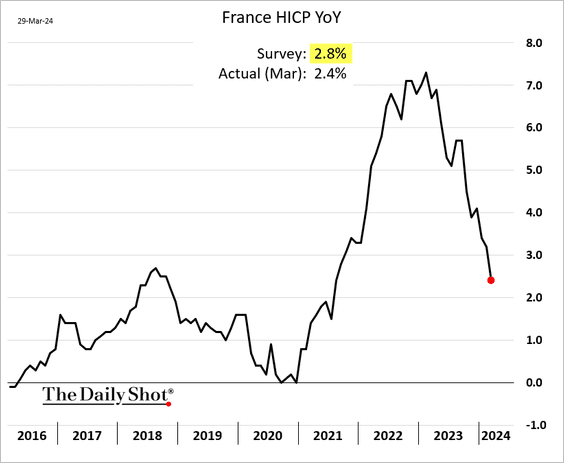
1. Inflation figures from both Italy and France came in below the consensus estimates.
——————–
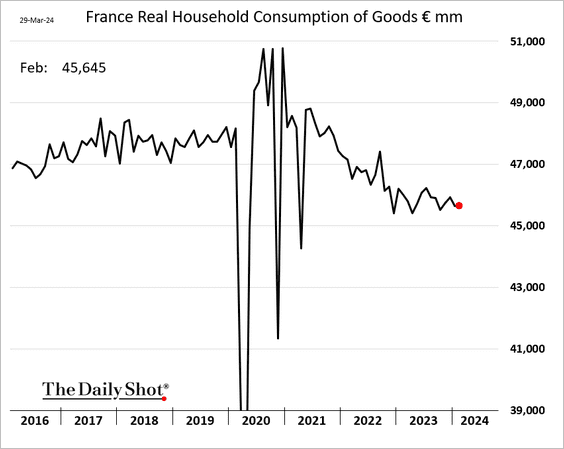
2. French household consumption of goods remained largely stable in February.
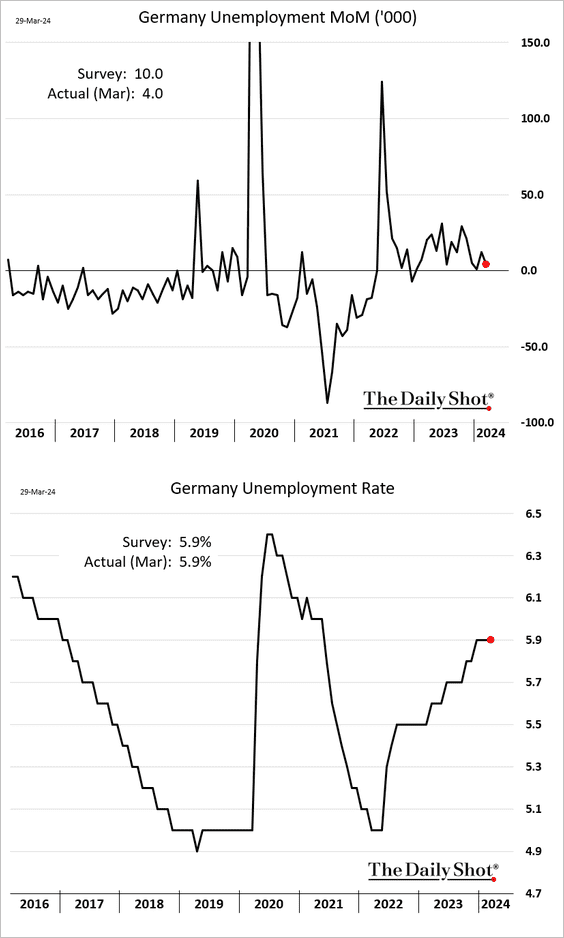
3. Germany’s unemployment rate was roughly unchanged in March.
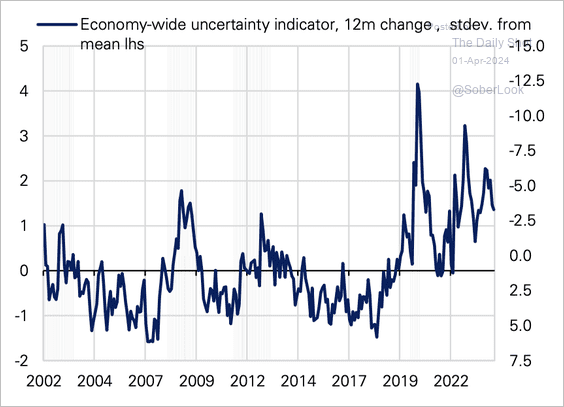
4. Euro-area economic uncertainty remains elevated.
 Source: Deutsche Bank Research
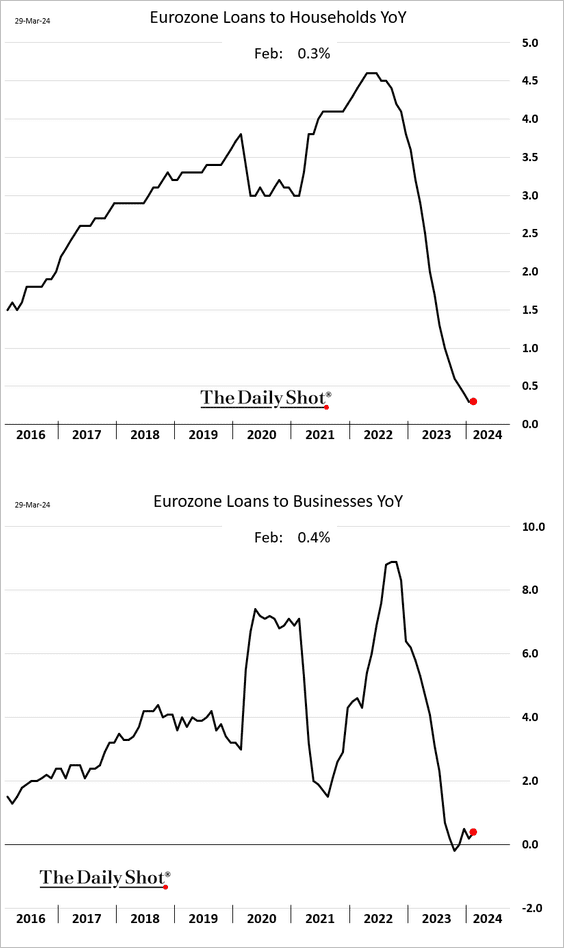
5. After a rapid deceleration, loan growth in the Eurozone is showing signs of stabilization.
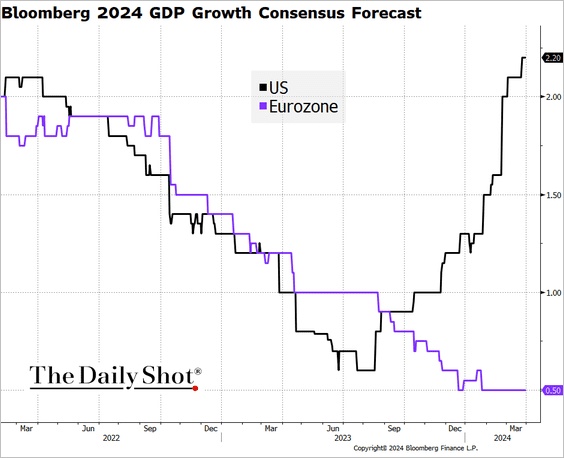
6. Growth projections for the euro area and the US for 2024 continue to diverge.
 Source: @TheTerminal, Bloomberg Finance L.P.
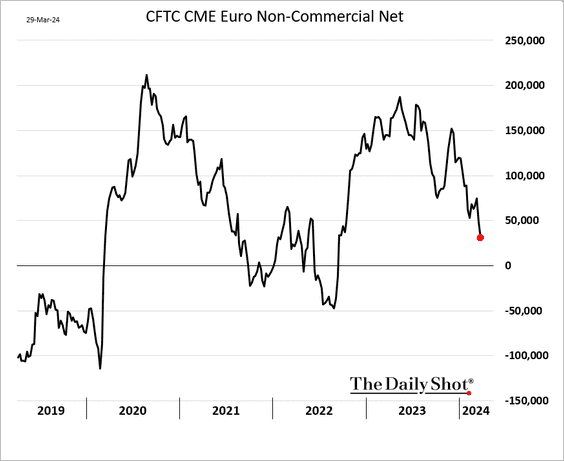
7. Speculative accounts have been reducing their bets on the euro.
Back to Index
Europe
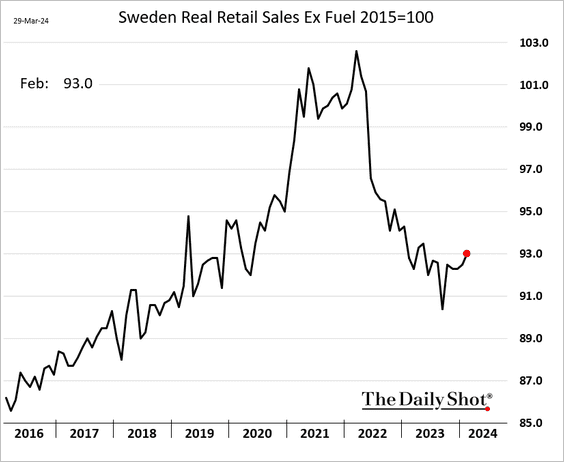
1. Sweden’s retail sales have stabilized.
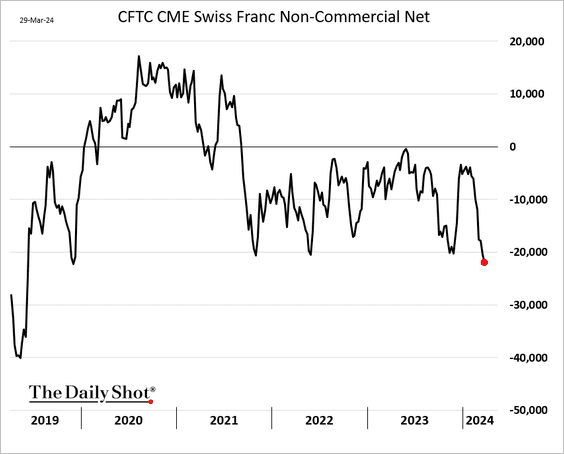
2. After the SNB’s surprise rate cut, speculators are pressing their bets against the Swiss franc.
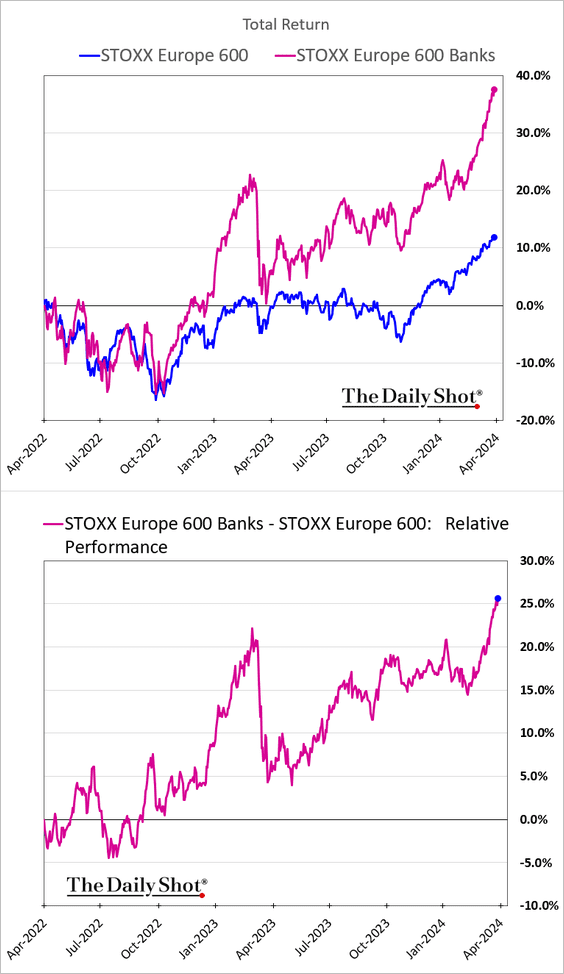
3. European banks continue to outperform STOXX 600.
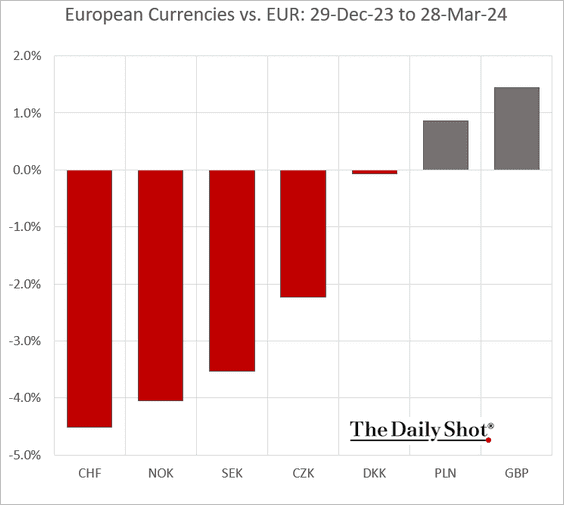
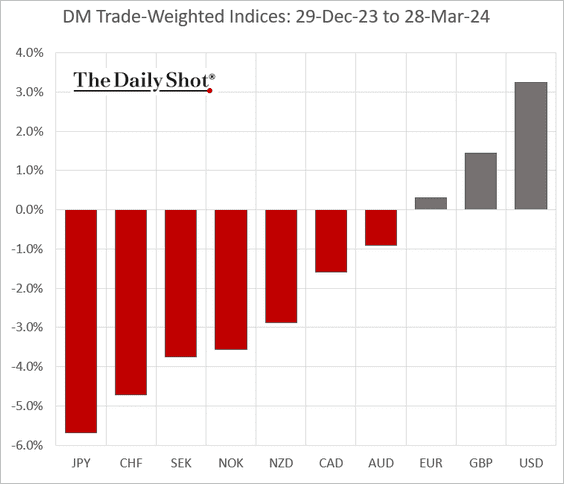
4. This chart shows the performance of European currencies against the euro in the first quarter.
Back to Index
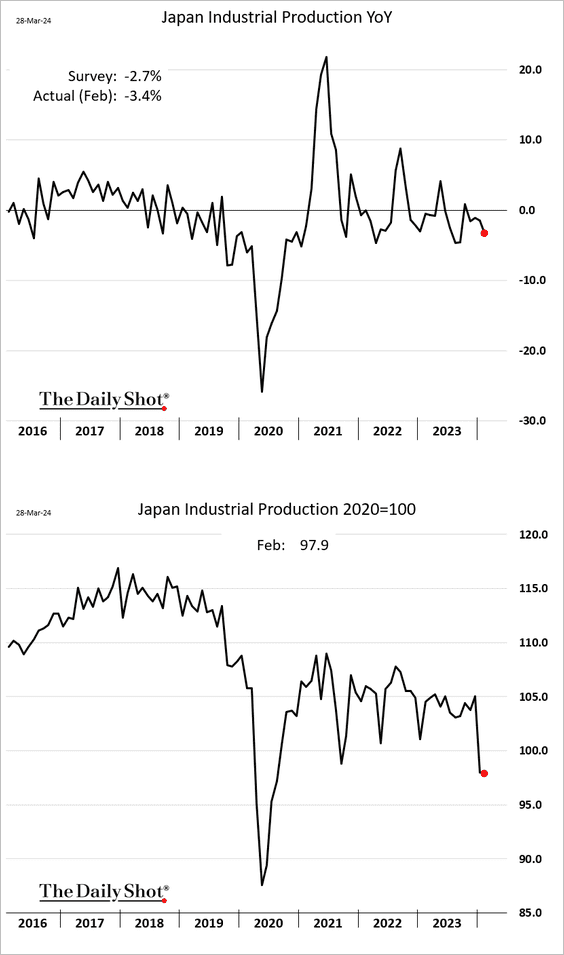
Japan
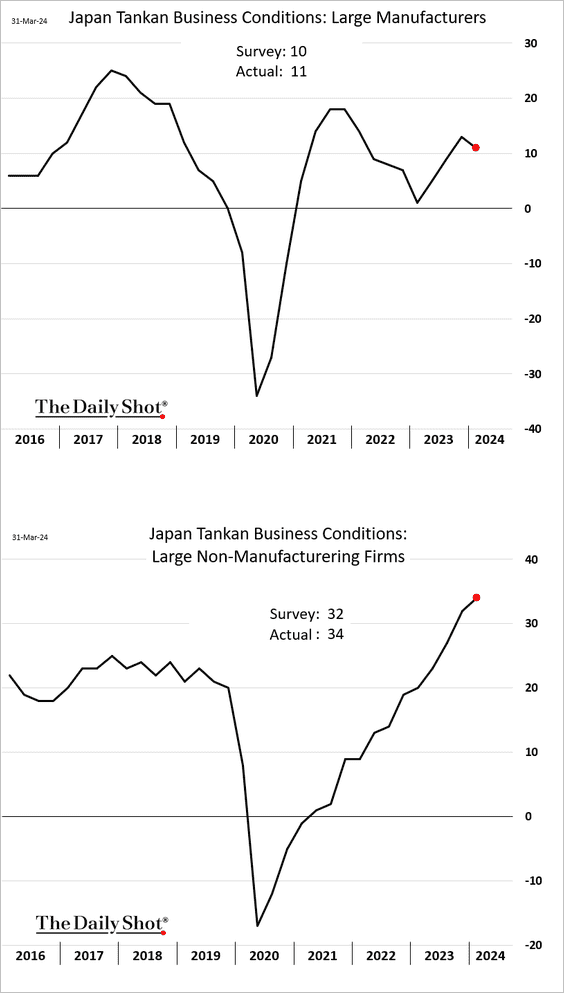
1. The Tankan report signaled slower growth in manufacturing while services expansion strengthened in the first quarter.
2. Industrial production slowed in February.
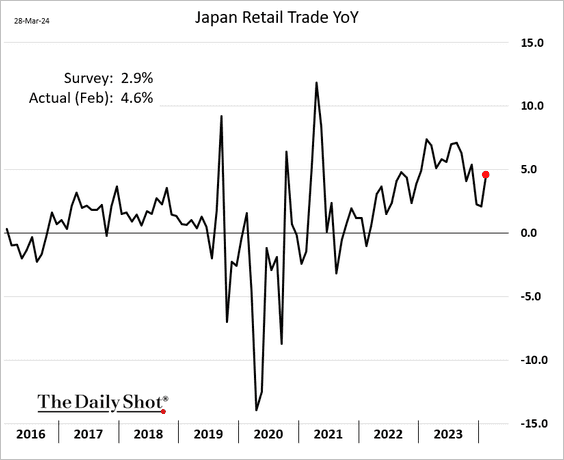
3. Retail sales strengthened.
Back to Index
China
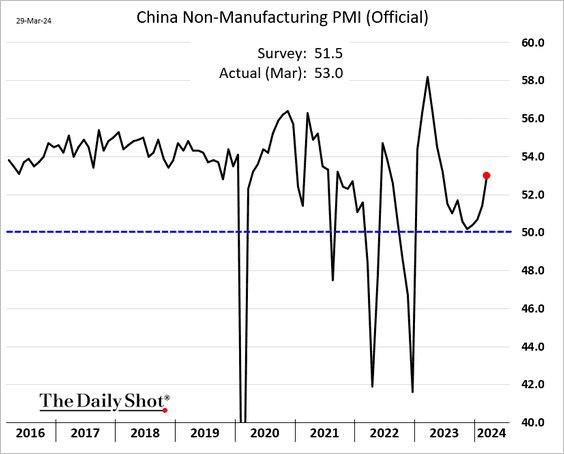
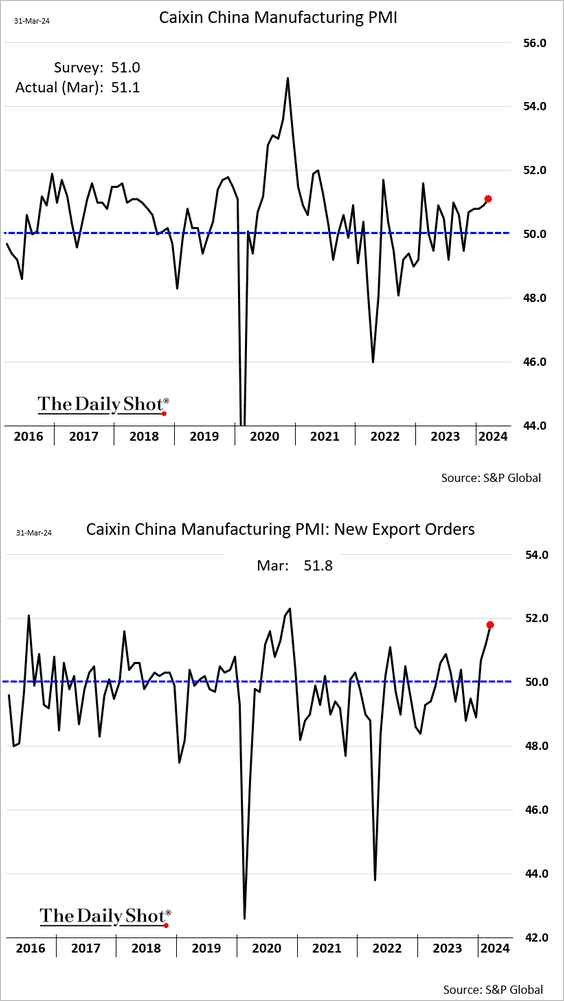
1. The official PMI reports topped expectations, with factory activity now back in growth mode.
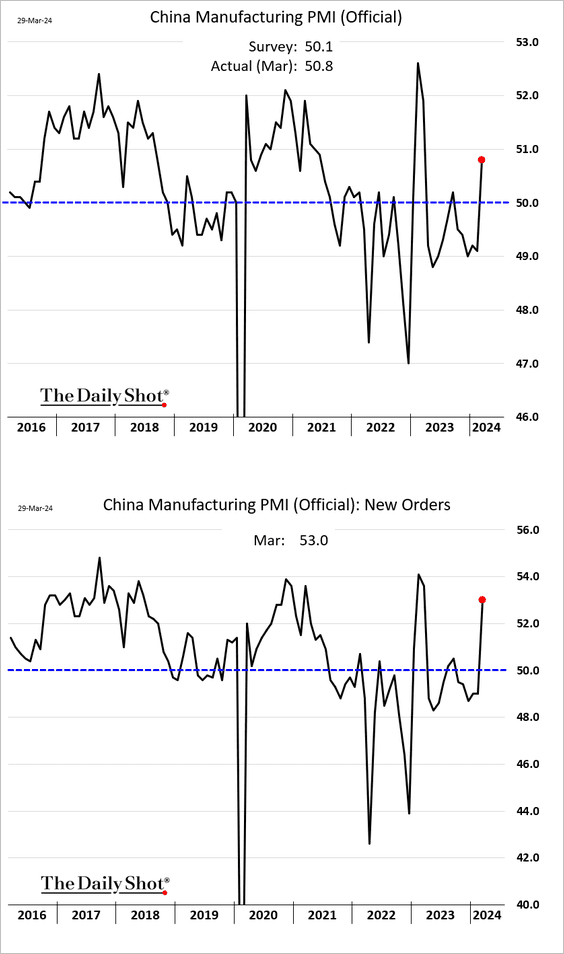
The report from S&P Global also showed expansion in the manufacturing sector.
• The manufacturing PMI signaled further disinflationary pressures.
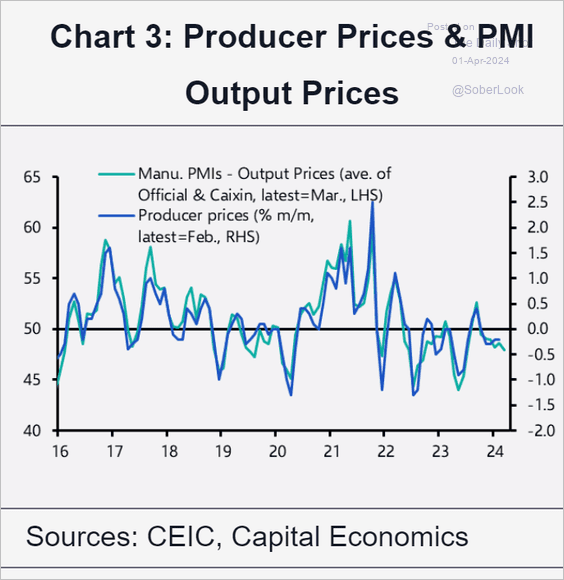 Source: Capital Economics
——————–
2. Loan growth in the manufacturing sector has been notably robust.
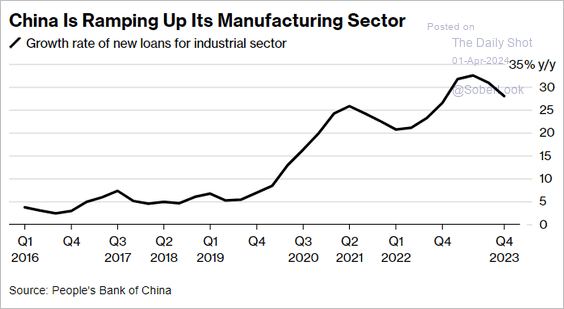 Source: @bpolitics Read full article
3. BlackRock’s systematic model turned positive on Chinese equities, driven by valuation and sentiment.
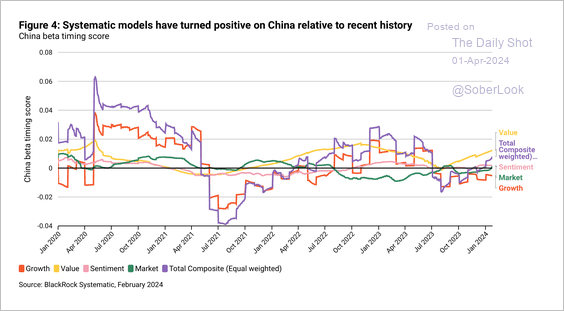 Source: BlackRock Investment Institute Read full article
Back to Index
Commodities
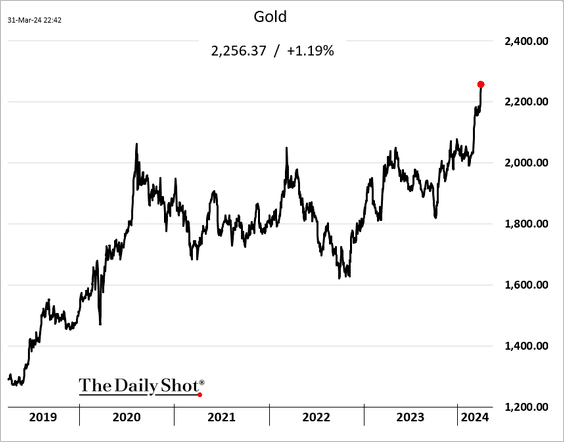
1. Gold hit another record high.
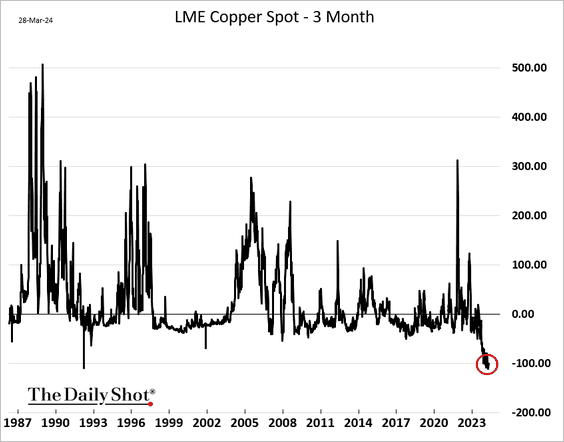
2. The copper market is in deep contango.
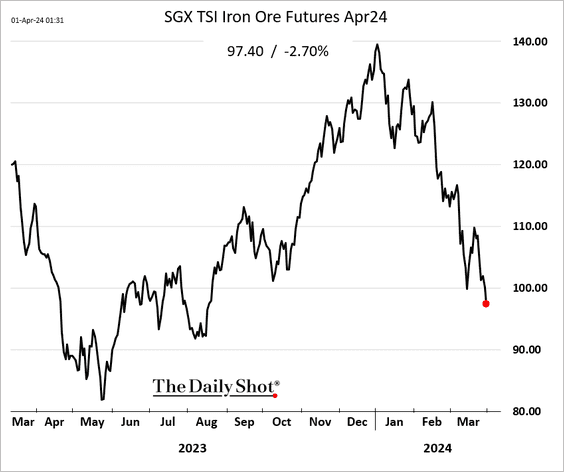
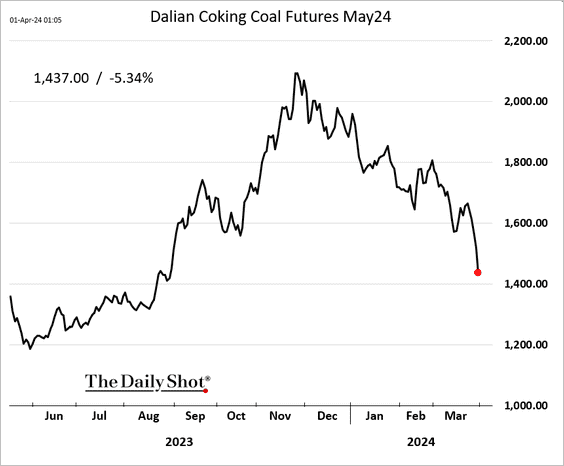
3. China’s weak housing market is pressuring steel prices, …
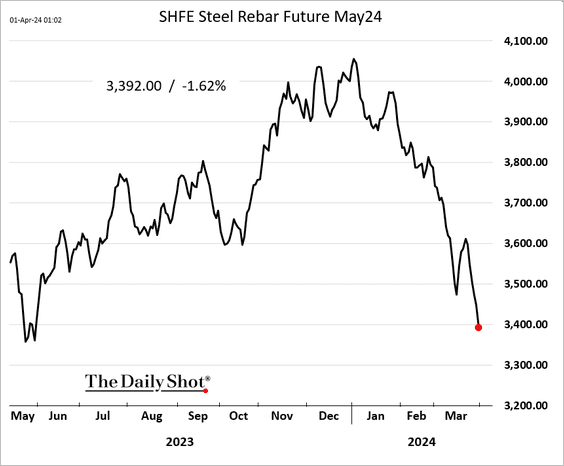
… which are pulling down global iron ore and metallurgical coal demand.
——————–
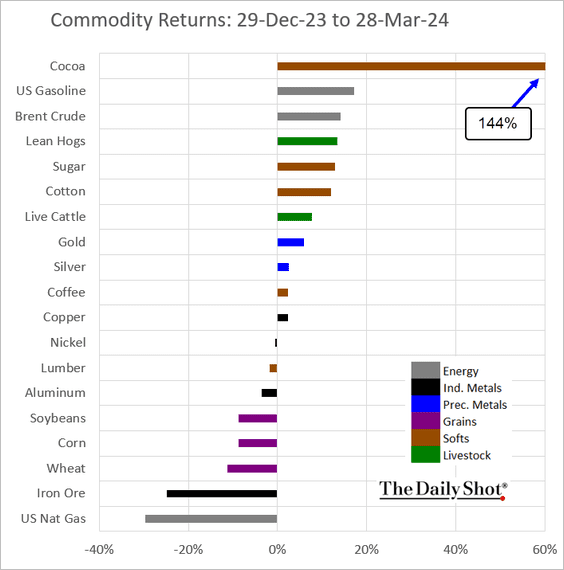
4. Here is a look at the first quarter’s performance across key commodity markets.
Back to Index
Energy
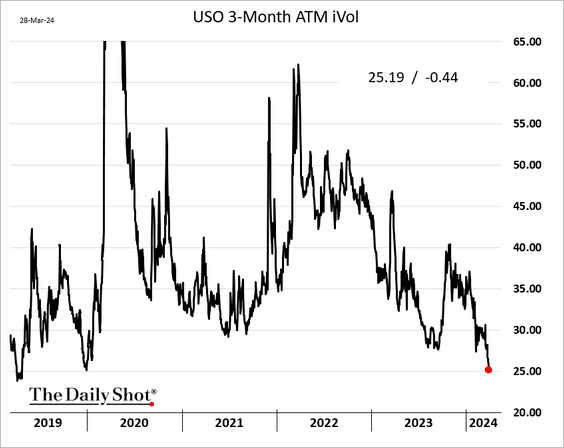
1. Crude oil implied volatility continues to sink.
2. The US has boosted oil exports to Europe and Asia, …
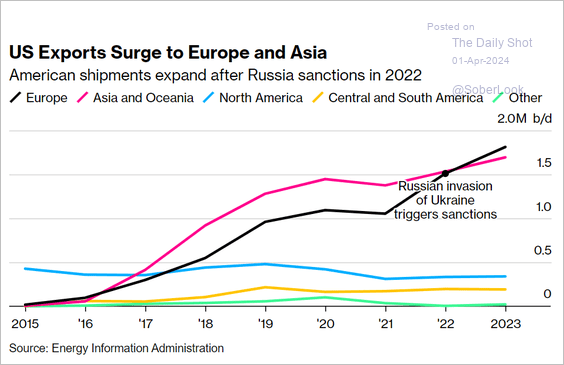 Source: @markets Read full article
… including India.
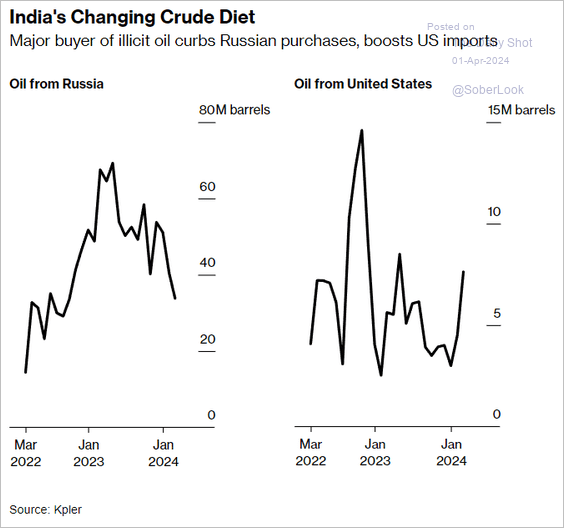 Source: @markets Read full article
Back to Index
Equities
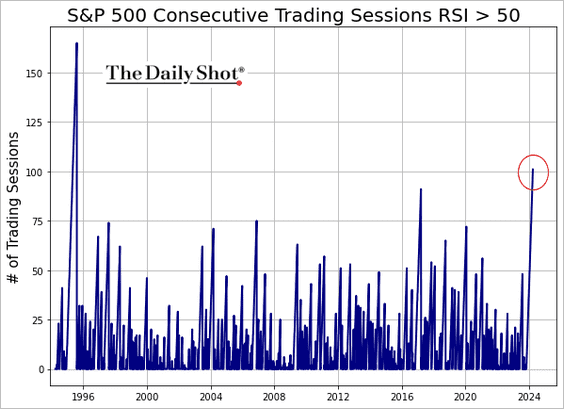
1. The S&P 500’s relative strength index has maintained a reading above 50 (indicating strong momentum within an uptrend) for about three months. A similar situation occurred in 2017 during the index’s low-volatility uptrend.
 h/t SentimenTrader
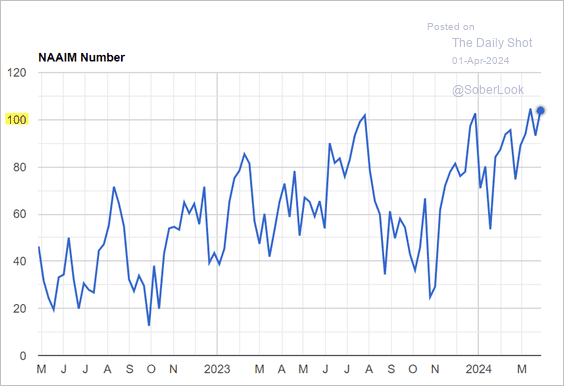
2. Investment managers are very bullish, with equity exposure running above 100%, which indicates leverage.
 Source: NAAIM
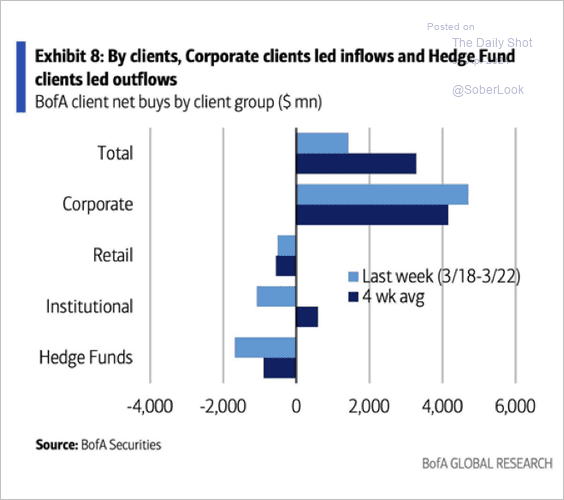
3. BofA clients were net sellers of equities last week, excluding corporates where flows are always positive.
 Source: BofA Global Research
4. Here is a look at US equity ownership by market participant.
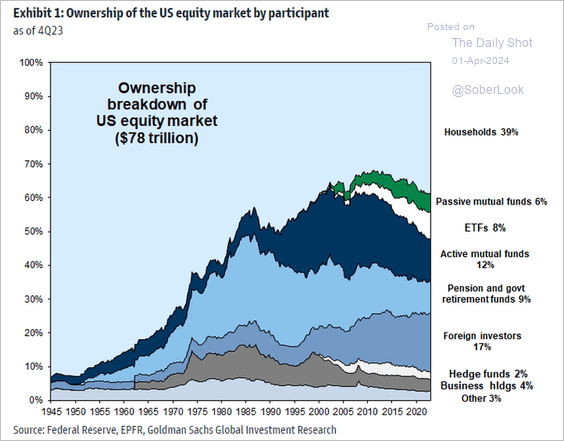 Source: Goldman Sachs; @MikeZaccardi
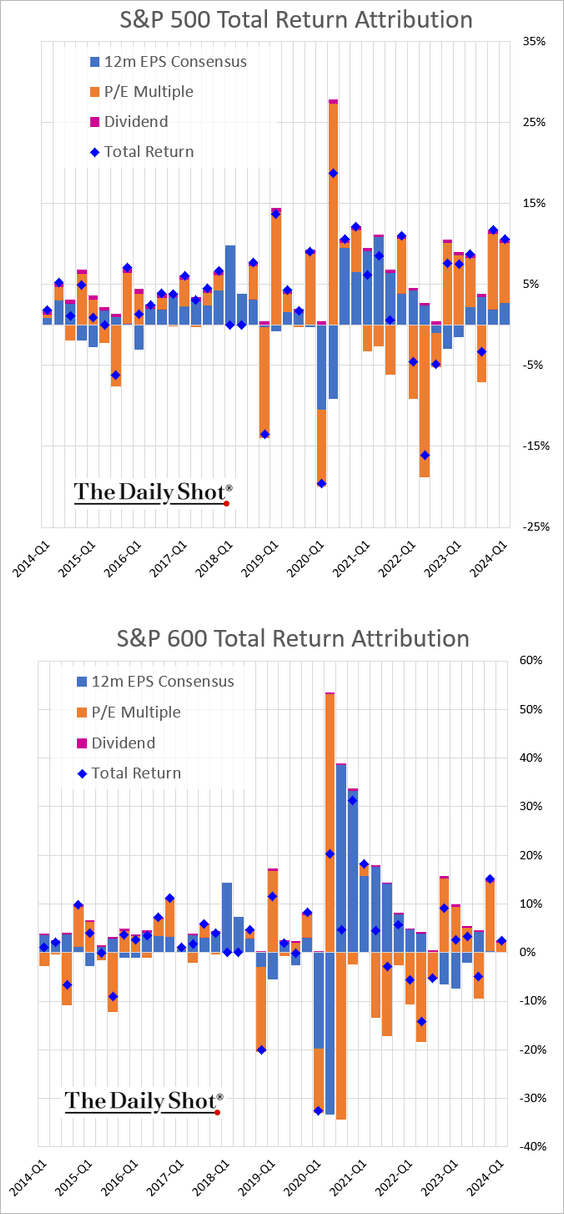
5. Below is the quarterly performance attribution for the S&P 500 and the S&P 600 (small caps).
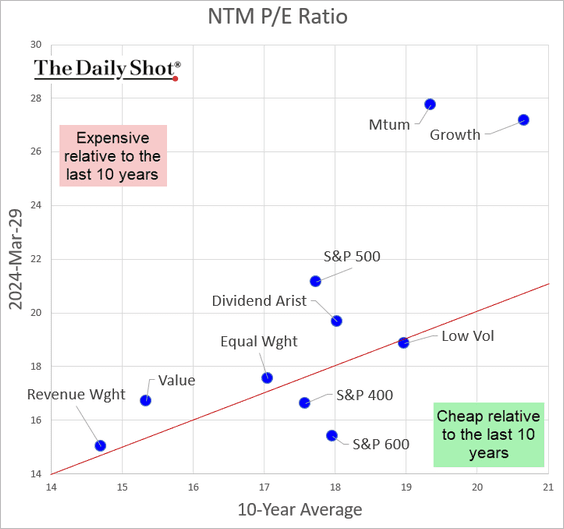
6. The S&P 500 equal weight index valuation (forward PE ratio) is now firmly above the ten-year average.
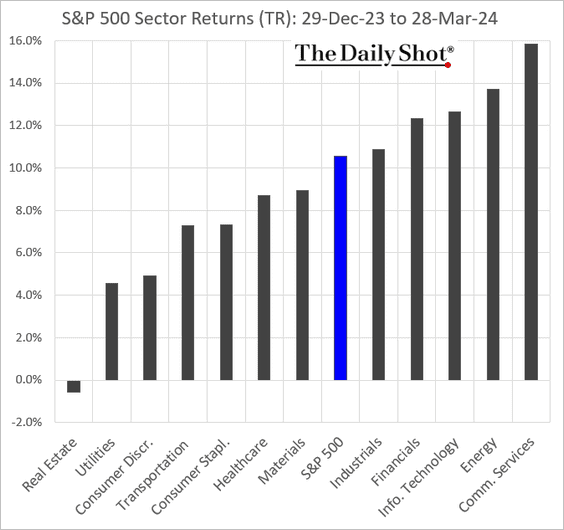
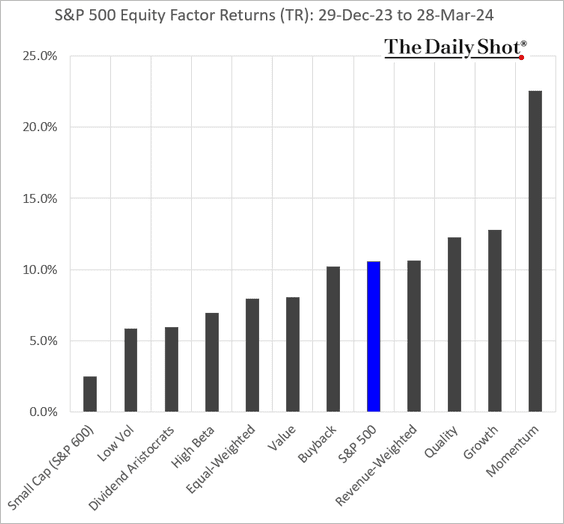
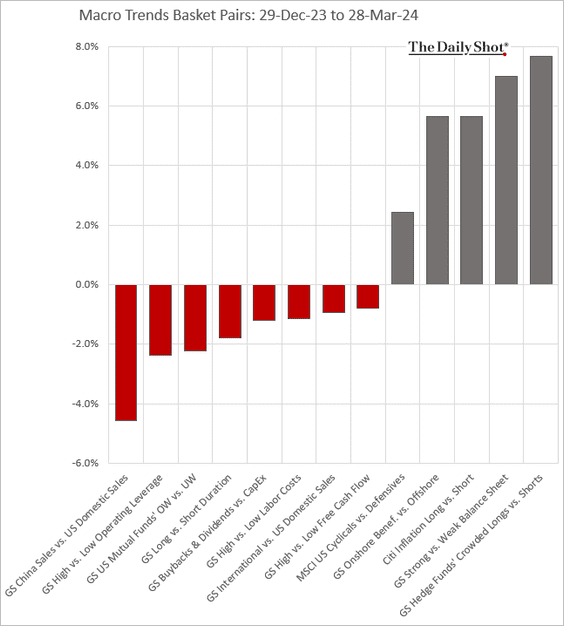
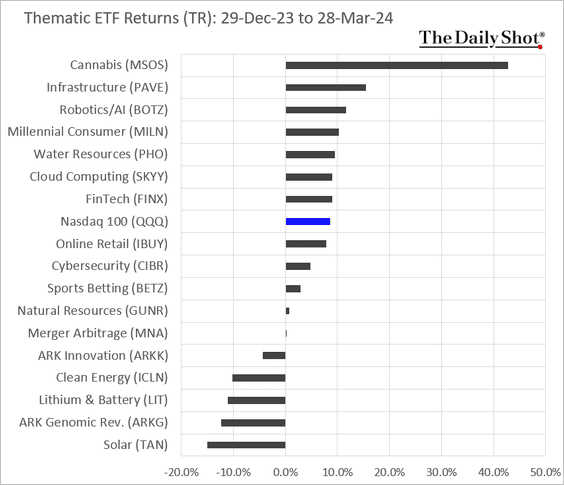
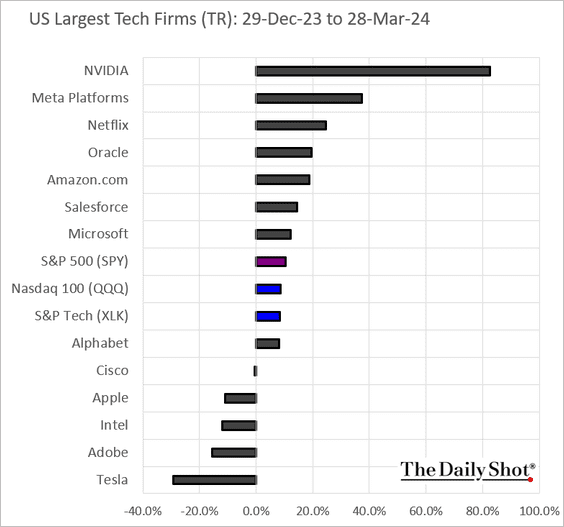
7. Next, let’s take a look at performance data for the first quarter.
• Sectors:
• Equity factors:
• Macro basket pairs’ relative performance:
• Thematic ETFs:
• Largest US tech firms:
Back to Index
Credit
1. US high yield typically outperforms during high inflation regimes and offers a slight edge when policy rates have peaked.
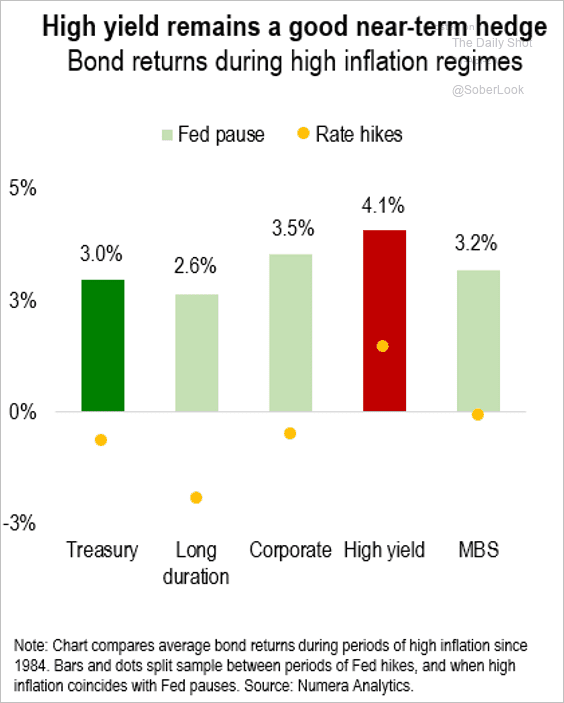 Source: Numera Analytics (@NumeraAnalytics)
• US high-yield bond volume increased to the highest level since 2021.
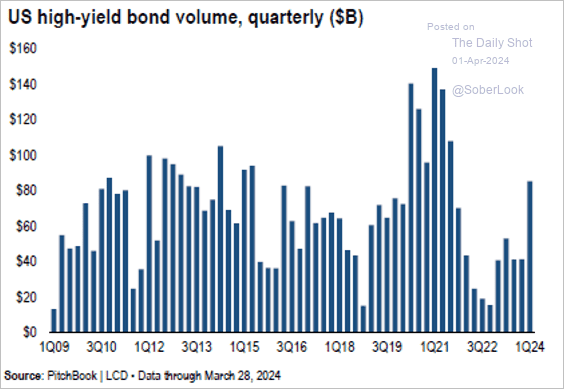 Source: PitchBook
2. Activity in the US syndicated loan market surged in Q1, which included a flood of repricings.
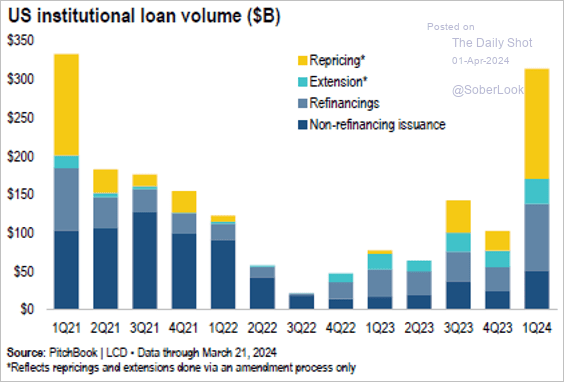 Source: PitchBook
3. Flows into investment-grade bond funds remain strong.
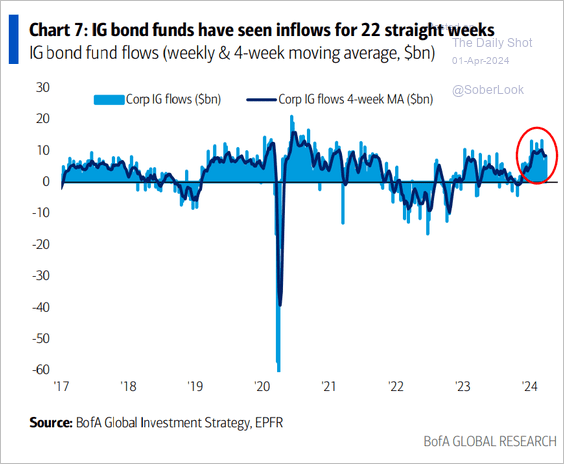 Source: BofA Global Research
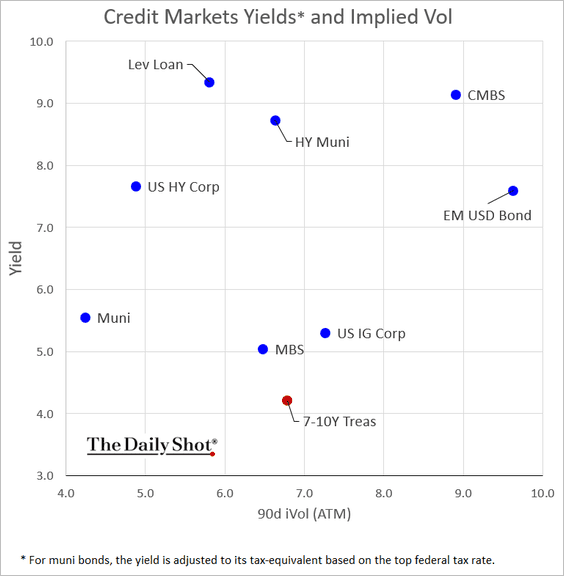
4. This chart shows yields vs. implied volatility for select credit asset classes (“expected performance” vs. “perceived risk”).
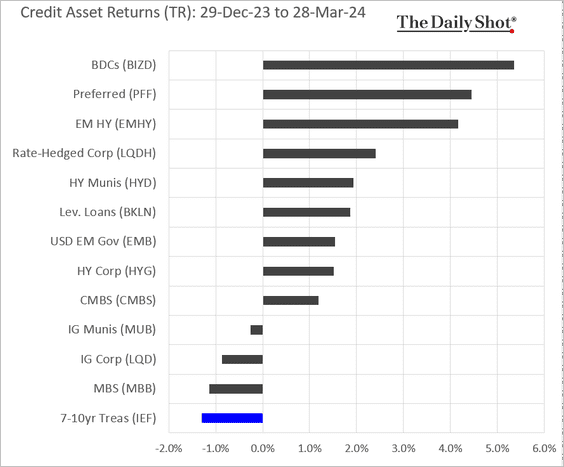
5. Finally, we have credit asset performance in the first quarter.
Back to Index
Rates
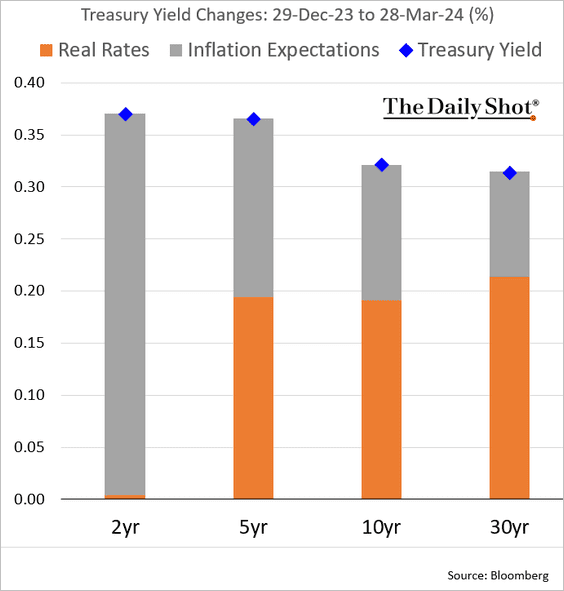
1. Here is the attribution of Treasury yield changes in the first quarter.
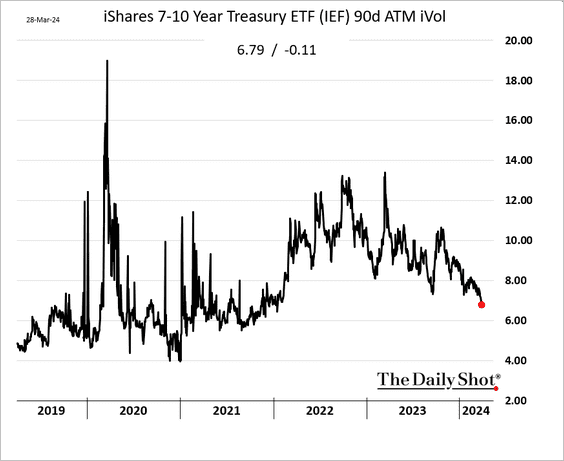
2. Treasury market implied volatility keeps trending down.
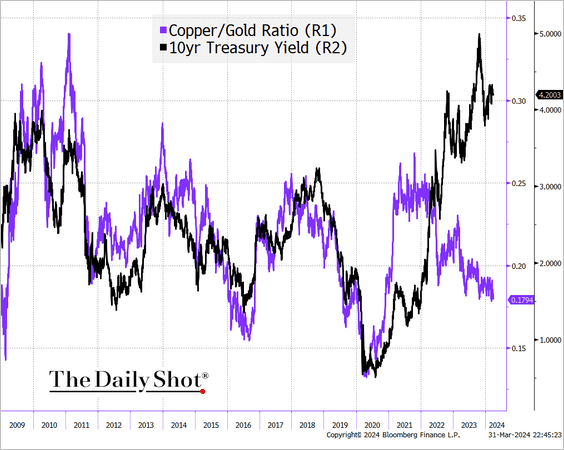
3. The copper-to-gold ratio continues to suggest that Treasury yields should be lower.
Back to Index
Global Developments
1. Businesses see less downside risk as recession fears subside, according to a survey by Oxford Economics.
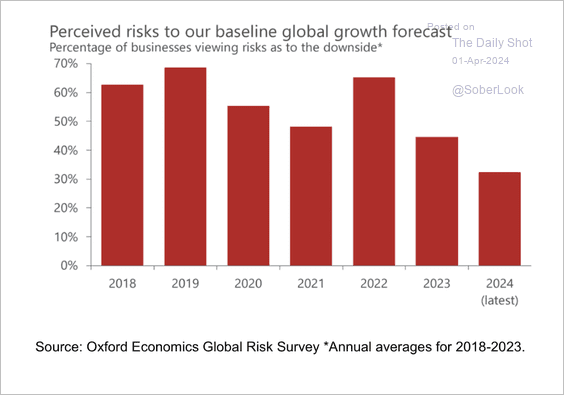 Source: Oxford Economics
2. This chart shows spending on health and pensions as a share of total government spending across select countries.
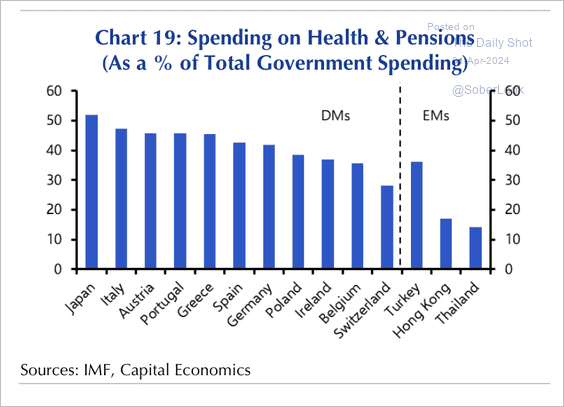 Source: Capital Economics
3. Finally, we have some performance data for the first quarter.
• Currencies:
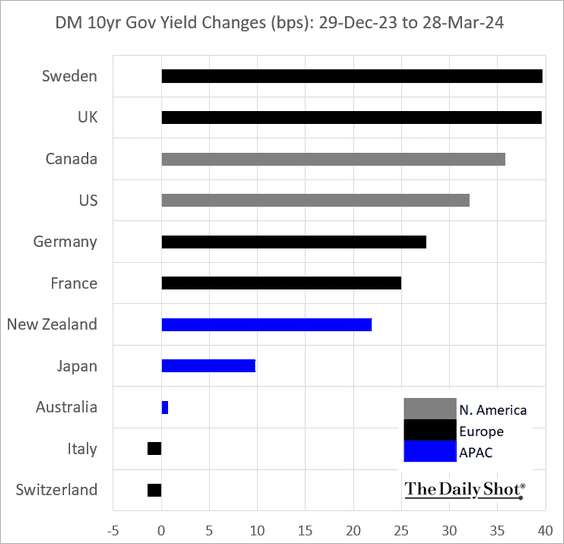
• Bond yields:
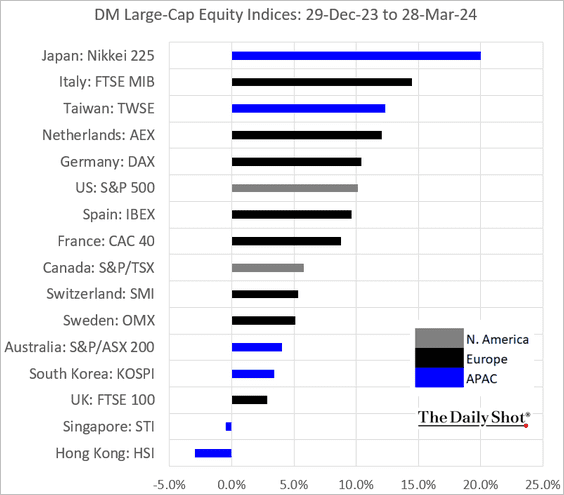
• Large-cap equity indices:
——————–
Food for Thought
1. Who is driving climate change?
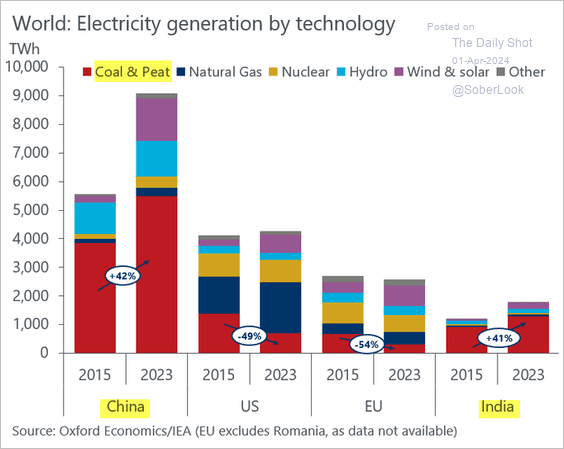 Source: @DanielKral1, @OxfordEconomics
• China’s lip service on climate:
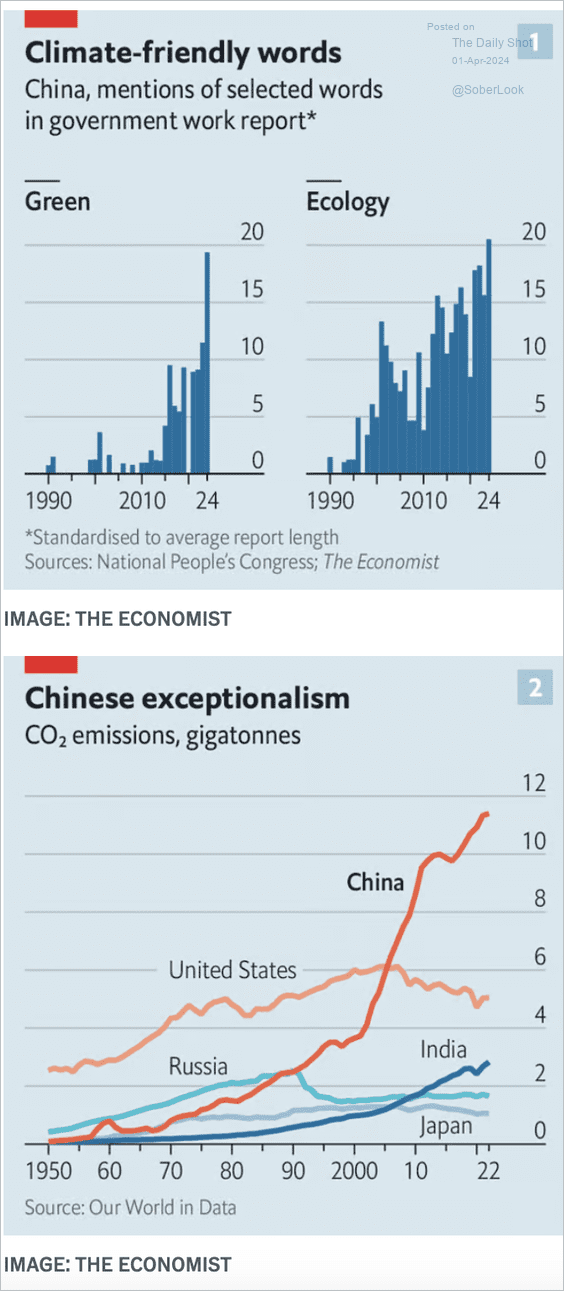 Source: The Economist Read full article
——————–
2. Heart disease mortality rates across the US:
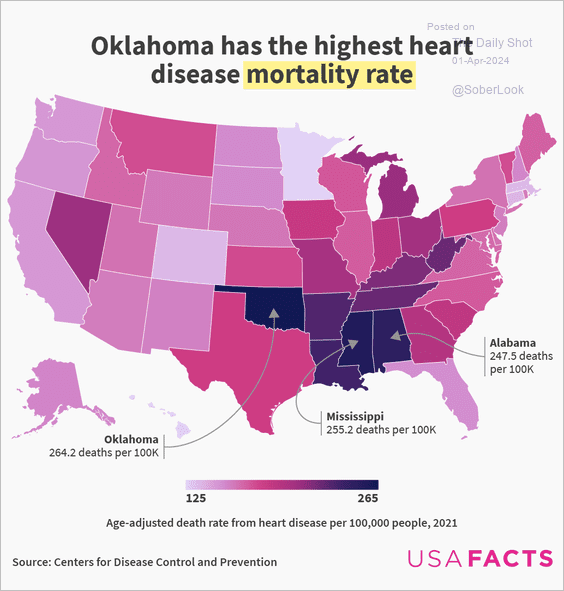 Source: USAFacts
3. Increasing trend of medication abortions as a proportion of total US abortions:
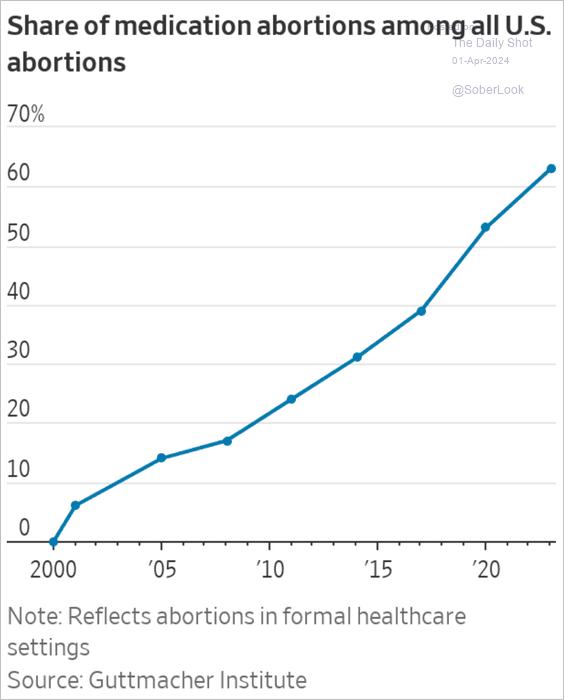 Source: @WSJ Read full article
4. Attempts to ban or restrict library books:
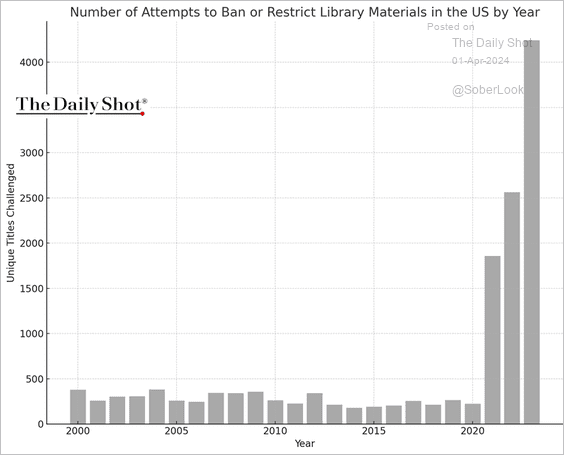 Source: American Library Association
5. Egg prices:
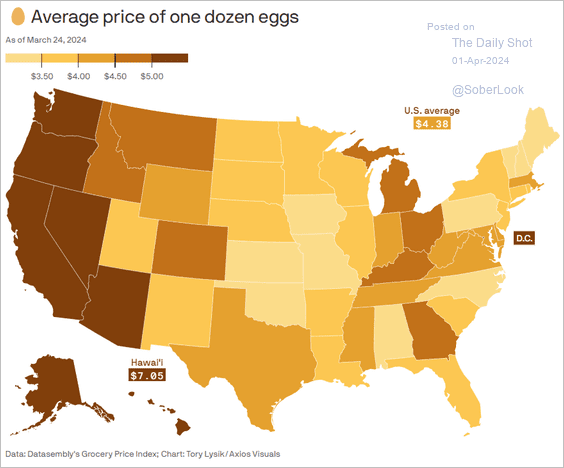 Source: @axios Read full article
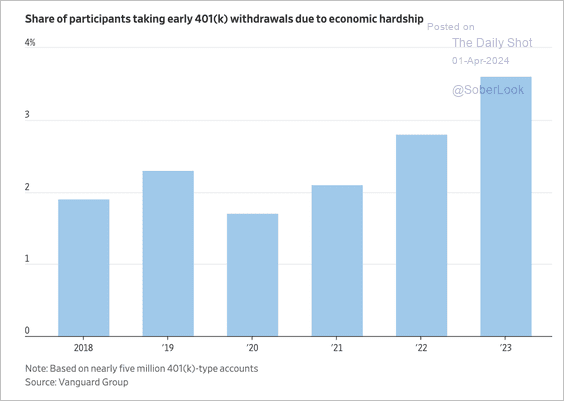
6. Early 401-k withdrawals due to economic hardship:
 Source: @WSJ Read full article
7. Maritime zones and airspace jurisdiction boundaries:
 Source: @financialtimes Read full article
——————–
Back to Index