
The Daily Shot: 05-Apr-24
• The United States
• Canada
• The United Kingdom
• The Eurozone
• Europe
• Asia-Pacific
• Emerging Markets
• Commodities
• Energy
• Equities
• Credit
• Global Developments
• Food for Thought
The United States
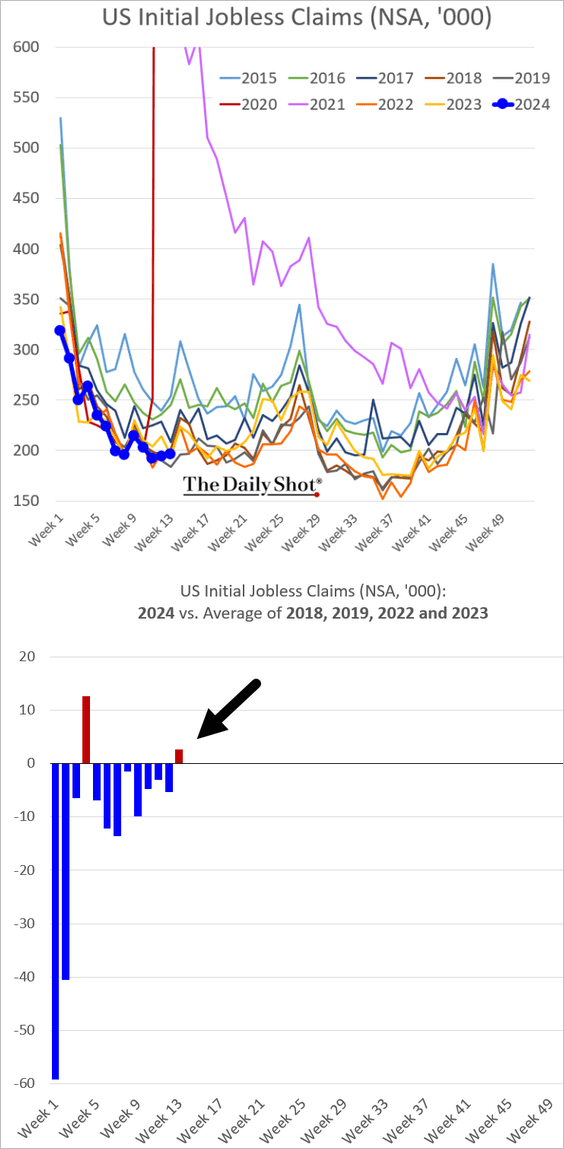
1. Let’s begin with the labor market.
• Initial unemployment applications moved higher last week.
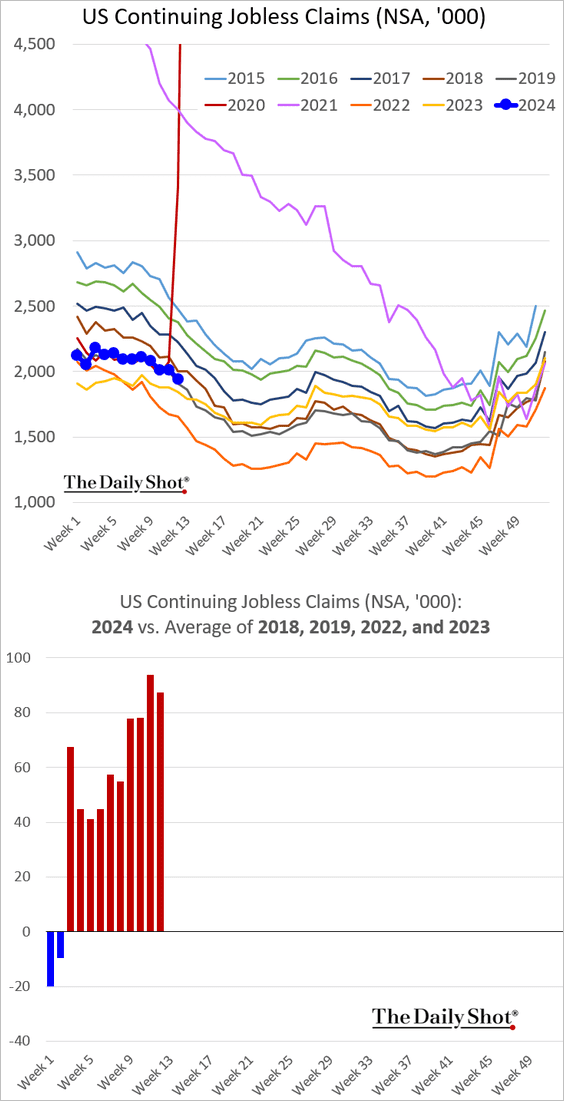
– Continuing claims are still running above 2022 and 2023 levels.
– This seasonally adjusted chart illustrates the divergence between initial and continuing claims.
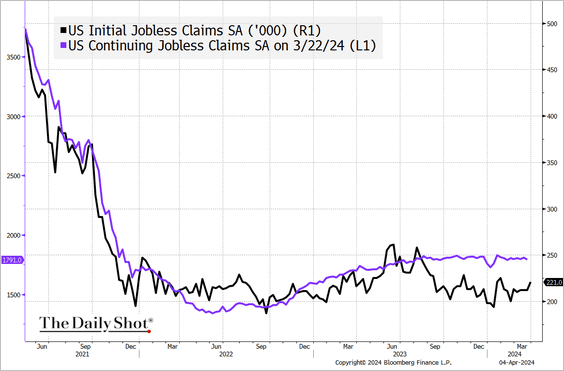 Source: @TheTerminal, Bloomberg Finance L.P.
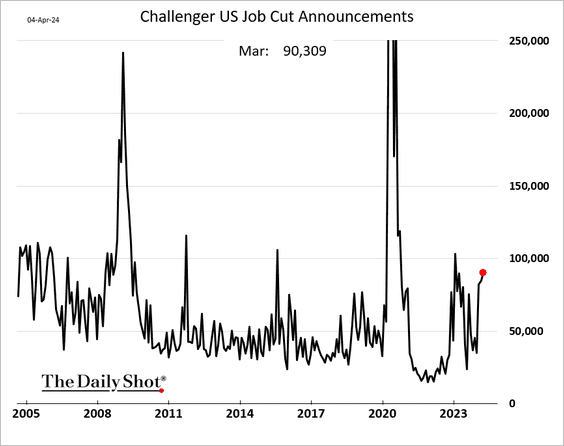
• The Challenger index of layoff announcements increased again last month.
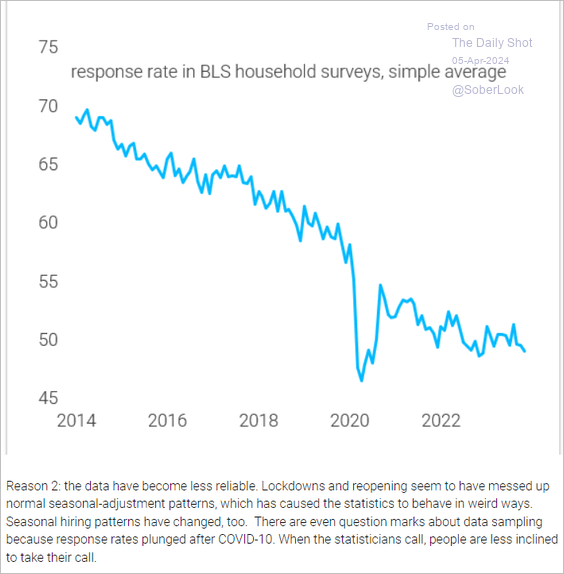
• The Bureau of Labor Statistics’ response rate to the Household Survey has been trending lower, resulting in more volatility in the employment data.
 Source: TS Lombard
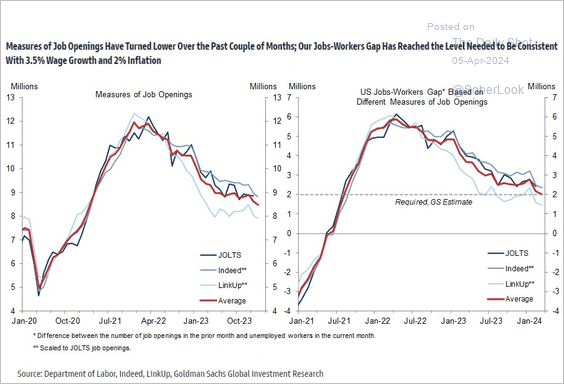
• Leading indicators point to further declines in job openings.
 Source: Goldman Sachs; @MikeZaccardi
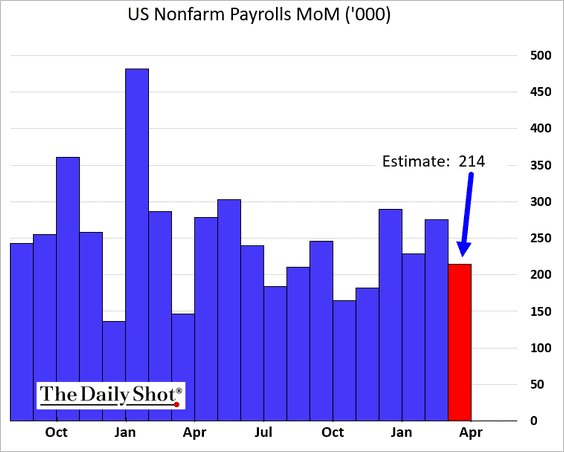
• What should we expect from today’s employment report? Estimates suggest that job growth held up well last month.
– Consensus (214k):
– Oxford Economics (195k):
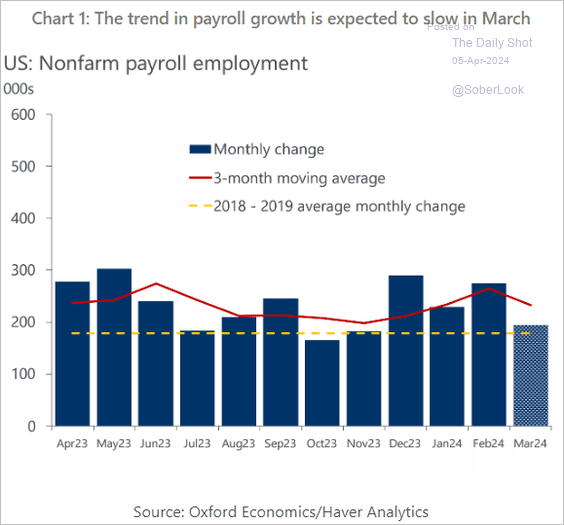 Source: Oxford Economics
– Morgan Stanley (245k):
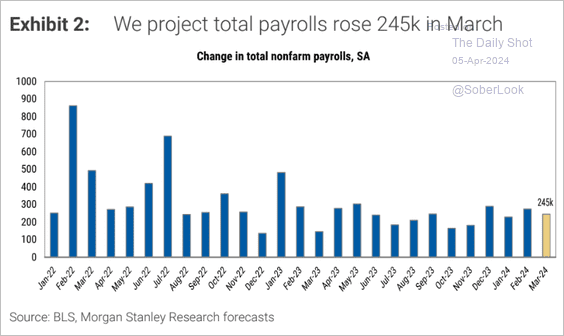 Source: Morgan Stanley Research
Morgan Stanley estimates that the unemployment rate remained unchanged in March.
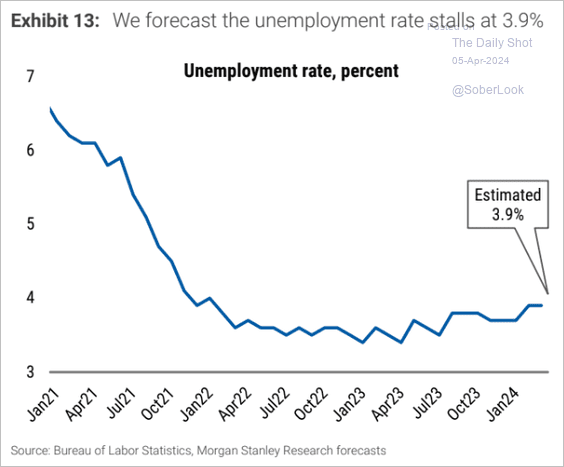 Source: Morgan Stanley Research
• The payrolls figures have been surprising to the upside.
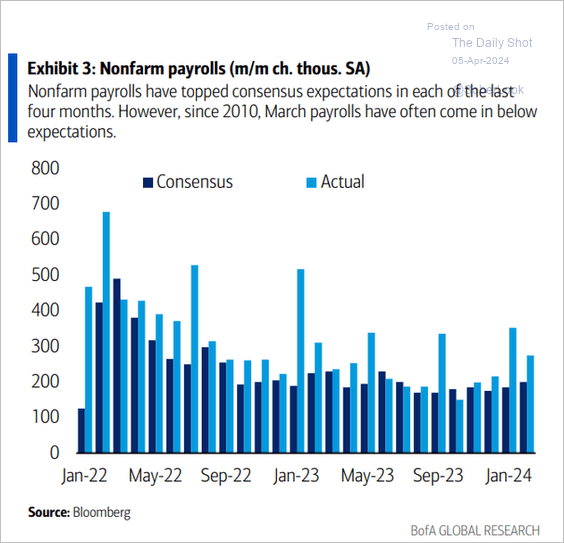 Source: BofA Global Research
• The NFIB’s small business hiring intentions suggest potential challenges for the labor market in the months ahead.
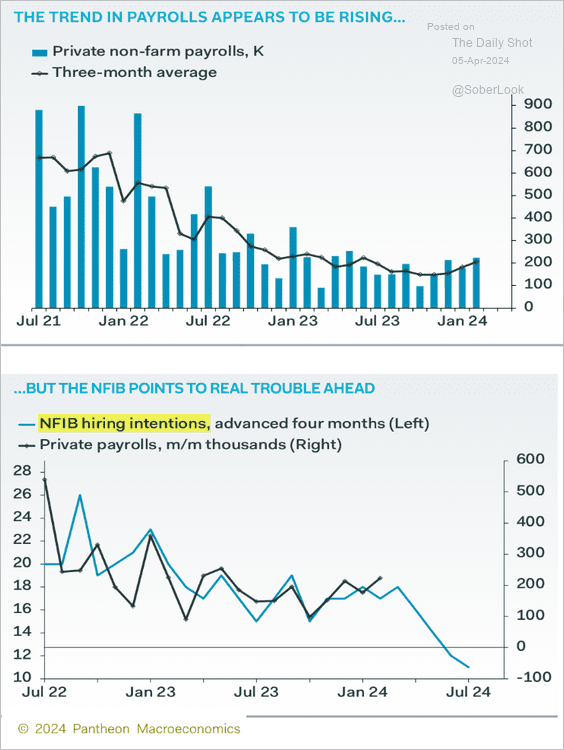 Source: Pantheon Macroeconomics
——————–
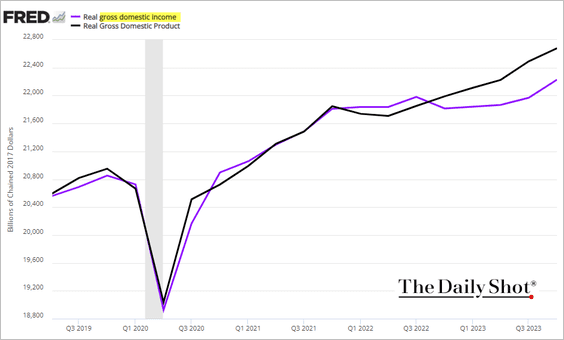
2. The GDP-GDI divergence persists.
3. The US trade deficit widened further in February as imports strengthened.
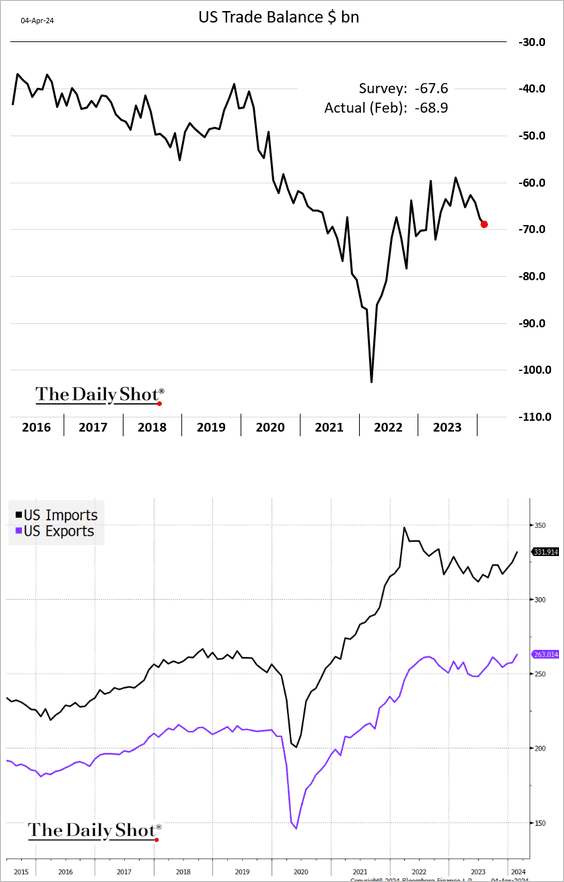 Source: @TheTerminal, Bloomberg Finance L.P.
• The trade deficit with Mexico reached a record high, whereas the trade gap with China decreased.
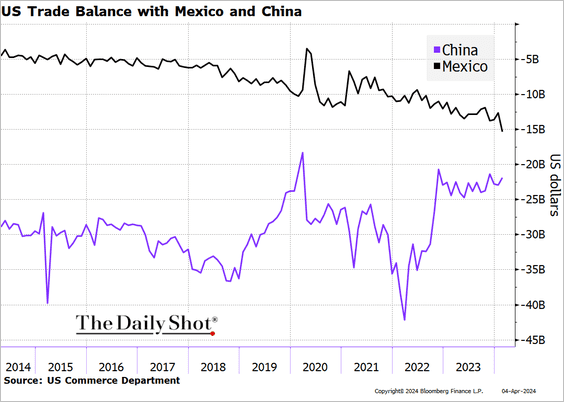 Source: @TheTerminal, Bloomberg Finance L.P.
——————–
4. Twitter-based economic sentiment has diverged from the University of Michigan’s consumer sentiment.
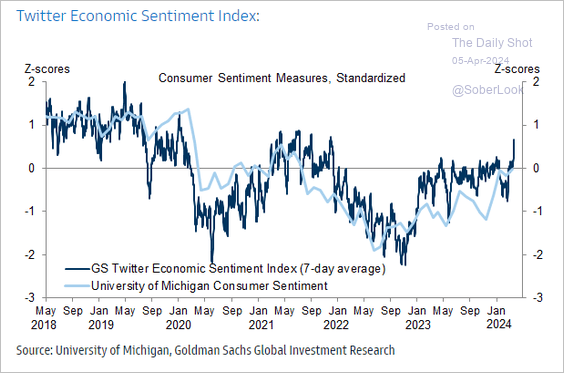 Source: Goldman Sachs; @MikeZaccardi
Back to Index
Canada
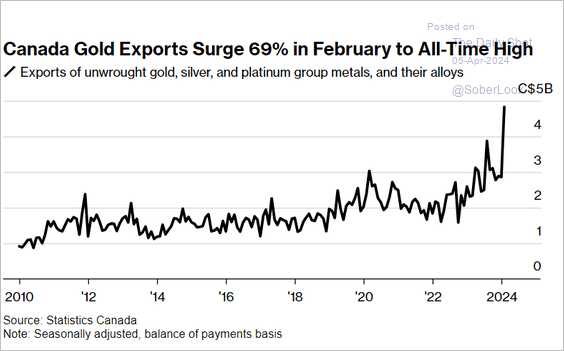
1. The trade surplus surprised to the upside, …
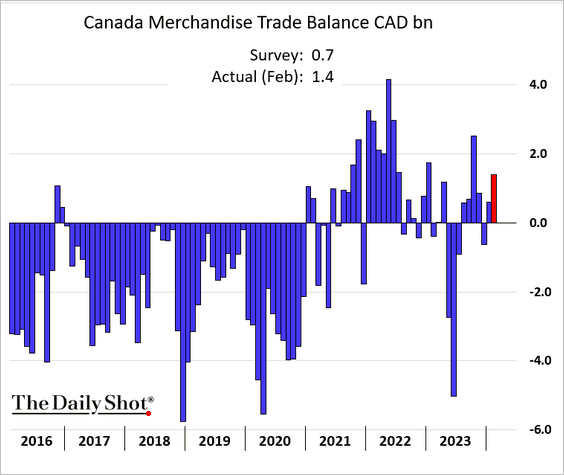
… boosted by gold exports.
 Source: @economics Read full article
——————–
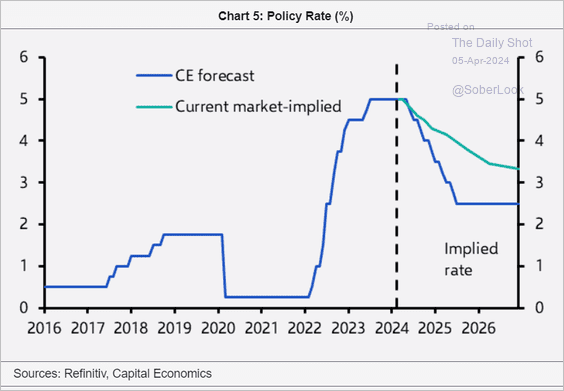
2. Capital Economics sees a much steeper pace of BoC rate cuts than the market.
 Source: Capital Economics
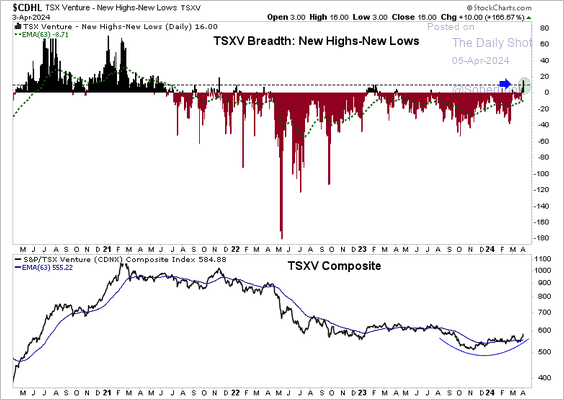
3. The TSX Venture Index’s (microcaps) breadth is expanding alongside improving relative performance.
 Source: Aazan Habib, Paradigm Capital
Back to Index
The United Kingdom
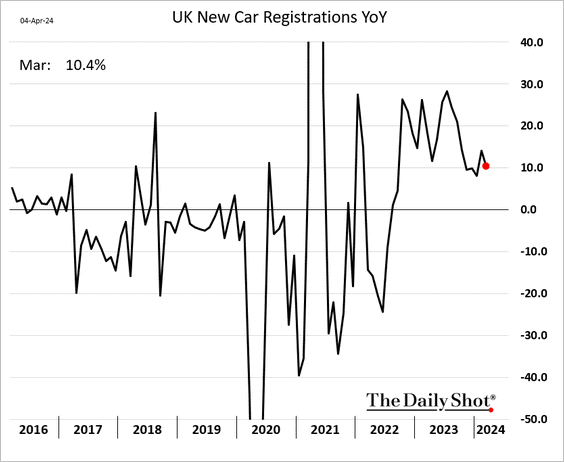
1. New vehicle sales continue to run above last year’s levels.
2. Wage growth is slowing.
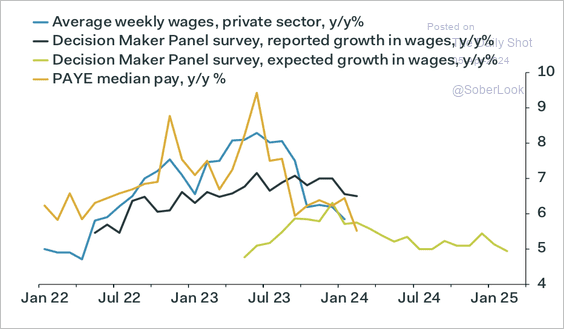 Source: Pantheon Macroeconomics
• Job vacancy numbers have been dropping.
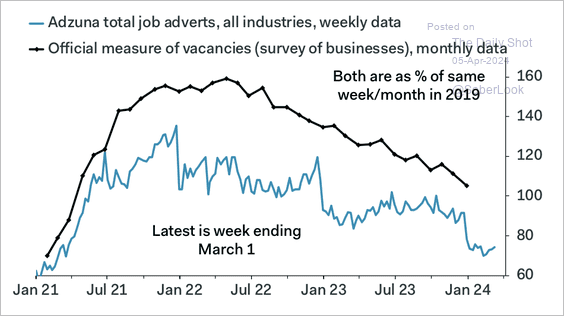 Source: Pantheon Macroeconomics
——————–
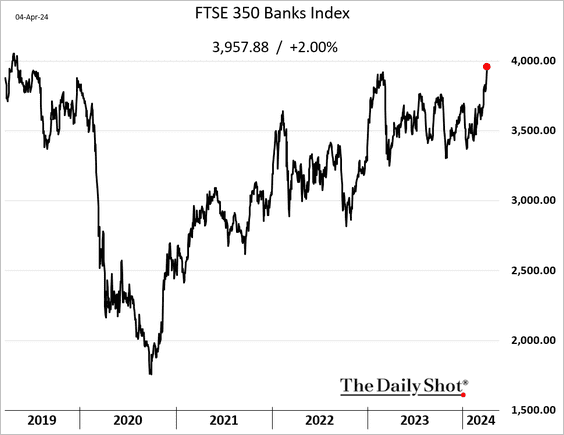
3. Bank shares reached a multi-year high.
Back to Index
The Eurozone
1. The services PMI figures for France and Germany were adjusted higher.
– Germany (stabilized):
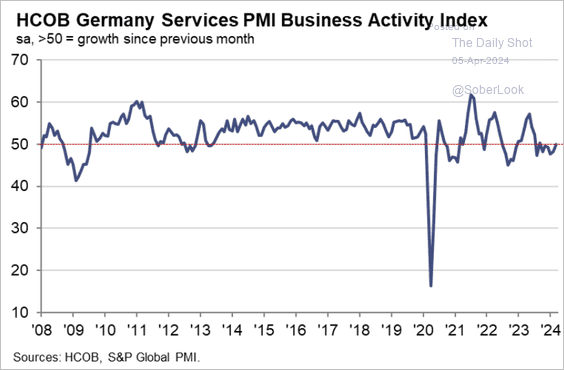 Source: S&P Global PMI
– France (slowing declines):
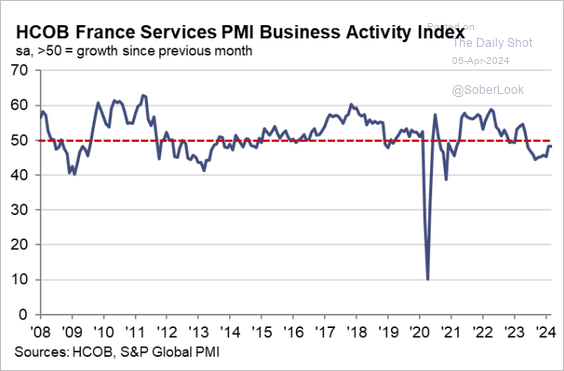 Source: S&P Global PMI
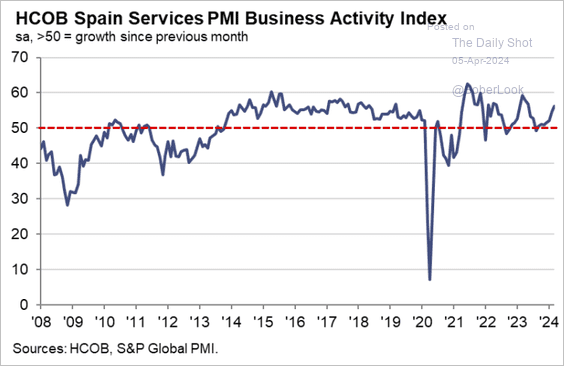
• Service firms in Italy and Spain are reporting accelerating growth.
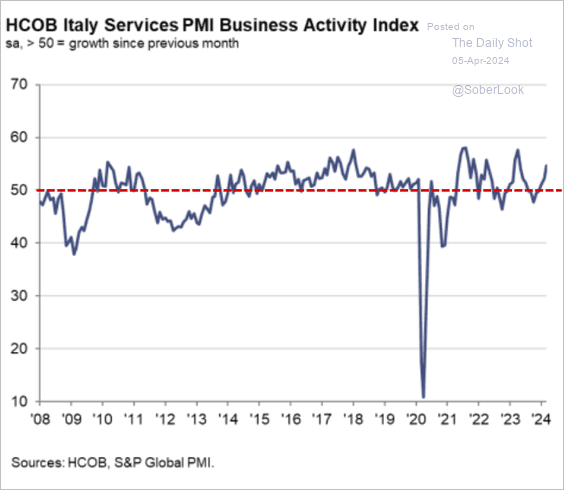 Source: S&P Global PMI
 Source: S&P Global PMI
• The Eurozone Composite PMI is now in growth territory.
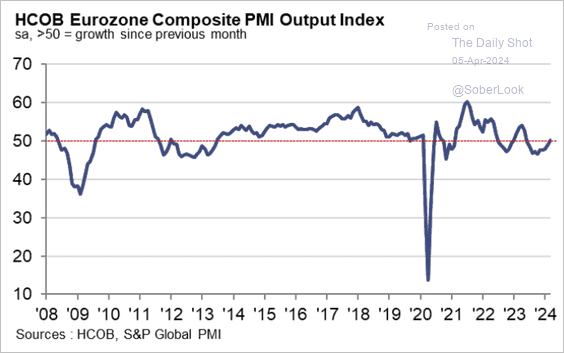 Source: S&P Global PMI
——————–
2. The ECB is preparing to lower interest rates.
• Wage growth is moving lower.
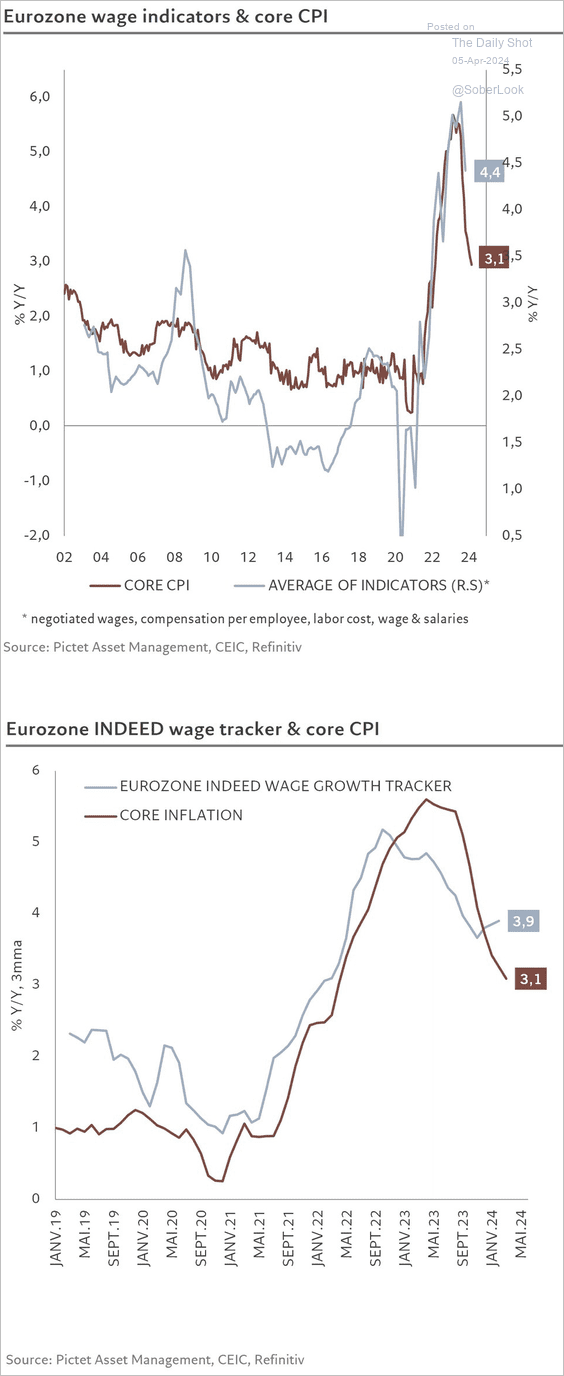 Source: @skhanniche
• The real policy rate is increasingly restrictive.
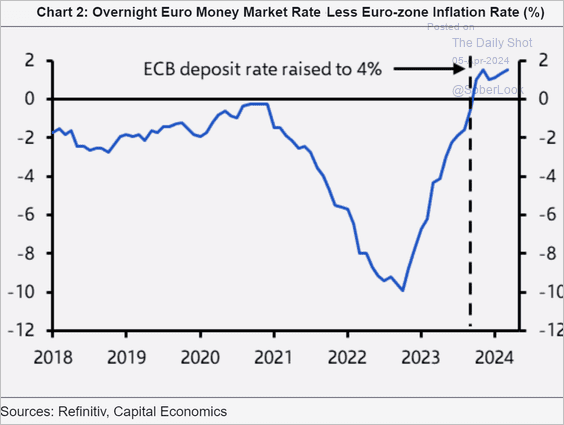 Source: Capital Economics
Back to Index
Europe
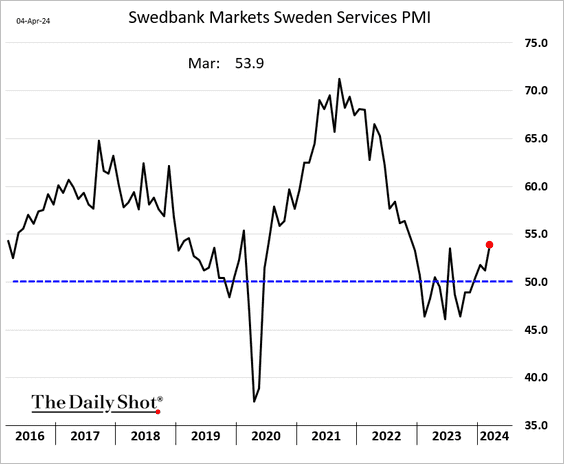
1. Sweden’s services activity is picking up momentum.
2. Container shipping costs from Asia continue to trend lower.
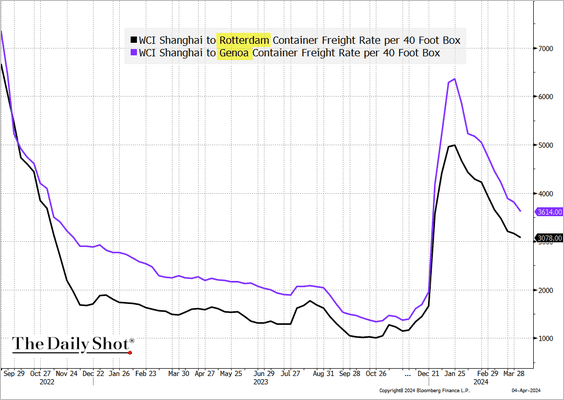 Source: @TheTerminal, Bloomberg Finance L.P.
3. European banks are overbought.
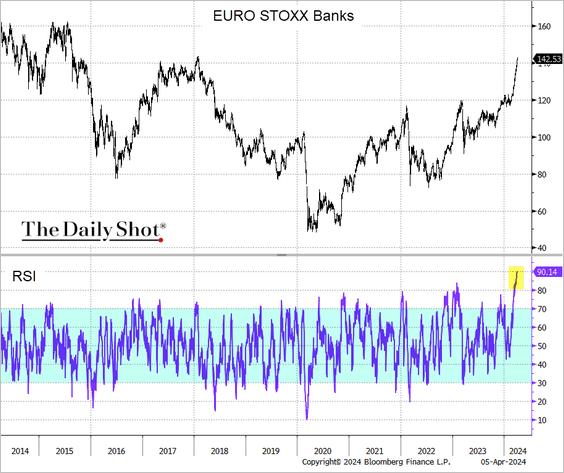 Source: @TheTerminal, Bloomberg Finance L.P.
Back to Index
Asia-Pacific
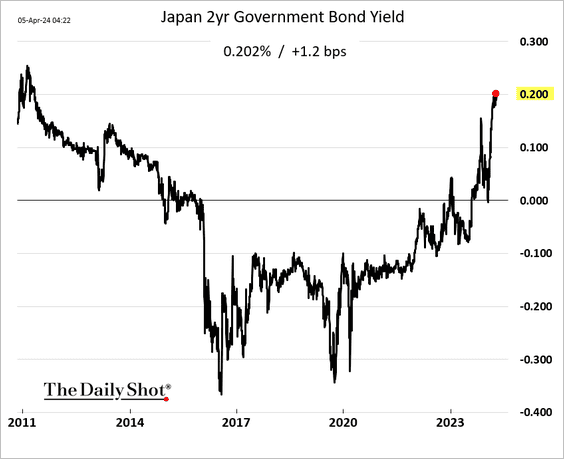
1. The 2-year JGB yield breached 0.2% for the first time since 2011 as the market prices in BoJ rate hikes.
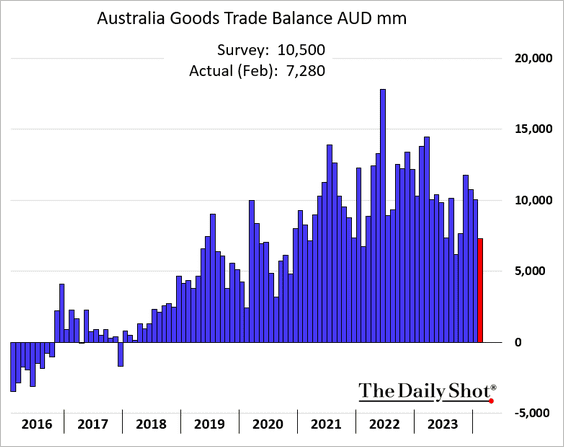
2. Australia’s trade surplus surprised to the downside.
Back to Index
Emerging Markets
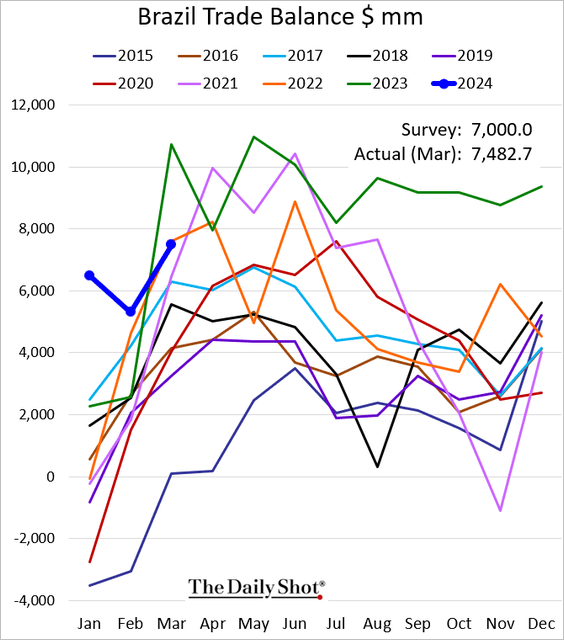
1. Brazil’s exports in March fell below 2023 levels but exceeded expectations.
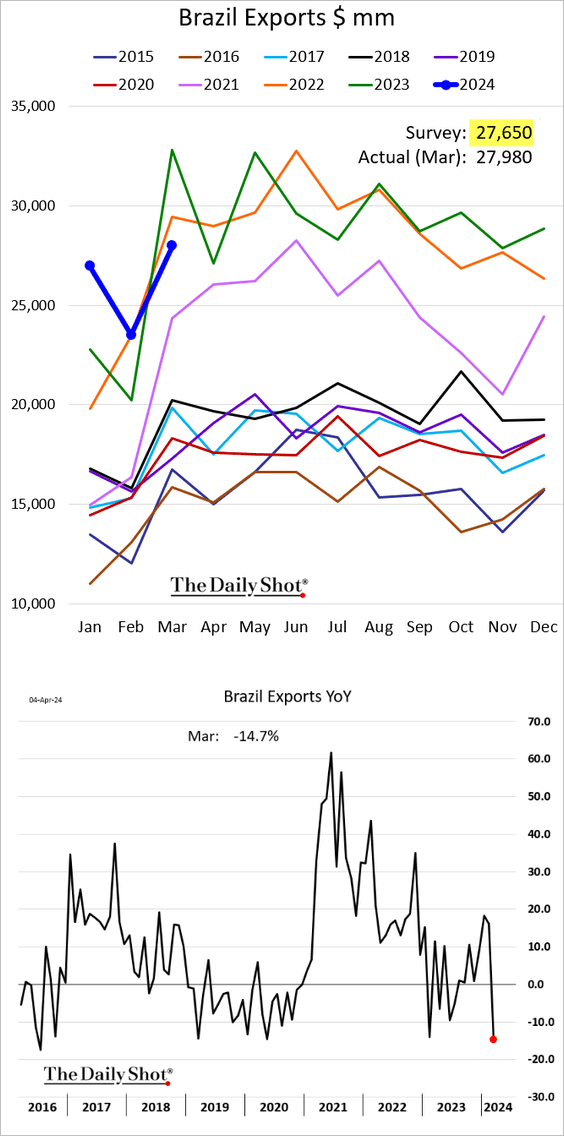
Here is the trade balance.
——————–
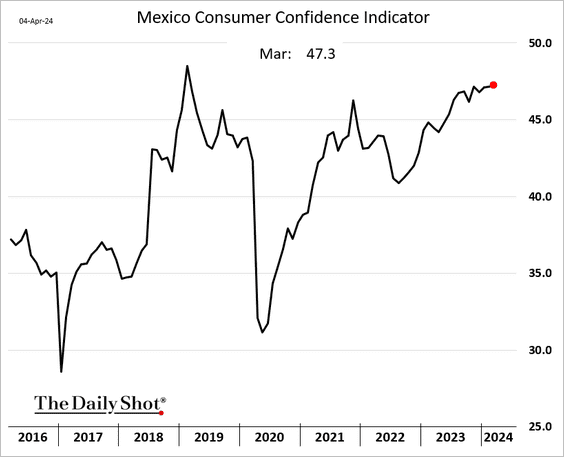
2. Mexico’s consumer sentiment remains strong.
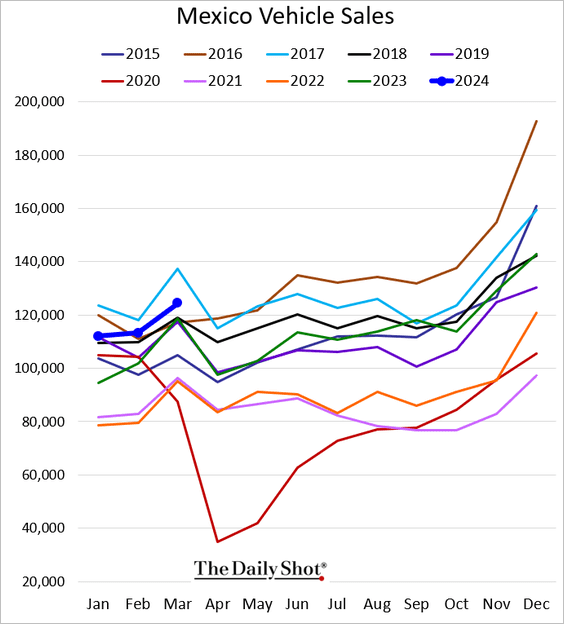
• Vehicle sales held above last year’s levels.
——————–
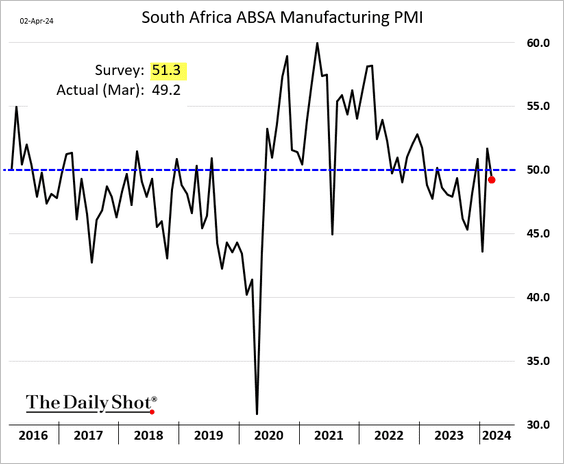
3. South Africa’s manufacturing activity shifted into contraction territory last month.
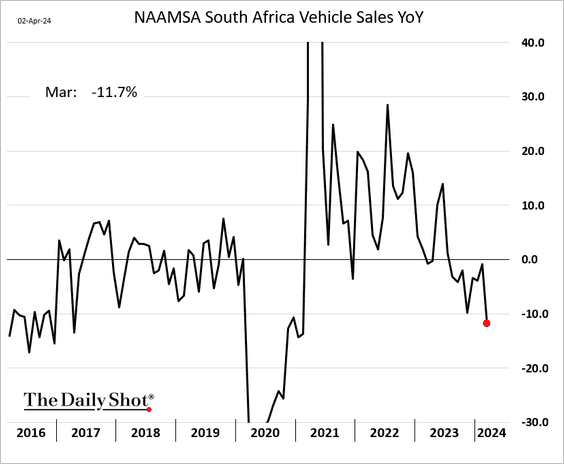
• Vehicle sales deteriorated.
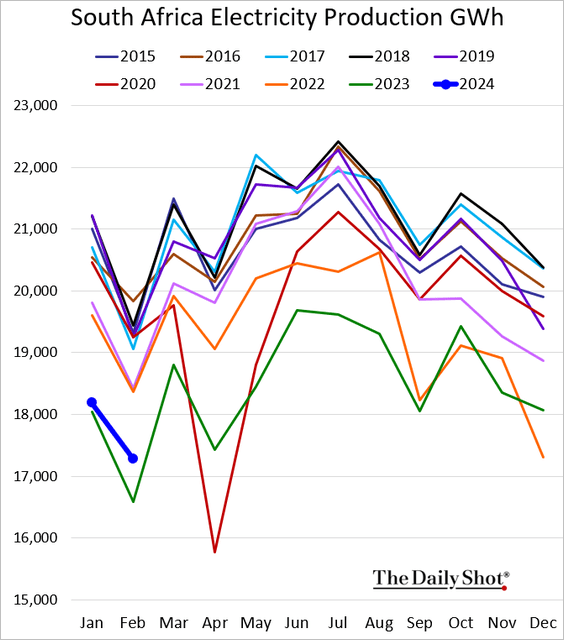
• The nation’s electricity output is above last year’s levels but still depressed.
——————–
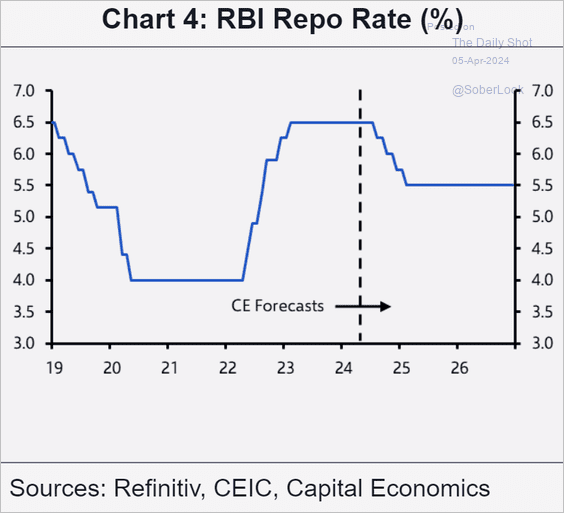
4. India’s RBI kept rates steady, yet Capital Economics anticipates rate cuts in the near future.
 Source: Capital Economics
• The investment share of India’s GDP has risen to levels last seen in more than a decade.
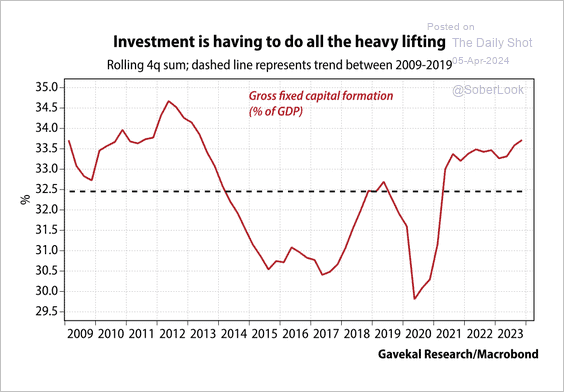 Source: Gavekal Research
• Capital flows into India-focused equity funds are surging.
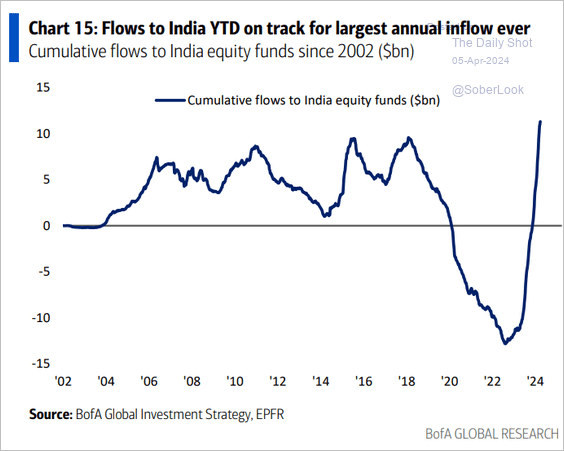 Source: BofA Global Research
Back to Index
Commodities
1. Bloomberg’s broad commodity index is above its 200-day moving average.
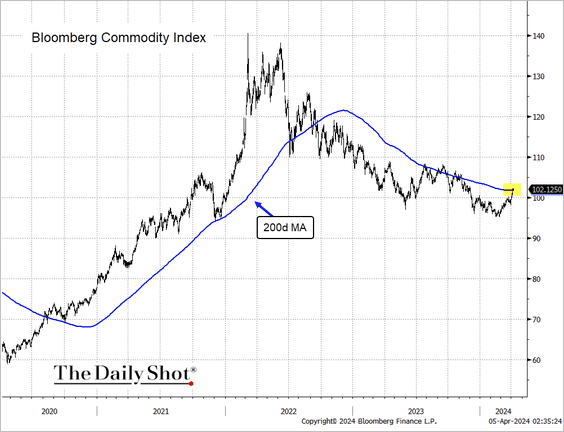 Source: @TheTerminal, Bloomberg Finance L.P.
2. This chart compares corn exports from the US and Brazil to China.
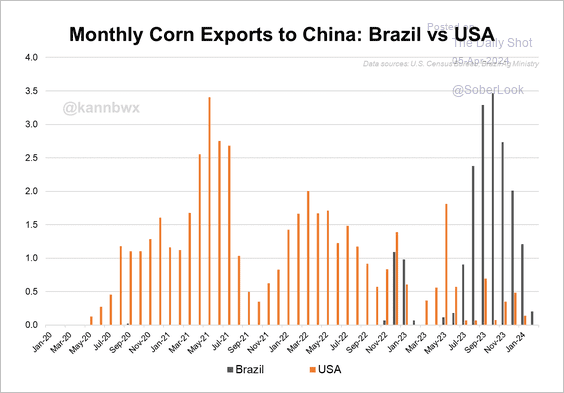 Source: @kannbwx
Back to Index
Energy
1. Brent crude breached $90/bbl amid geopolitical tensions.
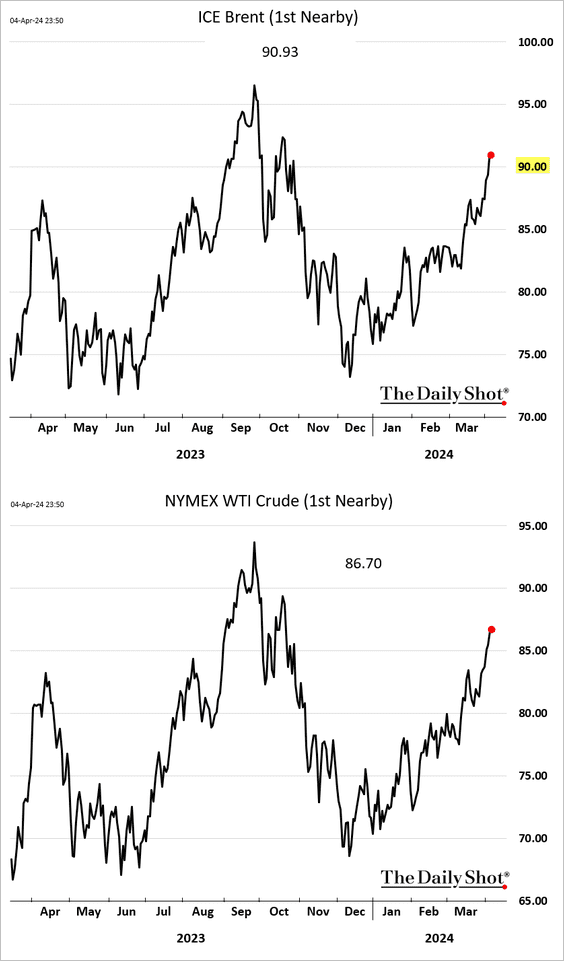
 Source: Reuters Read full article
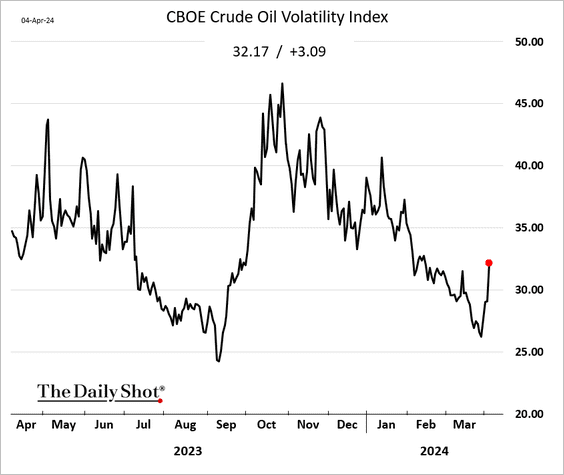
2. Implied volatility in crude oil jumped this week from recent lows.
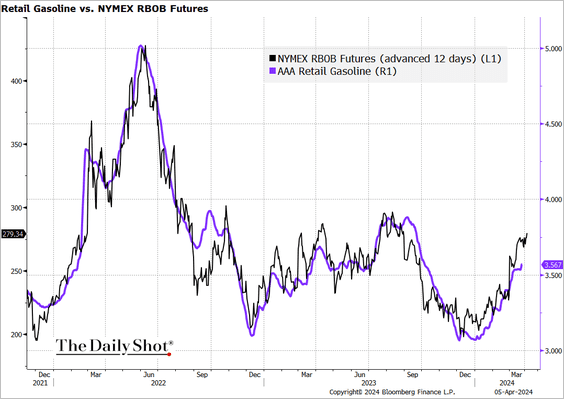
3. US gasoline prices are climbing, which could impact US inflation expectations and consumer sentiment.
 Source: @TheTerminal, Bloomberg Finance L.P.
Back to Index
Equities
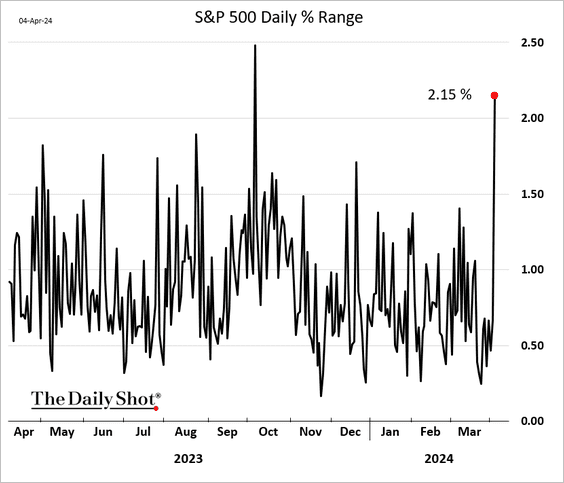
1. Volatility is back.
• Stocks saw a sharp intraday drop ahead of the jobs report.
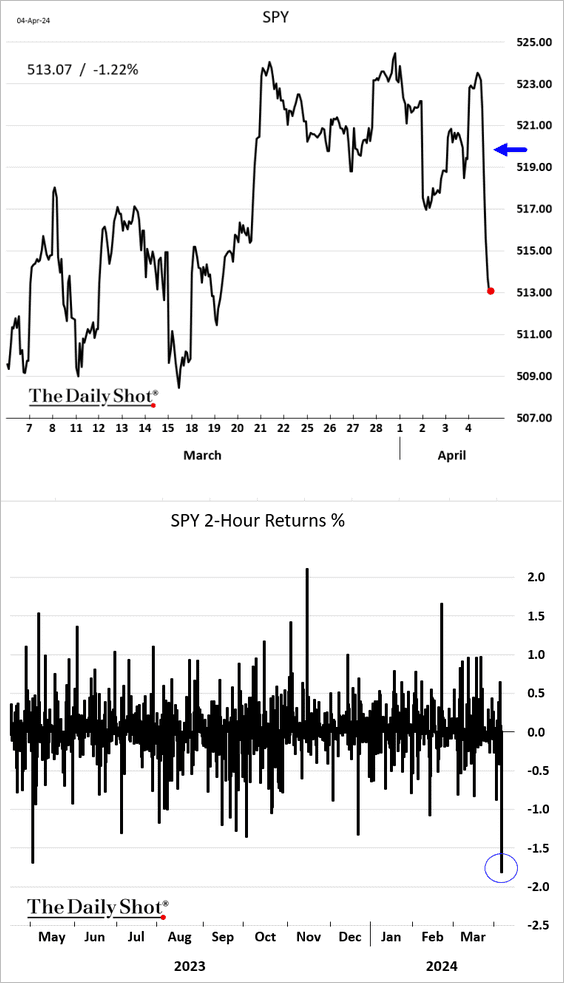
Here is the intraday trading range.
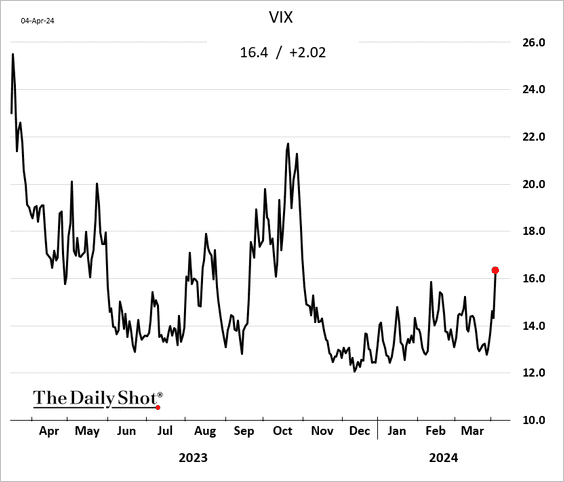
• VIX climbed above 16 for the first time in months.
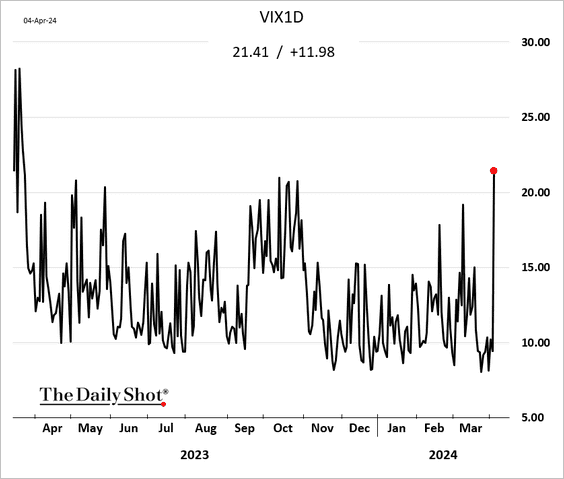
Below is the 1-day VIX.
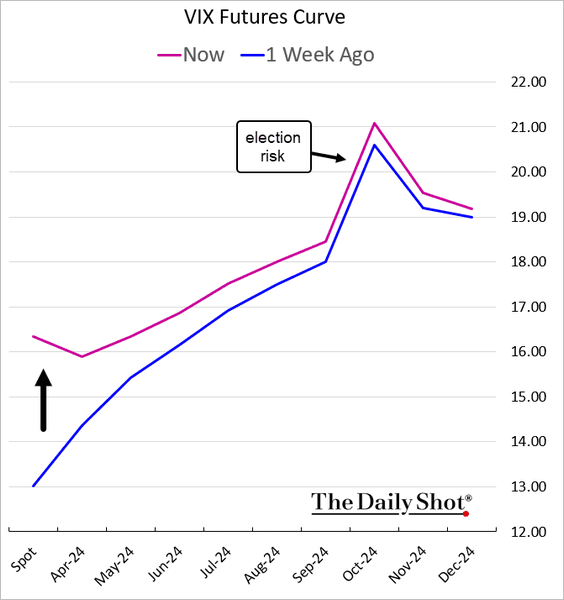
• The front end of the VIX curve moved into backwardation.
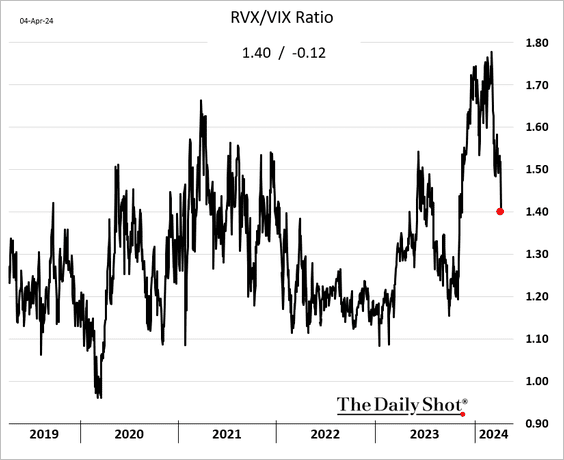
• The ratio of RVX (Russell 2000 VIX-equivalent) to VIX is returning to more typical levels.
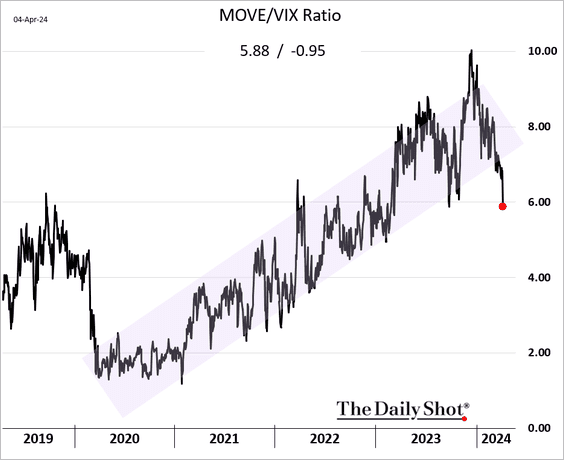
• The MOVE/VIX ratio broke below its uptrend channel (MOVE is the VIX-equivalent for Treasuries).
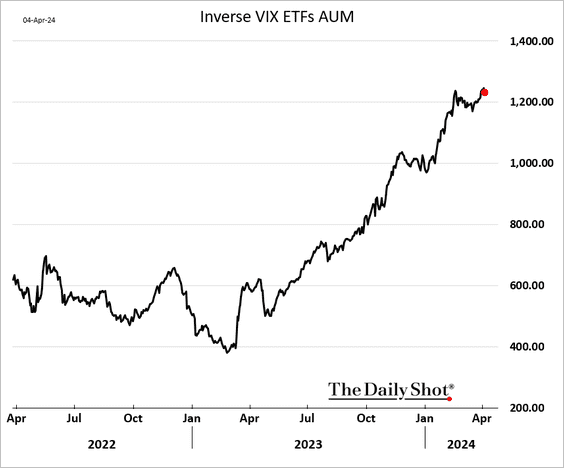
• This has got to hurt. Retail investors have been loading up on short-vol ETFs over the past 12 months (riding the Theta decay).
——————–
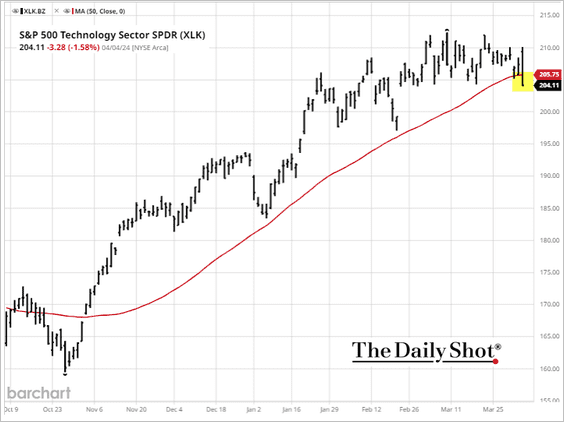
2. The Dow dipped below its 50-day moving average, …
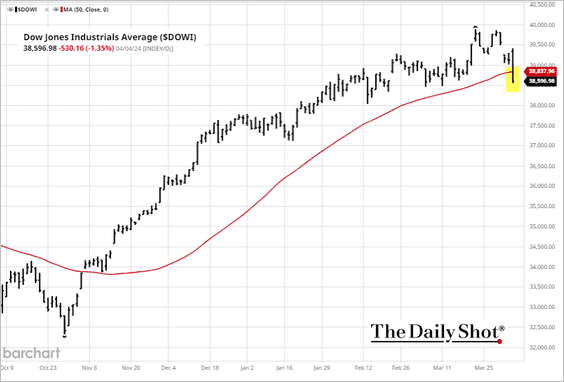
… and so did the tech index.
——————–
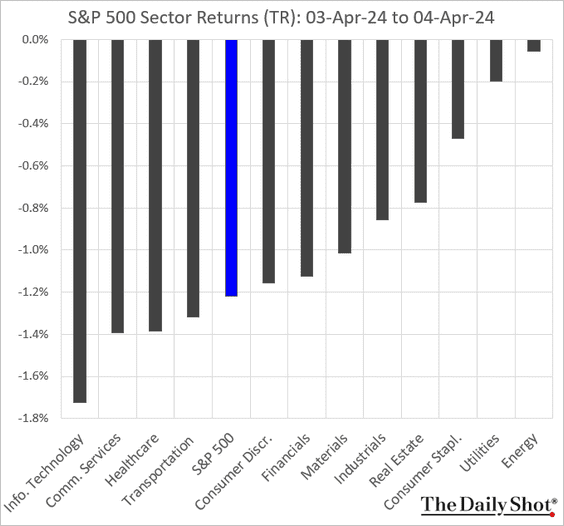
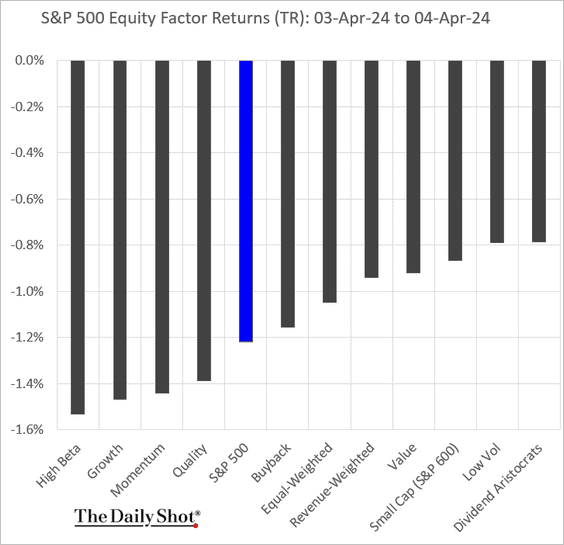
3. Here is a look at market performance on Thursday.
• Sectors:
• Equity factors/styles:
——————–
4. Equity funds registered another weekly inflow.
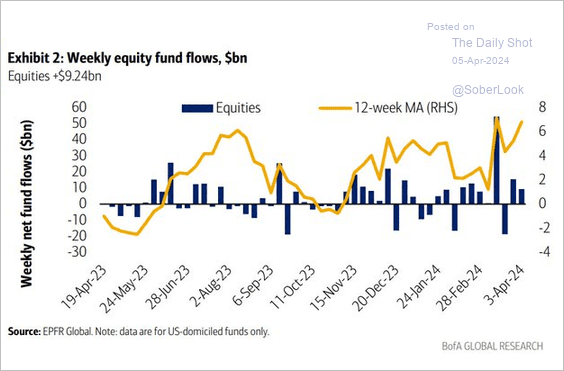 Source: BofA Global Research
5. Rising liquidity (boosted by higher bank reserves at the Fed) has been a tailwind for stocks.
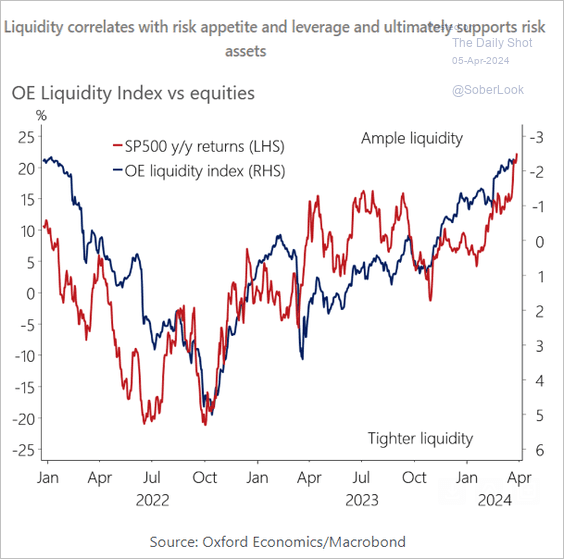 Source: Oxford Economics
But that support is expected to end this quarter.
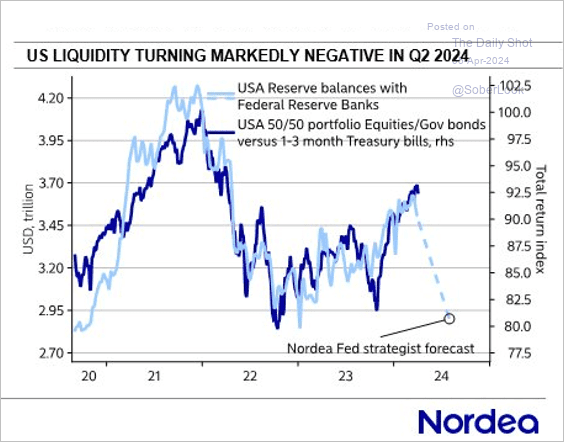 Source: Nordea Markets
——————–
6. Non-US equities continue to trade a deep valuation discount with higher dividend yields than the US. (2 charts)
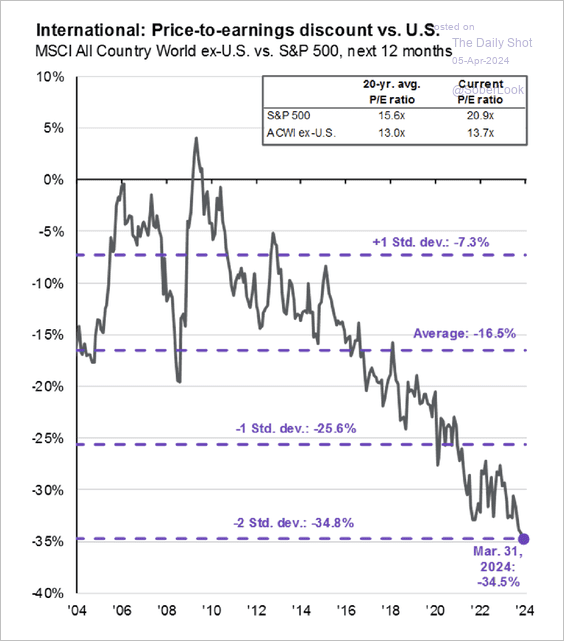 Source: J.P. Morgan Asset Management
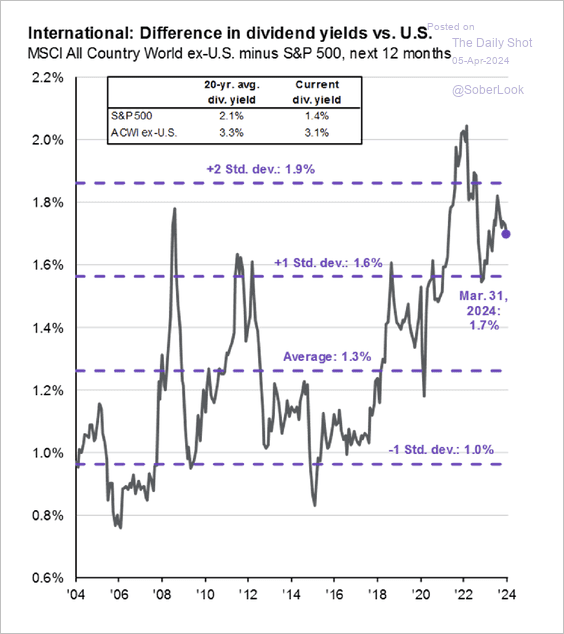 Source: J.P. Morgan Asset Management
——————–
7. The youngest US age group has experienced the largest growth in equity and mutual fund assets over the past five years.
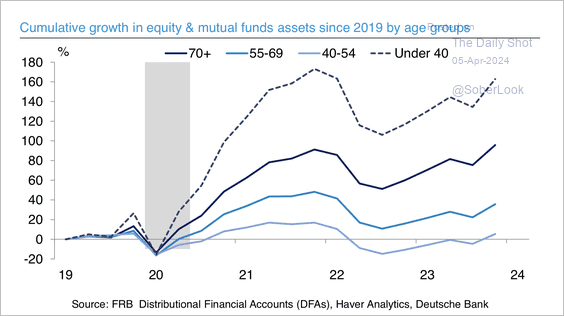 Source: Deutsche Bank Research
Back to Index
Credit
1. Are property operators (REITs) too cheap, given tighter CMBS spreads?
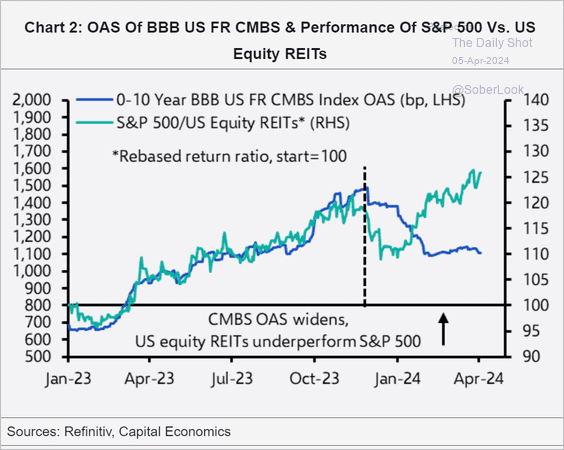 Source: Capital Economics
2. Office vacancies keep rising.
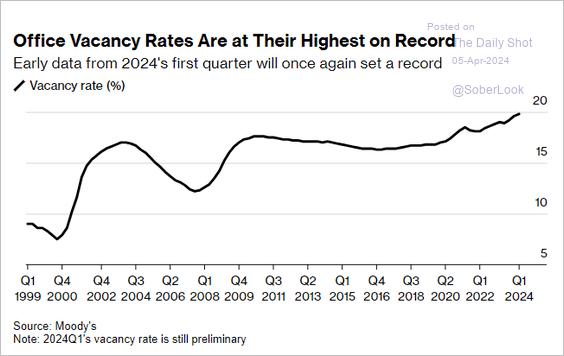 Source: @business Read full article
Back to Index
Global Developments
1. Inflation across G10 nations is moderating but remains sticky.
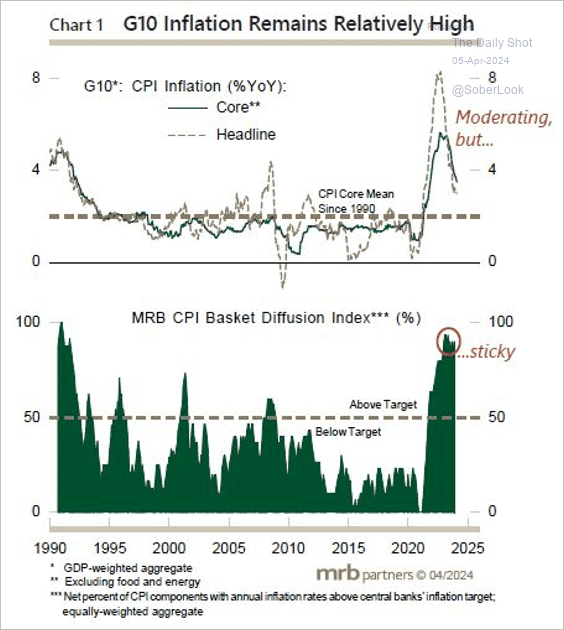 Source: MRB Partners
2. This chart shows pension fund allocations across different countries.
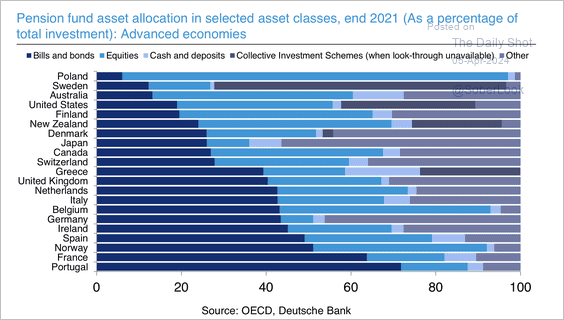 Source: Deutsche Bank Research
——————–
Food for Thought
1. Foreign-born share of the US labor force:
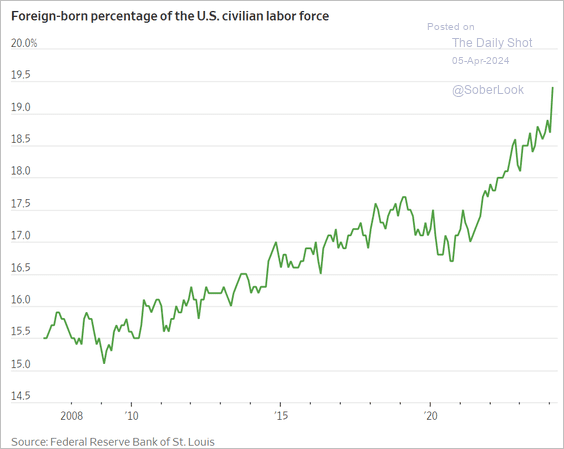 Source: @WSJ Read full article
2. Historical trend in abortion rates in formal healthcare settings:
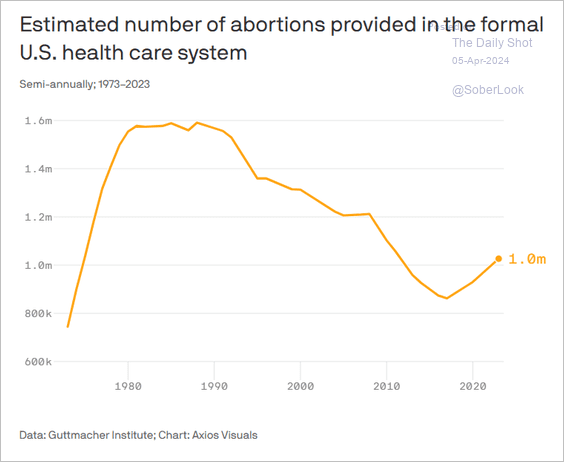 Source: @axios Read full article
3. 2024 US presidential election polling in key states:
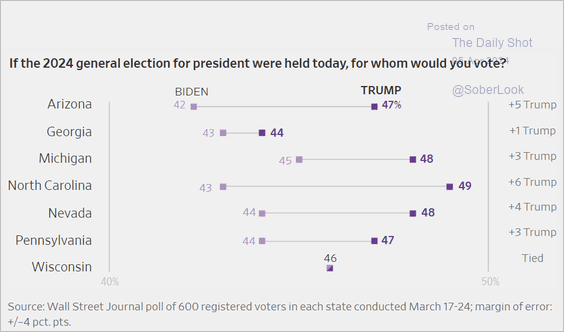 Source: @WSJ Read full article
4. Opioid overdose deaths by race/ethnicity:
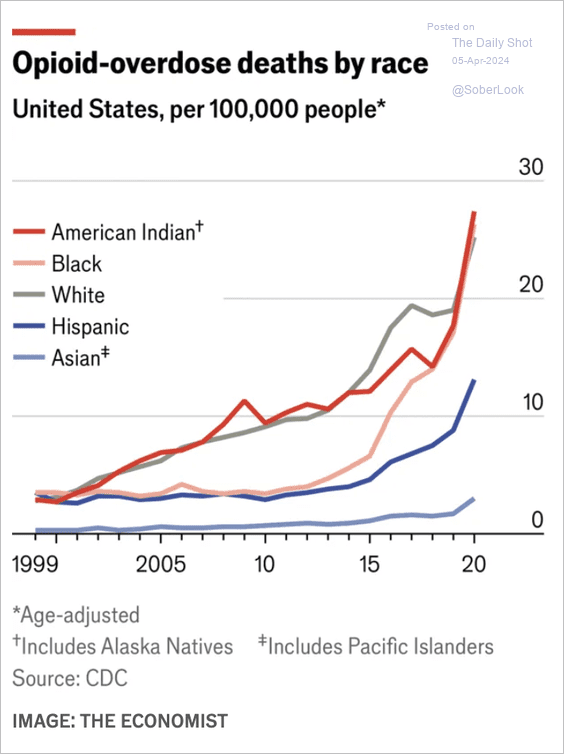 Source: The Economist Read full article
5. Projected increase in the elderly population’s share of the total US population:
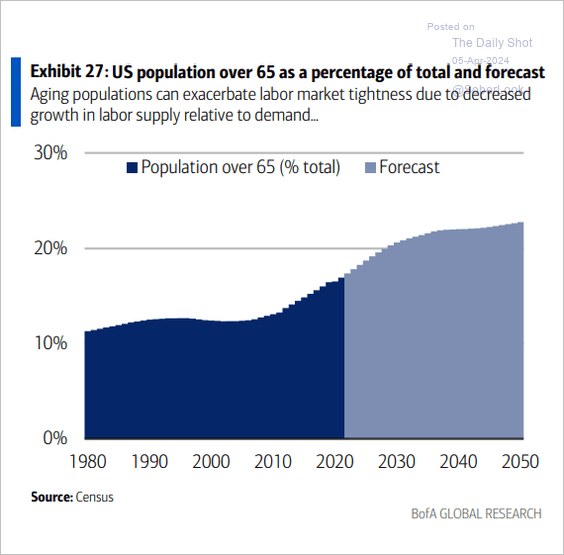 Source: BofA Global Research
6. Getting ready for the eclipse (2 charts):
 Source: @Jamie_Lane, @airdna
 Source: WRAL-TV Read full article
——————–
Have a great weekend!
Back to Index