
The Daily Shot: 08-May-24
• The United States
• The United Kingdom
• The Eurozone
• Europe
• Australia
• China
• Emerging Markets
• Commodities
• Energy
• Equities
• Credit
• Food for Thought
The United States
1. Growth in consumer credit slowed in March, …

… corroborating reports from banks that consumer credit demand has been dropping. Will we see further weakness in consumer credit in the months ahead?
 Source: Oxford Economics
• Consumer credit as a share of US GDP continues to drop.

• Real credit card balances declined in March, …
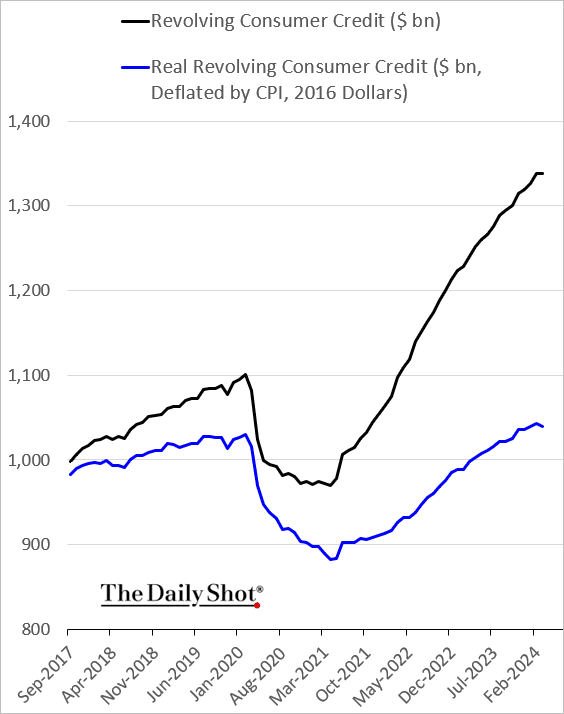
… and so did credit card debt as a share of disposable income.

• Student debt balances rebounded in the first quarter.
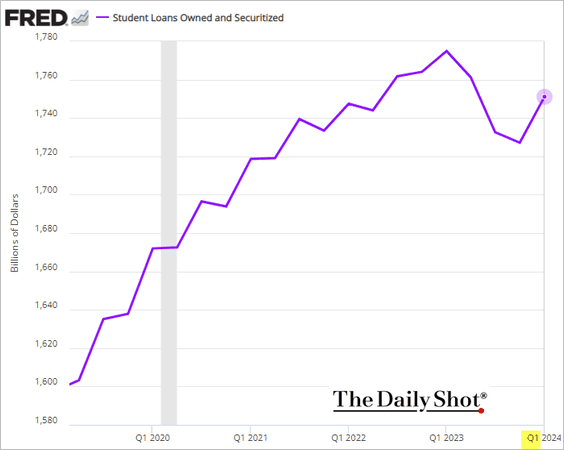
This chart shows student debt balances as a share of total consumer credit.

——————–
2. A chart from the San Francisco Fed has been making rounds on social media. It’s over – US households have run out of excess savings …
 Source: Federal Reserve Bank of San Francisco, h/t Tatiana Darie, Bloomberg Markets Live
Or maybe not. Much depends on the assumptions about the pre-COVID trend.
 Source: Mizuho Securities USA
——————–
3. Wholesale used car prices continue to fall.

Will we see this trend reflected in the CPI?
 Source: @SteveRattner
——————–
4. Foreign-born Americans have been the primary driver of growth in the US prime-age population.
 Source: Oxford Economics
Back to Index
The United Kingdom
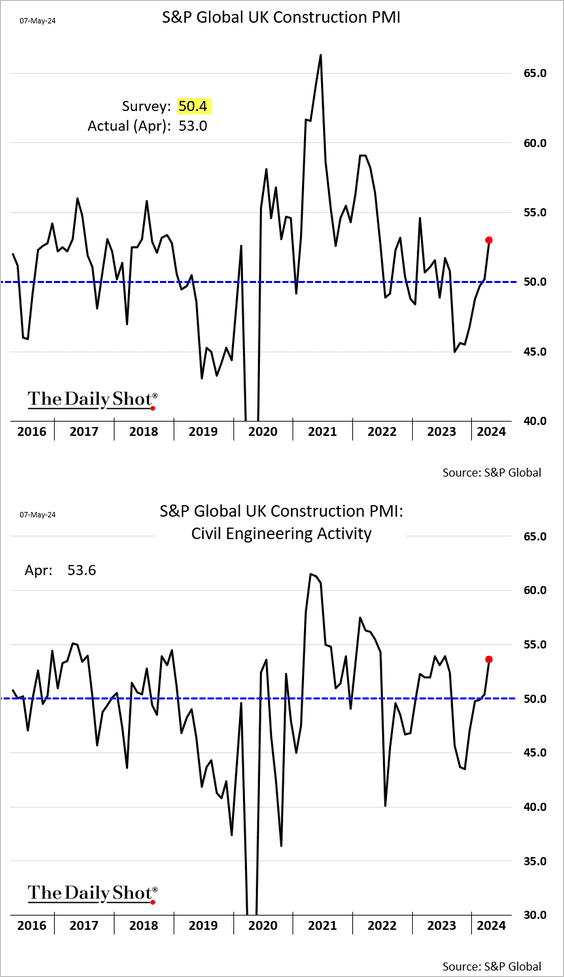
1. Construction activity is rebounding.
2. Manufacturing price indicators have been rising recently, while upstream price indicators remain above historical norms.
 Source: Nomura Securities
3. The current level of house prices appears too high based on price/income ratios relative to interest rates.
 Source: Nomura Securities
4. Here is a look at trends in NHS elective care wait times and patient lists.
 Source: @financialtimes Read full article
Back to Index
The Eurozone
1. Let’s begin with Germany.
• Factory orders remained soft in March.

 Source: @WSJ Read full article
– Domestic demand continues to sink.
 Source: Capital Economics
• After two months of gains, industrial production declined.

• The PMI report shows a persistent recession in Germany’s construction sector.

• The trade surplus increased in March.

 Source: @WSJ Read full article
– This chart shows the trade deficits of the US and Germany with China.
 Source: @DanielKral1, @OxfordEconomics
——————–
2. Euro-area retail sales increased in March.

3. The French trade deficit continues to narrow.

4. Italy’s construction activity is shrinking again.
 Source: Arcano Economics
Back to Index
Europe
1. The SNB’s balance sheet has been expanding this year.

2. The Czech Republic’s manufacturing output declined in March.

• The nation’s trade surplus hit a record high.

——————–
3. EU governments have been expanding support for domestic companies.
 Source: @WSJ Read full article
Back to Index
Australia
Australian bond yields and the Aussie dollar declined after the RBA eased concerns about the risk of rate hikes.

 Source: Reuters Read full article
Back to Index
China
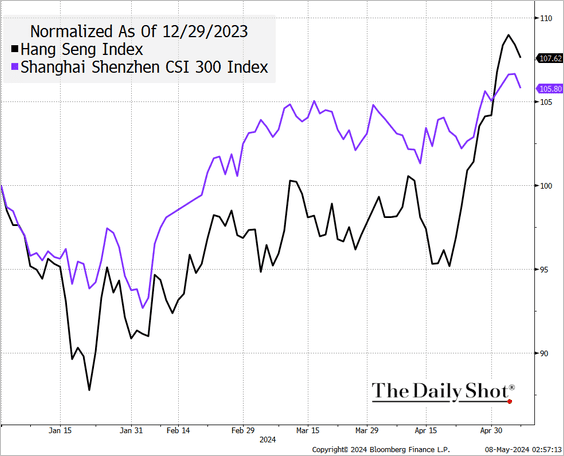
1. Hong Kong stocks have outperformed mainland shares year-to-date.
 Source: @TheTerminal, Bloomberg Finance L.P.
2. China’s firms have been boosting foreign investment.
 Source: @economics Read full article
3. This chart illustrates China’s credit growth shift from real estate to the industrial sector.
 Source: @JeffreyKleintop
Back to Index
Emerging Markets
1. Chiles’ trade surplus surprised to the upside, …

… on strong exports.

• The nation’s wage growth is moderating.

——————–
2. Mexican vehicle production hit a record high.

• Consumer sentiment remains strong.

——————–
3. The Philippine trade deficit narrowed as imports declined.

Back to Index
Commodities
1. China’s currency depreciation typically occurs alongside a rise in gold prices.
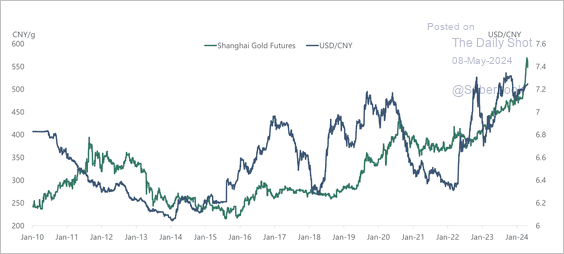 Source: Torsten Slok, Apollo
• Gold trading volumes on the Shanghai futures exchange spiked.
 Source: Torsten Slok, Apollo
——————–
2. Options markets are underestimating the upside for industrial commodities on 6-12 month holdings.
 Source: Numera Analytics (@NumeraAnalytics)
3. The correlation between stocks and commodities has been positive since the GFC. That hasn’t been the case for fixed income.
 Source: Wells Fargo Investment Institute
Back to Index
Energy
1. Brent crude dipped below $83/bbl.

2. US prices at the pump are heading lower.
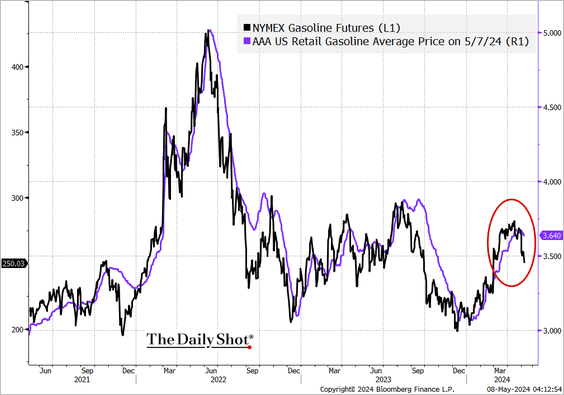 Source: @TheTerminal, Bloomberg Finance L.P.
3. Most of China’s oil demand increase over the past few years was driven by petrochemicals consumption.
 Source: Longview Economics
4. Australia is exporting more coal to China.
 Source: Fitch Solutions Macro Research
Back to Index
Equities
1. The ability of US firms to maintain strong margins continues to exceed expectations.
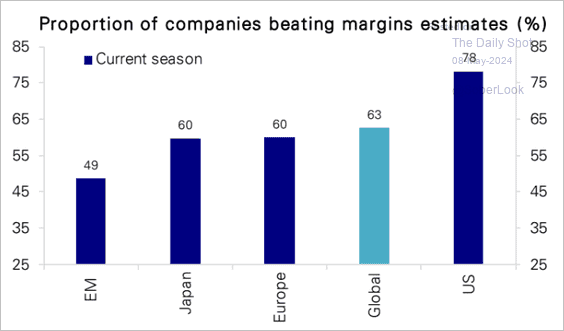 Source: Deutsche Bank Research
2. Flows into US tech funds persist.
 Source: Deutsche Bank Research
3. Goldman expects share buybacks to accelerate.
 Source: @markets Read full article
However, companies known for share buybacks have underperformed sharply in recent weeks.

• Dividend growers have also been underperforming.

• Here is the total GS Cash Return Index (companies buying back shares and/or paying above-average dividends).

——————–
4. The improving macro backdrop could keep the global stock/bond ratio uptrend intact.
 Source: MRB Partners
5. Is the market frontloading the anticipated start of the easing cycle, given the fact that the first Fed rate cut is still months away?
 Source: Oxford Economics
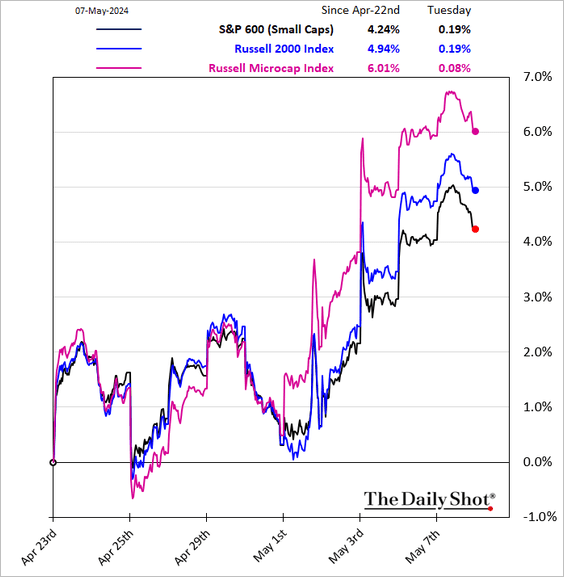
6. Microcaps have outperformed in recent days.
7. This chart shows the percentage of members in each S&P 500 sector that are above their 200-day moving average.

8. VVIX, an implied volatility index based on VIX options (volatility of volatility), is at multi-year lows. This indicates subdued demand for VIX call options, which are typically used to bet on or hedge against significant market declines.

Back to Index
Credit
1. US and European high-yield financing costs are set to rise further.
 Source: Deutsche Bank Research
Although investment-grade companies also face increasing financing costs (chart below), the impact may be delayed due to their longer debt maturities.

——————–
2. Tight credit standards on business loans point to wider high-yield spreads.
 Source: Simon White, Bloomberg Markets Live Blog
3. Investment-grade spreads are now at multi-year lows relative to yields.
 h/t James Crombie, Bloomberg
——————–
Food for Thought
1. Composition and revenue distribution of US small businesses by employee count:
 Source: Pew Research Center Read full article
2. Wealth growth trends by age group in the US since the pandemic’s start:
 Source: Center for American Progress Read full article
3. Comparative trends in disability-adjusted life years lost in major countries:
 Source: Goldman Sachs
4. Texas solar capacity additions:
 Source: @EIAgov Read full article
5. Gender disparity in workplace culture perception based on Glassdoor reviews:
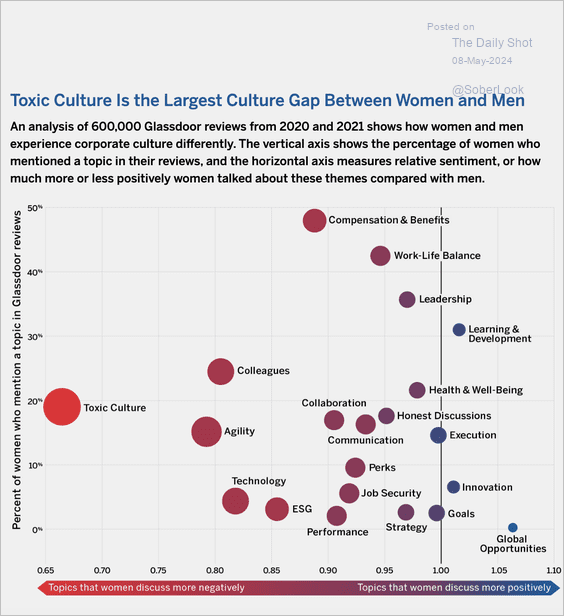 Source: MIT Sloan School of Management Read full article
6. Compensation growth in government and private sectors:
 Source: @jonathanjlevin, @opinion Read full article
7. Leading nail art trends on social media in 2024:
 Source: Fresha
——————–
Back to Index